Income and Income Inequality among Indian Rural Households
24
Income and Income Inequality among Indian Rural Households THIAGU RANGANATHAN 1 , AMARNATH TRIPATHI 2 , BISLA RAJORIYA 3 This chapter analyses the changes in sources of income and income inequality of rural households using the Indian Human Development Survey (Data) of 2004-05 and 2011-12. We find that nominal incomes increased by 177% during the period. Income from agricultural labour, business and cultivation increased moderately by 117%, 132% and 152% respectively while income from casual labour and remittances grew by 237% and 528% respectively. Consequently, the average shares of agricultural labour incomes and cultivation income decreased from 35% and 11% to 33% and 9% respectively. The same for casual labour and remittance increased from 11% and 3% to 14% and 6% respectively. In 2011-12, 35% households were involved in agricultural labour compared to 40% in 2004-05. Also, proportion of households earning from casual labour and remittances increased from 28% and 6% in 2004-05 to 47% and 18% respectively in 2011-12. The share of casual labour increased more than that of remittances among SCs, STs, households with highest adult education as primary to higher secondary and landless households with salaried income. The share of remittances went up higher than casual labour for Brahmins, Forward Caste, OBCs, illiterate, above higher secondary, landless labourers, absentee lessors and all those who possessed land. Among sources of income inequality, we find remittances as the only income source which increased its share in income, decreased its gini and was favourable to lower quintiles. This made remittances more inequality decreasing in 2011-12 as compared to 2004-05 with an elasticity of gini to share of remittances at -1.2%. Key Words: Income Sources, Income Inequality, Gini Decomposition, Indian Human Development Survey (IHDS), Remittances. 1 Assistant Professor, Agricultural Economics Research Unit (AERU), Institute of Economic Growth (IEG), New Delhi. E-mail: [email protected] 2 Assistant Professor, Agricultural Economics Research Unit (AERU), Institute of Economic Growth (IEG), New Delhi. E-mail: [email protected] 3 Research Analyst, Institute of Economic Growth (IEG), New Delhi. E-mail: [email protected]
Transcript of Income and Income Inequality among Indian Rural Households

Income and Income Inequality among Indian Rural Households
THIAGU RANGANATHAN1, AMARNATH TRIPATHI2, BISLA RAJORIYA3
This chapter analyses the changes in sources of income and income inequality of rural
households using the Indian Human Development Survey (Data) of 2004-05 and 2011-12.
We find that nominal incomes increased by 177% during the period. Income from
agricultural labour, business and cultivation increased moderately by 117%, 132% and 152%
respectively while income from casual labour and remittances grew by 237% and 528%
respectively. Consequently, the average shares of agricultural labour incomes and cultivation
income decreased from 35% and 11% to 33% and 9% respectively. The same for casual
labour and remittance increased from 11% and 3% to 14% and 6% respectively. In 2011-12,
35% households were involved in agricultural labour compared to 40% in 2004-05. Also,
proportion of households earning from casual labour and remittances increased from 28% and
6% in 2004-05 to 47% and 18% respectively in 2011-12. The share of casual labour increased
more than that of remittances among SCs, STs, households with highest adult education as
primary to higher secondary and landless households with salaried income. The share of
remittances went up higher than casual labour for Brahmins, Forward Caste, OBCs, illiterate,
above higher secondary, landless labourers, absentee lessors and all those who possessed
land. Among sources of income inequality, we find remittances as the only income source
which increased its share in income, decreased its gini and was favourable to lower quintiles.
This made remittances more inequality decreasing in 2011-12 as compared to 2004-05 with
an elasticity of gini to share of remittances at -1.2%.
Key Words: Income Sources, Income Inequality, Gini Decomposition, Indian Human
Development Survey (IHDS), Remittances.
1 Assistant Professor, Agricultural Economics Research Unit (AERU), Institute of Economic Growth (IEG),
New Delhi. E-mail: [email protected]
2Assistant Professor, Agricultural Economics Research Unit (AERU), Institute of Economic Growth (IEG), New
Delhi. E-mail: [email protected]
3 Research Analyst, Institute of Economic Growth (IEG), New Delhi. E-mail: [email protected]

1. Introduction
Rural households earn their incomes from various sources including cultivation, livestock,
agricultural wage labour and other non-farm occupations. Apart from cultivation which is
considered the mainstay of Indian rural household income, livestock and agricultural labour
income supplement the incomes of households wholly dependent on farm based activities. As
economies grow and diversify into various non-farm activities, rural households also earn a
larger chunk of their incomes from non-farm casual labour, migration to other rural or urban
areas and from salary based activities. The participation of rural households in non-farm
activities could be either due to “push” factors (e.g. risk reduction, land constraints, response
to a crisis) and/or “pull” factors (eg. complementarities with existing income activities, higher
profitability of the activities) (Barrett, Reardon and Webb, 2001). Various factors like
education, skills, caste, religion, asset ownership, household size, and credit availability
influence the decision of a household to participate and also decide on the extent of
participation in a particular non-farm activity ( Srivastav and Dubey, 2002; Chadha and Sahu,
2002; Reardon et al., 2007; Jatav, 2010; Jatav and Sen, 2013). Understanding the relation
between participation in rural non-farm sector and well-being of a household and relation
between non-farm sector expansion and macro-economic indicators is of vital importance.
Recent trends of a ‘stunted’ structural transformation in the Indian economy where the
decrease in agriculture’s share in GDP has not been accompanied by subsequent accelerated
growth of labour intensive manufacturing (Binswanger-Mkhize, 2013) has made
understanding of rural nonfarm sector extremely pertinent. Members of rural households also
migrate to other rural or urban areas for employment and the internal remittances also
become an important source of income for rural households. This migration could also be
distress driven or driven by the good opportunities provided in the other areas. In summary, a
growing economy with a not so fast growing manufacturing sector might see a high level of
income diversification among rural households. This is what we expect to see among rural
household in India during the study period of 2004-05 to 2011-12. The chapter explores
issues related to dynamics of income diversification of rural households. The extent of
incomes that households generate from farm based activities like their own cultivation and
agricultural labour and those from nonfarm casual labour, migration and salaried employment
are explored during the period from 2004-05 to 2011-12 using a panel data.
There has been a notable change in sources of income among Indian rural households over
the past few decades. The predominance of agriculture-based activities in total income has

reduced in terms of employment and share of income. Participation of rural households in
non-farm sector has expanded greatly over the last two decades or so (Coppard, 2001;
Srivastav and Dubey, 2002; Bhalla, 2002; Bhaumik, 2002; Chadha, 2002; Sahu, 2003).
Particularly, in the decade spanning 1993-94 to 2004-05, non-farm employment in rural India
grew rapidly than farm employment (Kashyap and Mehta, 2007; Abraham, 2009; Jatav,
2010; Chowdhury, 2011; Himanshu et al., 2013). In this period, 60% of the 56 million rural
jobs that were created were in the non-farm sector. The share of non-farm income in the total
income of rural households has also become substantial during this period. Studies estimate
that farm households earn 46% of their incomes from non-farm activities and rural
households earn 48% of their income from non-farm activities (Himanshu et al., 2013). For
rural India, this figure was estimated to be around 35% in the year 1993-94 (Lanjouw and
Shariff, 2004; Reardon et al., 2007)
This increased diversification of income generating activities could be seen as an indicator of
expanding economic opportunities and thus expected to help in reduction of poverty and
inequality. Income from agriculture is largely related to land ownership and since land
distribution is highly unequal in India, we would expect this income to be highly unequal. So,
an expansion to nonfarm sector could pave way for reducing income inequality. But, this may
not always be true as the accessibility to non-farm opportunities are far from universal
(Reardon et al., 2000; Kundu et al., 2003; Jatav, 2010). If profitable non-farm opportunities
end up being exploited largely by the already well-off or elite in the population, we could see
an increase in inequality due to expansion of non-farm sector. Given such contradictory
possibilities, there might also be other factors that might explain the linkage between non-
farm sector expansion and income inequality of rural households. For instance, unequal
access to non-farm economic opportunities is sometimes exacerbated by social factors like
caste and religion. These factors would put constraints other than economic factors like credit
and assets for a particular section of people in pursuing opportunities in the non-farm sector.
There have been some recent studies though which seem to suggest that social factors are
affecting occupational mobility lesser than before (Kapur et al., 2010; Himanshu et al., 2013).
Different sources of income could also contribute to inequality differently over time. For
example, with time the nonfarm sector could employ people who were excluded previously
and as they also earn incomes, it might contribute to decreasing of income inequality over
time. But, there has been no detailed study into looking at the dynamics of sources of income
inequality in Indian context and this chapter attempts to do that.

2. Data and Methodology
Study of income inequality and its composition has largely been of two types. On the one
hand, there have been studies that have looked at influence of population subgroups defined
by age land ownership, caste, religion, education, etc. These studies look into the impact of
these characteristics of population on the resulting inequality in the economy. There has been
wide interest in such studies and they have largely been pursued using regression based
approaches (a few examples would involve Oaxaca, 1973; Bourgignon et al., 1998; Fields,
2003). Another area of inequality studies which is of larger importance to our current pursuit
involves studying the impact of different components of income on inequality. Here, the
question is concerned with how a particular income source (say income from livestock,
migration or investment income) affects the overall income inequality. Here, the most
commonly used methodologies involve decomposition techniques. Some of the studies
integrate regression based approaches with decomposition techniques to analyze the role of
population characteristics in affecting inequality (eg. Morduch and Sicular (2002)). For our
current purposes, where we intend to study the impact of different sources of income on
income inequality, we use a decomposition based approach in the tradition of Shorrocks
(1982). We first analyze income diversification strategies of rural households using a large
scale nationally representative data. We first look into the different diversification strategies
of different population groups defined by caste, education, land holding and landholding
classes.
After analysing the income diversification strategies, we look at dynamics of different
income sources over the period 2004-05 and 2011-12. We look into how the income source
shift has happened among the rural households. Then we perform an interquintile analysis to
analyse the sources of inequality. To identify the changes in sources of rural income
inequality, we then decompose the contribution of different income sources to overall income
inequality using a Gini coefficient decomposition analysis method for the two years 2004-05
and 2011-12.
Gini coefficient is the most widely used statistic in estimating income inequality and it varies
between 0 and 1 with 0 indicating perfect equality and 1 indication very high income
inequality where only one person gets all the income. Though theoretically possible, none of
the countries in the world have values near to the extremes. Typically, Gini coefficients of
income and consumption in the range of 0.3 to 0.35 are considered to be present in egalitarian

societies and values exceeding 0.4 are considered inegalitarian (World Bank, 2015). This
Gini coefficient of total income is then further decomposed using a method proposed by
Lerman and Yitzhaki (1985). The total income is derived from different sources which we
categorize as follows – income from cultivation and livestock (own-farm income), income
from agricultural labour (agricultural wages), income from casual labour (nonfarm labour),
salaried employment (salary) and employment in businesses (business) and income from rent,
pensions, scholarships and welfare benefits from Government (other income). Each of these
sources will generate inequality. Typically, these individual inequalities would be higher
owing to the fact that not all of the households derive income from each of these sources.
The share of each of these sources in total income and the correlation between the source
income and total income is used to decompose the Gini coefficient as follows:
1
[ / ] [2 ( , ) / ] [ ( , ) / ( , )]K
k k k k k k kk
G m m Cov y F m Cov y F Cov y F
... (2.1)
1
K
k k kk
G S G R
... (2.2)
Where G is the Gini coefficient of total income inequality and kG is the Gini coefficient
indicating the inequality in incomes from source k , m is the mean income of the population,
km is the mean income from income source k , ( , )k kCov y F is the covariance between
income component k and its cumulative distribution, ( , )kCov y F is the covariance between
income component k and cumulative distribution of the total income, kS is then the measure
of component 'k s share in total income and kR is the “Gini correlation” between income
component k and total income. This decomposition provides three important statistics of
relevance - kS , which suggests how high the share of a particular income component is in
total income; kG , which suggests how equally/unequally a particular income component is
distributed and kR , which suggest how much a particular income component and total
income distribution are correlated. All these three are important for an understanding of
income inequality of rural households. Just because a particular income component (say wage
income) forms a high share of total income, it may not influence inequality in a particular
way. If it is equally distributed and also has no correlation with the distribution of total
income, it might not have any say in the final income inequality of the population. Similarly,

an income component which is very unequally distributed might not necessarily have a bad
impact on total income distribution of the population. It might so happen that the share of it in
the total income is quite less and also is negatively or not correlated with the total income
distribution.
As we observe, only by having an idea of the three factors for each income component will
we be able to say whether a particular income component has an inequality increasing or
inequality decreasing effect on the population. Lerman and Yitzhaki (1985) further estimate
the effect of small changes in a particular income source on inequality, holding income from
all other sources constant. They derive the percent change in inequality resulting from small
percent change in income from source k as follows:
k k kk
S G RG eS
G G
...(2.3)
Where G e is the change in Gini coefficient to a marginal percentage change (eclose to 1)
in income source k .
We use the above two formulations – decomposing income inequality and estimating
marginal effects on income inequality for the two years and identify the changing sources of
income inequality among rural households. From the decomposition analysis, we estimate the
share of different income sources in total income, the inequalities within different income
sources and Gini correlation between different income source distribution and total income
distribution. From the marginal analysis, we estimate the impact of percentage change in any
income source on Gini coefficient of total income. This will tell us whether expansion in any
income source is inequality increasing or inequality decreasing. Also, we decompose
inequalities within the nonfarm incomes based on employment types. This will provide us
with the structure of inequality in the nonfarm sector. This analysis is done for the period of
2004-05 and 2011-12 and the changes in these two periods are observed. The changes will
provide an indication of whether a particular income source has become more inequality
increasing or more inequality decreasing. This also changes with time and understanding
these dynamics is also crucial. For instance, the relation between non-farm sector expansion
and inequality might not be static and the dynamics of the relationship might be dependent on
the stage of the non-farm sector expansion in the rural areas. For the economy as a whole
Kuznets (1955, 1963) had suggested that as the economy moves towards more modern
sectors, inequality will initially increase as the modern sectors would initially benefit the elite

but gradually over time, will start benefiting the lower strata as well resulting in reduced
inequality. Himanshu et al. (2013) suggest that this kind of an inverted U-curve could be
observable even in the rural economy as well and non-farm sector expansion might initially
have an inequality-increasing tendency. All these aspects need to be explored while studying
the linkage between different sources of income and income inequality.
We use the data collected from two rounds of Indian Human Development Survey (IHDS)
conducted in 2004-05 and 2011-12. The survey is a large scale nationally representative and
was conducted under the supervision of National Council of Applied Economic Research
(NCAER) in collaboration with University of Maryland. The detailed methodology of the
two rounds of survey, along with some summary information and preliminary findings, could
be obtained from Desai et al. (2010) and Desai et al. (2015). We present a brief note on the
survey here. The survey covers almost all the states and union territories of India except
Andaman and Nicobar and Lakshadweep. The survey used two-stage stratification and was
conducted over a sample of 27010 rural households (from 1503 villages) and 13126 urban
households (over 971 urban blocks) in 2004-05. In the year 2011-12, the survey team re-
interviewed around 83% of the households as well as split households (if located within the
same village or town). It also selected an additional replacement sample of 2134 households
in this round. Totally, the 2011-12 survey was conducted among 42,152 households. For the
purpose of our analysis, we use only those rural households which were surveyed in both
2004-05 and 2011-12. There were household that were split after 2004-05 and the split
households in the same villages were resurveyed in 2011-12. Since the survey did not
mention whether there were households that were split and not in the same village, we did not
include any of the split households for our analysis. In all, there were 19,831 households that
fit the above criteria and they have been included for the purpose of our analysis.
The survey has collected data related to various social, economic and political aspects. The
survey has data related to income from different sources for all the households. It has various
unique modules which collect data on education, health, occupation, economic status,
marriage, fertility, gender relations, and social capital. It also collects information on income
from various sources for every household. In particular, information is collected on
household’s income from cultivation, livestock, agricultural wages, non-agricultural wages,
salaried employment, businesses, sale or rent of agricultural property, remittances, sale of
property and welfare benefits. We include incomes from cultivation, livestock and lease of
agricultural property as income from own-farm activities. We consider agricultural wages

which are obtained from agricultural labour in other farms separately as agricultural labour
income. Income from wages in non-agricultural activities, remittances, businesses and
salaried employment are considered as different sources of income. Income from rent of
property, pension, scholarship and welfare benefits (like old age pension, widow pension,
maternity benefits, disability schemes, Annapurna, income support other than NREGA and
assistance from NGOs/charities) are combined as other income for the purposes of our
analysis. There were two other facets of income that needed attention in our analysis. The net
income from cultivation, livestock and nonfarm business activities could be negative and
because of that some of the households had a total income that was negative. When
calculating the shares of a particular income source in total income, these estimates biased the
average shares. For instance, if the household earned a net negative income of INR 45,000 in
cultivation and earned INR 36,000 from other income sources, the total income of the
household income turns out to be negative INR 9,000. If share of agricultural income is
calculated for such household, it comes out to 500%. Such estimates were inducing a bias in
the average share of agricultural income in the household. To avoid such biases, we have
only considered households with positive incomes when analysing the shares of different
income sources in total income. Since there were a significant number of households with
negative incomes, this analysis is somewhat limited. The negative income households will
have to be analysed separately to understand their diversification patterns. We also find that
there were more than 40% of the rural households that did not possess any land. The
diversification patterns of such households differed largely from households that had any
kind of land. We have tried to separate analysis for these two types of households in
appropriate places.
3. Changes in Incomes of Rural Households
As mentioned previously, we considered seven different income sources of rural households
for our analysis. The distribution of the incomes from these different sources and total
incomes for the years 2004-05 and 2011-12 are presented in the table 3.1 below.
Table 3.1. Incomes of Rural Households 2004-05 and 2011-12
Source of Income
2004-05 2011-12 Changes
Average(1)
Standard Deviation(2)
Coefficient of Variation(3)
Average(4)
Standard Deviation(5)
Coefficient of Variation(6)
CAGR (7) = ((4)/(1))^1/7-1
Average (8) = ((4)-(1))/(1)%
Standard Deviation(9) = ((5)-(2))/(2)%
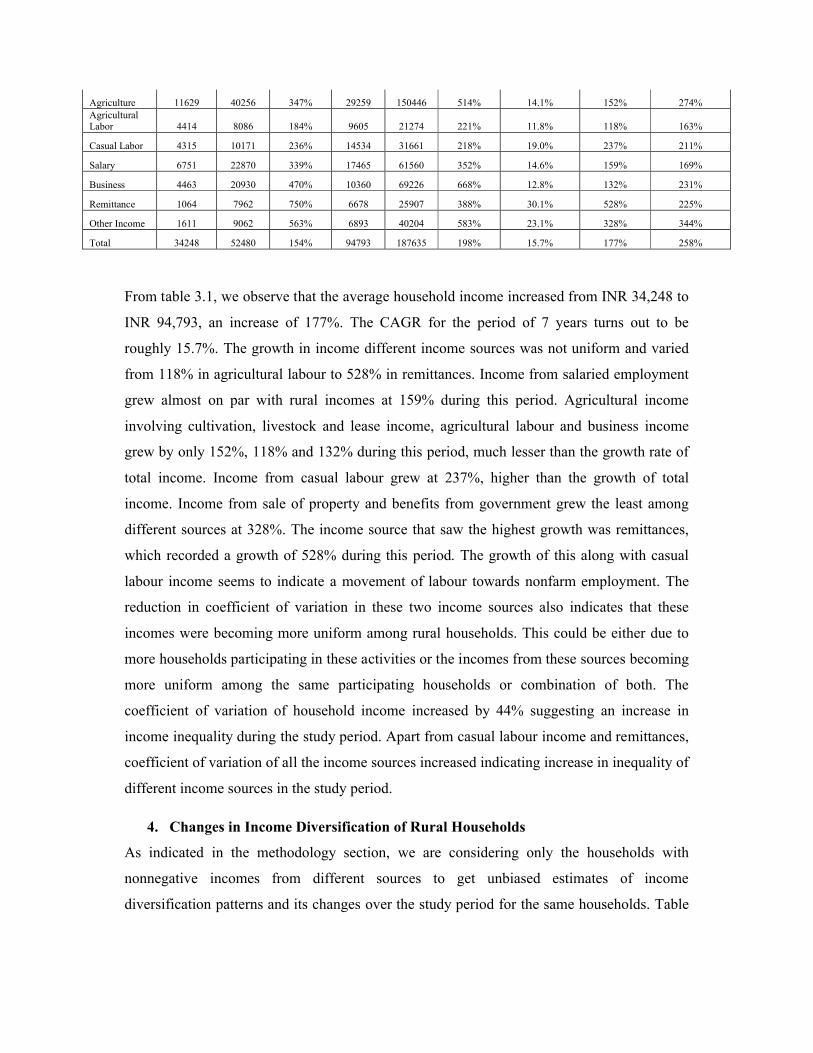
Agriculture 11629 40256 347% 29259 150446 514% 14.1% 152% 274%Agricultural Labor 4414 8086 184% 9605 21274 221% 11.8% 118% 163%
Casual Labor 4315 10171 236% 14534 31661 218% 19.0% 237% 211%
Salary 6751 22870 339% 17465 61560 352% 14.6% 159% 169%
Business 4463 20930 470% 10360 69226 668% 12.8% 132% 231%
Remittance 1064 7962 750% 6678 25907 388% 30.1% 528% 225%
Other Income 1611 9062 563% 6893 40204 583% 23.1% 328% 344%
Total 34248 52480 154% 94793 187635 198% 15.7% 177% 258%
From table 3.1, we observe that the average household income increased from INR 34,248 to
INR 94,793, an increase of 177%. The CAGR for the period of 7 years turns out to be
roughly 15.7%. The growth in income different income sources was not uniform and varied
from 118% in agricultural labour to 528% in remittances. Income from salaried employment
grew almost on par with rural incomes at 159% during this period. Agricultural income
involving cultivation, livestock and lease income, agricultural labour and business income
grew by only 152%, 118% and 132% during this period, much lesser than the growth rate of
total income. Income from casual labour grew at 237%, higher than the growth of total
income. Income from sale of property and benefits from government grew the least among
different sources at 328%. The income source that saw the highest growth was remittances,
which recorded a growth of 528% during this period. The growth of this along with casual
labour income seems to indicate a movement of labour towards nonfarm employment. The
reduction in coefficient of variation in these two income sources also indicates that these
incomes were becoming more uniform among rural households. This could be either due to
more households participating in these activities or the incomes from these sources becoming
more uniform among the same participating households or combination of both. The
coefficient of variation of household income increased by 44% suggesting an increase in
income inequality during the study period. Apart from casual labour income and remittances,
coefficient of variation of all the income sources increased indicating increase in inequality of
different income sources in the study period.
4. Changes in Income Diversification of Rural Households
As indicated in the methodology section, we are considering only the households with
nonnegative incomes from different sources to get unbiased estimates of income
diversification patterns and its changes over the study period for the same households. Table

4.1. provides the average shares of different income sources for different income quintiles of
the rural households.
Table 4.1. Income Diversification Dynamics
2004-05 2011-12 Changes
Agriculture 32.9% 29.6% -3.2%
Agricultural Labor 22.1% 16.0% -6.1%
Casual Labor 17.0% 20.1% 3.1%
Salary 11.6% 11.3% -0.3%
Business 9.8% 8.0% -1.8%
Remittance 2.8% 7.7% 4.9%
Other Income 3.9% 7.2% 3.3%
As table 4.1 indicates, agriculture is the dominant source of income for rural households in
both 2004-05 and 2011-12. In 2004-05, the household earned an average of 32.9% from
agriculture (cultivation, livestock and lease rent) while in 2011-12 they earned an average of
only 29.6%. The same was the case with agricultural labour incomes. The average share of
agricultural labour income in total income reduced from 22.1% in 2004-05 to 16% in 2011-
12 a reduction of 6.1%. The shares in total income increased for casual labour income and
remittances from 2004-05 to 2011-12. The average share of casual labour income increased
from 17% in 2004-05 to 20.1% in 2011-12. This meant that casual labour income became the
second highest important income source after cultivation in 2011-12 as compared to
agricultural labour in 2004-05. The other important income source which has shown a high
increase is that of remittances earned from migration to other rural and urban areas. As
compared to 2004-05 in which household earned 2.8% of their household income on average,
the households earned 7.7% of their household incomes on average from remittances in 2011-
12.
The changes observed could be due to various reasons. It could be due to households opting
out of a particular activity or give lesser time to a particular activity or reduced wages or
returns from the particular activity. Table 4.2 provides the changing dependency on different
income sources for the households in the surveys. It shows the percentage of people earning
any income from a particular source of income in 2004-05 and 2011-12.
Table 4.2 Changing Dependency on Different Income Sources

Source of Income
Households Earning Income from Source
2004-05 2011-12 Change
Agriculture 71.5% 73.6% 2.1%
Agricultural Labour 40.4% 35.4% -5.0%
Casual Labour 28.2% 46.6% 18.4%
Salary 17.6% 19.1% 1.5%
Business 16.6% 15.3% -1.3%
Remittance 6.2% 17.7% 11.5%
Other 22.1% 46.9% 24.8%
From the table 4.2, we observe that the number of households earning from agriculture
increased from 2004-05 to 2011-12. But as we observed in table 3.1 and table 4.1, income
from agriculture grew at a slower rate than total income and also the share of income from
agriculture in total income also reduced. This would imply that households are not exiting
from agriculture, but either they are providing lesser inputs (land, labour time, operating
inputs, etc.,) to agriculture or return/profitability from agriculture reduced during this period
or a combination of both.
We also observe that around 5% more households did not earn anything from agricultural
labour in 2011-12 as compared to 2004-05. This would mean that more households exited
from agricultural labour. This could be one of the reasons for slower growth of agricultural
labour income and reducing share of agricultural labour income in total income of rural
households. We also find that around 18.4% more households in 2011-12 started earning
from casual labour as compared to 2004-05. 11.5% more households in 2011-12 started
earning from remittances as compared to 2004-05. So, we observe lesser households earning
from agricultural labour and more households earning from casual labour and remittances.
Another way to understand this dynamics is by looking at the changes in the main income
sources of the households. By main income source, the survey identified that source from
which the household earns the maximum. If two sources contributed to the highest income,
then the activity with more number of people in the household involved was used to
determine the main income source. Based on these criteria, the households were classified as
having one of the eleven main income sources – cultivation, allied agricultural activities,
agricultural labour, casual labour, artisan, petty trade, organised business, salaried
employment, professional services, pension/rent and others. We reduced these eleven
categories to six of the categories of our study as remittances were not mentioned as a main
income source in the questionnaire. Based on this, the classification of households in 2004-
05, 2011-12 and changes is mentioned in table 4.3.
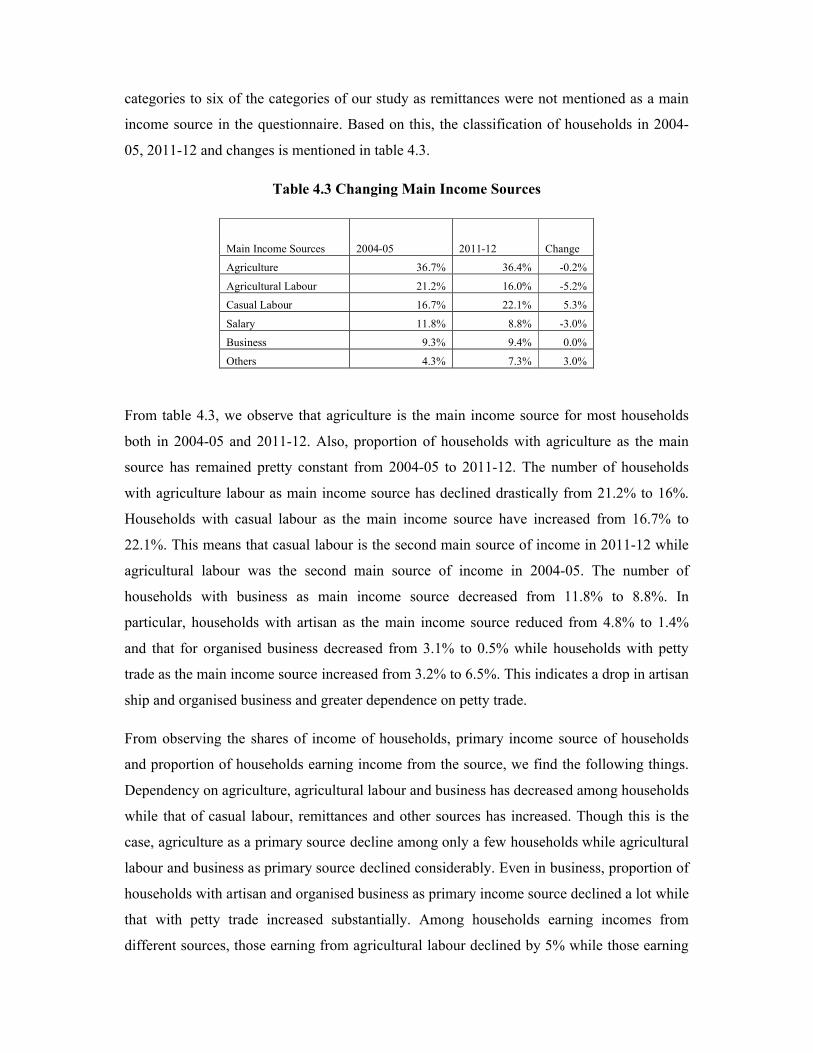
Table 4.3 Changing Main Income Sources
Main Income Sources 2004-05 2011-12 Change
Agriculture 36.7% 36.4% -0.2%
Agricultural Labour 21.2% 16.0% -5.2%
Casual Labour 16.7% 22.1% 5.3%
Salary 11.8% 8.8% -3.0%
Business 9.3% 9.4% 0.0%
Others 4.3% 7.3% 3.0%
From table 4.3, we observe that agriculture is the main income source for most households
both in 2004-05 and 2011-12. Also, proportion of households with agriculture as the main
source has remained pretty constant from 2004-05 to 2011-12. The number of households
with agriculture labour as main income source has declined drastically from 21.2% to 16%.
Households with casual labour as the main income source have increased from 16.7% to
22.1%. This means that casual labour is the second main source of income in 2011-12 while
agricultural labour was the second main source of income in 2004-05. The number of
households with business as main income source decreased from 11.8% to 8.8%. In
particular, households with artisan as the main income source reduced from 4.8% to 1.4%
and that for organised business decreased from 3.1% to 0.5% while households with petty
trade as the main income source increased from 3.2% to 6.5%. This indicates a drop in artisan
ship and organised business and greater dependence on petty trade.
From observing the shares of income of households, primary income source of households
and proportion of households earning income from the source, we find the following things.
Dependency on agriculture, agricultural labour and business has decreased among households
while that of casual labour, remittances and other sources has increased. Though this is the
case, agriculture as a primary source decline among only a few households while agricultural
labour and business as primary source declined considerably. Even in business, proportion of
households with artisan and organised business as primary income source declined a lot while
that with petty trade increased substantially. Among households earning incomes from
different sources, those earning from agricultural labour declined by 5% while those earning

from casual labour and remittances increased by 18.4% and 11.5% respectively. All this
indicates a shift away from agriculture, agricultural labour and business towards casual
labour, remittances and other income.
To further understand the changes in these diversification patterns, we categorize the
households based on caste, education, land holding and land holding classes and observe
heterogeneity in these changes. Table 4.4 provides the changes for population belonging to
different caste groups.
Table 4.4 Income Diversification Changes across Different Caste Groups
Brahmin Forward/General (except Brahmin)
Other Backward Castes (OBC)
Scheduled Castes (SC)
Scheduled Tribes (ST) All
Agriculture2004-05 43.4% 43.1% 35.7% 18.1% 29.5% 32.9%2011-12 35.6% 36.7% 32.8% 18.3% 26.1% 29.6%Change -7.8% -6.5% -2.9% 0.2% -3.4% -3.2%
Agricultural Labour2004-05 4.8% 13.4% 19.8% 34.2% 28.2% 22.1%2011-12 2.1% 9.6% 14.3% 25.5% 20.0% 16.0%Change -2.7% -3.7% -5.5% -8.7% -8.3% -6.1%
Casual Labour2004-05 8.0% 11.9% 15.4% 24.2% 20.8% 17.0%2011-12 10.0% 13.8% 18.2% 27.9% 26.2% 20.1%Change 2.0% 1.8% 2.9% 3.6% 5.4% 3.1%
Salary2004-05 18.4% 13.3% 10.6% 11.0% 11.2% 11.6%2011-12 16.8% 13.5% 9.8% 10.6% 12.0% 11.3%Change -1.5% 0.2% -0.8% -0.3% 0.8% -0.3%
Business2004-05 12.4% 10.7% 11.9% 6.2% 6.5% 9.8%2011-12 9.9% 9.6% 9.9% 4.5% 4.8% 8.0%Change -2.5% -1.1% -2.0% -1.8% -1.7% -1.8%
Remittances2004-05 4.6% 3.0% 3.1% 2.7% 1.1% 2.8%2011-12 12.3% 8.7% 8.4% 6.2% 4.8% 7.7%Change 7.7% 5.8% 5.3% 3.5% 3.7% 4.9%
Other2004-05 8.4% 4.6% 3.5% 3.6% 2.7% 3.9%2011-12 13.3% 8.1% 6.6% 7.0% 6.1% 7.2%
Change 4.8% 3.5% 3.1% 3.4% 3.4% 3.3%
The share of agriculture in household income is higher than average for Brahmins, Forward
castes (except Brahmins) and OBC while it is lower for STs and SCs in both the period. The
shares declined in 2011-12 from 2004-05 for all caste groups except SCs. It was significantly
high for Brahmins and Forward Castes (7.8% and 6.5%) while the decline was lesser for STs
and OBCs (3.4% and 2.9%). This share increased marginally (0.2%) for SCs. The share of
agricultural labour was higher than average for SCs and STs while it was lower than average
for other castes in both 2004-05 and 2011-12. This share declined for all the castes in the
study period. The decline was sharp for SCs and STs (8.7% and 8.3%) while it was lesser for
Brahmins, Forward Castes and OBCs (2.7%, 3.7% and 5.5%). The share of casual labour in
income was above average for SCs and STs in both the years and this share increased for all
the castes from 2004-05 to 2011-12. This increase was steeper for SCs and STs compared to

other castes. The salary income’s share was higher than average for Brahmins and Forward
Castes on both the years. This share also remained almost constant for all castes except
Brahmins for whom this registered a slight decline. The decline in business share was also
quite low and was pretty constant across caste groups. The share of remittances registered a
steep increase among Brahmins and Forward Castes and OBCs (7.7%, 5.8% and 5.3%), while
it was lower for SCs and STs (3.5% and 3.7%). In summary, it seems that Brahmins, Forward
Castes and OBCs are shifting their dependency from agriculture towards remittances and SCs
and STs are shifting from agricultural labour to casual labour.
We also classify the households based on highest education acquired by adult (above 21
years). Table 4.5 provides the income diversification across households with different highest
education acquired by any adult.
Table 4.4 Income Diversification Changes across Different Education
IlliterateUpto Primary
Above Primary upto Secondary
Above Secondary upto Higher Secondary
Above Higher Secondary All
Agriculture2004-05 26.1% 31.3% 36.0% 39.9% 39.8% 32.9%2011-12 22.9% 27.4% 31.5% 33.9% 35.3% 29.6%Change -3.2% -4.0% -4.5% -5.9% -4.5% -3.2%
Agricultural Labour
2004-05 33.9% 27.0% 16.9% 8.8% 5.4% 22.1%2011-12 23.4% 19.3% 15.2% 11.4% 5.5% 16.0%Change -10.5% -7.7% -1.7% 2.5% 0.1% -6.1%
Casual Labour2004-05 21.5% 19.8% 16.3% 9.6% 4.7% 17.0%2011-12 23.6% 26.3% 22.0% 14.0% 7.1% 20.1%Change 2.0% 6.5% 5.7% 4.4% 2.4% 3.1%
Salary2004-05 5.4% 6.7% 13.4% 19.9% 28.0% 11.6%2011-12 4.6% 5.5% 10.8% 18.0% 25.3% 11.3%Change -0.9% -1.2% -2.7% -1.9% -2.6% -0.3%
Business2004-05 5.6% 9.8% 11.6% 14.1% 12.4% 9.8%2011-12 4.4% 7.1% 8.7% 10.8% 11.1% 8.0%Change -1.2% -2.7% -2.9% -3.2% -1.3% -1.8%
Remittances2004-05 4.1% 2.3% 2.2% 2.5% 2.2% 2.8%2011-12 12.2% 8.2% 6.1% 5.4% 5.4% 7.7%Change 8.1% 6.0% 3.9% 2.9% 3.3% 4.9%
Other2004-05 3.3% 3.1% 3.5% 5.3% 7.6% 3.9%2011-12 8.9% 6.2% 5.6% 6.5% 10.2% 7.2%Change 5.6% 3.2% 2.1% 1.2% 2.6% 3.3%
From the above table we find that decline in share of agriculture is higher among households
with higher education while decline in share of agricultural labour is predominant among
households that are illiterate or with education lesser than primary education. The increase in
share of casual labour is low for illiterate households and households with an adult having
education above higher secondary. The increase is seen more among households with highest
adult education between primary and higher secondary. The increase in share of remittances
is also predominant in households whose highest adult education is primary or illiterate. So,
we find the illiterate and primary education households moving away from agricultural labour
and moving into casual labour and remittances. The higher educated groups seem to move
away from agriculture into more of casual labour and less into remittances.
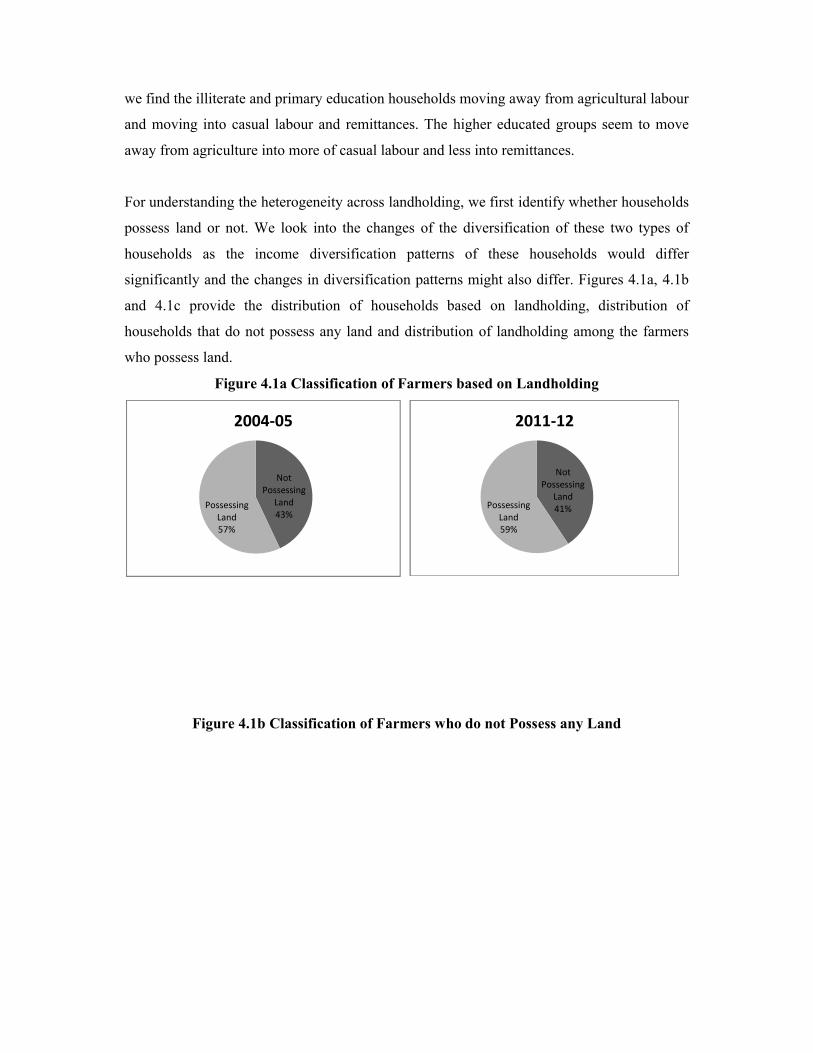
For understanding the heterogeneity across landholding, we first identify whether households
possess land or not. We look into the changes of the diversification of these two types of
households as the income diversification patterns of these households would differ
significantly and the changes in diversification patterns might also differ. Figures 4.1a, 4.1b
and 4.1c provide the distribution of households based on landholding, distribution of
households that do not possess any land and distribution of landholding among the farmers
who possess land.
Figure 4.1a Classification of Farmers based on Landholding
Figure 4.1b Classification of Farmers who do not Possess any Land
Not Possessing
Land43%
Possessing Land57%
2004-05
Not Possessing
Land41%Possessing
Land59%
2011-12

Figure 4.1c Classification of Farmers who Possess any Land
From the above figures, we find that around 43% rural households did not possess any land in
2004-05. This figure went down to 41% in 2011-12. This was due to slight increase in
tenancy in 2011-12. Rural households with no possession of land is a broad category as it
might include not just landless labourers who did not own land at any point of time, but also
those households with members getting employed in salaried jobs and then quitting farming
because of that. As we look into the diversification patterns of this category, we will be able
to understand the heterogeneity in this group. Among the farmers who do not possess any
land, 69% and 67% in 2004-05 and 2011-12 respectively did not earn any income from
salaried employment and we classified these households into landless labourers. 10% of the
households owned land but had leased out all of their land. 21% and 23% of households in
2004-05 and 2011-12 respectively were landless but had some income from salaried
Landless Labour
69%
Absentee Lessor10%
Landless Salaried
21%
2004-05
Landless Labour
67%
Absentee Lessor10%
Landless Salaried
23%
2011-12
Marginal61%
Small 22%
Semi Medium
11%
Medium5%
Large1%
2004-05
Marginal65%
Small 21%
Semi Medium
9%
Medium4%
Large1%
2011-12

employment. Among those who possessed land 83% and 86% in 2004-05 and 2011-12
repsectively had a land less than 2 hectares.
Table 4.5 provide the details of income diversification dynamics among the households
which do not possess any land in 2004-05 and 2011-12
Table 4.5 Income Diversification Dynamics among Households which do not Possess any Land
Landless Labour
Absentee Lessor
Landless Salaried
All Landless All
Agriculture2004-05 4.4% 41.2% 2.6% 8.3% 32.9%2011-12 3.8% 31.9% 1.8% 6.6% 29.6%Change -0.6% -9.3% -0.9% -1.6% -3.2%
Agricultural Labour
2004-05 40.4% 11.1% 10.0% 30.3% 22.1%2011-12 29.5% 6.3% 7.6% 22.2% 16.0%Change -11.0% -4.8% -2.4% -8.1% -6.1%
Casual Labour
2004-05 31.3% 9.3% 6.6% 23.3% 17.0%2011-12 34.3% 8.7% 11.1% 26.3% 20.1%Change 3.0% -0.6% 4.5% 3.1% 3.1%
Salary2004-05 0.0% 12.6% 74.0% 17.6% 11.6%2011-12 0.0% 12.4% 67.5% 17.1% 11.3%Change 0.0% -0.2% -6.5% -0.5% -0.3%
Business2004-05 16.4% 14.1% 4.1% 13.5% 9.8%2011-12 13.5% 11.7% 4.4% 11.8% 8.0%Change -2.9% -2.4% 0.3% -1.7% -1.8%
Remittances2004-05 3.5% 5.5% 0.6% 2.7% 2.8%2011-12 9.8% 13.2% 2.7% 7.2% 7.7%Change 6.3% 7.6% 2.1% 4.4% 4.9%
Other2004-05 4.0% 6.1% 2.2% 4.4% 3.9%2011-12 9.3% 15.9% 5.0% 8.8% 7.2%Change 5.3% 9.8% 2.9% 4.4% 3.3%
From table 4.5, we observe that the share of agriculture income in total income has declined
for absentee lessors, the share of agricultural labour has declined for landless labour and that
of salaried income has declined for the landless salaried group. Casual labour’s share in
income increased for the landless labourers and salaried landless households while
remittance’s share in income increased for landless labourers and absentee lessors. The share
of agriculture for the landless as a group declined lesser compared to all households (1.6% as
compared to 3.2%). Agricultural labour’s share declined by 8.1% for this group compared to
6.1% for the whole population. Share of salary and business declined similarly for the
landless as well as the whole population. The increase in remittance’s share was slightly
lower for the landless group compared to those households which possess any land.
Table 4.6 below provides the changes in diversification strategies of those rural households
which possess land.

Table 4.6 Income Diversification Dynamics among Households which Possess Land
Marginal SmallSemi-
Medium Medium LargeAll
Landed All
Agriculture2004-05 43.1% 60.8% 72.1% 81.9% 81.6% 53.6% 32.9%2011-12 36.1% 57.4% 67.7% 76.0% 70.5% 46.1% 29.6%Change -7.0% -3.3% -4.4% -5.9% -11.1% -7.5% -3.2%
Agricultural Labour
2004-05 18.9% 11.3% 6.3% 1.9% 3.2% 14.1% 22.1%2011-12 13.9% 10.3% 4.9% 2.1% 4.0% 11.2% 16.0%Change -5.0% -1.0% -1.4% 0.2% 0.8% -2.9% -6.1%
Casual Labour
2004-05 14.7% 7.8% 4.4% 3.3% 4.6% 10.9% 17.0%2011-12 20.2% 8.9% 5.5% 3.9% 2.3% 14.7% 20.1%Change 5.5% 1.0% 1.1% 0.6% -2.3% 3.8% 3.1%
Salary2004-05 8.7% 7.9% 7.1% 5.0% 4.7% 9.3% 11.6%2011-12 9.5% 7.7% 7.0% 4.9% 3.6% 9.5% 11.3%Change 0.8% -0.1% -0.1% 0.0% -1.1% 0.2% -0.3%
Business2004-05 7.5% 6.2% 4.9% 3.9% 4.1% 5.9% 9.8%2011-12 6.0% 4.5% 5.2% 6.6% 10.1% 6.1% 8.0%Change -1.5% -1.7% 0.4% 2.7% 6.0% 0.1% -1.8%
Remittances2004-05 3.0% 1.9% 2.2% 1.3% 0.8% 2.3% 2.8%2011-12 8.3% 4.8% 4.4% 3.9% 2.1% 6.8% 7.7%Change 5.3% 2.9% 2.2% 2.6% 1.2% 4.5% 4.9%
Other2004-05 4.1% 4.1% 3.0% 2.7% 1.1% 3.8% 3.9%2011-12 5.9% 6.4% 5.3% 2.6% 7.5% 5.6% 7.2%Change 1.8% 2.3% 2.2% -0.1% 6.4% 1.7% 3.3%
Among those households which possessed land, share of agriculture in total income
decreased the most for large farmers. The share of agricultural labour income reduced most
for marginal farmers. The share of casual labour increased the most for marginal farmers.
Business income as a share of total income increased for medium and large farmers.
Remittances as a share of income increased most among marginal farmers. Other income
which included rental income and government benefits increased the most for large farmers.
5. Changes in Income Inequality and its Sources
In the previous section, we analysed the changes in sources of income among rural
households in India. We also looked at heterogeneity in these changes among different social
groups. Now, we will analyse the changes in sources of income inequality among rural
households using inter-quintile analysis and gini decomposition technique.
Table 5.1 below provides the average income from different income sources and household
income for the rural households in different quintiles for the years 2004-05 and 2011-12.
Table 5.1 Distribution of Incomes from Different Sources and Household Income

Sources of Income
2004-05 2011-12 Q5/Q12004-05
Q5/Q12011-12Q1 Q2 Q3 Q4 Q5 Q1 Q2 Q3 Q4 Q5
Agriculture 293 3167 5216 10377 39107-666
(-327%)7885
(149%)12466
(139%)20662(99%)
106445(172%) 133.4 -159.9
Agricultural Labour 2482 4964 5932 5502 3189
3747(51%)
8286(67%)
11456(93%)
15088(174%)
9562(200%) 1.3 2.6
Casual Labour 1071 3204 4838 6698 57683220
(201%)9638
(201%)14554
(201%)20889
(212%)24430
(324%) 5.4 7.6
Salary 350 763 2041 4087 26526929
(166%)2365
(210%)5164
(153%)12100
(196%)66840
(152%) 75.8 71.9
Business 371 1214 2137 4503 140991040
(181%)2667
(120%)5315
(149%)8622
(91%)34191
(143%) 38.0 32.9
Remittance 208 313 595 965 32401451
(598%)3165
(913%)4683
(687%)7951
(724%)16085
(396%) 15.6 11.1
Other 131 175 271 1172 5372168
(29%)203
(16%)917
(239%)4226
(261%)17307
(222%) 41.1 103.0
TOTAL 5065 13956 21184 33391 9768011166
(120%)35457
(154%)56306
(166%)91722
(175%)279920(187%) 19.3 25.1
Note: The figure in brackets indicate the percentage change in the particular income source
for the particular quintile from 2004-05 to 2011-12.
From table 5.1, we find that the income of households in first quintile increased by 120%
while that in the fifth quintile increased by 187% with higher quintiles seeing higher growths.
This has increased the inter-quintile household income ratio from 19.3 to 25.1. In agriculture,
income of the lowest quintile declined from 293 to -666 while that of the fifth quintile
increased by 172%. This has impacted the inter-quintile agricultural income ratio drastically
and it increased from 133 to -160. Agricultural labour, casual labour and other income all
increased more for highest quintile compared to lowest quintile from 2004-05 to 2011-12.
The inter-quintile ratio for these incomes changed from 1.3, 5.4 and 41.1 to 2.6, 7.6 and 103
respectively. In salary, business and remittances, growth in lowest quintile during the study
period increase more than that of the highest quintile. This meant that the inter-quintile ratio
decreased from 76, 38 and 16 to 72, 33 and 11 respectively.
To understand how these changes in incomes for different quintiles affected gini coefficeint,
we use a gini decomposition analysis. Table 5.2 indicates the gini decomposition and
elasticity among rural households in 2004-05 and 2011-12.
Table 5.2 Gini Decomposition of Income Inequality

Sources of Income
2004-05 2011-12
Change in elasticity
(10)-(5)
(11)kS
(1)kG
(2)kR
(3)
ShareIngini
(1)*(2)*(3)/G1
(4)
Elasticity(4)-(1)
(5) kS
(6)kG
(7)kR
(8)
ShareIngini
(6)*(7)*(8)/G2
(9)
Elasticity(9)-(6)
(10)
Agriculture 36.8% 86.6% 76.9% 45.7% 8.9% 33.2% 89.4% 78.3% 41.7% 8.5% -0.4%Agricultural Labour 11.3% 78.4% 1.0% 0.2% -11.1% 9.3% 82.7% 15.4% 2.1% -7.2% 3.9%
Casual Labour 11.2% 84.6% 23.5% 4.1% -7.0% 13.7% 80.7% 32.8% 6.5% -7.2% -0.2%
Salary 21.5% 90.4% 78.7% 28.5% 7.0% 19.6% 90.5% 77.2% 24.6% 5.0% -2.0%
Business 11.9% 93.1% 65.3% 13.5% 1.6% 10.8% 94.1% 67.1% 12.3% 1.4% -0.2%
Remittance 2.7% 97.5% 55.0% 2.7% 0.0% 6.3% 92.7% 49.1% 5.2% -1.2% -1.2%
Other Income 4.7% 94.9% 63.7% 5.3% 0.6% 7.2% 91.1% 65.9% 7.7% 0.6% 0.0%
TOTAL 100.0% 53.6% 100.0% 100.0% 55.7% 100.0%
From table 5.2, we find that the overall gini coefficient has increased from 0.536 in 2004-05
to 0.557 in 2011-12. So, inequality of incomes among rural households has increased during
this period. In terms of contribution to income and gini, we find that agriculture contributed
to 36.8% of income and 45.7% of gini in 2004-05. Its elasticity to gini was 8.9% which
meant that a marginal increase in share of agriculture would have increased gini by 8.9% and
thus it was an inequality increasing income source. In 2004-05, income from business,
salaried employment other income were inequality increasing while that from casual and
agricultural labour were inequality decreasing. In 2011-12, elasticity of agriculture income to
gini changed slightly to 8.5% which meant that agriculture became less inequality increasing
during the period. This was mainly due increase in share of agriculture in total income. The
elasticity of gini to change in agricultural labour actually increased which meant that
agricultural labour became less inequality decreasing during the period. This was due to
increase in gini and gini correlation of agricultural labour. This meant that agricultural labour
income became more unequal and also more biased towards households belonging to higher
quintiles. Casual labour became slightly more inequality decreasing in 2011-12 than in 2004-
05 due to increase in share and decline in its gini. The gini correlation though increased for
casual labour indicating this became more favourable towards households in higher quintiles.
Business and Salaried income also became more inequality decreasing largely due to decline
in their share of total incomes. The gini though increased for both the sources. The gini
correlation declined slightly for salary. Remittances increased its share in household income,
registered a decrease in gini and gini correlation with household income. This meant that
while share of remittances in household income and gini of household income was almost the
same in 2004-05, it contributed more to income and less to gini in 2011-12. So, remittances
not just increased its share in total income but also were earned more by lower quintiles and
have an equalising effect on household income. Remittances and casual labour were thus the
only sources of income which increased their shares in income and simultaneously
contributed to decline in inequality. Though casual labour was becoming favourable towards
the richer quintiles (increasing gini correlation), remittances was not becoming so.
6. Discussion
The chapter analysed the changes in incomes, income diversification and income inequality
of rural households between 2004-05 and 2011-12 using the nationally representative Indian
Human Development Survey (IHDS). India went through a phase of high economic growth
during this period with average economic growth rate higher than 8% during the period. By
looking at the different changes in the incomes of rural households, we comment on the type
of economic growth and the impact it had on distribution of incomes.
We find that during this period, incomes of the rural households have grown by around
177%. The growth rates increased with quintiles and higher quintiles registered higher
growth increasing the gini coefficient of rural household income during the period. Among
the different income sources, income from agriculture, agricultural labour, business and
salary registered a growth lower than the average household income growth with agricultural
labour registering the slowest growth. We also find that more households do not earn
incomes from agricultural labour in 2011-12 as compared to 2004-05. It could be the reason
for the slow growth of agricultural labour income despite the rural wages registering a
positive growth during the period. More households earn from casual labour and remittances
in 2011-12 as compared to 2004-05.
Across different categories of population, we find that there is a decline in share of
agricultural incomes and agricultural labour incomes and a gain in share of casual labour and
remittances. Though this is the case, the decline in the two categories and the gain in casual
labour and remittances are heterogeneous. Among different social groups, we find that
Brahmins, forward castes and OBC have lesser shares of income from agriculture in 2011-12
and have increased their shares in remittances more than in casual labour. SCs and STs earn
lesser share from agricultural labour in 2011-12 and have increased the share more from
casual labour than in remittances. Among the groups with different education, households

with highest adult education as illiterate and more than higher secondary have increased a
higher share in remittances than in casual labour. Those with highest adult education between
primary and higher secondary have increased a higher share in casual labour than in
remittances. Among those who do not possess any land, landless labourers and absentee
lessors have increases their share from remittances more than that from casual labour while
the landless salaried have become more dependent on casual labour than in remittances.
Among those who possess land, all the land-size classes have increased share in remittances
more than in casual labour.
In terms of elasticity of the income to inequality, we find that increase in income from
agriculture, business, salary and other income would increase gini in both the years. Between
the two time periods, income from agriculture, business and salary became less inequality
increasing while income from business became more inequality increasing. We also find that
income from agricultural labour, casual labour and remittances were inequality decreasing in
both the time periods. Agricultural labour became more inequality increasing though during
this period. Casual labour and remittances though became more inequality decreasing in the
time period. This would mean that the poorer households are earning less from agricultural
labour and more from casual labour and remittances. This might mean increased pressure on
urban spaces due to migration in future and there have to be measures to ensure both the
monetary and subjective well-being of labourers including migrants. Efforts should also be
focussed on creating opportunities and equitable growth in rural nonfarm sector.
References
Abraham, Vinod. "Employment Growth in rural India: Distress-Driven?" Economic and
Political Weekly (2009): 97-104.
Barrett, C. B, T Reardon, and P Webb. “Nonfarm Income Diversification and Household
Livelihood Strategies in Rural Africa: Concepts, Dynamics, and Policy Implications.”
Food Policy 26, no. 4 (August 2001): 315–31.
Bhalla, Sheila. “Rural Non-Farm Employment and the Unorganised Sector in India.” The
Indian Journal of Labour Economics 45, no. 4 (2002): 695-717.
Bhaumik, S.K. “Employment Diversification in Rural India: A State Level Analysis.” The
Indian Journal of Labour Economics 45, no. 4 (2002): 718-744.
Binswanger-Mkhize, Hans P. "The stunted structural transformation of the Indian economy."
Economic & Political Weekly 48, no. 26&27 (2013): 5-13.

Bourguignon, F., M. Fournier, and M. Gurgand. "Distribution, development and education:
Taiwan, 1979-1994." SSRN Scholarly Paper. Rochester, NY: Social Science Research
Network (1998).
Chadha, G.K. “Rural Non-farm Employment in India: What Does Recent Experience Teach
Us?” The Indian Journal of Labour Economics 45, no. 4 (2002): 663-694.
Chadha, G. K., and P. P. Sahu. "Post-reform setbacks in rural employment: issues that need
further scrutiny." Economic and Political Weekly (2002): 1998-2026.
Chowdhury, Subhanil. "Employment in India: What does the latest data show?." Economic
and political weekly 46, no. 32 (2011): 23-26.
Coppard, Daniel. "The rural non-farm economy in India: A review of the literature." Natural
Resource Institute, Department for International Development (DFID), World Bank,
NRI Report 2662 (2001).
Desai, S, A Dubey, B L Joshi, M Sen, A Shariff and R Vanneman. "Human Development in
India: Challenges for a Society in Transition." Oxford University Press (2010).
Fields, Gary S. "Accounting for income inequality and its change: A new method, with
application to the distribution of earnings in the United States." Research in labor
economics 22, no. 3 (2003): 1-38.
Himanshu, Lanjouw, Peter, Rinku Murgai, and Nicholas Stern. "Nonfarm diversification,
poverty, economic mobility, and income inequality: a case study in village India."
Agricultural Economics 44, no. 4-5 (2013): 461-473.
Lanjouw, Peter, and Abusaleh Shariff. "Rural non-farm employment in India: Access,
incomes and poverty impact." Economic and Political Weekly (2004): 4429-4446.
Jatav, Manoj. "Casualisation of Workforce in Rural Non-Farm Sector of India: A Regional
Level Analysis across Industries." The Indian Journal of Labour Economics 53, no. 3
(2010): 501-16.
Jatav, Manoj, and Sucharita Sen. "Drivers of non-farm employment in rural India: Evidence
from the 2009-10 NSSO Round." Economic and Political Weekly 48, no. 26&27
(2013): 14-21.
Kapur, Devesh, Chandra Bhan Prasad, Lant Pritchett, and D. Shyam Babu. "Rethinking
inequality: Dalits in Uttar Pradesh in the market reform era." Economic and Political
Weekly 45, no. 35 (2010): 39-49.
Kashyap, S. P., and Niti Mehta. "Non-farm Sector in India: Temporal and Spatial Aspects."
The Indian Journal of Labour Economics 50, no. 4 (2007): 611-32.
Kundu, Amitabh, Niranjan Sarangi, and Bal Paritosh Dash. Rural non-farm employment: An

analysis of rural urban interdependencies. Overseas development institute (ODI),
2003.
Lerman, Robert I., and Shlomo Yitzhaki. "Income inequality effects by income source: a new
approach and applications to the United States." Review of economics and statistics
(1985): 151-156.
Lanjouw, Peter and Sharriff, Abusaleh. “Rural Non-Farm Employment in India: Access,
Incomes and Poverty Impact.” Economic and Political Weekly (22004): 39(40): 4429-
46.
Morduch, Jonathan, and Terry Sicular. "Rethinking inequality decomposition, with evidence
from rural China." The Economic Journal 112, no. 476 (2002): 93-106.
Oaxaca, Ronald. "Male-female wage differentials in urban labor markets." International
economic review (1973): 693-709.
Reardon, Thomas, J. Edward Taylor, Kostas Stamoulis, Peter Lanjouw, and Arsenio
Balisacan. "Effects of non‐farm employment on rural income inequality in developing
countries: an investment perspective." Journal of agricultural economics 51, no. 2
(2000): 266-288.
Reardon, Thomas, Julio Berdegué, Christopher B. Barrett, and Kostas Stamoulis. "Household
income diversification into rural nonfarm activities." Transforming the rural nonfarm
economy: opportunities and threats in the developing world (2007): 115-141.
Sahu, P.P. “Casualisation of Rural Workforce in India: Analysis of Recent Trends” The
Indian Journal of Labour Economics 46, no. 4 (2003): 927-939.
Shorrocks, Anthony F. "Inequality decomposition by factor components." Econometrica:
Journal of the Econometric Society (1982): 193-211.
Srivastav, Nirankar, and Dubey, Amaresh. Rural Non-Farm Employment in India: Spatial
Variations and Temporal Change. SSRN Scholarly Paper. Rochester, NY: Social
Science Research Network, September 1, 2002.
http://papers.ssrn.com/abstract=1825046.
World Bank. Addressing Inequality in South Asia. The World Bank, 2015.
World Bank. More and Better Jobs in South Asia. The World Bank, 2011.