Inclusive Sport Round 1 Evaluation · evaluation services across a broad field of education,...
52
Inclusive Sport Round 1 Evaluation Year 1 Report July 2014
Transcript of Inclusive Sport Round 1 Evaluation · evaluation services across a broad field of education,...

Inclusive Sport Round 1 Evaluation Year 1 Report July 2014

For more information about this report please contact
Sarah Robinson: [email protected]
CFE Research, Phoenix Yard, Upper Brown Street, Leicester,
LE1 5TE
T: 0116 229 3300 [email protected]
www.cfe.org.uk
© CFE 2014
Established since 1997, CFE is an independent not-for-profit
company specialising in the provision of research and
evaluation services across a broad field of education,
employment and skills.

CONTENTS
01. Summary 5
02. Introduction 11
03. Method 13
04. Profile of projects and participants 15
05. Findings: Participation & throughput 16
06. Findings: Motivation & opportunities 23
07. Findings: barriers beyond choice 28
08. Findings: positive role models 31
09. Conclusions 32
10. Appendix 1: Partnerships 35
11. Appendix 2: project delivery 38
12. Appendix 3: Questionnaires 44

LIST OF TABLES
Table 1: Intervention Outcome results after 1 year ............................................... 6
Table 2: Demographic breakdown of respondents (Sample bases vary) ............ 15
Table 3: Outcome achievements .......................................................................... 33
Table 4: Analysis of partnerships created ............................................................ 35
Table 5: Successes ................................................................................................ 42
LIST OF FIGURES
Figure 1: Number of days on which participants played sport before Inclusive
Sport and after 1 year of programme delivery (main survey respondents)
(Sample base = 334) ............................................................................................... 8
Figure 2: Number of days on which sport was played in the last week
(Participation rates) (Sample bases in parentheses) ........................................... 17
Figure 3: Comparing participation rates prior to Inclusive Sport and after 1 year
of Inclusive Sport (main survey respondents only) (Sample Base = 334) .......... 18
Figure 4: Sports participation levels prior to Inclusive Sport (Sample bases in
parentheses) ......................................................................................................... 19
Figure 5: Length of time playing the sport(s) played at the project (Sample bases
in parentheses) ..................................................................................................... 19
Figure 6: Variation in participation rates compared with this time last year
(main survey and aggregated supplementary data combined) (Sample Bases in
parentheses) .........................................................................................................20
Figure 7: Amount of sport undertaken at project (Sample bases in parentheses)
.............................................................................................................................. 21
Figure 8: Comparing level of sport undertaken at project (Baseline and Year 1)
(Sample bases in parentheses) ............................................................................. 21
Figure 9: Extent to which sport is enjoyed and important to the respondent
(main survey) (Sample bases in parentheses) ..................................................... 23
Figure 10: Sports participant plays as part of the project (sample bases in
parentheses) ......................................................................................................... 24
Figure 11: Choice and quality of sport (main survey) (Sample bases in
parentheses) ......................................................................................................... 25
Figure 12: Sports wanting to try (main survey) ................................................... 26
Figure 13: Access to venue of choice (main survey) (Sample base = 303) .......... 27
Figure 14: Extent to which barrier is a problem (main survey) (Sample bases in
parentheses) ......................................................................................................... 28
Figure 15: Barriers to participation (picture-based survey) (Sample bases are
varied) ...................................................................................................................30
Figure 16: Percentage of participants supporting sporting activities as a
volunteer or employee (Sample bases in parentheses) ....................................... 31

Inclusive Sport Round 1 Evaluation | Summary 5
Context
The Places People Play Programme is designed to deliver a mass participation sporting
legacy from the 2012 Olympic and Paralympic Games. Round one of Inclusive Sport is one
of three strands to the People Projects. It is an investment of £10.2 million of National
Lottery funding, by Sport England, in 43 projects around the country that aim to help more
young people (aged 14+) and adults with a disability to play sport more regularly. CFE
Research were commissioned to undertake an evaluation to assess the impact of the People
Projects and provide an evidenced understanding of the processes and mechanisms by
which the outcomes Sport England set out to achieve have been realised or not.
The other two strands of the People Projects, Sport Makers and Club Leaders are reported
on separately to Sport England.
Methodology
The national evaluation of the Inclusive Sport programme includes:
— Online participant surveys,
— Case studies (including depth interviews); and
— Secondary analysis of monitoring information (MI) and six monthly progress reports
provided by project leads.
Two surveys were designed to meet the needs of the participants: a ‘main’ online survey
and an easy-read ‘picture-based’ survey (predominately designed for participants with
learning disabilities). This report provides the findings from the Year 1 survey following the
baseline survey that was conducted over two waves between September 2013 and March
2014 yielding a response from 1,486 participants.
In total 690 Inclusive Sport participants responded to either the main online survey (334)
or the picture-based online survey (356) for Year 1 during the month of June in 2014.
These respondents came from 28 projects within the programme, with participant
responses per project varying considerably from 1 to 99.
01. SUMMARY
This chapter provides an overview of the key findings from the Year
1 report.

6 Summary | Inclusive Sport Round 1 Evaluation
Key findings
The table below summarises results from the baseline and Year 1 surveys for Inclusive Sport, showing positive progress has been
made across all of the strategic outcomes.
Table 1: Progress against Strategic Outcomes for Inclusive Sport after 1 year (asterisk denotes a statistically significant difference)
Strategic /Intervention
Outcome
Indicator (Survey Question) Baseline
Result (%)
Year 1
Result (%)
Percentage
Point
Change
Percentage
Change
Increase in 1x30min Sport
Participation Rate
% of respondents who selected one or more
days to the question: On how many days in the
past week have you spend 30 minutes or
longer taking part in any sport?
59%1 94% +35* +59%
More disabled people see
sport as a viable lifestyle
choice for themselves
% of respondents who agreed or strongly
agreed with the statement: Sport is an
important part of my life.
61% 67% +6 +10%
More opportunities to take
part in a sport of their
choice
% of respondents who agreed or strongly
agreed with the statement: I can take part in
the sport of my choice
45% 59% +14* +31%
1 Please note this figure was NOT from the baseline but taken from the added question into the Year 1 main survey that asked about 1x30 levels prior to involvement with their Inclusive Sport project.

Inclusive Sport Round 1 Evaluation | Summary 7
Strategic /Intervention
Outcome
Indicator (Survey Question) Baseline
Result (%)
Year 1
Result (%)
Percentage
Point
Change
Percentage
Change
More opportunities to take
part in sport at a venue of
their choice
% of respondents who agreed or strongly
agreed with the statement: I can take part in
sport at a venue of my choice
33% 46% +13* +39%
Higher quality
opportunities are available
for disabled people to take
part in sport
% of respondents who agreed or strongly
agreed with the statement: Opportunities for
me to take part in sport are of a high quality
47% 66% +19* +40%
More disabled people are
acting as positive role
models in the sport
workforce
% of respondents who said they currently
support any sporting activities as a volunteer or
employee
10% 14% +4* +40%

8 Summary | Inclusive Sport Round 1 Evaluation
PARTICIPANTS AND THROUGHPUT (PAGE 16)
Overall, round one of Inclusive Sport is projected to have 52,5442 disabled people
participate in sport with a net project throughput of 830,3293 equates to an average of 16
sessions per participant across the 3 year funding period. The six monthly results reveal
that projects4 reached 86% (10,700) of their target for Year 1 (12,385) with regards to
participation and thus are in line to achieve and in fact exceed the overall Year 1 target.
Throughput figures for the same period (initial six months) are 39,859, which is 70% of the
full year baseline (56,610) and 24% of the total Year 1 target (167,001). This equates to 3-4
sessions per participant over the 6 month period.
EXTENT OF PHYSICAL ACTIVITY (PAGE 17)
In total, 94% of respondents to the main survey participated in sport or physical activity at
least one day a week, whereas 59% stated they did prior to Inclusive Sport. This provides a
35 percentage point increase in participation levels during the first year of delivery.
Figure 1: Number of days on which participants played sport before Inclusive Sport and after 1 year of programme delivery (main survey respondents) (Sample base = 334)
2 The year 3 cumulative participation figures for the Pirate Castle are not available; the figures for the London Borough of Newham have
been deducted as this project did not commence.
3 The figures for the London Borough of Newham have been deducted as this project did not commence.
4 Only projects who had provided 6 monthly monitoring data have been included in these calculations.
41%
32%
16%
7%
2%
1%
1%
1%
6%
28%
33%
21%
7%
3%
1%
2%
0% 10% 20% 30% 40% 50%
0
1
2
3
4
5
6
7
Number of days
Before Inclusive Sport Now

Inclusive Sport Round 1 Evaluation | Summary 9
The majority (94%) of picture-based respondents (to the Year 1 survey) had participated in
sport for 30 minutes or more at least one day in the last week. Over two-fifths of picture-
based respondents (42%) did not participate in sport prior to their current participation in
an Inclusive Sport funded project.
The results are similar across both the main and picture surveys and, as such, depict that
Inclusive Sport has successfully engaged previously inactive disabled people in sport
within the first year of its delivery. Indeed:
— Almost three-quarters (73%) of respondents to the Year 1 survey (main and picture-based
combined) stated they had been playing the sport that they take part in at the project for less
than a year. Further, 40% of respondents to the main survey5 who had been playing sport
for less than a year had not participated prior to Inclusive Sport and had participated in
sport at least once in the last week (from when they conducted the survey);
— Over two-fifths (43%) of main survey respondents stated that they would not be able to play
sport if their Inclusive Sport project did not exist;
— 59% of those unable to play sport if their Inclusive Sport project did not exist had not
participated in sport prior to Inclusive Sport; and
— 29% of respondents who had participated in sport prior to Inclusive Sport would not be able
to play sport if their project did not exist.
Since the baseline, respondents are more likely to participate in sport/physical activities
outside of their Inclusive Sport project with 33% stating they undertake all their
participation at the project, whereas 57% stated this at the baseline.
MOTIVATION AND OPPORTUNITIES (PAGE 23)
The majority of respondents to the main survey agreed that they enjoy taking part in sport
(79%) and that sport is an important part of their life (67%). Both these results have seen a
positive increase since the baseline (up 8 and 6 percentage points respectively). Most
respondents to the picture-based survey said that playing sports makes them happy (97%),
which is consistent with the baseline survey (96%).
Respondents were most likely to participate in multiple types of sport at the project, as
opposed to a single sport. However older people (79% of 45+ year olds) were significantly
more likely to participate in just one type of sport at a project. This may partly reflect
individual preference/choice but may also reflect the type of opportunities on offer.
5 It is not possible to calculate displacement in regards to number of days for the picture based survey as respondents were not asked to
cite days in regards to participation levels prior to Inclusive Sport.

10 Summary | Inclusive Sport Round 1 Evaluation
CHOICE AND QUALITY (PAGE 25)
Two of the outcomes identified by Sport England for Inclusive Sport funded projects were
to improve both the choice and the quality of opportunities for disabled people to take part
in sport. After 1 year of delivery, the proportion of respondents who agree they can take
part in a sport of their choice has increased by 14 percentage points (from 45% to 59%).
Similarly, the proportion of respondents who agree that the opportunities for them to take
part in sport are of a high quality has also increased, by 19 percentage points (from 47% to
66%).
Over two-fifths of the respondents to the main survey (44%) stated that there were sports
that they would like to try that they have so far been unable to participate in. Over 30
sports were listed with the five most cited sports were:
— Basketball
— Swimming
— Cricket
— Football
— Tennis
SPORTING VENUES (PAGE 27)
Since the baseline, there has been a statistically significant increase (up by 13 percentage
points) in the proportion of respondents who agree that they can take part in sport at a
venue of their choice (33% to 46%). This suggests that projects funded through Inclusive
Sport provide their participants with more opportunities to access sport in a venue of their
choosing than was previously available.
BARRIERS (PAGE 30)
Participants in the main survey were asked to what extent they found a series of potential
barriers to be a problem. ‘Attitude of Others’ was most likely to be perceived as a barrier by
participants (34% ‘a problem’). This is a shift from ‘the sport I wish to try is too far away
from me’ which was cited as the greatest problem for 40% of respondents to the baseline
survey (29% cite this to be the case in the Year 1 survey). This may indicate that the
Inclusive Sport programme is helping to provide sporting opportunities locally for
participants; however the concerns of disabled people that they are judged by others when
participating still remain. Further research is required to understand the attitudes being
referred to, and who they stem from, in order to understand how best to tackle this barrier.
POSITIVE ROLE MODELS (PAGE 31)
One of the key outcomes for Inclusive Sport is to increase the number of disabled people
acting as positive role models in the sport workforce. Currently one-in-seven disabled
participants at projects volunteer in sporting activities providing a statistically significant
increase since the baseline position of one in ten who were doing so.

Inclusive Sport Round 1 Evaluation | Introduction 11
This report summarises the key findings emerging from a suite of surveys and evaluation
tools designed to measure the impact of Inclusive Sport projects. This report forms the
third Interim Report presented to Sport England as part of our longitudinal evaluation and
is designed to provide the results following the first year of the project. Where relevant
comparisons are made with the baseline data (reported in the second interim report).
The Places People Play Programme: People Projects
The Places People Play (PPP) Programme has been designed to deliver a mass
participation sporting legacy from the 2012 Olympic and Paralympic Games. The People
Projects within this programme are designed to inspire people to make sport happen at the
local level, embedding the Olympic and Paralympic values in grassroots sport.
There are three strands to the People projects: Sport Makers, Club Leaders and Inclusive
Sport. The third strand – Inclusive Sport – is an investment of £10.2 million of National
Lottery funding, by Sport England, in 426 projects around the country that aim to help
more young people (aged 14+) and adults with a disability to play sport more regularly.
This investment is intended to help tackle the opportunity gap that sees one in six disabled
adults playing sport regularly, compared to one in three non-disabled adults and make
sport a viable choice for disabled people.
For the Inclusive Sport strategic investment, projects are required to provide evidence of
current insight into disabled people’s needs, expectations and motivations as they relate to
physical activity and sport. Additionally, they are expected to detail any previous successful
activities that could be repeated or scaled-up with more investment and also state what
sustainable links to the disability sector they make.
6 Between the baseline and year 1 survey the Newham Ability Sports Programme remained unfunded and excluded from the evaluation.
Following the exclusion of Southern Waterbility at the baseline this reduces the overall number of projects to 42.
02. INTRODUCTION
This is the third interim report of CFE Research’s evaluation of
Sport England’s investment in Inclusive Sport projects. This
section outlines the background, context, aims and objectives of
the evaluation.

12 Introduction | Inclusive Sport Round 1 Evaluation
Project Background
CFE Research were commissioned to undertake an evaluation to assess the impact of the
People Projects and provide an evidenced understanding of the processes and mechanisms
by which the outcomes Sport England set out to achieve have been realised or not. This
evaluation will create an understanding of what works, how and in what context.
Furthermore, it will provide evidence of relative value for money to inform current and
future business decisions that seek to optimise the return on investment. The evaluation
will need to focus on the three main objectives to:
— Measure the impact and assess the value for money of Sport Makers, Club Leaders and
Inclusive Sport;
— Find out what works, how, in what context and for whom; and
— Communicate the evidence effectively to optimise its influence on policy and practice and to
demonstrate accountability for public investment.
The evaluation of Sport Makers and Club Leaders are reported separately to Sport England
by CFE Research. This is the second interim report focused solely on the formative
evaluation of Inclusive Sport.
This Report
This report focuses on the findings from the responses to the Year 1 survey of Inclusive
Sport participants, including comparisons to the baseline survey. It also provides the
throughput and participation figures and qualitative outputs from the case studies
conducted to-date.
After this introduction the rest of the report is structured as follows: Section 3 outlines
the method used to collect and analyse information; Sections 4-8 consider the findings of
our surveys and qualitative analysis of the development plans and six month reports and
Section 9 provides our conclusions.
For reference, we have provided the ‘Partnerships’ and ‘Project Delivery’ sections from the
baseline report as appendices of this report. No further analysis has been undertaken in
these two areas since the baseline report was produced; they have been included here to
provide contextual information for the Year 1 analysis.

Inclusive Sport Round 1 Evaluation | Method 13
This interim report is part of a formative evaluation of Inclusive Sport projects. It focuses
on data collected from the first annual survey.
Approach
The national evaluation of the Inclusive Sport programme, conducted by CFE Research,
includes the dissemination of online participant surveys, case studies (including depth
interviews) and secondary analysis of regularly collected monitoring information (MI).
PARTICIPANT SURVEYS
CFE Research designed the ‘baseline’ and ‘Year 1’ surveys and agreed the content with
Sport England prior to going to field. The survey was created primarily to track current and
changing participation in sport or physical activity over the duration of the programme.
The Year 1 survey built on the original baseline survey design. Two survey formats were
utilised:
— An online ‘main survey’
— An online picture based ‘easy read’ format– designed primarily for use with participants
with learning disabilities
The Year 1 survey was disseminated from Monday 2nd June until Friday 27th June 2014.
QUALITATIVE INFORMATION
Additional qualitative information from case study interviews has been analysed and
utilised to provide context and further findings where appropriate.
Analysis
All survey responses were captured online in SNAP™ and exported into SPSS™ software
for analysis.
Pearson’s chi-square test, ANOVA and t-tests were applied to cross-tabulated data to
examine if there were any significant correlations amongst the data. In order to provide
statistically significant cross-tabulations, the responses from the two surveys were merged
to create one data set. Where questions were directly comparable across both surveys
cross-tabulations were run by gender, age and disability type.
03. METHOD
This chapter outlines the methodology implemented for the
formative evaluation.

14 Method | Inclusive Sport Round 1 Evaluation
The qualitative data was analysed thematically in Excel. This was done by generating a
coding frame from the evaluations key aims and objectives, which was then used as a guide
for data analysis. Qualitative information was coded to identify evidence against each of
the key evaluation aims and objectives.
Reporting
Findings are presented in this report based around key themes, rather than methodological
processes. Not all themes are covered by all data sources. All findings are based on ‘valid’
response rates i.e. don’t know/can’t remember responses or missing answers have been
removed from the analysis. As such, sample bases vary. Bases are provided on all figures
and tables. Responses have been rounded to the nearest decimal place and may not sum.
Confidence Intervals
A total of 334 respondents completed the primary online survey, providing a confidence
interval of 5.36% at 95%. This means, that on a finding of 50%, for example, we can be 95%
confident that if we asked everyone the same question the response would be between
44.64% and 55.36%.
A total of 356 respondents completed a picture-based response providing a confidence
interval of 5.19% at 95%. This means, that on a finding of 50%, for example, we can be 95%
confident that if we asked everyone the same question the response would be between
44.81% and 55.19%.

Inclusive Sport Round 1 Evaluation | Profile of projects and participants 15
04. PROFILE OF PROJECTS AND PARTICIPANTS
This chapter outlines the projects involved in the first annual
survey and the demographics of the participants.
In total 28 projects (67%) participated in the Year 1 survey c.f. 35 projects in the baseline
survey7. Participant responses by project varied considerably from 1 to 99. Fourteen
projects did not provide any responses. Table 2 below illustrates the demographic
breakdown for participants who took the Year 1 survey.
Table 2: Demographic breakdown of respondents (Sample bases vary)8
Demographic Category % of respondents from picture-based survey
(356)
% of respondents from main
survey (334)
Total % of respondents
Gender
Male 59% 69% 64%
Female 33% 29% 31%
Age
Under 14 years old 5% 5% 5%
14-15 years old 9% 5% 7%
16-17 years old 20% 9% 14%
18-24 years old 26% 29% 28%
25-44 years old 24% 27% 26%
45+ years old 11% 24% 17%
Disability9
Learning disability / difficulty
73% 53% 63%
Autistic Spectrum disorder 21% 13% 17%
Physical impairment 14% 26% 20%
Deaf/ hard of hearing 3% 6% 4%
Mental health condition 7% 9% 8%
Blind / visual impairment 4% 10% 7%
Other 2% 4% 3%
7 Please see baseline report for demographic breakdown of baseline survey respondents
8 Please note percentages will not always tally to 100% due to non-response
9 Respondents could select more than one category so totals exceed 100%

16 Findings: Participation & throughput | Inclusive Sport Round 1 Evaluation
05. FINDINGS: PARTICIPATION & THROUGHPUT
The key output for the Inclusive Sport programme is that it
enables more disabled people to regularly take part in sport.
Data from the project reporting provides evidence of disabled
peoples’ participation in sport/physical activity.
Monitoring data via Coalfields Regeneration Trust (CRT)
Projects are required to provide throughput and participant figures. They provide this data
to CRT, who then share it with Sport England and CFE Research.
— Throughput is defined as the total number of times that individuals take part in sport at the
project. It is sometimes called ‘attendances’ or ‘visits’. It will nearly always be bigger than
the participants figure because some people will take part in sport at the project more than
once. No demographic breakdowns are required for this measure.
— Participants is defined as the number of people that take part in sport at the project at least
once. Each person should only be counted once regardless of how many times they attend.
Overall, the projected net participation for Inclusive Sport will be 52,54410 providing a net
project throughput of 830,32911. This provides an average of 16 sessions per participant
across the programme over three years.
Thirty six projects provided figures for the 6 monthly returns to CRT12. Working from a
baseline of 4,202 these projects achieved a participation figure of 10,700 within six months
– taking them to 86% of the target for Year 1 (12,385). Therefore, the projects are in line to
achieve and in fact exceed the overall Year 1 target.
The throughput figures after six months are not as positive with 39,859 achieved with the
baseline at 56,610 and the Year 1 target at 167,001. The results indicate that on average a
participant has attended 3-4 sessions over a six month period. These lower than expected
figures may have occurred for a number of reasons, including the fact that projects can
take time to get activities up and running – as such throughput figures can take a while to
reach their targets.
10 The year 3 cumulative participation figures for the Pirate Castle are not available; the figures for the London Borough of Newham have
been deducted as this project did not commence.
11 The figures for the London Borough of Newham have been deducted as this project did not commence.
12 We have provided six monthly figures as only 11 projects have provided actual totals for 12 months.

Inclusive Sport Round 1 Evaluation | Findings: Participation & throughput 17
Extent of physical activity
To complement the monitoring data, the national evaluation asked respondents to the
main survey on how many days in the past week they had spent 30 minutes or longer
taking part in any sport. In the picture-based survey respondents were asked the related
question in the last week, on which days did you play sport for at least 30 minutes. As such
we can provide a total figure and directly compare responses across the two surveys; the
figure below illustrates the results.
Figure 2: Number of days on which sport was played in the last week (Participation rates) (Sample bases in parentheses)
In total, 94% of respondents participated in sport or physical activity on at least one day in
the last week. Respondents to the picture-based survey were significantly more likely to
participate in sport once in the last week whereas those responding to the main survey
were more likely to have participated on two days in the last week13. All of this is consistent
with the baseline survey. There were no statistically significant differences when ANOVA
tests were applied to the mean number days.
Baseline results for this question were found to be unexpectedly high. Further
investigation revealed that some participants had completed the baseline survey after
13 It is not possible to undertake further analysis of the characteristics of those completing different versions of the survey; in part this
will be determined by the administrative process adopted by each project lead.
6%
39%
27%
19%
6%
3%
0%
1%
6%
28%
33%
21%
7%
3%
1%
2%
6%
49%
20%
17%
5%
2%
0%
1%
0% 10% 20% 30% 40% 50% 60%
0
1
2
3
4
5
6
7
Total (688) Main (334) Picture (354)

18 Findings: Participation & throughput | Inclusive Sport Round 1 Evaluation
commencing attendance at the project, hence those figures reflected increased
participation with projects for some. As such, the Year 1 main survey also included an
additional question to measure activity levels prior to Inclusive Sport.
Main survey respondents were asked before they played sport with their project for
Inclusive Sport, on how many days in the week did they usually spend 30 minutes or
longer taking part in sport or physical activity. The figure below illustrates the results in
comparison with how many days they played sport in the last week.
Figure 3: Comparing participation rates prior to Inclusive Sport and after 1 year of Inclusive Sport (main survey respondents only) (Sample Base = 334)
As the figure shows, prior to Inclusive Sport 41% of respondents to the main survey did not
participate in at least 30 minutes of sport a week and therefore 59% did participate. One
year into delivery of the project participation rates have risen to 94% (only 6% of
respondents did not participate in any sport or physical activity in the last week). This
provides a 35 percentage point increase in participation.
The number of days respondents participate has also increased with 67% of respondents
participating on two or more days a week compared to 28% prior to involvement with an
Inclusive Sport project.
41%
32%
16%
7%
2%
1%
1%
1%
6%
28%
33%
21%
7%
3%
1%
2%
0% 10% 20% 30% 40% 50%
0
1
2
3
4
5
6
7
Number of days
Before Inclusive Sport Now

Inclusive Sport Round 1 Evaluation | Findings: Participation & throughput 19
Picture-based survey respondents were asked whether they played sport before going to an
Inclusive Sport project; 42% stated they did not and hence there has been a similar
increase of 36 percentage points in the number of picture-based respondents who now
participate in sport at least once a week. Figure 4 below illustrates the sports participation
levels prior to Inclusive Sport.
Figure 4: Sports participation levels prior to Inclusive Sport (Sample bases in parentheses)
Around three-quarters of respondents to the Year 1 survey (73%) stated they had been
playing the sport that they take part in at the project for less than a year (see Figure 5
below).
Figure 5: Length of time playing the sport(s) played at the project (Sample bases in parentheses)
59%
41%
58%
42%
0% 20% 40% 60% 80%
Participated prior to IS
Did not participate prior to
IS
Main (334) Picture (350)
20%
22%
31%
19%
4%
4%
18%
21%
32%
19%
3%
8%
24%
23%
31%
18%
4%
0%
0% 5% 10% 15% 20% 25% 30% 35%
Less than 3 months
Between 3 and 6 months
Between 6 months and 1 year
Between 1 and 2 years
Between 2 and 3 years
3 or more years
Total (598) Main (327) Picture (271)

20 Findings: Participation & throughput | Inclusive Sport Round 1 Evaluation
Indeed, 43% of main survey respondents stated that they would not be able to play sport if
their Inclusive Sport project did not exist; of these respondents, 59% had not participated
in sport prior to Inclusive Sport. This suggests that projects have successfully engaged
disabled people in particular sports/physical activities for the first time. The funding has
also allowed individuals participating in sport to continue to do so, with 29% of main
survey respondents who had participated in sport prior to Inclusive Sport reporting that
they would now be unable to play sport if their Inclusive Sport project did not exist. A
further 18% stated that they were unsure if they would be able to continue if their project
did not exist.
Inclusive sport has not only successfully engaged disabled people in sport/physical activity,
but also enabled participation levels to increase. Over two-thirds (68%) stated that they
take part in sport more now than they did this time last year. Further analysis14 was
undertaken to assess on how many days people did sport in relation to whether they said
they were now doing ‘more’ or ‘about the same’ amount of sport. Participants who stated
they undertook ‘more sport’ compared to last year, participated in sport, on average, 2.08
days in the last week, which is (statistically) significantly higher than those who undertook
‘the same’ level of sport compared to last year– on average 1.82 days a week.
Figure 6: Variation in participation rates compared with this time last year (main survey and aggregated supplementary data combined) (Sample Bases in parentheses)
At the baseline, 48% of respondents stated they had participated in sport more in the last
six months than they did last year. Therefore, there has been a 20 percentage point
increase in the proportion of respondents participating in higher levels of sport now (1 year
into delivery of the programme) compared to prior to Inclusive Sport commencing.
14 An ANOVA test revealed that the sample size for those who undertook ‘less’ sport was too small so a T-Test was conducted.
68%
22%
11%
66%
30%
4%
69%
18%
13%
0% 10% 20% 30% 40% 50% 60% 70% 80%
More
About the same
Less
Total (668) Main (322) Picture (346)

Inclusive Sport Round 1 Evaluation | Findings: Participation & throughput 21
PROPORTION OF SPORT PLAYED AT AN INCLUSIVE SPORT PROJECT
All respondents were asked how much of the sport they undertake is related to the
Inclusive Sport project they participate in? As Figure 7 shows, a third (33%) of respondents
undertake all of their sporting participation at an Inclusive Sport project; and a further
third (33%) undertake most of it there.
Figure 7: Amount of sport undertaken at project (Sample bases in parentheses)
Compared to the baseline, there has been a 24 percentage point reduction in the
proportion of respondents undertaking all of their sporting participation at an Inclusive
Sport project. The figure below illustrates the results.
Figure 8: Comparing level of sport undertaken at project (Baseline and Year 1) (Sample bases in parentheses)
The increase in the proportion of respondents undertaking sport or physical activity
outside of an Inclusive Sport project may mean that projects are providing individuals with
33%
33%
31%
2%
41%
30%
28%
1%
26%
37%
34%
4%
0% 10% 20% 30% 40% 50%
All of it
Most of it
Part of it
None of it
Total (675) Main (334) Picture (341)
57%
22%
14%
6%
33%
33%
31%
2%
0% 10% 20% 30% 40% 50% 60% 70%
All of it
Most of it
Part of it
None of it
Baseline (1148) Year 1 (675)

22 Findings: Participation & throughput | Inclusive Sport Round 1 Evaluation
the confidence to participate in a wider variety of sports/physical activity. Indeed, evidence
from the qualitative work suggests that respondents have become more aware of fitness
and health through their projects and wish to participate further to improve their ability in
their sport and/or fitness. Interviewees have cited examples of going to gyms to improve
fitness, entering marathons to raise money to develop the sporting provision in their area,
joining other clubs (including attending healthy eating classes) or seeking additional
opportunities to improve sporting abilities (e.g. exposure to competitions/leagues) and as
a way to increase socialisation.
Their willingness to try other things out has increased.
— Qualitative interviewee
Clients have come along and taken part in our sessions... [They] have then moved on
and taken part in regional sport and then taken part in national sport up to the national
games. So we do work along a player pathway as well, which I think makes us unique.
— Inclusive Sport project manager
[The Sunderland tournaments provided competition which] exposed some of the
weaknesses of the team that they were all beating themselves up over it and they were
all going, oh we didn't do this right. We didn't do that right, and that's exactly what you
want...Then because two of them have actually been on level one coaching
qualifications, they can articulate the technical sort of reasons why it wasn't working so
well...that's exactly what we wanted. We wanted progression out of this.
— Inclusive Sport project manager

Inclusive Sport Round 1 Evaluation | Findings: Motivation & opportunities 23
06. FINDINGS: MOTIVATION & OPPORTUNITIES
The motivation to participate in sport is important but it also
requires access to viable, good quality opportunities. A key theme
of the Inclusive Sport programme is to provide more opportunities
for disabled people to take part in a sport of their choice and at a
venue of their choice. This chapter focuses on what emerges from
the participant surveys in relation to these issues.
Motivation to participate
All the respondents to the main survey were asked to what extent they agreed or disagreed
with statements about sport. As Figure 9 shows, the majority of respondents to the main
survey agreed that sport is an important part of their life (67%) and that they enjoy taking
part in sport (79%). Nearly all respondents to the picture-based survey (97%) said that
playing sports makes them happy (73% of which stated ‘very happy’).
Figure 9: Extent to which sport is enjoyed and important to the respondent (main survey) (Sample bases in parentheses)
Compared to the baseline, the proportion of respondents agreeing with both these
statements has increased, but not statistically significantly. At the baseline, 71% of
respondents agreed they enjoyed taking part in sport (up 8 percentage points) and 61%
said sport is an important part of their life (up 6 percentage points).
15%
15%
18%
7%
67%
79%
Sport is an important part of my life (324)
I enjoy taking part in sport (323)
Disagree Neither Agree

24 Findings: Motivation & opportunities | Inclusive Sport Round 1 Evaluation
Sports played
Respondents were asked which sports they played as part of their Inclusive Sport project.
Figure 10 illustrates the results.
Figure 10: Sports participant plays as part of the project (sample bases in parentheses)
As Figure 10 shows, respondents to the picture-based survey are significantly more likely
to take part in more than one type of sport (52%) at their Inclusive Sport project compared
to respondents to the main survey (27%). main survey respondents were most likely to
participate in the following singular sports: association football (21%); general exercise and
fitness (16%), swimming and walking/hiking (both 5%). The most participated in singular
sport for respondents to the picture-based survey was cycling (28%).15
Cross-tabulation analysis reveals statistical differences (using Chi-square tests) between
disabled people aged 45 years and over and younger disabled people; older disabled people
15 Please note this is likely to be due to the high response rate from the Wheels for Wellbeing project.
27%
21%
16%
5%
5%
4%
4%
3%
3%
2%
2%
1%
1%
1%
4%
52%
11%
1%
3%
2%
28%
1%
2%
1%
0% 10% 20% 30% 40% 50% 60%
More than one type of sport
Association Football
General exercise and fitness
Swimming
Walking/hiking
Boccia
Cycling
Trampolining
Badminton
Handball
Cricket
Rowing
Bowling
Powerchair football
Tennis
Athletics
Other
Main Survey (334) Picture Survey (356)

Inclusive Sport Round 1 Evaluation | Findings: Motivation & opportunities 25
were more likely to participate in one type of sport (79% of 45+ year olds) compared to
younger respondents (48% of <18 year olds and 55% of 18-24 year olds).
Choice and quality
Although the previous results illustrate that a number of sporting options are available, it
was necessary to ascertain if respondents had access to the sport of their choice. This is
because it is an important factor in the sustainability of participation and the extent to
which a positive impact can be realised through sports participation.
Those participating in the main survey were asked if they are able to take part in the sport
of their choice and if the opportunities to take part were of a high quality. As Figure 11
shows, almost three-fifths (59%) agreed that they can take part in the sport of their choice.
This is a statistically significant increase since the baseline when 45% agreed that they
could take part in the sport of their choice.
Figure 11: Choice and quality of sport (main survey) (Sample bases in parentheses)
Two-thirds (66%) of respondents to the main survey agreed that the opportunities to take
part in sport are of a high quality. Again, this is a statistically significant increase from the
baseline when 47% of respondents agreed that opportunities to take part in sport were of a
high quality.
The significant increases in the results of both these statements since the baseline suggests
that Inclusive Sport projects have provided extended choice and better quality
opportunities for project participants to take part in sport or physical activities than were
available to them previously.
22%
17%
18%
17%
59%
66%
I can take part in the sport of my
choice (316)
Opportunities for me to take part
in sport are of a high quality
(307)
Disagree Neither Agree

26 Findings: Motivation & opportunities | Inclusive Sport Round 1 Evaluation
Over two-fifths of the respondents to the main survey (44%) stated that there were sports
that they would like to try that they have so far been unable to participate in. Respondents
to the main survey could select more than one type of sport which they wanted to
participate in but had been unable to. The five most cited sports were basketball
(mentioned by 25 participants), swimming (12) and cricket, football and tennis (all
mentioned by 11 respondents), but over 30 sports were listed in total reflecting the wide
range of sports that respondents were interested in.
Figure 12 illustrates the sports that respondents would like to try but have yet to have the
opportunity to do so. The larger the print of the sport, the greater the number of
respondents who cited this sport as something they want to try.
Figure 12: Sports wanting to try (main survey)
Further analysis reveals that, of the 146 respondents to the main survey who would like to try another sport, over half of them (53%) agreed that they can currently take part in the sport of their choice, compared to 24% who disagreed that they could. This may suggest that around half of those who want to try another sport are already participating in a sport and seeking to do more sport or different types of physical activities.

Inclusive Sport Round 1 Evaluation | Findings: Motivation & opportunities 27
Sporting venues
Access to sport can be a key barrier to participation. Indeed, over a quarter (27%) of
respondents to the main survey disagreed that they can take part in sport at a venue of
their choice and a further 27% were undecided – almost half (46%) agreed that they could
take part in a sport at a venue of their choice.
Figure 13: Access to venue of choice (main survey) (Sample base = 303)
Compared to the baseline (33%), there has been a statistically significant increase (up by 13
percentage points) in the proportion of participants who agree that they can take part in a
sport at a venue of their choice. This suggests that Inclusive Sport provides project
participants with a greater variety of choice than previous provision did. Indeed, the
qualitative research details the lack of provision in project local areas prior to Inclusive
Sport:
(What was the provision like before Inclusive Sport?) Before X got involved...very, very
poor. And that's for both kids and for adults. And that's the thing that kept coming back:
there is nothing else in this area
— Inclusive Sport Coach
I've been doing this job for a long time now, and we used to run the playground to
podium, and when that programme disappeared, there was nothing for disabled kids or
adults to take part in.
— British Athletics
27% 27% 46% I can take part in sport at a venue of
my choice
Disagree Neither Agree

28 findings: barriers beyond choice | Inclusive Sport Round 1 Evaluation
07. FINDINGS: BARRIERS BEYOND CHOICE
Whilst choice of sport and venue are important in encouraging
participation and motivation, there are many barriers that can
hinder a disabled person’s access to sport. This chapter
examines those barriers.
All participants responding to the main survey were asked to what extent they felt that a
specified factor was a barrier to them trying a new sport. The rating scale provided had 7
points where 1 was ‘not at all a barrier’ and 7 was ‘to a great extent’. Figure 14 illustrates
the results. Ratings 1-3 were combined to produce a measure for ‘not a problem’ and 5-7
combined into a single score for ‘a problem’. The neither/nor (N/N) scores are represented
by those who selected the median rank of ‘4’.
Figure 14: Extent to which barrier is a problem (main survey) (Sample bases in parentheses)
Figure 14 illustrates that each of the barriers is considered as ‘not a problem’ by more than
half of respondents, with cost related barriers the least likely to be a concern. Further
analysis reveals that 25% of respondents to the main Year 1 survey felt that either the cost
of transport or participation in the activity was a barrier.
56%
53%
54%
57%
54%
62%
64%
61%
63%
10%
14%
17%
15%
19%
11%
13%
17%
15%
34%
33%
29%
28%
27%
26%
24%
23%
22%
0% 20% 40% 60% 80% 100%
Attitudes of others (302)
Lack of confidence: I don't know if I am physically
able to do the sport (303)
Geography / location: The sport I want to do is too
far away from me (292)
Lack of appropriate / accessible facilities or
equipment (301)
Unaware of where to look to find out about it (302)
Lack of support: I don't have the support of others
to do it (305)
Health and Safety (302)
Cost: It is too expensive to travel to the sport I
want to do (293)
Cost: Participating in the activity itself is too
expensive (293)
Not a Problem N/N A Problem

Inclusive Sport Round 1 Evaluation | findings: barriers beyond choice 29
In the baseline survey respondents were asked to what extent the expense of trying a sport
was a barrier with 36% saying that it was a problem for them. In the Year 1 survey the
examination of ‘expense’ as a barrier was split between travel to an activity and the cost of
the activity itself. Whilst the change to the Year 1 survey does not make it possible for a
direct comparison with the baseline, it does infer that there has been an 11 percentage
point reduction in the proportion of participants who consider cost to be barrier to
participation. It also implies that where cost is a problem it applies to both the travel costs
and the costs of participating in the activity itself, rather than just one or other aspect.
The barrier cited as ‘a problem’ by the greatest proportion of respondents (34%) to the year
1 survey is the attitudes of others. This is a change from the baseline survey where practical
barriers were found to be the main barriers to taking part. As well as cost, other practical
barriers cited in the baseline survey included ‘the sport I want to do is too far away from
me’ (40%) and ‘lack of appropriate / accessible facilities or equipment’ (36%). After one
year, these barriers have seen significant reductions in the proportion of respondents who
cite them as a problem (11 and 8 percentage point reductions respectively) whilst
psychological factors such as the attitude of others or lacking the confidence to participate
have remained at similar levels.
This shift in response may indicate that the Inclusive Sport programme is making progress
in providing suitable facilities locally for project participants to access sport and thereby
tackling the practical barriers. Qualitative research revealed that the primary reasons for
not participating in sport prior to Inclusive Sport were: being conscious of people staring,
not having support in mainstream facilities and not having a ‘level playing field’ in terms of
access and competition. The majority of Inclusive Sport projects are yet to tackle these
more psychological barriers.
Figure 15 below illustrates the comparative results for respondents completing the picture-
based survey1617 now and at the baseline. As the figure shows, the barriers after a year of
Inclusive Sport delivery have remained similar. However, some of the barriers have shown
a reduction in the proportion of respondents who now consider them to be an issue; the
most significant changes are:
— A reduction of 8 percentage points in the proportion of respondents citing lack of support as
a barrier (49% at baseline to 41% at Year 1); and
— A reduction of 7 percentage points in the proportion of respondents citing ‘lack of
opportunities’ to be a barrier (9% at baseline and 2% at Year 1).
16 The top three responses are pre-provided answers the remaining are coded from the option to state any additional barriers.
17 The picture-based survey is not comparable to the main survey in regards to assessing barriers to participation. This is due to the need
to make the survey accessible to those with learning disabilities. Please refer to the appendices for copies of the surveys.

30 findings: barriers beyond choice | Inclusive Sport Round 1 Evaluation
These results infer that the Inclusive Sport’s projects are positively contributing to the
reduction of known barriers that impede disabled people from participating in sport.
Figure 15: Barriers to participation (picture-based survey) (Sample bases are varied)
41%
38%
35%
5%
4%
4%
2%
1%
1%
0%
0%
49%
34%
36%
5%
1%
4%
9%
1%
0%
3%
5%
0% 10% 20% 30% 40% 50% 60%
I need help to play the sport. I do not have anyone to
help me.
I do not have transport to get to the sport I want to
play.
Cost. It is too much money.
Time
Confidence
Physical health
Lack of opportunties / knowing where to find
opportunities
Weather
Doesn't enjoy physical activity
Lack of suitable sports
Other
Picture Year 1 Picture Baseline

Inclusive Sport Round 1 Evaluation | findings: positive role models 31
08. FINDINGS: POSITIVE ROLE MODELS
Positive role models are thought to be an important factor in
the sustainability of Inclusive Sport projects. This section
focuses on the proportion of participants in Inclusive Sport
projects who take-up roles as a volunteer or employee to
support sporting activities.
Positive role models
A primary intervention outcome of the Inclusive Sport programme is to see more disabled
people acting as positive role models in the sport workforce. As such, all participants to the
main survey were asked if they currently support sporting activities by being a volunteer or
employee – currently, one in seven respondents do so (14%). This is an increase of 4
percentage points since the baseline (10%). More research will be required to understand
the specific roles that disabled volunteers play in influencing the participation of other
disabled people.
Figure 16: Percentage of participants supporting sporting activities as a volunteer or employee (Sample bases in parentheses)
14%
87%
10%
90%
0% 20% 40% 60% 80% 100%
Yes
No
Year 1 (334) Baseline (1140)

32 Conclusions | Inclusive Sport Round 1 Evaluation
This report provides an overview of the Year 1 position of projects funded through the
Inclusive Sport Programme.
Overall the Year 1 survey results reveal strong positive trends that Inclusive Sport is
moving towards its intended intervention and strategic outcomes. Nearly all participants
(94%) state they participated in sport on at least one day in the last week for 30 minutes or
more (1x30). When compared to participation rates prior to Inclusive Sport this reveals an
increase in 1x30 participation by 35 percentage points (for main survey respondents). As
such, there has been a significant positive increase in the 1x30 sport participation rate for
disabled people within the first year of the programme. In addition, there has been a 20
percentage point increase in the proportion of respondents reporting that they are
participating in higher levels of sport now (1 year into delivery) compared to prior to
Inclusive Sport commencing.
Aside from the increase in participation there has been a 24 percentage point reduction in
the respondents undertaking ‘all’ of their sporting participation at an Inclusive Sport
project. This suggests that the programme is not only increasing sports participation for
disabled people within its funded projects, but may also have enabled participants to
develop their confidence to explore other opportunities outside of the projects. More
research is required to fully understand this impact.
In regards to specific intervention outcomes the results reveal that the programme is
already beginning to deliver positive change for those who attend the projects; in some but
not all instances this is statistically significantly – see the table below.
09. CONCLUSIONS
This chapter outlines our initial conclusions of the Year 1 annual
survey.

Inclusive Sport Round 1 Evaluation | Conclusions 33
Table 3: Outcome achievements18
Desired outcome Supported Findings
More disabled people see
sport as a viable lifestyle
choice for themselves
There has been an increase, since the baseline, in the
proportion of respondents who agree that they enjoy
taking part in sport (up 8 percentage points) and that sport
is an important part of their life (up 6 percentage points).
There are more
opportunities for disabled
people to take part in sport,
in a sport of their choice and
at a venue of their choice
There has been a statistically significant increase in the
proportion of respondents who agree that they can take
part in the sport of their choice (up 14 percentage points)
and the venue of their choice (up 13 percentage points)
since the baseline.
Higher quality opportunities
are available for disabled
people to take part in sport
Since the baseline there has been a statistically significant
increase in the proportion of respondents who agree that
the opportunities for them to take part in sport are of a
high quality (47% (baseline) to 66% (Year 1 survey)).
More disabled people are
acting as positive role
models in the sport
workforce
The number of respondents supporting sporting activities
by being a volunteer or employee has risen from 1 in ten
(10%) to 1 in 7 (14%) within the first year of delivery of the
Inclusive Sport programme.
Inclusive Sport projects are not only making positive trends in increasing opportunities,
quality and participation but are also beginning to reduce the extent to which some of the
more practical barriers to participation exist for participants in projects. There have been
reductions in the proportion of respondents citing ‘lack of support’ and ‘lack of
opportunities’ as barriers to participation and since the baseline, respondents no longer
cite ‘lack of suitable sports’ as a barrier.
The barriers that do exist are predominately in relation to an individual - with lack of
confidence being a primary concern. In addition, over two-fifths (44%) of respondents still
have a sport or physical activity they would like to try that they have so far been unable to
participate in. There were over 30 listed sports at both the baseline and within the Year 1
survey; these lists were not identical. This would suggest that it is unlikely that a particular
sport is not available for a disabled person, but rather that a particular sport may not be in
a location or at a time or cost available to the individual.
18 Please note that the findings within Table 3 are in relation to project participants only and do not suggest a general population impact.

34 Conclusions | Inclusive Sport Round 1 Evaluation
One barrier that the programme could seek to address further is the ‘attitude of others’.
Over a third (34%) of respondents felt this was a problem to participation, making it the
most cited problem of all barriers within the Year 1 survey. This was re-iterated in the case
study research – Inclusive Sport projects provide an environment that participants feel
safe and secure in but outside of the projects this barrier remains. As more respondents
gain confidence in participation outside of the projects it will be important to seek to
influence wider disability awareness within sport to ensure that the gains of the
programme are not lost when the funding ends. However, this may be beyond the scope of
the Inclusive Sport projects themselves.

Inclusive Sport Round 1 Evaluation | Appendix 1: Partnerships 35
10. APPENDIX 1: PARTNERSHIPS
This appendix first appeared in the baseline report for the
national evaluation of Inclusive Sport. Whilst no further
analysis has been carried out, the chapter is included here for
contextual purposes.
Successful delivery of Inclusive Sport projects relies on strong partnerships
created between organisations to attract individuals to take part and support
them in doing so. In this chapter we examine partnership working at Inclusive
Sport funded projects.
Organisational partnerships
Key intervention outcomes are that projects:
— Create sustainable and effective partnerships between the disability and sport sector; and
— Develop effective local, regional and national partnerships that improve the quantity and
quality of sport for disabled people
Analysis of the development plans and ‘review’ reports show that significant partnerships
are both proposed and realised. The table below summarises the types of partnerships
proposed / realised.
Table 4: Analysis of partnerships created
Organisational type Example of partner(s) Purpose of partnership
Day centres, schools,
universities
Olympus Care Services
(Northampton), Belvoir High
School, University of the West of
England, Swiss Cottage Specialist
SEN School
Identify potential participants for project.
Provide location for project.
Sports clubs County Cricket Clubs, Rowing
Clubs, County football
associations
Provision of sporting expertise and
assistance with delivery. Affiliation with
clubs can help attain kitemark standards for
provision.
National sporting
bodies
Special Olympics Operational delivery partners – service level
agreements in place at some.

36 Appendix 1: Partnerships | Inclusive Sport Round 1 Evaluation
Organisational type Example of partner(s) Purpose of partnership
Disability organisations MENCAP, RLSB Access to networks, referral pathways set up.
Local authorities Bradford Council, Brighton &
Hove City Council
Promote partnerships and avoid duplication
of services within geographical areas.
Referral service.
Sport(s) equipment
providers
Rebound UK, Bikeworks,
Pedalpower
Provide information and advice on
purchasing equipment. Assist with training.
Help source and provide equipment.
Disability sports
organisations
Rebound UK Provide training to staff to deliver sessions
Private sector workforce
development
Kruger Associates, Deaf Jobs UK,
CVS, ‘Do it’
Training provided to participants in regards
to volunteering (support into work)
Leisure Centres Circadian, GLL Provide facilities and develop sessions in
partnership
Partnerships are vital throughout the different stages of project set-up and delivery.
Organisations needing to employ new staff for the projects used their partners to recruit to
these positions. An example of this is BID Services, who used their partners to advertise
job vacancies for the project and have since successfully appointed a Deaf Inclusive Sports
Officer and coaches.
Partners have also been utilised in the recruitment and training of volunteers. Many of the
projects have significant elements of voluntary work and without the partnerships in place
to recruit and train them, the projects would not be as successful. An example of this is
Make a Difference, who used their partnership with a local authority to hire volunteers for
the project:
We have recruited volunteer ‘befrienders’ to support participants on the project
through working in partnership with local schools, colleges, universities and voluntary
organisations. With the support of these organisations we have marketed the project at
Open Days, assemblies, drop in and welcome fairs. Volunteers are fundamental to the
delivery and sustainability of the project
— – Inclusive Sport project, 6 Month Review

Inclusive Sport Round 1 Evaluation | Appendix 1: Partnerships 37
Several projects identify and engage disabled people via referrals, relying on partners such
as disability organisations, care services and local authorities. Without these partnerships
in place, getting service users involved in the projects would be extremely difficult. Schools,
universities and day centres have also promoted these projects to disabled people to
increase participation rates. Cambridge House and Talbot for example partnered with a
variety of Special Educational Needs schools and colleges as well as community groups and
local authorities to refer participants to the project.
Partnerships have been pivotal in the delivery of these projects as well as their promotion.
Organisations frequently worked with local sports clubs and leisure centres to provide
suitable coaches, equipment and venues for the projects.
In addition to the partnerships in place at the time the development plans were created,
the projects have also been striving to create new partnerships within the first 6 months.
The organisations listed new partnerships in the 6 month reviews they submitted. Again,
these partners were organisations like charities, schools, NGB’s, disability groups and
sports disability groups and were central to all stages of the projects.

38 Appendix 2: project delivery | Inclusive Sport Round 1 Evaluation
11. APPENDIX 2: PROJECT DELIVERY
This appendix first appeared in the baseline report for the
national evaluation of Inclusive Sport. Whilst no further analysis
has been carried out, the chapter is included here for contextual
purposes.
This chapter focuses on how a project is delivered, its challenges and
successes, as well as its sustainability plans to inform our understanding of
‘what works’.
Sport England has provided the development plans for all the projects involved in
Inclusive Sport. In addition, we have received twenty 6-monthly reviews. These have been
analysed19 to provide us with insight into how each project is aiming to be sustainable and
what the challenges and successes have been so far. Each organisation differs for each of
these factors, but there are similarities and differences between projects that enables us to
paint an overall picture of what is going on, in addition to more detailed and specific
examples from individual projects.
It is impossible to say that every theme discussed in this chapter relates to all of the
projects, as we have only received 20 of the 6-monthly reviews. Likewise, because we do
not have all the reviews, it is likely that there are themes which are not discussed here. A
more thorough evaluation will be possible once we have received and analysed more of the
6-monthly reviews.
Please note: This section provides findings based on reports from project leads as
opposed to individual sports participants.
Sustainability
Sustainability is an important aspect of these projects; if they are going to continue to help
disabled people in the future, they need to design a disability sport infrastructure that will
continue after the funding for the project has ended. There are a number of issues that
need to be overcome in order to ensure sustainability of projects; those immediately
identified are:
— Sporting facilities being willing to fund ‘disability awareness training’ for staff;
— Funding required to advertise activities;
19 Please refer to the methodology section for ‘how’ we analysed the qualitative data

Inclusive Sport Round 1 Evaluation | Appendix 2: project delivery 39
— Funding for volunteers who can support those disabled participants who need help to take
part (entrance fees/expenses etc); and
— Provision of equipment and training individuals as coaches/volunteers.
Therefore, for many projects, the key to sustainability is providing well trained volunteers
who can provide support, coaching, awareness training and other services beyond the
funding period.
However, these resolutions identified by projects as being important to sustainability are
not reflected in the actions they are currently taking to achieve it; for example, the most
frequently cited action (provided within the six monthly reports) is the introduction of fees
for coaching and training sessions. These are generally at a reduced rate so they are
affordable for participants but they are not enough to fully subsidise activities and the
support provision required to run the sessions.
Challenges
Projects that had completed a 6-month review report were asked to state what their key
challenges were to date. The challenges identified by projects completing a 6-month
review report to date are organised by theme below.
PARTNERSHIPS
As previously discussed, partnerships have been highlighted as important for the
recruitment of staff/volunteers, the delivery of activities and for the sustainability of the
projects. It has been challenging for some of the projects when these relationships have not
worked as effectively as hoped. Difficulties in communication and differing priorities have
caused practical issues for several of the organisations. For example, sporting
organisations have had difficulties understanding why care facilities make decisions on
taking part for participants (as opposed to the individual making the decision). Challenges
encountered involving partners commonly resulted in delays that have hindered the
projects’ delivery.
The projects that have suffered delays due to challenges with partners stated in their
6-month reviews that they will work to make up the deficit and time lost. As this
information is coming from the first 6-month reviews, it may be the case that not enough
time has elapsed for the logistics of the partnerships to be fully functional; this may
particularly be the case for new partnerships formed within the first 6 months of the
projects:
It has taken a while to create a network of partners to support the project, which is
something that we have been doing a lot over the past 6 months
— – Inclusive Sport project, 6 Month Review

40 Appendix 2: project delivery | Inclusive Sport Round 1 Evaluation
TRANSPORT
One of the most prominent challenges experienced across the projects has been adequate
transportation for service users to sporting events. Disabled people have experienced
difficulties travelling to and from provision. Five projects specifically mentioned transport
for participants as a challenge in their 6-month reports.
There are several ways in which the projects have been attempting to counter this
challenge. The first and perhaps most obvious counter to this issue is to provide transport
for participants, such as one project which uses its own minibus to pick up and drop off
participants to swimming sessions.
A second workaround is to make the sporting venues more accessible to disabled people by
moving the venue location closer to service users and by setting up at venues with better
transport links. In their 6-month review, one project expressed their intention to set up
new satellite clubs to increase the accessibility of their project.
Another way to deal with the challenge of transport could be to provide information to
service users regarding transportation in the area, as they may have limited knowledge of
how to get to/from venues. One project noted that their participants were having
difficulties in travelling to their sessions and resolved this issue by introducing a ‘buddy’
system so that participants could learn the route to the venue with the help of someone
else:
We have offered rehab support to those who needed it and further supported our
participants by enabling a buddy system with our volunteers until the route was learnt.
— – Inclusive Sport project
This system may work with smaller projects, although a larger project might struggle to
operate a buddy system successfully, depending on the number of volunteers available.
STAFFING
Changes in project staff and staff contracts within the first 6 months have been a challenge
for some of the projects. Some of the project outgoings have increased due to changes in
staff contracts. For example, one project’s costs increased when they introduced Holiday
pay for their staff and another project overspent on their budget for the mileage rate paid
to staff due to increases in the cost of travel.
Other organisations have had difficulty with finding and keeping the staff necessary to run
the projects. One project, for example, experienced difficulties recruiting and deploying
their staff, which took longer than expected. Redundancies and staff leaving also negatively

Inclusive Sport Round 1 Evaluation | Appendix 2: project delivery 41
impacted some of the projects. For example, 2 out of 3 staff initially appointed in another
project had to leave their posts due to unforeseeable circumstances. Another project
reported that they struggled to recruit enough volunteers, which are essential in the
delivery of most of the projects.
SERVICE USER RECRUITMENT AND ENGAGEMENT
There has been a variation in the challenges posed related to the recruitment of service
users. Five organisations mentioned having experienced difficulties in recruiting the
numbers of participants they had hoped for.
The projects have been using multiple methods to combat low participation rates. One
project is trying to forge better networks of partner organisations to engage higher
numbers of disabled people. Another project had difficulties in creating a referral pathway,
such as through GP referrals, which would boost participation. A third project on the other
hand has created online advertisements to market their sports provision.
At least one other project has experienced the reverse problem. An unforeseen increase in
intake has led to insufficient provision of equipment. As such, they reported that
entertaining those not participating had been challenging.
VENUE
3 of the organisations reported that they faced challenges when trying to find suitable
leisure centre venues for the project which would accommodate the needs of the project’s
service users.

42 Appendix 2: project delivery | Inclusive Sport Round 1 Evaluation
Successes
The table below illustrates the outcomes achieved to date, as sourced from the available 6-
month review reports.
Table 5: Successes
Hard Outcomes Soft Outcomes
Repeat business with majority of
organisations – not just one off sessions
Support of local sports clubs
Design of bespoke marketing and
communications plan that will touch over
10,000 across multiple audiences
‘Can do’ and ‘fun’ attitude of coaches and
volunteers
Diverse range of activities offered tailored
to needs of participants and delivered by
qualified coaches.
Participants are happier and have learnt
new skills, have higher confidence, better
health and more self-esteem
Volunteer recruitment – over 50% have a
disability.
High levels of interest from potential
volunteers for some projects:
— We have had an overwhelming
number of people coming forward
wanting to become coaches and
volunteers – unfortunately we have
had to put a few people on the
waiting list as we cannot cater for
everyone due to budget restrictions
– Inclusive Sport project, 6 Month
Review
Launch event had over 100 in attendance
including the local press which raised
profile and awareness.
The inclusion of a disability sport
(wheelchair handball) in the school
curriculum

Inclusive Sport Round 1 Evaluation | Appendix 2: project delivery 43
PARTICIPANT HEALTH AND MENTALITY
Arguably one of the most positive anecdotal outcomes of Inclusive Sport is that service
users are healthier and happier. One example of a project which highlighted benefits to
participant health and mental wellbeing was Henshaw’s Society for Blind People’s Visually
Impaired Adult Football Development. Both the confidence and fitness levels of
participants on Henshaw’s project have increased. These benefits are supported by
testimony from participants on the project, as reported in Henshaw’s case study.
Henshaw’s, alongside a number of other organisations emphasised the development,
commitment, happiness and fitness of participants as successful outcomes in their
6-month reviews. Not all of the 6-month reviews explicitly mentioned these ‘softer’
outcomes, preferring instead to focus on more measurable successes such as numbers of
participants and numbers of sessions held.
To date the project participants have seen an improvement in fitness levels, increased
self-esteem and confidence and some have engaged in additional activities
— – Inclusive Sport project, 6 Month Review

44 Appendix 3: Questionnaires | Inclusive Sport Round 1 Evaluation
12. APPENDIX 3: QUESTIONNAIRES
This appendix provides copies of the questionnaires utilised in
the second wave of the baseline.
The surveys below were utilised in the first annual survey. They were:
1. The picture-based ‘easy read’ survey; and 2. The main survey.

Inclusive Sport Round 1 Evaluation | Appendix 3: Questionnaires 45

46 Appendix 3: Questionnaires | Inclusive Sport Round 1 Evaluation

Inclusive Sport Round 1 Evaluation | Appendix 3: Questionnaires 47

48 Appendix 3: Questionnaires | Inclusive Sport Round 1 Evaluation

Inclusive Sport Round 1 Evaluation | Appendix 3: Questionnaires 49

50 Appendix 3: Questionnaires | Inclusive Sport Round 1 Evaluation

Inclusive Sport Round 1 Evaluation | Appendix 3: Questionnaires 51
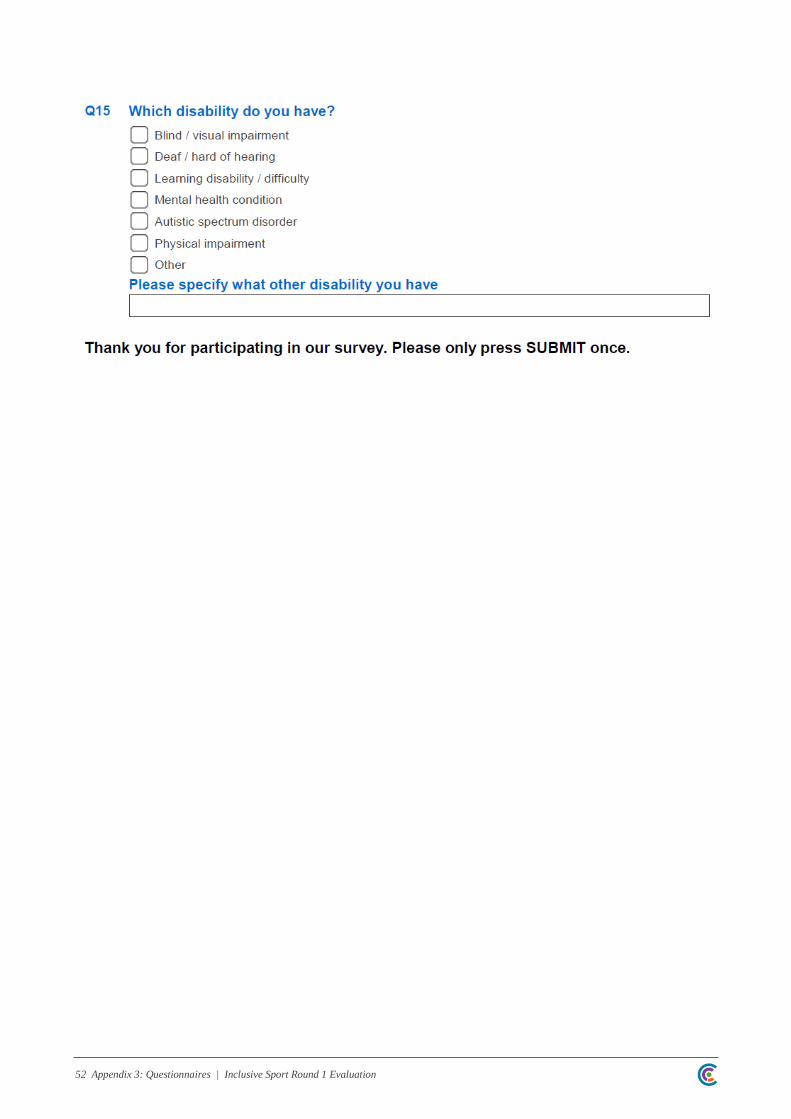
52 Appendix 3: Questionnaires | Inclusive Sport Round 1 Evaluation