Inclusive Globalization - PayPal...emerging markets. Enabling SMEs to participate in cross-border...
61
P. 1 Inclusive Globalization: Small Businesses, Digital Entrepreneurship and Trade in Emerging Markets
Transcript of Inclusive Globalization - PayPal...emerging markets. Enabling SMEs to participate in cross-border...

P. 1
Inclusive Globalization:Small Businesses, Digital Entrepreneurship and Trade in Emerging Markets


ContentsExecutive Summary 4
Introduction 7
Methodolgy 9
Findings 11
Country-Level Findings and Insights 19Argentina 20Colombia 25India 30Kenya 35Vietnam 40South Africa 45
Policy Recommendations 52Doubling down on enabling conditions 53Lowering cross-border trade barriers for SMEs 54
Conclusion 56
P. 4
Executive SummarySkeptics of globalization are weary that the sole winners in emerging markets are large enterprises that can afford the costs associated with selling internationally. The advent and expansion of information and communication technology (ICT) around the world, however, has fundamentally changed the economics of doing business across borders. The youngest startups can now be micro-multinationals. In fact, contrary to what skeptics believe, cross-border trade in the internet economy could yield a more inclusive form of globalization by broadening small- and medium-sized enterprise (SME) participation in the global supply chain of goods and services. This could enable consumers to access goods and services from SMEs in emerging markets, build more inclusive individual economies via SME enablement, diversify export mix by SMEs, strengthen south-south exchanges in global trade flows and, thereby, make the global economy more inclusive.

P. 5
This research study analyzes export data of small businesses using PayPal in Argentina, Colombia, India, Kenya, Vietnam and South Africa, from 2013-2017, and finds evidence that online merchants in emerging markets are realizing the benefits of globalization and trade.
• Export value: Exports by small business-es on the PayPal platform grew by more than 17 times in Kenya, 9 times in Vietnam, 6.2 times in Colombia, 5.9 times in South Africa, 3.4 times in India, and 2.2 times in Argentina.
• Trade partners: The total number of trade corridors connecting these six mar-kets to the rest of the world has increased from 608 in 2013 to 841 in 2017, averaging an annual growth rate of 9.5 percent.
• Survivability: The overall one-year sur-vival rate of PayPal small businesses that exported from these six emerging markets
is 97 percent, which far exceeds the world average of 43 percent.
• Dynamism: On average, new businesses accounted for 46 percent of export growth on the PayPal platform, which is a sign of a high degree of ease for small businesses to enter and participate in cross-border digi-tal commerce.
• Growth: On average, incumbents ac-counted for 54 percent of overall export growth on the PayPal platform, which shows the ability of existing merchants to grow and expand.
Policy recommendations on facilitating the contribution of SMEs in cross-border trade in the internet economy fall into two categories:
1) doubling down on enabling conditions, e.g., ICT, physical and logistical infrastructure;
2) lowering export barriers for SMEs, e.g., expanding de minimis thresholds (DMTs) and implementing Digital Single Window Systems (SWS).
P. 6
SMEs are the backbone of the global economy and the primary provider of employment in emerging markets. Enabling SMEs to participate in cross-border trade closely aligns with the long-term inclusive and sustainable growth agenda of emerging economies. Econom-ic diversification by way of small business enablement will empower people in emerging markets to reap the benefits of a more inclusive, digital, globalized economy.

P. 7
Emerging Markets 4.7%
Advanced Economies 1.96%
the Euro Area 1.52%
G7 1.82%
The average annual growth rate of GDP, from 2013-2017
IntroductionEmerging markets have experienced im-pressive economic growth in recent years. From 2013-2017, the annual growth rate of GDP in emerging markets and developing economies has averaged 4.7 percent, out-pacing that of advanced economies (1.96 percent), the Euro area (1.52 percent) and G7 (1.82 percent).1 Their growth has been closely tied with globalization and trade. Indeed, the engine of globalization has shifted from industrial to emerging coun-tries.2 This trend has the potential to per-sist as emerging markets continue to liber-alize and allow cross-border movement of goods, services, capital and people to fuel productivity growth. Critics of globalization in emerging economies are weary, however, that the sole winners in these markets are large enterprises that can take on the cap-ital costs, establish regional contracts and comply with regulatory requirements as-sociated with selling internationally.3 This paper uses PayPal data to demonstrate that small businesses in emerging econo-mies are also realizing the benefits of glo-balization and trade.
The advent of the internet and the revo-lution in information and communication technologies (ICT) have led to the “death of distance,” redefining the way individuals, firms, and governments assess and pursue economic opportunities in this intercon-nected world.4 Cross-border trade is no longer solely the domain of large enterpris-es. The use of the internet and a whole host of online service providers has fundamen-
tally changed the economics of doing busi-ness across borders, drastically reducing the costs of international transactions and lowering entry barriers for small businesses to launch and reach consumers and mar-kets on a global scale. A study by Martens and Turlea of digital commerce in the EU found that digitization cuts the distance effect of physical flows by two-thirds.5 The smallest startups in emerging markets are now born as digital micro-multinationals, ultimately enabling more to participate in the globalized economy.

P. 8
Digitization is transforming global trade by reducing the cost of marginal produc-tion and distribution. The costs of par-ticipation for individual consumers, small firms and entrepreneurs are also reduced. Digital technology is enabling a broad set of “micro” innovations across borders—micro-multinationals, micro-lending, etc. Digitization also lowers the fixed costs of starting and running a business, by elimi-nating the cost of building and maintaining
a physical storefront and enabling more fixed inputs to be procured and paid for on a marginal basis (e.g., outsourcing le-gal and accounting services online).6 The data in this study offers a window into the expansive nature of trade of the internet economy, which could yield a more inclu-sive form of globalization.

P. 9
$30,000 $3,000,000
This paper series define small businesses as businesses with an annual total payment volume
of between USD 30,000 and 3 million on the PayPal platform
MethodologyThe definition of SMEs, or micro, small, and medium enterprises (MSMEs), varies widely across entities and jurisdictions. In the interest of consistency and for the purpose of comparability across regions in research analysis, this paper series defines small businesses as businesses with an annual total payment volume of between USD 30,000 and USD 3 million on the Pay-Pal platform, for at least one year with-in the 2013-2017 period. There was also a minimum threshold of at least 10 transac-tions during the 12 months leading up to data extraction in April 2018. This report analyzes a sample of cross-border trans-actions on the PayPal platform, conducted by a total of 24,631 small businesses in six emerging markets on the PayPal platform from 2013-2017: Argentina, Colombia, In-dia, Kenya, Vietnam and South Africa.
Results are analyzed in comparison with of-fline exports data from Trade Map. At the two-digit Harmonized System (HS) level, a “PayPal mirror basket” of offline exports was also constructed to exclude export categories that are not typically transact-ed on the PayPal platform, such as oil and gas, mining, and aircrafts, and to include data on offline service exports, in order to extract a reference point that allows for a more accurate and meaningful comparison and interpretation of data on PayPal small businesses.7
In order to estimate the effect of internet access on export volume, propensity score matching (PSM), a statistical matching technique, is applied to analyze a subset of data.
In terms of survivability analysis, a cohort of SMEs that created a PayPal account and started transacting in 2013 was tracked over the 2013-2017 period. A small busi-ness is counted as a “survivor” if there were at least 10 transactions on the Pay-Pal platform in a given year, and if its total
payment volume registered between USD 30,000 and USD 3 million at least one year out of the 2013-2017 period. Country-lev-el comparable on the World Bank Export Dynamics Database is unavailable for the countries included in this study.

P. 10
• Population (2017): World Bank
• GDP per capita (USD; market exchange rate) and Real GDP growth % (historical average, 2013-2017): EIU
• Exports (2017 est.) (billions) and Country rank, by total merchandise exports (USD): CIA8
• Trade openness (sum of imports and exports as % of GDP) in 2013 and 2017: UNCTAD9
• Mobile cell phone subscription per 100 inhabitants in 2013 and 2016: ITU10
• Percentage of Individuals using the Internet in 2013 and 2016: ITU
• Country value in the UNCTAD B2C E-commerce Index (0-100): The UNCTAD index measures on a scale from 0 (worst) to 100 (best) an economy’s readiness and capacity to support online trade, and reflects the processes involved in an online shopping B2C transaction, including internet use, account penetration, and postal reliability.
• Country value in the ITU ICT Development Index (0-10): This composite index measures on a scale from 0 (worst) to 10 (best) developments in information and communication technology over time, including ICT access, use, and skills development.
• Country value in the WEF11 Networked Readiness Index (1 -7): This index mea-sures on a scale from 1 (worst) to 7 (best), the performance of economies in lever-aging information and communications technologies to boost competitiveness, innovation, and well-being.
Data sources for “Country Profile”
To provide more context to each of the six markets, a “country profile” is put together using data from the World Bank, the Econ-omist Intelligence Unit (EIU), the Central Intelligence Agency (CIA), United Nations
Conference on Trade and Development (UNCTAD), International Telecommunica-tion Union (ITU) and the World Economic Forum (WEF).

P. 11
Kenya exports grew 17 times
South Africa exports grew 5.9 times
India exports grew 3.4 times
Vietnam exports grew 9 times
Argentina exports grew 2.2 times
Colombia exports grew 6.2 times
Export growth between 2013 and 2017, by SMEs using PayPal
ExportsIn terms of exports, the following has been observed across these six markets.
1. Significant growth in export value
• Between 2013-2017, exports by small businesses on the PayPal platform grew by more than 17 times in Kenya, 9 times in Vietnam, 6.2 times in Colombia, 5.9 times in South Africa, 3.4 times in India, and 2.2 times in Argentina. This rate of growth is even more noteworthy in the context of economic challenges in sev-eral of these emerging markets during the 2013-2017 period.
• Strong and consistent year-over-year growth is observed in online ex-port data on the PayPal platform, in contrast with the declines, fluctuations and lower growth rates seen in offline trade data in these emerging markets.
• Exceptionally strong export growth from SMEs in Vietnam and Kenya to developed economies can be observed on the PayPal platform. For exam-ple, exports from Vietnam to Cana-da by SMEs using PayPal, by payment amount, increased by more than 22 times between 2013-2017, averaging 5.6
Findings
Technology enables digital entrepreneurship and SME participation in cross-border trade in emerging markets.

P. 12
Increase in the total number of trade corridors
20172013
841
608
times per year. Exports from SMEs us-ing PayPal in Kenya to U.S., by payment amount, grew by more than 19 times from 2013-2017, averaging 4.8 times per year.
2. Significant increase in the diversity of trade partners:
• The total number of trade corridors connecting these six markets to the rest of the world has increased from 608 in 2013 to 841 in 2017, averaging an annual growth rate of 9.5 percent.

P. 13
Growth in exports by SMEs using PayPal
Markets with less than 20% growth in internet access
Markets with more than 40% growth in internet access
0%
100%
200%
300%
400%
130%
372%
Effect of increase in Internet access on export
In order to estimate the effect of inter-net access on export, propensity score matching (PSM), a statistical matching technique, is applied to analyze a sub-set of data.
The treatment group consists of nine middle-income destination markets in which internet access has increased by more than 40 percent between 2013-2016. The control group consists of nine middle-income destination markets in which internet access increased by less than 20 percent between 2013-2016. Since consumption growth is largely determined by income, gross domestic product (GDP) and GDP growth were used as the matching criteria. After controlling for similar levels of GDP and GDP growth between the treatment and control groups, we compared the
growth in total payment volume on the PayPal platform from 2013-2016 across the two groups.
Results show almost three times as much growth in total payment volume in the treatment group, compared with the control group. Between 2013-2016, exports from these six emerging markets to markets with more than 40 percent increase in internet access grew 372 percent, whereas exports to markets with less than 20 percent in-crease in internet access only grew 130 percent. In other words, a connection between growth in internet access and growth in cross-border trade is ob-served from this analysis, even after controlling for the effect of GDP and GDP growth.

P. 14
0% 25% 50% 75% 100%
Overall one-year survival rate of small business using PayPal in
Argentina, Colombia, Kenya, India, Vietnam, South Africa
World average one-year survival rate of small businesses
97%
43%
Survivability
Despite their disproportionate impor-tance in emerging markets, SMEs are often characterized by churn, i.e., a high level of exit and re-entry, and low rates of surviv-al. Even among SMEs that export, survival rates are low. According to the Interna-tional Trade Center and World Trade Or-ganization, most firms in less developed countries export for only one year, as SMEs tend to export as a reaction to circum-stantial opportunities instead of the out-
Dynamism and growth of digital entrepreneurshipDigital entrepreneurship is marked by dynamism and growth across the markets analyzed. This report looks at the landscape of digital entrepreneurship by breaking down export growth into intensive and extensive growth margins, examining the share of contribution by new entrants and incumbents.
• Dynamism: High extensive margins in-dicate a high degree of ease for new small businesses to enter and participate in cross-border digital commerce. On aver-age, most markets in the study have an extensive margin that is 46 percent, with new entrepreneurs accounting for nearly half of the remarkable growth in total ex-port value on the PayPal platform in these markets.
• Growth: High intensive margins indicate the ability of incumbents to expand. On average, most markets in the study have an intensive margin of 54 percent, with in-cumbent merchants continuing to make meaningful contributions to expansion in overall cross-border trade.
come of long-standing relationships with customers.12 A survivability analysis in this study shows that the overall one-year sur-vival rate of PayPal small businesses that exported from these six emerging markets is 97 percent, which far exceeds the world average of only 43 percent.13 Moreover, 75 percent of SMEs that started transacting and exporting using PayPal in these six markets in 2013 remained active in 2017.

P. 15
ImplicationsBased on our findings and research, there are four implications that cut across emerging markets:
Goods and services can now be digitally or-dered, platform-enabled and digitally de-livered. Small businesses can easily reach customers and scale their presence in in-ternational markets around the world. This is integral to the continued development of emerging markets, where infrastructure constraints have historically been signifi-cant and logistical costs high.
Small businesses are the backbone of com-munities and economies around the world, and they make outsized contributions in terms of employment, job creation and economic activities, especially in emerg-ing markets. World Bank statistics show that small businesses in developing econ-omies contribute more than 60 percent of gross domestic product (GDP).14 A study by the International Finance Corporation (IFC) shows that SMEs represent, on aver-age, about 66 percent of permanent, full-time employment in developing countries, which understates SME contribution be-
1. Broadening SME Participation in the Global Supply Chain of Goods and Services
2. Elevating Consumer Choice and Benefits to an Unprecedented Level
Consumers in more countries can now enjoy goods of greater variety from emerging markets that have historically been less accessible.17 Digital marketplaces such as Etsy enable a global audience to enjoy niche products handcrafted by artisans that were previously unavailable or even unknowable. Also, digital commerce platforms make price and product information available, reducing search costs and facilitating purchase for consumers around the world.
cause data on informal businesses is ex-cluded.15
The level of SME involvement in direct ex-ports varies significantly across developing economies, with the highest level record-ed in Developing Europe, where SMEs ac-counted for 28 percent of overall sales, fol-lowed by 16 percent in the Middle East and 8.7 percent in Developing Asia.16 With digi-tal technology, more SMEs can participate in cross-border trade and scale their mar-ket presence in the global internet econo-my at lower cost and with greater ease.

P. 16
3. Building Inclusive Individual Economies via SME Enablement
Boosting digital technology-enabled SME exports can also broaden an economy’s production base and diversify its sources of income and economic growth, which in-creases an individual economy’s strength and competitiveness, and closely aligns with the inclusive and sustainable growth agenda of many emerging markets. For example, the uncertainty and volatility of commodity prices have proven the impor-tance and urgency of economic diversifica-tion. Argentina and Colombia would benefit from reducing reliance on the commodities industry as the main source of income and economic growth. Some other economies may be shifting away from agriculture to a wider range of sectors and markets, such as Kenya and India. Given the emergence of regional and global value chains (GVCs) enabled by digital technology, emerging markets are in a position to export tasks and services, broaden the base of produc-tion, and make growth more inclusive in new and important ways.
Moreover, women play a significant role in small businesses. Women-owned busi-nesses make up nearly 32-39 percent of micro SMEs, 30-36 percent of small firms
and 17-21 percent of medium-sized com-panies.18 In emerging markets, women are also more likely to operate smaller firms in the informal sector than their male coun-terparts.19 Technology-enabled SME trade is an exciting opportunity for women en-trepreneurs, as technology itself does not carry gender bias and may even help lev-el the playing field and make economic growth more inclusive.
Economic diversification by way of small business enablement may well be part of the solutions needed to make these indi-vidual economies more resilient, and reap the benefits of a more inclusive, digital, globalized economy.
4. Making Trade More Inclusive
Digital technology has made global trade more inclusive as historically untradeable services become exportable by SMEs in emerging markets, which diversifies their export portfolio and brings them further into the fold of the global economy. Since the turn of the millennium, there has been a significant departure from historical pat-
terns of north-south trade (trade between developed and emerging economies). In terms of the composition of exports, emerging markets have been shifting away from primary commodities and re-source-based products, which have histor-ically been exported to trade for more skill- and technology-intensive manufactures
P. 17
from developed economies in the global North.20 One reason behind these import-ant and complex trends is the emergence and spread of global value chains (GVCs). GVCs typically involve multiple countries in different stages of the production pro-cesses and networks, resulting in fragmen-tation of production, outsourcing and off-shoring—hyper-specialized exporting that is traditionally associated with primary producers.21
Most of the top 10 buyer markets for goods and services exported by SMEs from the six emerging markets in this PayPal study are developed economies in the global North, and a majority of trade is concentrated in north-south flows. The U.S. is by far the most popular buyer market, followed by Great Britain, Australia and Canada. More data is needed to draw definitive conclu-sions, but what can be observed from the dataset in this study is early signs of increase in service exports from SMEs in emerging markets to customers in devel-oped economies. The top four defined ex-port categories with the highest year-over-year growth rate by total payments amount are all services: computer software record, computer network/information services, advertising services and professional ser-vices. This may reflect the practices of outsourcing and offshoring of production processes in ways that are common in the framework of GVCs. For example, comput-er network/information services exported by SMEs in the six studied markets could be the kind of hyper-specialized export-ing used as inputs for a larger production network in developed economies. In fact, computer network/information services
have been one of the fastest growing SME export categories on the PayPal platform, by total payments amount, across all six markets every year from 2013-2017. This is an interesting trend to observe in the future, as only a limited set of services, such as travel and financial services, have been historically traded across borders. As digital technology enables historically un-tradeable services, such as advertising, ed-ucation and healthcare, to be exported by

P. 18
Average year-over-year growth rate of north-south and south-south trade on PayPal platform
North-south trade South-south trade
41% 42%
SMEs in emerging economies, we can ex-pect to see a more diversified export port-folio by SMEs in the global South, and to see them more deeply embedded in GVCs.
Another relevant trend to watch is the soaring volume of digital and virtual goods and services, such as music, e-books, soft-ware, games, movies, etc. The share of in-ternational streaming customers for Net-flix grew from 25 percent in 2013 to over 50 percent in 2017.22 The consumption of digital content is set to increase, as smart-phones become the primary computing technology globally. There are also hun-dreds of thousands of small app develop-ers and software manufacturers in emerg-ing markets that benefit from the ease of access to global customers and participate in cross-border trade more fully.
Another way trade has become more in-clusive in the global economy is the expan-sion of south-south trade. North-south trade and south-south trade analyzed in
this PayPal dataset have been growing at almost the same rate, by an average year-over-year rate of 41 percent and 42 percent, respectively. As internet connectivity and electronic payment systems become more available in emerging markets, and espe-cially if a middle-class, consumption-based economy manifests in these markets, many dormant online trading relationships between merchants and consumers in emerging markets within the global South will become activated and developed. We expect south-south trade flows to grow in absolute terms, and also as a share of glob-al trade flows.23
P. 19
Country-Level Findings and Insights

P. 20
2013 158.35
145.332016
Mobile cell phone subscription per 100 inhabitants
2013 29
262017
Trade openness (sum of imports and exports as percent of GDP)
2013 59.9
70.972016
Percentage of individuals using the internet
Country value in the ITU ICT Development Index
6.2
0 10
Country value in the WEF Networked Readiness Index
3.8
1worst
7best
Country value in the UNCTAD B2C E-commerce Index
51.9
0worst
100best
ARGENTINACountry profile by numbers
Population (2017): 44,271,041GDP per capita (USD; market exchange rate): 14,391Real GDP growth percent (historical average, 2013-2017): 0.7Exports (2017 est.) (billions): $59.69Country rank, by total merchandise exports (USD): 47 out of 225
P. 21
Economy at a glanceArgentina has enjoyed higher GDP per cap-ita compared to many of its neighbors in Latin America, despite challenges of po-litical and macroeconomic instability.24 It has been a relatively closed economy, with its trade-to-GDP ratio averaging about 40 percent during the 2005-2012 period, which is about half the average for emerg-ing market economies.25 In Argentina, bank credit to the private sector is only 17 per-cent of GDP, compared to 118.3 percent in other upper-middle income countries.26 Small businesses account for at least half of GDP in Argentina, yet the credit they receive represents only 3 percent of GDP.27
Cross-border trade stagnated under the Kirchner administration as an extensive network of administrative controls were put in place, in the form of trade barriers, foreign exchange restrictions and cur-rency controls, which undermined com-petitiveness and growth.28 Although part
of the MERCOSUR trade bloc, Argentina has lagged behind other regional peers in trade liberalization, such as the members of the Pacific Alliance—Chile, Mexico, Co-lombia and Peru.29 Two-thirds of Argenti-na’s overall export portfolio is commodi-ties, led by soybean meal (16.9 percent of total exports) and followed by corn (7.39 percent of total exports).30 The duration of this study, from 2013-2017, coincided with when global commodity prices and Argen-tine exports were on a downward trend.31 Faced with steep interest rates and a cur-rency crisis, Argentina recently received a bailout package from the IMF totaling USD 57.1 billion through 2021.

P. 22
Growth rate comparison (2013-2017)
On the PayPal platformDespite instability and trade-related challenges, total goods and services exported by small businesses using PayPal in Argentina, measured by total payment volume, grew 2.2 times from 2013-2017. Such growth is impressive when compared with the decline or slow growth experienced by their offline exporting counterparts:

P. 23
-5-1
20
Change in number of trade partners between 2013-2017
Overall offline exports Offline PayPal mirror basket
SMEs Using PayPal
Number of markets reached by SMEs using PayPal
100108 110 113 120
Moreover, the number of export destinations reached by PayPal small businesses in Ar-gentina increased by 20 percent in the same timeframe, increasing from 100 destination markets in 2013 to 120 in 2017. The growth in the number of trade partners enjoyed by PayPal small businesses is even more remarkable when compared with their offline coun-terparts. While the overall number of destinations for offline exports decreased for Argen-tina as a whole, small businesses that exported using PayPal gained new trade partners.
P. 24
N
I
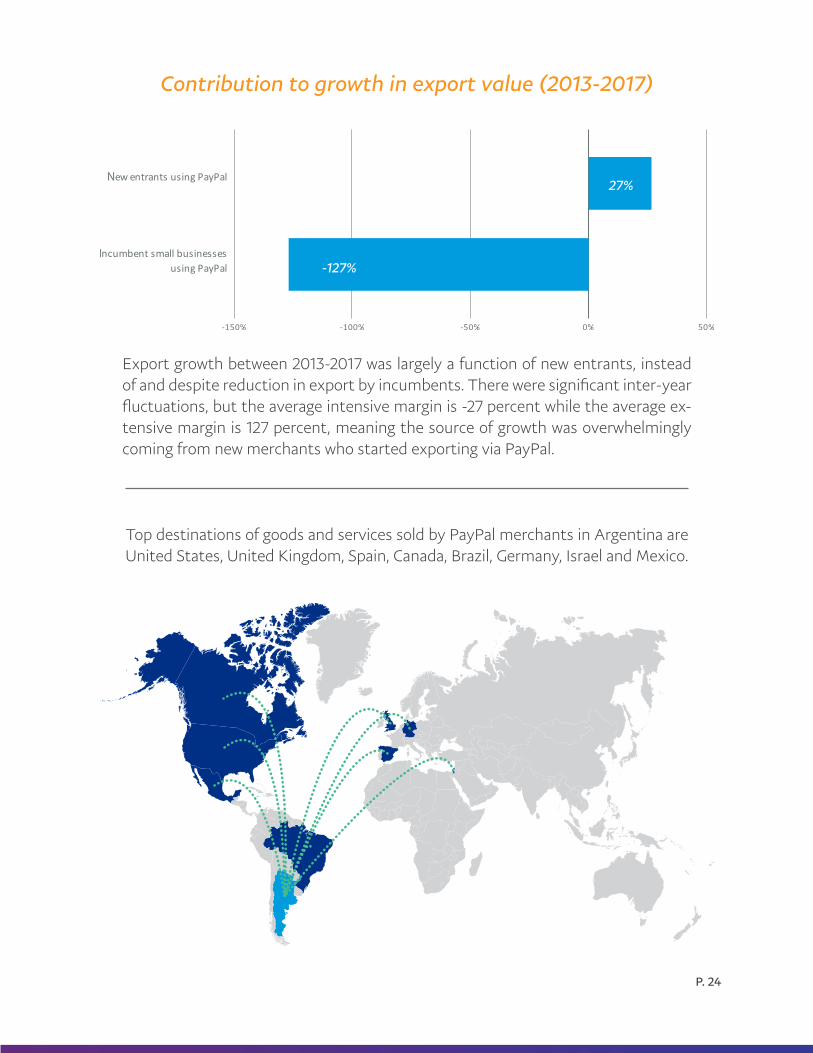
Contribution to growth in export value (2013-2017)
-127%
27%
Top destinations of goods and services sold by PayPal merchants in Argentina are United States, United Kingdom, Spain, Canada, Brazil, Germany, Israel and Mexico.
Export growth between 2013-2017 was largely a function of new entrants, instead of and despite reduction in export by incumbents. There were significant inter-year fluctuations, but the average intensive margin is -27 percent while the average ex-tensive margin is 127 percent, meaning the source of growth was overwhelmingly coming from new merchants who started exporting via PayPal.

P. 25
0
Country value in the WEF Networked Readiness Index
4.1
1worst
7best
Mobile cell phone subscription per 100 inhabitants
2013 106.24
120.622016
Trade openness (sum of imports and exports as percent of GDP)
2013 36
332017
Country value in the UNCTAD B2C E-commerce Index
44.6
0worst
100best
Country value in the ITU ICT Development Index
5.0
100
Percentage of individuals using the internet
201351.7
58.14 2016
COLOMBIACountry profile by numbers
Population (2017): 49,065,615GDP per capita (USD; market exchange rate): 6,409Real GDP growth percent (historical average, 2013-2017): 3.2Exports (2017 est.) (billions): $34.30Country rank, by total merchandise exports (USD): 58 out of 225

P. 26
Economy at a glanceDuring the timeframe of this study, 2013-2017, Colombia’s economy went from en-joying a position of stable and strong growth to grappling with oil price shocks. Oil pric-es plummeted by about 40 percent in the second half of 2014 and slowed econom-ic growth.32 Oil exports account for more than one half of Colombia’s total exports receipts. Oil-related revenues amount to 16 percent of total government revenue, so a drop in oil price would also have seri-ous implications on fiscal revenues.33 After five decades of armed conflict and rounds of negotiations from 2012-2016, the gov-ernment reached a peace accord with the main guerilla group (FARC), potentially creating increased stability in the country.
The number of SMEs (MiPymes) in Co-lombia is an estimated 90,000 companies, which generate 40 percent of the country’s GDP and 80 percent of all jobs. They are focused in the industrial, retail and service industries. The percentage of MiPymes
connected to the internet grew dramati-cally, rising from only 7 percent in 2010 to 60 percent at the close of 2013.34
According to the Colombian Chamber of Electronic Commerce (CCCE), e-commerce grew at an annual rate of 64 percent from 2015-2016, and accounted for 5.61 percent of the country’s GDP in 2017.35 It is also the only country in Latin America with a fully dedicated Ministry of E-Commerce. Fur-thermore, the Ministry of E-Commerce and the Ministry of Technology have creat-ed a non-profit E-Commerce Observatory that monitors and measures the growth of the sector.36

P. 27
Growth rate comparison (2013-2017)
On the PayPal platformTotal goods and services exported by small businesses using PayPal in Colombia, measured by total payment volume, grew 6.2 times from 2013-2017. The year-over-year growth is particularly remarkable when compared with the decline or slow growth experienced by their offline exporting counterparts.

P. 28
Overall offline exports Offline PayPal mirror basket
SMEs Using PayPal
9 10
39
Change in number of trade partners between 2013-2017
Number of markets reached by SMEs using PayPal
69
89 92101
108
Moreover, the number of export destinations reached by PayPal small businesses in Co-lombia increased from 69 in 2013 to 108 in 2017, a 56.6 percent increase. The growth in the number of online trade partners is noteworthy when compared with their offline counter-parts.

P. 29
Contribution to growth in export value (2013-2017)
Incumbent smallbusinesses usingPayPal
32%
New entrantsusing PayPal
68%
Top destinations of goods and services exported by PayPal merchants in Colombia: United States, Mexico, Canada, Ecuador, Spain and United Kingdom.
Growth analysis yields an average intensive margin of 38 percent and an average exten-sive margin of 62 percent. In other words, newcomers drove and accounted for 62 percent of export growth in Colombia on the PayPal platform.

P. 30
Country value in the UNCTAD B2C E-commerce Index
34.0
0worst
100best
Mobile cell phone subscrip-tion per 100 inhabitants
201369.32
85.17 2016
Country value in the ITU ICT Development Index
2.5
100
Country value in the WEF Networked Readiness Index
3.8
1worst
7best
Percentage of individuals using the internet
2013 15.1
29.552016
Trade openness (sum of imports and exports as percent of GDP)
201356
43 2017
INDIACountry profile by numbers
Population (2017): 1,339,180,127GDP per capita (USD; market exchange rate): 1,942Real GDP growth percent (historical average, 2013-2017): 5.8Exports (2017 est.) (billions): $299.30Country rank, by total merchandise exports (USD): 21 out of 225

P. 31
Economy at a glanceIndia boasts the second largest population and the seventh largest economy in the world.37 Its average growth has accelerat-ed steadily across agriculture, industry and services over the past 50 years.38 Since the global financial crisis, economic growth has slowed but still averaged 7.4 percent GDP growth per year.39 Agriculture employs slightly less than half of the workforce, fol-lowed by small businesses, which employ 111 million and account for 32 percent of the economy.40 MSMEs manufacture more than 6,000 products and account for 40 percent of total exports from the country.41 Over the past decade, the growth of the in-ternet economy in India has given rise to a large number of entrepreneurs and en-abled SMEs to take their businesses online and global. Research conducted by Acap-ture in 2014 shows that MSMEs that use e-commerce platforms enjoy five times
more export opportunities than tradition-al enterprises. The research, however, also showed a high concentration with the top five cross-border e-commerce businesses accounting for more than 90 percent of the market share.42 There are many gov-ernment flagship initiatives to boost the sector—such as “Digital India,” which fo-cuses on building digital infrastructure as a core utility—in order to transform India into a digitally empowered economy.43

P. 32
Growth rate comparison (2013-2017)
(East Asia and Paci�c)
On the PayPal platformTotal goods and services exported by small businesses using PayPal in India, measured by total payment volume, grew by 3.4 times from 2013-2017. The rates of year-over-year growth are robust, and especially so when compared with the decline or volatility experi-enced by their offline exporting counterparts.

P. 33
Change in number of trade partners between 2013-2017
Overall offline exports
Offline PayPal mirror basket
SMEs Using PayPal
-6
29
-4
155172 174 175
184
Number of markets reached by SMEs using PayPal
Moreover, PayPal merchants in India have been able to reach consumers in more coun-tries, with the number of export destinations having grown from 155 in 2013 to 184 in 2017, an 18.7 percent increase. The growth in the number of trade partners is noteworthy, particularly when the number of trade partners for their offline counterparts decreased in the same period.

P. 34
Contribution to growth in export value (2013-2017)
Incumbent smallbusinesses usingPayPal
45%
New entrantsusing PayPal
55%
2014
100%
80%
60%
40%
20%
0%
97%
2015
91% 83% 76%
2016 2017
Survival rates
Export growth between 2013-2017 can be almost equally accounted for by existing and new merchants on the PayPal platform in India. The average intensive margin is 45 percent and the average extensive margin is 55 percent, meaning newcomers contrib-uted slightly more to the growth than in-cumbents.
The overall one-year survival rate of small businesses using PayPal in India is 97 percent, which far exceeds the world average of 43 percent. The survival rates in subsequent years have also remained higher than the world average.

P. 35
Top destinations of goods and services sold by PayPal merchants in India: United states, United Kingdom, Australia and Canada.

P. 36
Country value in the ITU ICT Development Index
2.8
10
0
0
Country value in the WEF Networked Readiness Index
3.8
1worst
7best
Trade openness (sum of imports and exports as percent of GDP)
2013 54
382017
Mobile cell phone subscription per 100 inhabitants
201371.01
80.44 2016
Percentage of individuals using the internet
201313
26 2016
Country value in the UNCTAD B2C E-commerce Index
37.9
0worst
100best
KenyaCountry profile by numbers
Population (2017): 49,699,862GDP per capita (USD; market exchange rate): 1,508Real GDP growth percent (historical average, 2013-2017): 5.5 Exports (2017 est.) (billions): $5.8Country rank, by total merchandise exports (USD): 103 out of 255

P. 37
Economy at a glanceKenya is a commercial and cultural hub in East Africa and has averaged over 5 per-cent real GDP growth for the last decade.44 Agriculture is the backbone of the econo-my, contributing over 25 percent of GDP and 75 percent of labor force (on at least a part-time basis), as well as over 50 percent of revenue from exports.45 Kenya’s export portfolio is skewed towards agriculture and horticulture, led by tea and cut flowers, which represent 23 percent and 14 percent of total exports, respectively.46
Small businesses play a key role in Kenya’s economic development and job creation. Estimates vary, but according to govern-ment statistics, total employment of for-mal and informal micro, small and medium enterprises (MSMEs) stands at 14.9 million, which is about 30 percent of total firms, of which micro-sized businesses accounted for 81.1 percent.47 Altogether, MSMEs con-tribute to 33.8 percent of Kenya’s GDP.48
Kenya is home to M-Pesa, a mobile wal-let provider used by 46 percent of Ken-
yans to make mobile payments quickly and easily.49 The strides Kenya has taken in promoting financial inclusion has made extending credit at more affordable rates to SMEs possible. According to the World Bank’s latest Enterprise Surveys, only 15 percent of firms in Kenya identified access to finance as a major constraint in 2013, compared to the Sub-Saharan African re-gional average of 41.5 percent. Moreover, 10 percent of small firms in Kenya export-ed directly, which is almost twice as high as the regional average of 5.2 percent.50
As internet penetration increases, mobile phones become cheaper and the price of connectivity comes down, digital commerce is set to grow. Currently, the percentage of consumers and small and medium-sized businesses engaging in cross-border digital commerce is estimated to be less than 5 percent of the total population.51

P. 38
(Sub-Saharan Africa)
Growth rate comparison (2013-2017)
On the PayPal platformTotal goods and services exported by PayPal small businesses in Kenya, measured by total payment amounts, grew 17 times from 2013-2017. The year-over-year growth rates are even more noteworthy when compared with the decline or slow growth experienced by their offline exporting counterparts.

P. 39
Change in number of trade partners between 2013-2017
Overall offline exports
Offline PayPal mirror basket
SMEs Using PayPal
-4
64
1
55
81
99
112122
Number of markets reached by SMEs using PayPal
The diversity of trade partners also grew at a remarkable rate. The number of export desti-nations reached by PayPal small businesses in Kenya increased by 122 percent in the same timeframe, increasing from 55 destination markets in 2013 to 122 in 2017. The increase in the number of trade partners is significant, especially relative to offline counterparts.

P. 40
Incumbent smallbusinesses usingPayPal
38%
New entrantsusing PayPal
62%
Contribution to growth in export value (2013-2017)
Top destinations of goods and services sold by PayPal merchants in Kenya: United States, United Kingdom, Israel, Canada, Latvia, Cyprus, China and Australia.
Analysis of export growth by PayPal small businesses in Kenya shows an interest-ing deviation from the pattern exhibit-ed by the other five emerging markets in the study. From 2013-2017, the intensive margin averages at 62 percent and the extensive margin averages at 38 percent, meaning existing small businesses—rath-er than newcomers—contributed more to the overall export growth observed on the PayPal platform.

P. 41
0
Country value in the ITU ICT Development Index
4.0
10
Country value in the WEF Networked Readiness Index
3.9
1worst
7best
Country value in the UNCTAD B2C E-commerce Index
43.1
0 worst
100best
Population (2017): 95,540,800GDP per capita (USD; market exchange rate): 2,309Real GDP growth percent (historical average, 2013-2017): 6.2Exports (2017 est.) (billions): $214Country rank, by total merchandise exports (USD): 28 out of 225
Mobile cell phone subscription per 100 inhabitants
2013135.23
127.53 2016Trade openness (sum of imports and exports as percent of GDP)
2013 163
2002017
Percentage of individuals using the internet
201338.5
46.5 2016
VIETNAMCountry profile by numbers

P. 42
Economy at a glanceVietnam has a dynamic economy with a history of strong inclusive growth, averag-ing 6.5 percent per year from 2000-2016.52 The economy has undergone a structural shift from agriculture-driven to manufac-turing- and services-focused, as Vietnam transitioned from a centrally-planned economy to a market-oriented system. Small and medium-sized businesses play an important role in the economy, ac-counting for 98 percent of all companies, 40 percent of GDP and 50 percent of em-ployment.53 About 10 percent of SMEs re-ceive at least 10 percent of their sales from direct exports.54 Vietnam is a highly open economy with a deep commitment to con-tinuing its global economic integration—its trade openness, defined as the sum of imports and exports as percentage of GDP, increased from 163 percent in 2013 to 200
percent in 2017.55 Total exports from Viet-nam have increased at an annualized rate of 15.1 percent from 2011-2016. Most re-cently, its exports are led by broadcasting equipment, which accounts for 16 percent of its total exports, followed by integrated circuits (7.2 percent) and telephones (4.8 percent).56

P. 43
(East Asia and Paci�c)
Growth rate comparison (2013-2017)
On the PayPal platformTotal goods and services exported by small businesses using PayPal in Vietnam, measured by total payment volume, grew more than 9 times from 2013-2017. Such growth is remark-able even in comparison with the strong growth experienced by their offline exporting counterparts.

P. 44
Overall offline exports
Offline PayPal mirror basket
SMEs Using PayPal
-3
37
-3
132146
157 161169
Change in number of trade partners between 2013-2017
The number of export destinations reached by PayPal small businesses in Vietnam in-creased from 132 in 2013 to 169 in 2017, a 28 percent increase. In fact, SMEs on PayPal had more trade partners than their offline counterparts in 2015 and 2016, reaching consumers in 14 and 18 more markets, respectively.
Number of markets reached by SMEs using PayPal

P. 45
2014
100%
80%
60%
40%
20%
0%
94%
2015
84% 77% 69%
2016 2017
Incumbent smallbusinesses usingPayPal
46%
New entrantsusing PayPal
54%
Survival rates
Contribution to growth in export value (2013-2017)
Growth analysis shows existing merchants and newcomers contributed by almost the same amount to growth of total exports on the PayPal platform. Between 2013-2017, the intensive margin averages at 46 per-cent and the extensive margin averages at 54 percent. In other words, newcomers account for slightly more of the growth of exports observed on the PayPal platform in Vietnam.
The overall one-year survival rate of small businesses using PayPal in Vietnam is 94 per-cent, which far exceeds the world average of 43 percent. The survival rates in subsequent years have remained higher than the world average.

P. 46
Top destinations of goods and services sold by PayPal merchants in Vietnam: Unit-ed States, Canada, Australia, United Kingdom, Germany and Israel.

P. 47
Country value in the ITU ICT Development Index
4.7
0 10
Trade openness (sum of imports and exports as percent of GDP)
201364
58 2017
Percentage of individuals using the internet
201346.5
54 2016
Mobile cell phone subscription per 100 inhabitants
2013 142.96
147.132016
Country value in the UNCTAD B2C E-commerce Index
50.3
0worst
100best
4.2
1worst
7best
Country value in the WEF Networked Readiness Index
SOUTH AFRICACountry profile by numbers
Population (2017): 56,717,156GDP per capita (USD; market exchange rate): 6,166Real GDP growth percent (historical average, 2013-2017): 1.5Exports (2017 est.) (billions): $78.25Country rank, by total merchandise exports (USD): 40 out of 225

P. 48
Economy at a glanceThe living conditions of a large portion of the South African population have im-proved since the country’s peaceful polit-ical transition to democracy in 1994, but economic growth has decelerated in re-cent years and South Africa remains one of the most unequal economies with high poverty and unemployment rates.57 South Africa has an abundant supply of natural resources and its export portfolio is heavi-ly weighted towards commodities—led by gold (20 percent), diamonds (10 percent) and platinum (8 percent).58
According to government statistics, the total number of formal and informal mi-cro, small and medium enterprises in South Africa is estimated to be over 2.2 million, accounting for over 14 percent of total employment and over 42 percent of GDP.59 However, a new report by the
Small Business Institute (SBI) in partner-ship with the Small Business Project (SBP) claims the number of formal SMEs stands at only 250,000, and while 98.5 percent of the economy is made up of SMEs, they ac-count for only 28 percent of all jobs.60 The 2030 National Development Plan, which charts out the growth path of the country, specifically identifies small businesses as primary engines of economic growth and empowerment, and sets the goal of gener-ating 90 percent of employment opportu-nities from small businesses.

P. 49
(Sub-Saharan Africa)
Growth rate comparison (2013-2017)
On the PayPal platformMerchants who sell online and internationally are a small minority of the small business community in South Africa. However, a subset of that group of small businesses generated strong growth on the PayPal platform. Total goods and services exported by PayPal small businesses in South Africa, measured by total payment amounts, grew 5.9 times from 2013-2017. Such growth is remarkable, especially relative to the decline and volatility in export growth experienced by their offline exporting counterparts.

P. 50
Overall offline exports
Offline PayPal mirror basket
SMEs Using PayPal
9
41
6
97
118
134140 138
Number of markets reached by SMEs using PayPal
Change in number of trade partners between 2013-2017
Moreover, the number of export destinations reached by small businesses using PayPal in South Africa increased from 97 in 2013 to 138 in 2017, a 42 percent increase. The growth in the number of destination markets reached by small businesses using PayPal is even more significant when compared with offline counterparts.

P. 51
Contribution to growth in export value (2013-2017)
Incumbent smallbusinesses usingPayPal
44%
New entrantsusing PayPal
56%
Top destinations of goods and services sold by PayPal merchants in South Africa: United States, United Kingdom, Australia, Canada and Germany.
Growth analysis shows on balance, ex-isting merchants and newcomers made similar contributions to total exports on the PayPal platform. Between 2013-2017, the intensive margin averages at 44 per-cent and the extensive margin averages at 56 percent. However, it is worth noting that the shares of contribution reversed in 2016. In other words, the intensive margin was higher than extensive margin in the first half of the studied timeframe. Existing merchants accounted for more of the to-tal export growth from 2013-2015, and new merchants accounted for more of the total export growth from 2015-2017.

P. 52
POLICY RECOMMENDATIONS

P. 53
The following policy recommendations are designed to facilitate the contribution of SMEs in cross-border trade in the internet economy, and to enhance inclusiveness in the global economy.
I. Doubling down on enabling conditions • Investing in Information and Commu-nication Technology (ICT) infrastruc-ture: Internet penetration has increased around the world, but there is still tremen-dous room for improvement, especially in emerging markets. For example, internet penetration stood at only 29.5 percent in India in 2016, compared with 88 percent in the U.S.61 Promoting the continued expan-sion of access to the internet at low cost and without gatekeepers is a foundation-al enabling condition, without which small businesses cannot connect to commerce platforms, intermediaries and consumers from around the world. In fact, the benefits of a robust ICT infrastructure go beyond mere internet access and web presence to broader usage of more sophisticated ap-plications, such as cloud computing and enterprise resource planning tools, which could help small businesses operate more efficiently if adopted.62
• Strengthening physical and logistical infrastructure: The low quality of roads, railways, ports and postal systems has been a serious impediment to growth in cross-border trade in emerging economies, especially in a world where speedy deliv-ery has become an increasingly important source of competitiveness. The cost of poor basic physical infrastructure can be signif-icant. For example, in 2013, about 88 per-
cent of small firms in Kenya experienced electrical outages, and the average number of outages in a typical month amounted to 6.5 times, resulting in loss of 6.9 percent of annual sales.63
In contrast to bulk exports by large enter-prises, shipments by small businesses tend to be lower in volume and often consist of single items sent through traditional post networks. Markets with simple, efficient and modernized physical infrastructure, especially international gateways and mul-timodal interfaces, will be most prepared to seize international opportunities more fully, both in terms of exports and imports. Moreover, harmonizing and integrating na-

P. 54
tional postal services, along with promot-ing closer cooperation with private ship-pers, will facilitate more broad-based SME participation in digital cross-border trade.
• Improving SME access to finance: Small businesses are often under-collateralized and have limited credit history, which have typically limited their access to the cap-ital they need to grow and scale.64 Many small businesses in emerging markets are informal and may lack the expertise or bandwidth to produce the requisite finan-cial statements. Credit constraints expe-rienced by small businesses can also be a result of asymmetric information or other
market dysfunctions, such as privileged access enjoyed by state-owned enterpris-es over other firms. The World Bank esti-mates about half of formal SMEs do not have access to formal credit, and an even higher proportion of micro and informal enterprises are credit-constrained. The current credit gap for formal SMEs stands at USD 1.2 trillion, and the total for both formal and informal SMEs can be as high as USD 2.6 trillion.65 Credit expansion, cou-pled with proper safeguards, can bridge or eliminate funding gaps and enable SME development and their participation in cross-border trade.
II. Lowering cross-border trade barriers for SMEs• Simplifying legal, regulatory and pol-icy frameworks: The uncertainty and complexity of regulatory requirements and procedures affect small businesses disproportionately, because they might lack the necessary information, in-house expertise or financial resources, relative to large enterprises. For example, over 20 percent of small firms in Kenya and the greater Sub-Saharan African region identi-fy customs and trade regulations as major constraints.66 Lifting or ameliorating these burdens will help address the administra-tive challenges and concerns that have in-hibited small businesses to formalize, com-pete and participate in cross-border trade.
• Expanding de minimis thresholds (DMTs): Increasing customs import duty and tax exemption thresholds will facili-tate lower duties and fees, less paperwork, less delay, easier product returns, and ulti-mately improve the ease and economics of cross-border trade for small businesses.67
Despite drastic technology-enabled cost reductions, cross-border trade may still not make economic sense for small businesses, if they are at a significant competitive dis-advantage compared with merchants who sell in markets with higher DMTs.

P. 55
• Implementing Digital Single Window Systems (SWS): Digital SWS can reduce the complexity and costs of administrative requirements associated with cross-bor-der trade that disproportionately burden small businesses by providing “a system that receives trade-related information and disseminates it all to relevant govern-mental authorities, thus systematically co-ordinating controls throughout trade pro-cesses.”68 Furthermore, making the digital SWS interoperable between countries, and harmonizing processes such as risk man-agement, data exchange and electronic payment, will further reduce the barriers for SMEs to join the global value chains.69
• Liberalizing services trade: OECD esti-mates show that the trade cost equivalent of services trade barriers largely exceeds the average tariff on traded goods. More-over, an average level of services trade re-strictiveness translates into an additional 7 percent in trade costs for small firms, compared with large enterprises.70 To reap the gains of and to realize the growth po-tential from SME participation in services trade, governments of emerging markets could leverage membership in regional or-ganizations, such as Association of South-east Asian Nations (ASEAN), to harmonize regulations and break down restrictions on broad-based services trade.71
• Breaking down informational barriers: One explanation for the high rates of churn among exporters in developing countries is the lack of reliable information. Without accurate market intelligence, it is hard to assess prospects of profitability and make decisions accordingly.72 Mechanisms such as support centers, online platforms, or demand and supply collaborative networks could be designed to address the market failure of information asymmetry, such that SMEs in emerging markets are able to access and benefit from information on the nature of demand, potential markets, competitors and their products’ compet-itive position, the regulatory framework, and availability of private and public finan-cial resources and support programs, etc.73

P. 56
Moreover, efforts to improve data collection and harmonize definitions, by both the public and private sectors, will enable more robust research analysis, which can in turn support the development of more effective policies. Currently, research analyses are limited by data challenges, one of which associated with this study is the lack of generally agreed upon definitions of “SME” and “digital economy.” For example, under the Micro and Small Enterprises Act of 2002 in Kenya, the parameters of small enterprises are 1) between USD 5,000 and USD 50,000 in annual turnover, and 2) employment of 10-49 people.74 However, in Vietnam, SMEs are defined as enterprises with capital investment of less than 100 mil-lion VND (~USD 4,285), with less than 300 employees in total.75 Data on online and offline activities of SMEs are not always collected, and if collected, not often comparable due to variations in definitions.
In addition, standardized industry and product classifications for internet platforms and associated services do not exist either. There are, therefore, data compilation and mea-surement challenges for digital commerce and their inclusion in national accounts. The OECD surveyed countries on national accounts compilation practices regarding the digital economy in 2016, and the IMF extended the survey to some non-OECD countries in 2017. Only a third of the 40 countries that responded to the surveys collect data on online pur-chases, and only five countries collect separate data on cross-border e-commerce trans-actions. Research on the impact of technology on cross-border trade would benefit greatly from more available, higher-quality, standardized and harmonized data.76
ConclusionSMEs are key engines of growth in emerging markets and, more broadly, the global economy. This study offers some evidence that by democratizing and leveraging digital technology, small businesses in emerging economies are able to reach customers in more markets, survive and thrive, and par-ticipate in cross-border trade. As emerging markets look to the next stage of growth and development, economic diversification by way of SME export enablement may well unlock the potential of a more inclusive, digital and globalized economy.

P. 57
ReferencesThis report was primarily authored by Ivy K. Lau. Economic research support was provided by Kornel Mahl-stein of Sidley Austin.1 Calculated using data downloaded from International Monetary Fund: “IMF DataMapper,” Interna-tional Monetary Fund, accessed January 4, 2019, https://www.imf.org/external/datamapper/NGDP_RPCH@
WEO/ADVEC/WEOWORLD/OEMDC2 “Outperformers: High-Growth Emerging Economies and the Companies That Propel Them,” McK-insey Global Institute, September 2018, 90, https://www.mckinsey.com/~/media/mckinsey/featured%20insights/innovation/outperformers%20high%20growth%20emerging%20economies%20and%20the%20companies%20that%20propel%20them/mgi-outperformers-full-report-sep-2018.ashx3 Joyce Osland, “The Pros and Cons of Globalization,” Journal of Management Inquiry 12, June 2003, 137-154.4 Cairncross, Frances. “The Death of Distance.” RSA Journal 149, no. 5502 (2002): 40-42. http://www.jstor.org/stable/41380436.5 Bertin Martens and Geomina Turlea, “The Drivers and Impediments for Online Cross-Border Trade in Goods in the EU,” Institute for Prospective Technological Studies, Digital Economy working paper num-ber 2012/1, July 2012.6 “Global Flows in a Digital Age: How Trade, Finance, People, and Data Connect the World Economy,” McKinsey Global Institute, April 2014, 44, https://www.mckinsey.com/~/media/McKinsey/Featured%20Insights/Globalization/Global%20flows%20in%20a%20digital%20age/Global_flows_in_a_digital_age_Full_re-port%20March_2015.ashx.7 The following categories are excluded to create the “PayPal mirror basket”: 01, 02, 03, 04, 05, 06, 07, 10, 16, 23, 26, 27, 28, 29, (30), (31), 36, 38 47,71-76,78-81, 84, 86, 88, 89, 93, 98, 99.8 “The World Factbook Country Comparison: Exports,” Central Intelligence Agency, 2017, https://www.cia.gov/library/publications/the-world-factbook/rankorder/2078rank.html#sf.9 “UNCTAD B2C E-Commerce Index 2017: UNCTAD Technical Notes on ICT for Development,” United Nations Conference on Trade and Development, October 2017, https://unctad.org/en/Publication-
sLibrary/tn_unctad_ict4d09_en.pdf.10 “The ICT Development Index (IDI): Conceptual Framework and Methodology,” International Tele-communications Union, accessed January 4, 2019, https://www.itu.int/en/ITU-D/Statistics/Pages/publica-tions/mis2017/methodology.aspx.11 “Networked Readiness Index 2016,” World Economic Forum, 2016, https://widgets.weforum.org/gitr2016/.12 Marion Jansen, “Aid for Trade and SME Competitiveness” (Presentation, Aid for Trade and SME Competitiveness from International Trade Centre and World Trade Organization, September 10, 2014), https://www.wto.org/english/tratop_e/devel_e/a4t_e/wkshop_oct14_e/jansen_e.pdf.13 “A Trade Data Revolution Is Uncovering Hidden Patterns in Global Export Markets,” The World Bank, September 5, 2018, https://www.worldbank.org/en/news/feature/2018/09/05/a-trade-data-revolu-tion-is-uncovering-hidden-patterns-in-global-export-markets.14 Darlington Dhanah, “Small Businesses and Job Creation in South Africa” (Master mini-diss., Uni-versity of Capetown – GSB, December 2016), https://open.uct.ac.za/bitstream/handle/11427/27441/the-sis_com_2017_dhanah_darlington.pdf?sequence=1.15 “IFC Jobs Study,” International Finance Corporation, January 2013, https://www.ifc.org/wps/wcm/connect/0fe6e2804e2c0a8f8d3bad7a9dd66321/IFC_FULL+JOB+STUDY+REPORT_JAN2013_FINAL.pdf?-
MOD=AJPERES.

P. 58
16 “World Trade Report 2016: Levelling the Trading Field for SMEs,” World Trade Organization, 2016, https://www.wto.org/english/res_e/booksp_e/wtr16-2_e.pdf.17 Seda Ekmen and Güzin Erlat, “Export Diversification and Competitiveness: Intensive and Extensive Margins of Turkey,” Ekonomik Yaklaşım 24(88), 60-61, https://www.ejmanager.com/mn-stemps/94/94-1409704252.pdf?t=1540602012.18 “Strengthening Access to Finance for Women-Owned SMEs in Developing Countries,” Interna-tional Finance Corporation, October 2011, https://www.ifc.org/wps/wcm/connect/a4774a004a3f66539f0f-9f8969adcc27/G20_Women_Report.pdf?MOD=AJPERES.19 “Strengthening Access to Finance for Women-Owned SMEs in Developing Countries,” Interna-tional Finance Corporation, October 2011, https://www.ifc.org/wps/wcm/connect/a4774a004a3f66539f0f-9f8969adcc27/G20_Women_Report.pdf?MOD=AJPERES.20 “Trade and Development Report 2005,” United Nations Conference on Trade and Development, 2005, 129.21 “Global Value Chains and South-South Trade,” United Nations Conference on Trade and Develop-ment, October 2015, https://unctad.org/en/PublicationsLibrary/gdsecidc2015d1_en.pdf.22 Calculations based on data from Netflix 10-K filings: FY 2013, 19-20, https://d18rn0p25nwr6d.cloudfront.net/CIK-0001065280/57bd79de-efe5-4e0a-a1c3-3053fcbb400b.pdf; FY 2017, https://d18rn-0p25nwr6d.cloudfront.net/CIK-0001065280/105c44c4-a362-4ed5-b606-78f512ff277c.pdf.23 “Outperformers: High-Growth Emerging Economies and the Companies That Propel Them,” McKinsey Global Institute, September 2018, https://www.mckinsey.com/~/media/mckinsey/featured%20insights/innovation/outperformers%20high%20growth%20emerging%20economies%20and%20the%20companies%20that%20propel%20them/mgi-outperformers-full-report-sep-2018.ashx.24 “Data: World Bank Country and Lending Groups,” The World Bank, accessed January 4, 2019, https://datahelpdesk.worldbank.org/knowledgebase/articles/906519#High_income.25 “Argentina: Economic Developments,” International Monetary Fund, February 2016, https://www.imf.org/external/pubs/ft/scr/2016/cr1668.pdf.26 “Domestic Credit to Private Sector (% of GDP),” The World Bank, accessed January 4, 2019, https://data.worldbank.org/indicator/FS.AST.PRVT.GD.ZS; “Argentina: 2016 Article IV Consultation—Press Re-lease; Staff Report; and Statement by the Executive Director for Argentina,” International Monetary Fund, November 2016, https://www.imf.org/external/pubs/ft/scr/2016/cr16346.pdf. 27 “Annual Report to the Secretary-General,” United Nations Secretary-General’s Special Advocate, September 2017, 14, https://www.unsgsa.org/files/4915/1853/4029/UNSGSA_report_2017-2.pdf.28 “Argentina: 2016 Article IV Consultation—Press Release; Staff Report; and Statement by the Exec-utiveDirector for Argentina,” International Monetary Fund, November 2016, https://www.imf.org/external/pubs/ft/scr/2016/cr16346.pdf.29 “Argentina: 2016 Article IV Consultation—Press Release; Staff Report; and Statement by the Exec-utiveDirector for Argentina,” International Monetary Fund, November 2016, https://www.imf.org/external/pubs/ft/scr/2016/cr16346.pdf.30 “Argentina: Economic Developments,” International Monetary Fund, February 2016, https://www.imf.org/external/pubs/ft/scr/2016/cr1668.pdf.31 “Commodity Outlooks Market,” The World Bank, October 2017, Table 1, http://pubdocs.worldbank.org/en/743431507927822505/CMO-October-2017-Full-Report.pdf; “Argentina,” The Observatory of Eco-nomic Complexity, accessed January 4, 2019, https://atlas.media.mit.edu/en/profile/country/arg/.32 “Colombia: 2015 Article IV Consultation—Press Release; Staff Report; and Statement by the Exec-utive Director for Colombia,” International Monetary Fund, June 2015, https://www.imf.org/external/pubs/ft/scr/2015/cr15142.pdf.

P. 59
33 “Colombia: 2014 Article IV Consultation—Staff Report; Press Release; and Statement by the Exec-utive Director for Colombia,” International Monetary Fund, May 2014, https://www.imf.org/external/pubs/ft/scr/2014/cr14141.pdf.34 “Preparing for eCommerce: Colombia,” International Trade Administration, July 12, 2016, https://www.export.gov/article?id=Colombia.35 Cámara Colombiana de Comercio Electrónico, accessed January 4, 2019, https://www.ccce.org.co/.36 Observatorio Ecommerce & Transformación Digital, accessed January 4, 2019, https://observatorio-ecommerce.com/.37 Rob Smith, “The World’s Biggest Economies in 2018,” World Economic Forum, April 18, 2018, https://www.weforum.org/agenda/2018/04/the-worlds-biggest-economies-in-2018/.38 “India’s Growth Story Since the 1990s Remarkably Stable and Resilient,” The World Bank, March 14, 2018, https://www.worldbank.org/en/news/press-release/2018/03/14/india-growth-sto-ry-since-1990s-remarkably-stable-resilient.39 Calculation based on World Bank data: “GDP Growth (Annual %),” The World Bank, accessed Janu-
ary 4, 2019, https://data.worldbank.org/indicator/NY.GDP.MKTP.KD.ZG?end=2017&start=1961&view=chart.40 Krishna Das and Manoj Kumar, “India’s Modi Unveils Aid for Small Businesses as Elections Near,” Reuters, November 2, 2018, https://www.reuters.com/article/us-india-modi-industry/indias-modi-unveils-aid-for-small-businesses-as-elections-near-idUSKCN1N71O5.41 “E-commerce Development Report of the Small and Medium Sized Enterprises of BRICS Coun-tries,” Shanghai Academy of Social Sciences and United Nations Industrial Development Organization, July 9, 2018, 45, https://www.unido.org/sites/default/files/files/2018-07/E-commerce%20Development%20Re-port%20%28SASS%29_09072018.pdf.42 “E-commerce Development Report of the Small and Medium Sized Enterprises of BRICS Coun-tries,” Shanghai Academy of Social Sciences and United Nations Industrial Development Organization, July 9, 2018, https://www.unido.org/sites/default/files/files/2018-07/E-commerce%20Development%20Re-port%20%28SASS%29_09072018.pdf.43 “E-commerce Development Report of the Small and Medium Sized Enterprises of BRICS Coun-tries,” Shanghai Academy of Social Sciences and United Nations Industrial Development Organization, July 9, 2018, 48-50, https://www.unido.org/sites/default/files/files/2018-07/E-commerce%20Development%20Report%20%28SASS%29_09072018.pdf.44 Calculation based on World Bank data: “GDP Growth (Annual %),” The World Bank, accessed Janu-ary 4, 2019, https://data.worldbank.org/indicator/NY.GDP.MKTP.KD.ZG?end=2017&start=1961&view=chart.45 “Kenya Economic Outlook 2016: The Story Behind the Numbers,” Deloitte, June 2016, 15, https://www2.deloitte.com/content/dam/Deloitte/ke/Documents/tax/Economic%20Outlook%202016%20KE.pdf.46 “Kenya,” The Observatory of Economic Complexity, accessed January 4, 2019, https://atlas.media.mit.edu/en/profile/country/ken/.47 “2016 MSME Basic Report,” Kenya National Bureau of Statistics, September 2016, 55, https://www.knbs.or.ke/download/2016-msme-basic-report/.48 “2016 MSME Basic Report,” Kenya National Bureau of Statistics, September 2016, 76, https://www.knbs.or.ke/download/2016-msme-basic-report/.49 Calculations based on Communications Authority of Kenya report: “First Quarter Sector Statistics Report for the Financial Year 2017/2018,” Communications Authority of Kenya, September 2017, https://ca.go.ke/wp-content/uploads/2018/02/Sector-Statistics-Report-Q1-2017-18.pdf.50 “Enterprise Surveys: Kenya (2013),” World Bank Group, accessed January 4, 2019, http://www.enter-prisesurveys.org/data/exploreeconomies/2013/kenya.51 “Preparing for eCommerce: Kenya,” International Trade Administration, July 15, 2016, https://www.export.gov/article?id=Kenya.

P. 60
52 “Vietnam: 2018 Article IV Consultation-Press Release and Staff Report,” International Monetary Fund, July 10, 2018, https://www.imf.org/en/Publications/CR/Issues/2018/07/10/Vietnam-2018-Article-IV-Consultation-Press-Release-and-Staff-Report-46064.53 Dezan Shira et al., “Facilitating SME Growth in Vietnam,” Vietnam Briefing, October 27, 2017, https://www.vietnam-briefing.com/news/facilitating-sme-growth-vietnam.html/; “SME Vietnam Net-work to Connect and Support SMEs,” Viet Nam News, October 22, 2017, https://vietnamnews.vn/econo-my/416041/sme-vietnam-network-to-connect-and-support-smes.html#rhKT3MVgrgvwqPQi.97; “Over-view Report: Challenges of small and medium enterprises in Vietnam in meeting the requirements of the Trans-Pacific Partnership Agreement (TPP) on Environment and Corporate Social Responsibility,” Associ-ation of Southeast Asian Nations, accessed January 4, 2019, https://www.asean-csr-network.org/c/images/small_grants_fund/Round_3/Annex_D1.Research-report_CECR.pdf.54 “Enterprise Surveys: Vietnam (2015),” World Bank Group, accessed January 4, 2019, http://www.enterprisesurveys.org/data/exploreeconomies/2015/vietnam#trade--size.55 “General Profile: Viet Nam,” United Nations Conference on Trade and Development, accessed Jan-uary 4, 2019, http://unctadstat.unctad.org/CountryProfile/GeneralProfile/en-GB/704/index.html.56 “Vietnam,” The Observatory of Economic Complexity, accessed January 4, 2019, https://atlas.me-dia.mit.edu/en/profile/country/vnm/.57 “The World Bank in South Africa,” The World Bank, October 31, 2018, https://www.worldbank.org/en/country/southafrica/overview.58 “South Africa,” The Observatory of Economic Complexity, accessed January 4, 2019, https://atlas.media.mit.edu/en/profile/country/zaf/.59 “The Small, Medium and Micro Enterprises of South Africa,” Bureau for Economic Research, Re-search Note 2015, no. 1, January 2016, http://www.seda.org.za/publications/publications/the%20small,%20medium%20and%20micro%20enterprise%20sector%20of%20south%20africa%20commissioned%20by%20seda.pdf.60 “The Alarming Truth About the Number of Small Businesses in South Africa,” BusinessTech, July 25, 2018, https://businesstech.co.za/news/business/260797/the-alarming-truth-about-the-number-of-small-businesses-in-south-africa/; Jana Marais, “SA ‘Completely Out of Step’ With Global SME Growth Trends,” Business Day, July 25, 2018,https://www.businesslive.co.za/bd/business-and-economy/2018-07-25-sa-completely-out-of-step-with-global-sme-growth-trends/.61 Newley Purnell, “Two Years Ago, India Lacked Fast, Cheap Internet—One Billionaire Changed All That,” The Wall Street Journal, September 5, 2018, https://www.wsj.com/articles/two-years-ago-india-lacked-fast-cheap-internetone-billionaire-changed-all-that-1536159916.62 “Meeting of the OECD Council at Ministerial Level: Enhancing the Contributionsof SMEs in a Global and Digitalised Economy,” Organisation for Economic Co-operation and Development,
August 2017, https://www.oecd.org/mcm/documents/C-MIN-2017-8-EN.pdf.63 “Enterprise Surveys: Kenya (2013),” World Bank Group, accessed January 4, 2019, http://www.enter-prisesurveys.org/data/exploreeconomies/2013/kenya.64 “New Approaches to SME and Entrepreneurship Financing: Broadening the Range of Instruments,” Organisation for Economic Co-operation and Development, February 2015, https://www.oecd.org/cfe/smes/New-Approaches-SME-full-report.pdf.65 “Small and Medium Enterprises (SMEs) Finance,” The World Bank, accessed January 4, 2019, https://www.worldbank.org/en/topic/smefinance.66 “Enterprise Surveys: Kenya (2013),” World Bank Group, accessed January 4, 2019, http://www.enter-prisesurveys.org/data/exploreeconomies/2013/kenya#finance--size.

P. 61
67 Olim Latipov, Christine McDaniel, and Simon Schropp, “The De Minimis Threshold in International Trade: The Costs of Being Too Low,” The World Economy, vol. 41, issue 1, October 24, 2017, https://onlineli-brary.wiley.com/doi/full/10.1111/twec.12577?cookieSet=1.68 “Doing Business 2017: Equal Opportunity for All,” The World Bank, 14th edition, 2017, http://docu-ments.worldbank.org/curated/en/172361477516970361/pdf/109551-REVISED-PUBLIC.pdf.69 “Study on Single Window Systems’ International Interoperability: Key Issues for Its Implemen-tation,” Asia-Pacific Economic Cooperation, August 2018, https://www.apec.org/Publications/2018/08/Study-on-Single-Window-Systems-International-Interoperability.70 “OECD Services Trade Restrictiveness Index,” Organisation for Economic Co-operation and Devel-opment, March 2018, http://www.oecd.org/tad/policynotes/oecd-services-trade-restrictiveness-index-poli-cy-note.pdf.71 “Vietnam 2035: Toward Prosperity, Creativity, Equity, and Democracy,” The World Bank, 2016, 155, https://openknowledge.worldbank.org/handle/10986/23724?locale-attribute=fr.72 “A Trade Data Revolution Is Uncovering Hidden Patterns in Global Export Markets,” The World Bank, September 5, 2018, https://www.worldbank.org/en/news/feature/2018/09/05/a-trade-data-revolu-tion-is-uncovering-hidden-patterns-in-global-export-markets.73 Uri Dadush et al., “What Companies Want from the World Trading System,” World Economic Fo-rum, September 2015, http://www3.weforum.org/docs/WEF_GAC_Trade_II_2015.pdf.74 Victor Otieno, “Kenyan SMEs Need More Than ‘Doing Business’ Ranking,” Business Daily, Decem-ber 21, 2017, https://www.businessdailyafrica.com/analysis/Kenyan-SMEs-need-more-than--Doing-Busi-ness--ranking-/539548-4238042-122yfrc/index.html.75 “Overview Report: Challenges of Small and Medium Enterprises in Vietnam in Meeting the Re-quirements of the Trans-Pacific Partnership Agreement (TPP) on Environment and Corporate Social Responsibility,” Association of Southeast Asian Nations, accessed January 4, 2019, https://www.ase-an-csr-network.org/c/images/small_grants_fund/Round_3/Annex_D1.Research-report_CECR.pdf https://www.vietnam-briefing.com/news/facilitating-sme-growth-vietnam.html/.76 “Policy Papers: Measuring the Digital Economy,” International Monetary Fund, April 5, 2018, https://www.imf.org/en/Publications/Policy-Papers/Issues/2018/04/03/022818-measuring-the-digi-tal-economy.