INCLUSION CONTROL MODEL IN THE LADLE · PDF file1.1 Modern Iron and Steelmaking 1 1.2...
151
INCLUSION CONTROL MODEL IN THE LADLE METALLURGY FURNACE
Transcript of INCLUSION CONTROL MODEL IN THE LADLE · PDF file1.1 Modern Iron and Steelmaking 1 1.2...

INCLUSION CONTROL MODEL IN THE LADLE METALLURGY FURNACE

Master Thesis- J. Pérez McMaster University- Materials Science and Engineering
Final Report- Steelmaking Course i
INCLUSION CONTROL MODEL IN THE LADLE METALLURGY FURNACE
By
JORGELINA PÉREZ, Chemical Eng.
A Thesis
Submitted to the School of Graduate Studies
in Partial Fulfillment of the Requirements
for the Degree
Master of Science
McMaster University
© Copyright by Jorgelina Pérez, Apr 2012

Master Thesis- J. Pérez McMaster University- Materials Science and Engineering
Final Report- Steelmaking Course ii
MASTER OF SCIENCE (2011) McMaster University
(Materials Science and Engineering) Hamilton, Ontario, Canada
TITLE: Inclusion Control Model in Ladle Metallurgy Furnace
AUTHOR: Jorgelina Pérez (Chemical Engineer, Universidad Nacional de Córdoba, Argentina)
SUPERVISOR: Dr Gordon A. Irons
NUMBER OF PAGES: xix, 131

Master Thesis- J. Pérez McMaster University- Materials Science and Engineering
Final Report- Steelmaking Course iii
ABSTRACT
In Secondary Steelmaking Processes, one of the most used technologies
is the Ladle Metallurgy Furnace (LMF). This unit operation enables the
adjustment of the chemical composition by ferroalloy addition, electrical reheating
to the aim temperature, desulphurization and float out of the inclusions produced
during steel deoxidation.
The inclusions are harmful to the steel cleanliness. Process parameters
such as stirring and steel and slag oxidation must be controlled to obtain a final
number of inclusions in the steel whose size is smaller than the critical size for
each steel product.
This thesis concerns the development of a mathematical model to predict
inclusion control during the ladle metallurgy process. Three parameters are
evaluated, the initial steel oxidation level, the impact of the slag oxidation level on
the reoxidation, and the stirring power with a double effect: to float out inclusions
and produce reoxidation. The results of the model were validated with 20
samples taken in 4 heats in the Ternium Siderar plant. The model results were
consistent with experimental data.
Several alternatives were evaluated to illustrate the effect of the main
parameters on the steel cleanliness control in a ladle metallurgy process.

Master Thesis- J. Pérez McMaster University- Materials Science and Engineering
Final Report- Steelmaking Course iv
ACKNOWLEDGMENTS
These projects gave me the possibility of enriching my technical
knowledge and strengthen the personal ties with other companies and a different
culture.
The results of this thesis could not have been achieved without the
financial support of my company, my supervisor’s guidance and the unconditional
support of my family.
I want to thank Ternium Siderar and mainly my bosses Alfredo Rabasedas
and Marcelo Chara for giving me the support to start as a visiting researcher in
McMaster University and then approving my master program.
My collegues from Ternium, specially Walter Balante and Roberto Donayo
who helped me during the thesis facilitating me to take samples from the
industrial trials, the laboratory work and replacing me during my absences to
study or travel to Canada.
Special thanks are owed to Dr Ken Coley and Dr Gordon Irons for allowing
me to do the master program as a part-time student from another country.
Sincere and grateful acknowledgment to Dr Irons for its patience, supervising
support and inspiring discussion.
My husband, Pablo, deserves my deepest gratitude for motivating me to
achieve this project agreeing to move to Canada and supporting me in every
moment. To my daughter Bernardita who lived the cultural change and to my

Master Thesis- J. Pérez McMaster University- Materials Science and Engineering
Final Report- Steelmaking Course v
little daughter Mercedes who was born during this project, both understanding
my absences in several moments so as to complete this thesis.

Master Thesis- J. Pérez McMaster University- Materials Science and Engineering
Final Report- Steelmaking Course vi
TABLE OF CONTENTS
Chapter 1 Introduction 1
1.1 Modern Iron and Steelmaking 1
1.2 Secondary Metallurgy Process 2
1.3 Ladle Metallurgy Furnace 7
1.4 Current State of the Art 9
1.5 Objectives of the Research 10
1.6 Organization of the Thesis 10
Chapter 2 Inclusion Characterization and Removal Mechanisms 12
2.1 Deoxidation Practice and Inclusion Formation 12
2.2 Clean Steel Concept 14
2.3 Inclusion Morphology 17
2.4 Modification of Inclusions with Calcium 19
2.5 Analysis of Inclusions 20
2.6 Inclusion Removal in Ladle Metallurgy 22
2.7 Slag Control 23
2.7.1 Refining of Impurities in Steel 23
2.7.2 Avoiding Steel Reoxidation 25
2.7.3 Inclusion Removal to Slag 27
2.8 Stirring 30
2.8.1 Bubble Diameter and Terminal Velocity 32
2.8.2 Inclusion Removal to Bubbles 33
2.9 Refractory 38

Master Thesis- J. Pérez McMaster University- Materials Science and Engineering
Final Report- Steelmaking Course vii
Chapter 3 Mathematical Model 40
3.1 General Aspects 40
3.1.1 Assumptions and Second Order Effects
which Have Been Neglected
40
3.1.1.1 Eye Area 40
3.1.1.2 Removal to Slag, Bubbles and
Refractory
41
3.1.1.3 Reoxidation 41
3.1.1.4 Second Order Effects Neglected 41
3.2 Description: Framework of Model 42
3.2.1 Initial Inclusion Number. 42
3.2.2 Inclusion Removal to Bubbles Model (from
Wang, Lee & Hayer, 1996)
46
3.2.3 Eye Area (Krishnapisharody & Irons, 2007) 52
3.2.4 Inclusion Removal to Slag Model (by
Halleberg, Jönsson, Jonsson & Eriksson,
2005)
53
3.2.5 Inclusion Removal to Refractory Model (by
Zhang & Cai, 2001)
54
3.2.6 Model for Inclusions Produced by
Reoxidation (by Halleberg, Jönsson, Jonsson
& Eriksson, 2005)
55
3.2.7 Inclusions Distribution and Totatl Oxygen 59
Chapter 4 Experimental Methods and Results 61
4.1 Description of Ternium Siderar Plant 61

Master Thesis- J. Pérez McMaster University- Materials Science and Engineering
Final Report- Steelmaking Course viii
4.2 Ternium Siderar Steel Ladle 63
4.3 Secondary Metallurgy Process 63
4.4 Sampling 66
4.5 Analysis 68
4.6 Results 70
4.6.1 Steel and Slag Composition for Heats 70
4.6.2 Inclusion Composition 72
4.7 Model Results Compared with Experimental Data 75
Chapter 5 Discussion 78
5.1 Bubble Diameter and Terminal Velocity 78
5.2 Effect of each Mechanism on Inclusion Removal 82
5.3 Reoxidation Effect (by Slag and Atmosphere) 86
5.4 Effeect of Stirring Power on the Inclusion Removal by
Bubbling and Slag
90
5.5 Effect of Inclusion Size on Efficiency by Different
Removal Mechanisms
93
5.6 Results of Model for Different Process Conditions 96
Chapter 6 Conclusions 101
6.1 Summary and Conclusions 101
6.2 Future Work 105
Bibliography 106

Master Thesis- J. Pérez McMaster University- Materials Science and Engineering
Final Report- Steelmaking Course ix
Appendix 113
A Model 113
B Heats Process Parameters 125
B1 Heat 880558 125
B2 Heat 880595 125
B3 Heat 860630 126
B4 Heat 860613 126
C Variation of Inclusion Composition during the
Secondary Metallurgy
128
C1 Inclusion composition for heat 880558 128
C2 Inclusion composition for heat 880558 128
C3 Inclusion composition for heat 880558 129
C4 Inclusion composition for heat 880558 130

Master Thesis- J. Pérez McMaster University- Materials Science and Engineering
Final Report- Steelmaking Course x
LIST OF FIGURES
Chapter 1
Figure 1-1: Schematic flowsheet of steelmaking production by Blast Furnace-
Converter route and Electrical Arc Furnace. 2
Figure 1-2: Carbon and oxygen contents of steel before (open symbol) and
after (filled symbol) in a RH process. Turkdogan 1996.7
Figure 1-3: Schematic of ladle metallurgy furnace. Website:
//km.siderar.ot/mkm/siderar/mkm.asp9
Chapter 2
Figure 2-1: Ellingham diagrams for different deoxidants. website:
www.metalurgia.uda.cl/apuntes/Jchamorro/termodinamica/Diagra
masdeEllingham.pdf
13
Figure 2-2: (a) Schematic of steel flow pattern in a submerged entry nozzle
(SEN) with cloggling (Zhang & Thomas, 2003). (b) Picture of a
SEN with alumina clogging (Ternium Siderar internal report)
15
Figure 2-3: Indigenous inclusion: dendritic alumina inclusion (Zhang &
Thomas, 2003).16
Figure 2-4: Exogenous inclusion: slag entrapment with Al2O3-MgO-SiO2-CaO-
FeO (Zhang & Thomas, 2003)16
Figure 2-5: Binary system CaO-Al2O3 19
Figure 2-6: Modification of inclusion morphology as a result of calcium
treatment (Turkdogan, 1996).
19
Figure 2-7: Evolution of clusters with the time (Braun, Elliot & Flemings, 1979). 22
Figure 2-8: Relationship between FeO+MnO in ladle slag and T.O. for different
treatments (Zhang & Thomas, 2003).26
Figure 2-9: Effect of FeO+MnO in ladle slag in inclusion content in tundish
(Ahlborg, Bieniosek & Tucci, 1993).26

Master Thesis- J. Pérez McMaster University- Materials Science and Engineering
Final Report- Steelmaking Course xi
Figure 2-10: Relationship between quantity of inclusions and kg of aluminum
used to kill slag (Brandaleze, Martín, Donayo, Pérez & Gómez,
2007).
27
Figure 2-11: Quantity of inclusions in function of phosphorus reversion
(Brandaleze, Martín, Donayo, Pérez & Gómez, 2007).27
Figure 2-12: Changes in equivalent radius of alumina particles at different
temperatures (Slag: 48.9wt% Al2O3, 48.4wt% CaO, 0.52wt% MgO
and 1.36wt%SiO2; Sridhar & Cramb, 2001).
28
Figure 2-13: Comparison slag viscosity and driving force for dissolution of Al2O3
in different slags (Valdez & Cramb, 2002).
30
Figure 2-14: Total dissolution time for different Al2O3 inclusion size in ladle and
tundish slags (Valdez & Cramb, 2002).
30
Figure 2-15: Schematic drawing of a directional plug to stir. Website:
//km.siderar.ot/mkm/siderar/mkm.asp
31
Figure 2-16: Schematic representation of the spout and slag eye formation
(Krishnapisharody & Irons, 2007)
31
Figure 2-17: Terminal velocities of gas bubbles in liquid steel as a function of
the bubble size (Wang, Lee & Hayes, 1996)
33
Figure 2-18: Schematic representation of mechanisms of particle attachment to
a gas bubble (Miki., Thomas, Denissov & Shimada, 1997)
34
Figure 2-19: Probability by collision inclusion- bubble in a function of bubble
and inclusion size (Wang, Lee & Hayer, 1996).
35
Figure 2-20: Probability by adhesion of inclusion on the surface of bubbles as a
function of bubble and inclusion size (Wang, Lee & Hayer, 1996).
35
Figure 2-21: T.O. at the end of ladle metallurgy vs stirring time (Dekkers 2002,
Chap. 10).
36
Figure 2-22: T.O. in the ladle vs average flux of gas stirring (Dekkers 2002,
Chap. 10).
36
Figure 2-23: T.O. in ladle versus ladle stirring time (Bonilla, 1995) 37
Figure 2-24: Relationship between T.O., stirring power and stirring time (Zhang
& Thomas, 2003).
37

Master Thesis- J. Pérez McMaster University- Materials Science and Engineering
Final Report- Steelmaking Course xii
Figure 2-25: Relationship between inclusion content and gas bubbling time in
Ternium Siderar (Brandaleze, Martín, Donayo, Pérez & Gomez,
2007).
38
Figure 2-26: Oxygen activity in relationship to aluminum for basic and acid
refractory materials (Bannenberg, 1995)
39
Chapter 3
Figure 3-1: Distribution of alumina inclusion in heats analyzed after
deoxidation.
45
Figure 3-2: Quantity of alumina inclusions in each group for the heats
evaluated.
45
Figure 3-3: Schematic representation of collision of inclusion with a bubble
(Wang, Lee & Hayer, 1996)
46
Chapter 4
Figure 4-1 Steelmaking process in Ternium Siderar: (a) Torpedo cars from
the blast furnace, (b) Hot metal ladle in desulphurization station,
(c) Basic oxygen furnace, (d) Ladle furnace, (e) Continuous
casting exit. Property of Ternium Siderar company.
62
Figure 4-2 Ternium Siderar steel ladle: (a) Ladle plan, (b) Picture of internal
bottom.
63
Figure 4-3 Steps of ladle furnace process 65
Figure 4-4 Steps of trimming station process 66
Figure 4-5 Schematic secondary metallurgy process to show the time of
samples.
67
Figure 4-6 Samples: (a) Lollipop steel sample, (b) Slag sample. 68
Figure 4-7 Slag analysis: Compact chip of mill slag. 69
Figure 4-8 Inclusion analysis: inclusion seen in SEM (Espinosa, 2005). 70
Figure 4-9 Aluminum analysis of the steel during secondary metallurgy 71
Figure 4-10 Manganese analysis of the steel during secondary metallurgy 71
Figure 4-11 Iron oxide trend during secondary metallurgy 72

Master Thesis- J. Pérez McMaster University- Materials Science and Engineering
Final Report- Steelmaking Course xiii
Figure 4-12 Ternary diagram with the inclusion composition during process of
heat 880558
74
Figure 4-13 Ternary diagram with the inclusion composition during process of
heat 860613
75
Figure 4-14 Comparison of measured and modeled inclusion distribution for
heat 860613
76
Figure 4-15 Comparison of measured and modeled inclusion distribution for
heat 880595
76
Figure 4-16 Comparison of measured and modeled inclusion distribution for
heat 860588
77
Figure 4-17 Comparison of measured and modeled inclusion distribution for
heat 860630
77
Chapter 5
Figure 5-1: Correlation between the bubble diameter (dB) and the gas flow rate
(Q). 1: Meersmann (Oeters, 1994), 2: Davidson (Oeters, 1994),
(Qg = (40- 1000)*10-6 m3/s), 3: Hoefele & Brimacombe, (1979),
(Qg > 200*10-6 m3/s).
79
Figure 5-2: Correlation between the terminal bubble velocity (vB) and the
bubble diameter (dB). 1: Levich, 1962 (Re=500-1200); 2: Peebles
& Garber, 1953 (Re=500-1200); 3: Davies & Taylor, 1950.
80
Figure 5-3: Variation of number of inclusions per cubic meter (Nb/m3) removed
by bubbling during process for different bubble diameter.
81
Figure 5-4: Variation of final remaining number of inclusion per cubic meter
(Nf/m3) after removal by bubbling during processing for different
bubble diameters.
82
Figure 5-5: Effect of inclusion number increment produced by reoxidation. 83
Figure 5-6: Quantity inclusions remaining by removal effect of each
mechanism during the process
84
Figure 5-7: Effect of slag oxidation level on the inclusion number produced by
reoxidation.
88
Master Thesis- J. Pérez McMaster University- Materials Science and Engineering
Final Report- Steelmaking Course xiv
Figure 5-8: Effect of gas flow rate on the inclusion number produced by
reoxidation.
89
Figure 5-9: Effect of gas flow rate on the number of inclusion removal by slag. 91
Figure 5-10: Effect of gas flow rate on the number of inclusion removal by
bubbling.
92
Figure 5-11: Impact of inclusion size on the particle remaining number after
slag removal mechanism..
93
Figure 5-12: Impact of inclusion size on the particle remaining number after
bubbling removal mechanism..
94
Figure 5-13: Impact of stirring level during process over the total inclusion
number.
96
Figure 5-14: Impact of stirring level during process over the inclusion number of
diameter 2 µm.
97
Figure 5-15: Impact of stirring level during process over the inclusion number of
diameter 10 µm.
98
Figure 5-16: Impact of the initial oxidation level over the total final inclusion
number.
99
Appendix
Figure B-1: Calcium oxide evolution during secondary metallurgy 126
Figure B-2: Magnesium oxide evolution during secondary metallurgy 127
Figure B-3: Silica evolution during secondary metallurgy 127
Figure B-4: Alumina evolution during secondary metallurgy 127
Figure B-5: Manganese oxide evolution during secondary metallurgy 128
Figure C-1: Inclusion composition for heat 880595: (a) S0; (b) L0; (c) L1; (d)
L2; (e) L3
129
Figure C-2: Inclusion composition for heat 860630: (a) S0; (b) L0; (c) L1; (d)
L2; (e) L3
131

Master Thesis- J. Pérez McMaster University- Materials Science and Engineering
Final Report- Steelmaking Course xv
LIST OF TABLES
Chapter 2Table 2-1: Maximum inclusion size allowed in different products (Zhang &
Thomas, 2003). 18
Table 2-2: Inclusion classification in LCAK steel by size and shape (Dekkers, 2002).
18
Table 2-3: Direct and Indirect methods to analyze inclusions (Zhang & Thomas, 2003)
20
Table 2-4: Slag composition (Valdez & Cramb, 2002). 29
Chapter 5Table 5-1: Steel and slag composition for reoxidation mechanism test 87
Table 5-2: Effect of inclusion size on the bubbling and slag removal mechanism without consideration of the initial inclusion number for each particle size
95
AppendixTable B-1: Process Parameters for Heat 880558 125Table B-2: Process Parameters for Heat 880595 125Table B-3: Process Parameters for Heat 860630 126Table B-4: Process Parameters for Heat 860613 126Table C-1: Steel and slag composition for heat 880588 128Table C-2: Steel and slag composition for heat 880595 128Table C-3: Steel and slag composition for heat 860630 129Table C-4: Steel and slag composition for heat 860613 130

Master Thesis- J. Pérez McMaster University- Materials Science and Engineering
Final Report- Steelmaking Course xvi
LIST OF VARIABLES
aFeO -------- FeO activity in the slag
aMnO -------- MnO activity in the slag
%Al -------- Aluminium content in the steel (%)
%Al2O3 -------- Alumina content in slag (%)
A13B -------- Hamaker constant of Al2O3- liq steel-bubble system (J)
AEye -------- Eye area without slag (m2)
ALadle -------- Ladle area (m2)
ARef -------- Refractory area (m2)
ASlag -------- Slag area (m2)
%CaO -------- CaO content in slag (%)
DB -------- Diameter of the bubble (m)
DI -------- Diameter of the inclusion (m)
Do -------- Diffusion coeficient of oxygen in steel (m2/ s)
E1 -------- Energy barrier for the bubble-particle adhesion to calculate PA
Ek -------- Kinetic energy of collision to calculate PA
%FeO -------- FeO content in slag (%)
g -------- Gravity acceleration (m/ s2)
G -------- Dimensionless constant
H -------- Height of ladle (steel height) (m)
HCr -------- Critical film thickness (m)
I -------- Number of alumina molecules included into an inclusion of RI
KFeO -------- FeO equilibrum constant
KMnO -------- MnO equilibrum constant
%Mn -------- Manganese content in the steel (%)
%MgO -------- MgO content in slag (%)
%MnO -------- MnO content in slag (%)
MO -------- Molar weight of oxygen (kg)
MP -------- Molar weight of particle, Al2O3 (kg)
N -------- Total number of molecules function of total oxygen (1/m3)
NA -------- Avogadro's Number (1/ mol)

Master Thesis- J. Pérez McMaster University- Materials Science and Engineering
Final Report- Steelmaking Course xvii
NRBI -------- Total number of "effective adhesions" bubble- inclusion for
inclusion of radius i (1/ m3)
NRFinI -------- Number of total inclusions at the end of treatment (1/ m3)
NRI -------- Total number of radius I (1/ m3)
NROI -------- Initial number of total inclusions for inclusion of radius i (1/m3)
NRRef -------- Number of inclusion of Ri removal to refractory (1/ m3)
NRReO -------- Number of particles produced by reoxidation (1/ m3)
NRSlag -------- Number of particles removal to slag of radius i (1/m3)
OAtm -------- Oxygen in atmosphere for reoxidation (%)
OEq -------- Oxygen in equilibrium with aluminum content (ppm)
OIni -------- Total oxygen before tapping (ppm)
OSlag -------- Oxygen content in the slag (ppm)
OTot -------- Total Oxygen for reoxidation, it's dissolve oxygen (%)
OTotal -------- Total oxygen in the steel (%)
P -------- Standard atmosphere pressure (Pa)
PA -------- Adhesion Probability
PC -------- Collision probability
PMAl2O3 -------- Molar weight of Al2O3 (kg)
PMCaO -------- Molar weight of CaO (kg)
PMFeO -------- Molar weight of FeO (kg)
PMMgO -------- Molar weight of MgO (kg)
PMMnO -------- Molar weight of MnO (kg)
PMO -------- Molar weight of Oxygen (kg)
PMSiO2 -------- Molar weight of SiO2 (kg)
Q -------- Flow rate per Tn of steel (Nm3/ s * Tn steel)
Q1 -------- Number of molecules per unit volume, to calculate A13B
R -------- Ideal gas constant (J/ mol K)
RB -------- Bubble radius produced by gas injection (m)
Re -------- Reynolds number
RI -------- Radius of an inclusion i (m)
RLadle -------- Ladle radius (m)
RM -------- Al2O3 molecular radius (m)

Master Thesis- J. Pérez McMaster University- Materials Science and Engineering
Final Report- Steelmaking Course xviii
ROC -------- It is the distance resulting of the addition of RB and RI during
attachment of inclusion and bubble (m)
∑ Oxides -------- Total moles of oxides in the slag
%SiO2 -------- Silica content in slag (%)
T -------- Temperature (K)
TF -------- Film drainage and rupture time (s)
TO -------- Temperature of the gas before porous plugs (K)
V -------- Volume of the steel (m3)
VB -------- Velocity of the bubble (m/ s)
VM -------- Molecular volume of an alumina particle (m3/ mol)
VR -------- Relative velocity of the particle respect to bubble (m/ s)
VZ -------- Velocity of particle in z direction (m/ s)
WSteel -------- Weight of steel (kg)
XFeO -------- FeO molar fraction
XMnO -------- MnO molar fraction
Z -------- Portion of inclusion of each size at the beginning of treatmentα -------- Semiangle of contact between inclusion and bubble
1β -------- London’s constant for interaction between two atoms to calculate
A13B.
Ε -------- Turbulent energy dissipation (m2/ s3)
Feρ -------- Steel density (kg/ m3)
Gρ -------- Gas density (kg/ m3)
Pρ -------- Particle density, Al2O3 is consider (kg/ m3)
IO,κ -------- Mass transfer coefficient (depends of stirring intensity for slag)
(m/s)
1,Oκ -------- Mass transfer coefficient (depends of stirring intensity for eye) (m/s)
Feη -------- Kinematic viscosity (m2/ s)
Oη -------- Effect oxygen in molar ratio
Pη -------- Effect particle in molar ratioσ -------- Surface tension (N/m)

Master Thesis- J. Pérez McMaster University- Materials Science and Engineering
Final Report- Steelmaking Course xix
θ -------- Contact angle between particle and bubble
Feµ -------- Steel viscosity (kg/ m.s)
Gµ -------- Gas viscosity (kg/ m.s)
γ -------- Activity coefficient for each oxide
Master Thesis- J. Pérez McMaster University- Materials Science and Engineering
Final Report- Steelmaking Course 1
Chapter 1
INTRODUCTION
1.1 Modern Iron and Steelmaking
At the present time steel is produced by two main processes throughout the
world: the blast furnace (integrated steelmaking) or electric arc furnace (from direct
reduction iron (DRI) or from scrap in the minimills). The metallurgical route is chosen
according to the investment level, capacity of the plant, energy costs and raw materials
availability.
The integrated steelmaking route is used in plants with high production (highest
investment). This process is presented in Figure 1-1, where the blast furnace produces
molten iron (hot metal) starting from iron ore, lime, coke (produced by cokemaking) and
sinter. Hot metal which is rich in carbon (4- 4.8 wt%C), steel scrap, solid pig iron (from
the blast furnace too) and fluxes (lime, dolomite, recycled slag, etc) are charged in the
steelmaking converter to lower carbon by oxidation with pure oxygen injection at
supersonic velocity. At the end of converter process, the steel has a very high oxygen
concentration in equilibrium with low carbon content (0.02- 0.10 %C). It must be refined
with deoxidizing agents and it is adjusted chemically and thermally in a secondary
metallurgy or ladle metallurgy process. The steel with the aim composition at process
temperature is sent to the continuous casting machine where solidification occurs; slabs
or billets are produced.

Master Thesis- J. Pérez McMaster University- Materials Science and Engineering
Final Report- Steelmaking Course 2
When the steel is produced by the electric arc furnace (Figure 1-1), DRI produced
by direct reduction with scrap and fluxes are charged into the electric arc furnace to
produce steel with high oxidation potential. After this point both routes are the same. A
common use of the electric arc furnace is in the minimill, where the steel is produced
starting from scrap only.
Figure 1-1. Schematic flowsheet of steelmaking production by blast furnace- converter
route and electric arc furnace.
1.2 Secondary Metallurgy Process
Converters (BOFs) and electric arc furnaces (EAFs) produce steel by oxidation.
At the end of blowing (in converters) or melting (in EAFs), the steel has high dissolved
oxygen content, low phosphorous and low carbon content. The steel is tapped from each
one of these reactors to a ladle (refractory vessel with metal shell), where the secondary
metallurgy is performed.
The secondary metallurgy begins with deoxidation during tapping by aluminum,
manganese, silicon and carbon depending of the level of deoxidation or “killing” required.
SinterCoke
Iron Ore
Scrap
Scrap
Blast Furnace
Direct Reduction
Converter
Electrical Arc Furnace
Ladle Metallurgy Furnace
Continuous Casting
Steel Slabs or Billets

Master Thesis- J. Pérez McMaster University- Materials Science and Engineering
Final Report- Steelmaking Course 3
The oxides produced during deoxidation must be removed from the steel by floating out.
The oxides which remain in the steel form solid particles with different melting points and
mechanical properties than the steel, and they are called non-metallic inclusions. The
inclusion liquidus temperature is very important during casting, because those oxides
with higher liquidus temperature than the steel can attach in the small size casting
channels (such as the ladle nozzle or tundish nozzle) and clog them. Regarding the
mechanical properties, inclusions have low formability and during rolling they may
produce cracks in the steel.
In ladle metallurgy the steel is adjusted to the chemical composition required in
the final product, by refining processes such as desulphurization, alloying, heating, non-
metallic inclusions removal and degassing in some occasions.
The main refining processes are:
1- Desulphurization: the sulfur dissolved in the steel can be removed from this
by interactions between steel and slag, according to Equation 1-1
( °∆G defined by Elliot & Gleiser 1960):
S + CaO à O + CaS[ ]
[ ]
[ ]
[ ]S
O
CaO
CaS
aa
aa
K = TJG 8.25104700)( −=°∆ (1-1)
Desulphurization is a function of the interaction between steel and slag,
because CaO is necessary to fix the sulphur in the slag, together with other
thermodynamic conditions such as temperature and sulphur capacity.
2- Alloying: The chemical composition is adjusted with ferroalloys, by lumps
added from chutes or injected as fine powder clad in metal tubes, known in

Master Thesis- J. Pérez McMaster University- Materials Science and Engineering
Final Report- Steelmaking Course 4
the industry as wires. The content of phosphorus cannot decrease during this
process; this can be done only during oxidation (BOF and EAF process).
3- Degassing: Achieved under vacuum condition with specific equipment. It
removes carbon and makes steel with very low carbon which cannot be
produced in the BOF or EAF. Degassing is used also to obtain low dissolved
nitrogen and hydrogen contents.
4- Inclusion removal: During the process coagulation and flotation of inclusions
removes them from steel; the conditions and mechanisms to obtain clean
steel (without inclusions) will be described in Section 2.6.
5- Calcium inclusion modification: The non-metallic inclusions cannot be
removed completely; the remaining ones may be modified with calcium. The
calcium aluminate formed has two advantages, it is liquid at casting
temperature (it avoids casting problems due to nozzle clogging) and the
inclusions present in solid steel are deformable during rolling.
Secondary metallurgy processes include different methods, where the vessel is a
ladle. Some processes cannot reheat and in other ones electrical or chemical reheating
are used.
Four different types of equipment for secondary metallurgy (without vacuum) are
described below:
(a) LMF (Ladle Metallurgical Furnace). In this equipment the steel is heated by
electric arcs; the furnace has three graphite electrodes which make an
electrical arc with the liquid steel which transfers the thermal energy from the
steel surface to the rest of the steel. It is possible to adjust the chemical
Master Thesis- J. Pérez McMaster University- Materials Science and Engineering
Final Report- Steelmaking Course 5
composition by ferroalloy addition. Bubbling is made by inert gas injection
through porous plugs in the bottom of the ladle, to homogenize and achieve a
good slag- steel interaction. It is excellent for desulphurization.
(b) CAS-OB (Composition Adjustment by Sealed argon bubbling with Oxygen
Blowing). In this method the bell goes down to the steel to produce an inert
area over the “slag eye” (area without slag because the bubbling plume
pushed it aside). The alloy addition and chemical reheating by oxygen and
aluminum injection are produced underneath this bell. It produces more Al2O3
than a LMF, and they must float out to obtain clean steel.
(c) IR-UT (Injection- Refining Up- Temperature). A vessel with aluminum and
oxygen injection for alumino-thermic heating, argon is bubbling by a top lance
for steel refining. It is a cheap, quick and low cost process. Low quality steel
is obtained because it cannot achieve good inclusion cleanliness.
(d) Mannesmann Process. In this equipment the lime powder is injected with a
top lance and argon is injected through the porous plugs placed in the bottom
of the ladle. This process achieves very good slag-steel interaction for
desulphurization and other refining process, but heating is not possible in this
case.
The most common vacuum equipment used in the secondary metallurgy is
summarized below:
(e) VD or VTD (Vacuum Tank Degassing). It is a hermetic tank where the steel
ladle is placed. It is a non-recirculating system (as are VOD and VAD). The
tank is connected to vacuum equipment. This process has high thermal
losses and needs a large free board in the ladle (decreasing productivity).

Master Thesis- J. Pérez McMaster University- Materials Science and Engineering
Final Report- Steelmaking Course 6
(f) VOD (Vacuum Oxygen Degassing). It is a VD with oxygen injection. The
decarburization reaction is favored by oxygen injection over the steel bath
surface. It is predominantly used to produce stainless steel, because the
oxygen reacts with carbon before chromium.
(g) VAD (Vacuum Arc Degassing). It is a VD with electrodes to heat by electrical
arc.
(h) RH (Ruhrstahl - Heraeus). It is a recirculating system; it is a vessel under
vacuum with 2 legs which immerse into steel. In one leg, argon is injected and
produces the steel flow. In the vessel the decaburization is made; this
equipment is faster than VD and has higher productivity.
A process under vacuum is mandatory when the final product requires very low
carbon content (around 30 ppm). Under vacuum the partial pressure of CO decreases
and carbon deoxidation by reaction of C and O dissolved in the steel is favored near
stoichiometry, according to equation 1-2. With oxygen injection the final carbon content
can be even lower.
C + O à COg K = a[C] a[O] / PCO Log K = 1.16/ T – 2.003 (1-2)
Figure 1-2 shows plant data obtained by carbon content before and after a
vacuum treatment (by RH) reported by Turkdogan (1996) at 0.07 atm of CO pressure.
The carbon content in equilibrium with dissolved oxygen before vacuum treatment is
plotted in open symbols, under vacuum the CO partial pressure decreases and the
carbon content lower a new equilibrium with the dissolved oxygen (filled symbols).

Master Thesis- J. Pérez McMaster University- Materials Science and Engineering
Final Report- Steelmaking Course 7
Figure 1-2. Carbon and oxygen contents of steel before (open symbol) and after (filled
symbol) in a RH process. Turkdogan (1996).
There are two different types of degasser (Kor & Glaws, 1998): recirculating and
non-recirculating systems; in both processes argon is used as lifting gas (to lower steel
density to move the liquid from the ladle to the vacuum vessel) or stirring gas (to promote
the removal of nitrogen and/ or hydrogen). Both methods achieve the same carbon, and
gas content at the end of treatment. The difference is in the process time and investment
cost; RH is quicker but more expensive.
The Ladle Metallurgy Furnace (LMF) is the process studied in the current work.
1.3 Ladle Metallurgy Furnace
The ladle metallurgy furnace is used in most steelmaking plants, where all the
processes required for the secondary metallurgy can be made, except for degassing.
The LMF is shown in Figure 1-3:

Master Thesis- J. Pérez McMaster University- Materials Science and Engineering
Final Report- Steelmaking Course 8
(1) The transportation car is where the ladle containing liquid steel is placed. The
ladle contains the steel and a top slag layer. Slag has the functions of
protecting the steel from the atmosphere, thermal insulation and refining.
(2) Argon or nitrogen stirring can be made from one or more bottom plugs for
homogenization, desulphurization and inclusion flotation.
(3) Water cooled lid to protect the steel and aspirate the fumes during the
treatment.
(4) Current conducting arms.
(5) Chutes for alloy addition and injection machines to adjust the chemical
composition. Wire feeding of powdered materials in steel shells is used when
small quantities are required or when its vapor pressure is lower than liquid
steel temperature (e.g., calcium); on the other hand bulk alloys are added by
chutes for larger quantities.
(6) An automatic or manual lance is used to take steel samples and check the
temperature.
(7) The furnace has three electrodes supported by current-conducting arms to
reheat the steel to the aim value.

Master Thesis- J. Pérez McMaster University- Materials Science and Engineering
Final Report- Steelmaking Course 9
Figure 1-3. Schematic of Ladle Metallurgy Furnace. Website:
//km.siderar.ot/mkm/siderar/mkm.asp
1.4 Current State of the Art
Iron and steelmaking industries are working continuously to develop cheaper and
newer products to be able to compete in the market. High cost and shortage of some raw
materials have caused engineers to redesign the processes. Furthermore, steel
competes with other materials such as plastic and aluminum for some requirements, and
thus better properties and improved quality are required continuously.
A competitive product in terms of quality and cost requires an optimized process.
Models can be used as an easy, quick and cheap method to evaluate the results
obtained when some variable of process is changed.
In steelmaking industry, mathematical, statistical and empirical models have been
developed in order to improve process capacity and study changes in process or

Master Thesis- J. Pérez McMaster University- Materials Science and Engineering
Final Report- Steelmaking Course 10
products. In general these models are developed in laboratory scale and the validity in
the industrial scale is very difficult to prove. In spite of this limitation, the usefulness of
models to explain physico-chemical and thermodynamic aspects as regards of
processes must be recognized.
In processes like secondary metallurgy, the variables are modified continuously
and the different parameters vary heat-to-heat, with heating, stirring, alloying, and slag
treatment. Process control is made from knowledge of the theoretical effect of each
variable in the process and availability of sensors and samplers to make discreet
measurements.
1.5 Objectives of the Research
The key work of this thesis is to develop an inclusion control model for the ladle
furnace, which determines inclusion evolution during the process for different process
variables, such as stirring variation, temperature, oxidation level and slag composition. In
this way a mathematical model was developed and validated with steelmaking plant
samples to achieve this research objective.
1.6 Organization of the Thesis
The present thesis is presented in 6 chapters. In Chapter 1 the subject and
aspects which motivate the research and the goals are described. Chapter 2 presents
the literature review of inclusion formation and characterization, and explains the clean
steel concept and process engineering used to decrease the quantity of inclusions during
secondary metallurgy. Chapter 3 is the key work of this thesis. A mathematical model
has been developed to explain the inclusion evolution during the secondary metallurgy

Master Thesis- J. Pérez McMaster University- Materials Science and Engineering
Final Report- Steelmaking Course 11
process and its validation in Ternium Argentina. Chapter 4 is focused on the method of
sampling and analysis and the results obtained from plant samples. Chapter 5 shows the
information that the model can give and its correlation with the work of other authors.
Conclusions regarding the industrial application of this work are presented in Chapter 6,
and some proposals for future research are described.

Master Thesis- J. Pérez McMaster University- Materials Science and Engineering
Final Report- Steelmaking Course 12
Chapter 2
INCLUSION CHARACTERIZATION AND REMOVAL MECHANISMS
2.1 Deoxidation Practice and Inclusion Formation
At the end of the Converter or Electric Arc Furnace process the steel has high
dissolved oxygen content (greater than 500 ppm) and it must be decreased to 2- 4 ppm
dissolved oxygen to be able to cast as the final product. The secondary metallurgy
process begins with deoxidation; the most common metals used to remove the oxygen
dissolved (O) are summarized in the following reactions (Turkdogan, 1996), where Log
means log10:
C + O à CO(g) K = a[C] a[O] / PCO Log K = 1.16/ T – 2.003 (2-1)
2 Al + 3 O à Al2O3(s) K = a[Al]2 a[O]
3 Log K = -62780/ T + 20.6 (2-2)
Mn + O à MnO(s) K = a[Mn] a[O] Log K = 15.05/ T + 6.75 (2-3)
Si + 2 O à SiO2(s) K = a[Si] a[O]2 Log K = 30.11/ T + 10.4 (2-4)
Ca + O à CaO(s) K = a[Ca] a[O] Log K = -9.030 (2-5)
3 Ti + 5 O à Ti3O5(s) K = a[Ti]3 a[O]
5 Log K = 16.1 (2-6)
2 Cr + 3 O à Cr2O3(s) K = a[Cr]2 a[O]
3 Log K = 44.04/ T + 19.42 (2-7)
The evolution of the different deoxidants as function of temperature summarized
above is plotted in Figure 2-1.

Master Thesis- J. Pérez McMaster University- Materials Science and Engineering
Final Report- Steelmaking Course 13
Figure 2-1. Ellingham diagrams for different deoxidants. website:
www.metalurgia.uda.cl/apuntes/Jchamorro/termodinamica/DiagramasdeEllingham.pdf
In Equation 2-1, the oxygen reacts with the dissolved carbon to remove oxygen;
the oxide produced is a gaseous compound which leaves the steel. Carbon is a weak
deoxidant and reacts with oxygen only when it is in high concentration and no stronger
deoxidants are present in the steel.
Aluminum is commonly used because it is a powerful deoxidant and is cheaper
than other metals (eg. titanium). The oxide produced in the reaction 2-2 is solid and it
must float up in the steel to reach the slag. In the absence of the quantity of aluminum
necessary to kill the steel, manganese and silicon remove the oxygen according to
reactions 2-3 and 2-4, where solid oxides are produced. Solid particles produced which
do not float up during the process and remain in the solid steel are called inclusions.

Master Thesis- J. Pérez McMaster University- Materials Science and Engineering
Final Report- Steelmaking Course 14
When the quantity of metal added is greater than that necessary to kill the steel,
aluminum, manganese and silicon are simply alloy additives.
In steel with high quantities of silicon or manganese added or without aluminum,
reactions 2-3 and 2-4 are followed. If aluminum is added in the necessary quantity,
reaction 2-2 displaces reactions 2-3 and 2-4.
The metals shown in equations 2-5, 2-6 and 2-7 are very reactive but with high
cost. Their effect on the steel composition has a high impact on the mechanical
properties.
When the steel is deoxided mainly by aluminum it is called aluminum killed steel
and produces one kind of solid oxide (Al2O3). This is the kind of steel studied in the
current work.
The inclusion chemistry in the solid steel depends of which deoxidizer has been
used. Van der Eijk, Grong & Walmsley (2000) find in Al-Ca killed steels, Al, Ca and S are
the main elements entering the inclusions and Ti-killed steels have Ti, Mn and S in their
inclusions.
2.2 Clean Steel Concept
The steel has some elements and components which affect the properties of final
product, such as: oxygen, nitrogen, sulphur, phosphorous, oxides and others. The term
“clean steel” is commonly associated to low oxide content in the steel (called non-
metallic inclusions); the presence of other elements is considered the “purity of the
steel”. The non-metallic inclusions are created during deoxidation or by reoxidation
during secondary metallurgy or casting processes. The cleanliness standard desired by

Master Thesis- J. Pérez McMaster University- Materials Science and Engineering
Final Report- Steelmaking Course 15
the customer has been increasing over time as a function of technological
improvements.
The control of oxides is fundamental during steelmaking process, because lack of
cleanliness affects the casting process and the final product. The inclusions can produce
clogging during the casting in the submerged entry nozzle (Figure 2-2). The Al2O3
particles stick in the nozzle decreasing the casting velocity, and can even stop casting
altogether (clogging).
(a) (b)
Figure 2-2. (a) Schematic of steel flow pattern in a submerged entry nozzle (SEN) with
cloggling (Zhang & Thomas, 2003). (b) Picture of a SEN with alumina clogging (Ternium
Siderar internal report)
Inclusions may deform during rolling in detrimental ways. During hot rolling the
inclusions are deformed in different way than steel, Wijk (1995) considered four kinds of
inclusion deformation:
- Fragile inclusions; they are broken during rolling.
- Inclusions which cannot be deformed; they produce slivers in the rolling
direction.
- Inclusions with a hard core, only the shell supports a low level of deformation.

Master Thesis- J. Pérez McMaster University- Materials Science and Engineering
Final Report- Steelmaking Course 16
- Ductile Inclusions, they present a similar deformation as the steel around them.
The inclusions can be exogenous or indigenous according to their source. In the
first type all particles originating external to the steel and its refining reactions are
considered, such as slag entrapment or oxides particles from the refractory. On the other
hand, the second type is a product of deoxidation reactions (oxides) or precipitation
reactions (nitrides, sulphides, etc). They are completely different according to
composition and size; Zhang & Thomas (2003) showed the difference between these
inclusion types shown here in Figures 2-3 and 2-4.
Figure 2-3. Indigenous inclusion: dendritic
alumina inclusion (Zhang & Thomas,
2003)
Figure 2-4. Exogenous inclusion: slag
entrapment with Al2O3-MgO-SiO2-CaO-
FeO (Zhang & Thomas, 2003)
Indigenous inclusions are studied in this thesis; they depend on the nature and
quantity of deoxidizer used in the treatment of the steel and the operational practices to
decrease them.

Master Thesis- J. Pérez McMaster University- Materials Science and Engineering
Final Report- Steelmaking Course 17
Non-metallic inclusions are harmful to mechanical properties of steel (decreasing
the toughness and increasing the risk for mechanical or corrosive failure of the final
product) and require a removal treatment. During the refining of steel, the inclusions can
be modified to decrease their quantity.
Lange (1988) explains the effect of each kind of inclusion on the mechanical
properties in the rolled product. During rolling, the fragile inclusions or non-deformable
inclusions are broken mainly on the grain edges. This produces surface defects as
slivers or blisters. They can act as sites where the cracks starts and produce seams
which decrease the mechanical properties such as ductility, Charpy impact value and
anisotropy, formability (elongation, reduction area and bendability), cold forgeability and
drawability, low temperature toughness and fatigue strength, and affect the corrosion
resistance and welding properties.
2.3 Inclusion Morphology
The decrease in the mechanical properties depends of the amount, composition
and morphology of inclusions and their distribution. It is necessary to control the
inclusion content in the steel to avoid inclusions larger than the critical size harmful to the
product. The critical size depends of the final thickness required and application. Zhang
& Thomas (2003) summarized the maximum size for inclusions according to the different
product characteristics (Table 2-1).

Master Thesis- J. Pérez McMaster University- Materials Science and Engineering
Final Report- Steelmaking Course 18
Table 2-1. Maximum inclusion size allowed in different products (Zhang&Thomas, 2003).
Steel Product Maximum Inclusion size
Automotive and deep-drawing Sheet 100 µm
Drawn and Ironed cans 20 µm
Line pipe 100 µm
Ball Bearings 15 µm
Tire cord 10 µm
Wire 20 µm
Robinson, Martin & Pickering (1979) found that the shape of aluminum oxide
inclusions is controlled largely by the supersaturation. Mixing of oxygen rich regions and
oxygen poor regions result in the formation of alumina dendrites and aggregates.
Branched dendrites are formed in oxygen rich and aluminium rich melts. Spheroidised
dendrites are in low oxygen contents areas.
Dekkers (2002) studied the inclusion content at the beginning (after nucleation)
and the end of treatment. He classified the inclusions in Low Carbon Aluminum Killed
Steels (LCAKS) without calcium treatment according to shape, chemical composition
and size. The classification according shape and size only for inclusions studied in this
work (pure alumina) is summarized in Table 2-2.
Table 2-2. Inclusion classification in LCAK steel by size and shape (Dekkers, 2002).
Contribution of Ototal
after Al additionKind of
inclusionShape Size
5 min. 25 min.
Spherical Spherical Small, diameter 0,5 µm 0% 6.1%
Faceted Large polyhedral Diameter > 5 µm 0% 13%
Dendrites With branches Size 5-20 µm 0% 1.3%
Clusters Open network Size 100 µm 100% 52%
Master Thesis- J. Pérez McMaster University- Materials Science and Engineering
Final Report- Steelmaking Course 19
It is possible see in Table 2-2 the impact of each kind of inclusion to the total
oxygen content. At the beginning of the treatment (5 minutes after aluminum addition),
most of the oxygen content is bound in clusters because of they are the largest
inclusions. At the end of treatment the most of clusters float up and in a common sample
almost 90% of inclusions are spherical, but ones that are very small therefore have little
impact on the total oxygen content (6.1 %). Large inclusions are harmful for the steel,
and they contribute most to the total oxygen (52%).
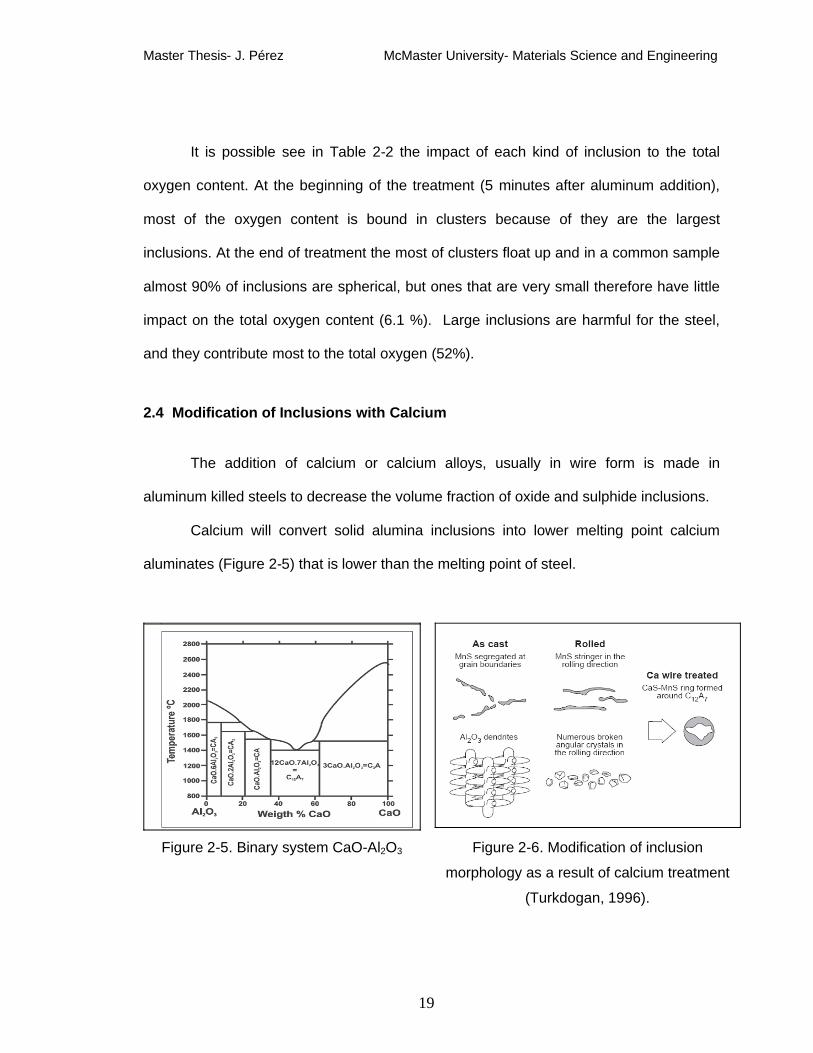
2.4 Modification of Inclusions with Calcium
The addition of calcium or calcium alloys, usually in wire form is made in
aluminum killed steels to decrease the volume fraction of oxide and sulphide inclusions.
Calcium will convert solid alumina inclusions into lower melting point calcium
aluminates (Figure 2-5) that is lower than the melting point of steel.
Figure 2-5. Binary system CaO-Al2O3 Figure 2-6. Modification of inclusion
morphology as a result of calcium treatment
(Turkdogan, 1996).

Master Thesis- J. Pérez McMaster University- Materials Science and Engineering
Final Report- Steelmaking Course 20
At the beginning of the treatment the inclusions are always pure aluminum oxide,
but calcium treatment transforms solid alumina inclusions in liquid calcium aluminates.
Calcium treatment is known as inclusion morphology control or modification, because it
changes inclusion composition and shape. The changes are schematized in Figure 2-6.
Calcium treatment improves casting because it decreases nozzle clogging and
decreases superficial defects in slabs by improving the regularity in casting. Although it is
an important point for inclusion engineering it has not been developed in the present
work.
2.5 Analysis of Inclusions
There are two kinds of methods to measure the steel cleanliness:
- Direct methods: they are accurate but costly (in time, money and technology)
- Indirect methods: they are fast and inexpensive, but they are not as accurate and
only useful as relative indicators.
Direct and indirect techniques can be classified since Table 2-3 by Zhang & Thomas
(2003).
Table 2-3. Direct and Indirect methods to analyze inclusions (Zhang & Thomas, 2003)
Method Evaluation Characteristics TechniquesMetallographic Microscope Observation (MMO)
Image Analysis (IA)
Sulphur Print
2-dimensional
measurement in
solid samples (only
amount) Scanning Electron Microscopy (SEM)
Optical Emission Spectrometry with Pulse
Discrimination Analysis (OES-PDA)
Direct Inclusion
Evaluation of
Solid Steel
Sections
2-dimensional
measurement in
solid samples Laser Microprobe Mass Spectrometry (LAMMS)

Master Thesis- J. Pérez McMaster University- Materials Science and Engineering
Final Report- Steelmaking Course 21
X-ray Photoelectron Spectroscopy (XPS)(amount and
composition) Auger Electron Spectroscopy (AES)
Conventional Ultrasonic Scanning (CUS)
Mannesmann Inclusion Detection by Analysis
Surfboards (MIDAS)
Scanning Acoustic Microscope (SAM)
3-dimensional
measurement in
steel matrix
X-ray Detection
Slime (Electrolysis)
Electron Beam melting (EB)
Cold Crucible (CC) melting
Inclusions
Evaluation of
Solid Steel
Volumes3-dimensional
measurement of
inclusions
separated from
steelFractional Thermal Decomposition (FTD)
Coulter Counter Analysis
Photo Scattering method
Inclusions
Size
Distribution
after
Inclusion
Extraction
3-dimensional
measurement
(extraction for one
of the last 4
techniques)Laser-Diffraction Particle Size Analyzer
(LDPSA)
Ultrasonic Techniques for Liquid SystemInclusions
Evaluation of
Liquid
Inclusion size and
distribution in liquid
steelConfocal Scanning Laser Microscope
IndirectBy sampler
or sensors
Online
measurements of
inclusion level
Total Oxygen and dissolved oxygen
There is no direct or indirect single method to evaluate steel cleanliness. It is
necessary to combine several methods to be able to have a good overall analysis, for
problem investigation.

Master Thesis- J. Pérez McMaster University- Materials Science and Engineering
Final Report- Steelmaking Course 22
2.6 Inclusion Removal in Ladle Metallurgy
Ladle metallurgy processes are oriented to obtain chemical and thermal
homogenization, deep deoxidation and desulphurization, exact alloy composition and
also to decrease the non-metallic inclusion content in steel to very low levels. In order to
obtain steel cleanliness it is necessary to remove the inclusions and avoid reoxidation.
Then the following parameters have to be considered: inclusion properties to improve
their removal, stirring and transfer operations, slag control and refractory.
The inclusion size and its properties are important to improve the inclusion
removal. Stirring enhances cluster formation and the shape of particles in the clusters
depends on the initial oxygen and aluminum activities and holding time (Braun, Elliot &
Flemings, 1979). After the aluminum addition, the inclusions evolve; Figure 2-7 shows
that larger inclusions are present immediately after aluminum is added and after 10
minutes they disappear.
Figure 2-7. Evolution of clusters with the time (Braun, Elliot & Flemings, 1979).
Master Thesis- J. Pérez McMaster University- Materials Science and Engineering
Final Report- Steelmaking Course 23
Reoxidation occurs if the oxygen activity in the steel melt is less than the one in
the layer in contact with it (slag, refractory or atmosphere).
2.7 Slag Control
Slag has four functions in the metallurgical process: to provide refining of
impurities in steel, to avoid steel reoxidation by contact with the atmosphere, to act as
thermal insulation and take up the non-metallic inclusions. According to Oertel, Costa
and Silva (1999) the effectiveness of the steel refining process is heavily dependent on
the characteristics of the slags employed in these process.
2.7.1 Refining of the Impurities in Steel
Secondary metallurgy is the process where the refining of steel is carried out.
Chemical composition is adjusted by ferroalloy addition, and the removal of some
impurities by the slag (such as sulphur and the non-metallic inclusions, the last one is
described in Section 2.7.3).
Except for resulphurized steel, in general sulphur is unwanted in steel, because
its presence gives phases of low melting point at grain boundaries which work as crack
initiators during rolling and increase the corrosion rate of steel (Bristow et al, 2000).
Sulphur is present in the raw material (coke) used for hot metal production. According to
the thermodynamic conditions of converter or EAF processes, sulphur cannot removed
by primary steelmaking. Wilson and McLean (1980) summarized the process conditions
to removal sulphur from the steel:

Master Thesis- J. Pérez McMaster University- Materials Science and Engineering
Final Report- Steelmaking Course 24
- Low oxygen potential in the melt; for this condition is necessary that the
steel is completely deoxidized.
- Strong stirring at the slag/ metal interface; the slag must be fluid to allow
good steel-slag contact.
- High temperature to ensure slag fluidity and lime dissolution.
- Highly basic slag phase to fix the sulphur which is removed from the steel.
Of all the slag-metal reactions, the thermodynamics and kinetics of sulphur
transfer have been most rigorously studied (Graham, 2008), and may be represented by
the ionic exchange reaction where sulphur is partitioned between the metal and slag
phases:
S + (O-2) (S-2) + O (2-8)
As the secondary metallurgy process operates under reducing conditions, a
simplified approach to desulphurization is to recognize that CaO in slag is the primary
desulphurizer:
S + (CaO) (CaS) + O (2-9)
The slag composition is fundamental for desulphurization and it is one of the main
functions of the slag in the secondary metallurgy process.

Master Thesis- J. Pérez McMaster University- Materials Science and Engineering
Final Report- Steelmaking Course 25
2.7.2 Avoiding Steel Reoxidation
Reoxidation (Dekkers, 2002) is produced when the steel is in contact with another
phase with a higher oxygen activity.
- Ladle eye; the slag layer is opened by stirring bringing the steel into contact with
the atmosphere (21% oxygen).
Intensive stirring causes an emulsification between slag and steel. The slag drops
can transport oxygen from the atmosphere, producing oxides (then aluminum and silicon
contents decrease in the steel).
- Slag: high FeO content produces reoxidation because the reduction of this by
aluminum is thermodynamically favored:
3 FeO + 2 Al Al2O3 + 3 Fe ∆ G° = -853700 +240T (J/mol) (2-10)
It is necessary to avoid furnace slag carryover to decrease FeO content. In this
way steelmakers work to improve conditions at the end of blowing (less oxidation, high
slag viscosity and avoiding reblows). They use devices to minimize or detect vortex
formation during tapping with slag balls or darts, as well as infrared and electromagnetic
systems. Another way to lower FeO content is by dilution, where synthetic slag additions
such as lime, dolomite and calciumaluminate are made.
Iron oxide in the slag is detrimental to the steel cleanliness because it can have
higher oxygen activity than in the steel which will cause reoxidation. The relationship
between FeO + MnO in ladle slag and total oxygen (TO) is shown in Figure 2-8, and the

Master Thesis- J. Pérez McMaster University- Materials Science and Engineering
Final Report- Steelmaking Course 26
alumina inclusion content in the slag is shown as a function of FeO+ MnO in the slag in
Figure 2-9.
Aluminum is used to deoxidize slag; as FeO content in the slag increases more
aluminum is necessary and this decreases the cleanliness level of the steel (Figure 2-
10). Some plants use the quantity of aluminum added and the residual aluminum content
as an index to control the steel cleanliness. A similar effect can be seen with the
phosphorus reversion, BOF or EAF slags contain high phosphorus levels (because it is
in equilibrium with high oxygen dissolved in the steel, equation 2-11), if the slag carry
over from primary vessel is high, phosphorus reversion is produced when the slag is
killed (Figure 2-11).
3 CaO + 2 P + 5 O Ca3(PO4) 2 K1600 = 1.4 x 10⁻¹¹ (2-11)
Figure 2-8. Relationship between FeO+MnO in
ladle slag and T.O. for different treatments
(Zhang & Thomas, 2003).
Figure 2-9. Effect of FeO+MnO in ladle slag in
inclusion content in tundish (Ahlborg, Bieniosek
& Tucci, 1993).

Master Thesis- J. Pérez McMaster University- Materials Science and Engineering
Final Report- Steelmaking Course 27
2.7.3 Inclusion Removal to Slag
The process to remove an inclusion by the slag has been modeled (Cramb & Jimbo,
1989; Sridhar & Cramb, 2001; Nakashima & Okamura, 1992) and the following stages
must be considered:
- Inclusion approaches the interface
- Rupture of the steel film resulting in inclusion- slag contact
- Dissolution of the inclusion in the slag; for this stage it is very important that the
slag is not saturated in alumina.
Taira, Nakashima & Mori (1993) studied Al2O3 dissolution in CaO- Al2O3- SiO2 slags
and found that boundary layer diffusion was rate controlling.
The particle dissolution rate in slags is a function of temperature and chemistry; the
dissolution time decreases when the temperature increases and when the alumina
content in the slag decreases for slags with similar MgO and SiO2 content (Sridhar &
0
50
100
150
200
250
0 50 100 150 200 250 300Kg of Aluminum to kill slag
Qua
ntity
of i
nclu
sion
s
0
50
100
150
200
250
0 20 40 60 80 100 120P reversion (ppm)
Qua
ntity
of i
nclu
sion
s
Figure 2-10. Relationship between quantity of
inclusions and Kg of aluminum used to kill
slag (Brandaleze, Martín, Donayo, Pérez &
Gómez, 2007).
Figure 2-11. Quantity of inclusions in function
of phosphorus reversion (Brandaleze, Martín,
Donayo, Pérez & Gómez, 2007).

Master Thesis- J. Pérez McMaster University- Materials Science and Engineering
Final Report- Steelmaking Course 28
Cramb, 2001). Figure 2-12 shows when temperature increases by 50°C total dissolving
time decreases by more than 1/3 (in a CaO- Al2O3- SiO2 slag).
Figure 2-12. Changes in equivalent radius of alumina particles at different temperatures
(Slag: 48.9wt% Al2O3, 48.4wt% CaO, 0.52wt% MgO and 1.36wt%SiO2; Sridhar & Cramb,
2001).
Valdez and Cramb (2002) measured the effect of SiO2 and MgO content in the
slag on the Al2O3 inclusion dissolution time. Three different slags were analyzed to be
able study this effect; two tundish slag where the composition is given by rice shell (used
as cover to avoid temperature losses and reoxidation, it is pure silica) and slag carryover
from the ladle, and the third slag is from the ladle in equilibrium with an aluminum killed
steel. The chemical composition for slags studied is shown in Table 2-4, where CASM
and CAS are tundish slags (with and without Mg respectively) and the ladle refers to a
common ladle slag. The alumina content is shown by the bulk slag and the oxide
content for the saturation slag in alumina by the three slag samples.

Master Thesis- J. Pérez McMaster University- Materials Science and Engineering
Final Report- Steelmaking Course 29
Table 2-4. Slag composition (Valdez & Cramb, 2002).
Slag %SiO2 %CaO %MgO %Al2O3
(Bulk Slag)%Al2O3
(Saturation Slag)
CASM 39.5 33.4 7.3 19.5 34.5
CAS 42 36 0.4 21 42
Ladle 5 59 0 36 63
The inclusion removal is a function of the slag viscosity and the driving forces for
dissolution. Table 2-4 shows that the ladle slag allows more Al2O3 dissolved (in
saturation) than the tundish slags; according the effect of the SiO2 and MgO content on
Al2O3 dissolution (Valdez and Cramb, 2002). The driving forces for aluminum removal
are greater for ladle slag ( ∆ Al2O3 = 27%) than tundish slags ( ∆ Al2O3 = 21% for CAS
and 15% for CASM) although ladle slag has higher Al2O3 content.
When the SiO2 content is high the viscosity increases and the driving forces
decrease; then the dissolution time increases (Figure 2-13). MgO has a large effect on
the driving forces for dissolution; it decreases when MgO increases, but it does not have
strong effect on the viscosity. For this reason CASM has lower driving forces than CAS.
This concept is very important because if the kinetics of dissolution is not enough
fast, inclusions remain near the interface and increase the risk of reintrainment.

Master Thesis- J. Pérez McMaster University- Materials Science and Engineering
Final Report- Steelmaking Course 30
Figure 2-13. Comparison slag viscosity and
driving force for dissolution of Al2O3 in
different slags (Valdez & Cramb, 2002).
Figure 2-14. Total dissolution time for
different Al2O3 inclusion size in ladle and
tundish slags (Valdez & Cramb, 2002).
The dissolution time of inclusions is inversely proportional to a ratio between
super-saturation and slag viscosity (Figure 2-14). Dissolution is faster for small inclusions
or slag with low viscosities.
2.8 Stirring
The steel melt is stirred by inert gas (argon in general) bubbling through porous
plug(s) positioned at the ladle bottom or by electric induction stirring. In this study, inert
gas injected by bottom directional plugs is considered. Gas stirring is produced by
injecting gas through a porous or directional refractory plug or a tuyere in the bottom of
the ladle (Figure 2-15).

Master Thesis- J. Pérez McMaster University- Materials Science and Engineering
Final Report- Steelmaking Course 31
Figure 2-15. Schematic drawing of a directional plug to stir. Website:
//km.siderar.ot/mkm/siderar/mkm.asp
Krishnapisharody and Irons (2007) have studied the spouts formation on bath
surface due to gas stirring. Figure 2-16 shows the plume region lifts the top surface
because of the upward momentum of the flow (“spout”), the slag present there is pushed
to the periphery leaving a bare metal surface (“slag eye”). The exposed eye is the only
region where liquid metal is in contact with atmosphere and nitrogen and oxygen can be
adsorbed there. On the other hand, the refining reactions with slag are limited to the
slag-metal contact area (this is the total ladle area less eye area).
Figure 2-16. Schematic representation of the spout and slag eye formation
(Krishnapisharody & Irons, 2007)
Slots
Directional Slots
Refractory
Connection to gas
Slots
Directional Slots
Refractory
Connection to gas

Master Thesis- J. Pérez McMaster University- Materials Science and Engineering
Final Report- Steelmaking Course 32
Gas bubbling is effective in removing inclusions by two mechanisms: firstly, the
bubbles collide with the inclusions and float up with them with higher velocity than an
inclusion alone. Secondly, the buoyant plume created by the stirring transports the
inclusions to the top surface and produces turbulent mixing with the slag layer.
Stirring the steel bath improves the collisions between inclusions. The inclusions
attach to the gas bubbles and rise with them. There are many studies about the stirring
effect on steel cleanliness. Cold modeling (Pan, Uemura & Koyama, 1992) has
demonstrated that if the particles are not wetted by the liquid phase, they can be caught
by gas bubbles and removed by them. Solid inclusions like alumina or silica are not-
wetted by liquid steel, so they can attach to the inert gas bubbles and float up with them.
It has been considered (Wang, Lee & Hayes, 1996) that smaller bubbles are
better to remove inclusions, so the metallurgical industry has worked to produce finer
bubbles (to replace tuyeres and injection lances by porous or directional refractory
plugs). Because of it they assume that smaller bubbles have a high probably of collision
with inclusions, but they have lower velocity to float up than larger inclusions (larger
bubbles have lower probability to catch inclusions than smaller ones).
2.8.1 Bubble Diameter and Terminal Velocity
Anagbo & Brimacombe (1990) have reported that the formation of bubbles at the
surface of a porous plug depends on the superficial velocity, gas flow rate per unit
surface area of the plug. Fine bubbles are formed when this velocity is less than 0.14
m/s; beyond this, coalescence occurs.

Master Thesis- J. Pérez McMaster University- Materials Science and Engineering
Final Report- Steelmaking Course 33
The relationship between bubble and inclusion is described in models by different
parameters like bubble size, physical properties (viscosity, density and surface tension)
and the velocities.
The terminal velocity and the shape of the bubble depend of the bubble size. In
Figure 2-17, all models show a maximum velocity in the transition zone. Bubbles smaller
than this value (in the range of 5 mm), are spherical; bubbles bigger than this are
ellipsoidal.
Figure 2-17. Terminal velocities of gas bubbles in liquid steel as a function of the bubble
size (Wang, Lee & Hayes, 1996)
2.8.2 Inclusion Removal to Bubbles:
Wang, Lee & Hayes (1996) developed a model to predict the optimum bubble
size for inclusion removal by flotation. They assumed that each bubble has: a probability
of collision with an inclusion (Pc), a probability of catching an inclusion by adhesion (Pa),
and a probability to detachment of it (Pd). Then, the overall probability of a inclusion can
be removed to bubble is P (P= Pc*Pa*(1- Pd)).

Master Thesis- J. Pérez McMaster University- Materials Science and Engineering
Final Report- Steelmaking Course 34
The mechanism for an inclusion flotation by a gas bubble is described by different
authors (Schulze, 1989 and 1992; Weber & Paddock, 1983; Yoon & Luttrell, 1989;
Zhang & Taniguchi, 2000), it can be divided in several sub-processes:
a. Approach of a particle to a bubble.
b. Formation of a thin liquid film between the particle and the bubble.
c. Oscillation and/ or sliding of the particle on the bubble surface.
d. Drainage and rupture of the film with the formation of a dynamic three-phase
contact (TPC).
e. Stabilization of bubble/ particle aggregates against external stresses
f. Flotation of the bubble/ inclusion aggregates
Figure 2-18. Schematic representation of mechanisms of particle attachment to a gas
bubble (Miki, Thomas, Denissov & Shimada, 1997)
Pc has a relationship with the inclusion size and the bubble diameter (Figure 2-
19), the probability of a bubble of collision with a particle increases when the bubble
diameter decreases or inclusion size increases (the latter has a large impact on Pc).

Master Thesis- J. Pérez McMaster University- Materials Science and Engineering
Final Report- Steelmaking Course 35
When the bubble size is less than 0.5 mµ the bubbles are entrapped by steel convection
and they cannot be removed. The adhesion probability (Figure 2-20) increases with a
decrease in inclusion size, but it is independent of the bubble diameter. Adhesion
depends the sliding rate of inclusion along the bubble (smaller inclusions are easily
captured by the gas bubble during sliding), and the rate of steel film drainage and
rupture. Smaller inclusions have a higher Pa then the larger inclusions. Wang, Lee &
Hayes (1996) proved the optimum efficiency of flotation of inclusions with diameter
between 5 to 50 mµ , it was obtained using bubble diameters between 0.5 to 2 mm; it
was obtained by the calculation of stability of bubble- particle aggregates, the rising time
of the gas bubbles and the efficiency for the inclusion removal.
Figure 2-19. Probability by collision
inclusion- bubble in a function of bubble and
inclusion size (Wang, Lee & Hayer, 1996).
Figure 2-20. Probability by adhesion of
inclusion on the surface of bubbles as a
function of bubble and inclusion size (Wang,
Lee & Hayer, 1996).

Master Thesis- J. Pérez McMaster University- Materials Science and Engineering
Final Report- Steelmaking Course 36
Dekkers (2002) studied the impact of the stirring effect on the cleanliness of steel (by
a total oxygen measurement). His results are different from values achieved in other
plants, they show:
- There is no relationship between total oxygen (T.O.) at the end of the ladle
metallurgy versus the gas stirring time in the Sidmar plant (Figure 2-21). Apparently
when stirring time increases (without vacuum treatment) it may cause reoxidation
(it could be measured by nitrogen pick up).
- Total oxygen at the end of the ladle metallurgy is independent of the volume of
stirring gas.
- There is no relationship between total oxygen and flux of gas stirring. (Figure 2-22)
Figure 2-21. T.O. at the end of ladle
metallurgy vs stirring time (Dekkers 2002,
Chap. 10).
Figure 2-22. T.O. in the ladle vs average
flux of gas stirring (Dekkers 2002, Chap.
10).
Miki, Thomas, Denissov and Shimada (1997) and Zhang and Thomas (2002)
suggest to first stir vigorously to mix and promote collision of small inclusions into large

Master Thesis- J. Pérez McMaster University- Materials Science and Engineering
Final Report- Steelmaking Course 37
ones, and a final stir to recirculate the steel slowly to allow the inclusion removal by the
slag and prevent the formation of inclusions.
Figure 2-23. T.O. in ladle versus ladle
stirring time (Bonilla, 1995).
Figure 2-24. Relationship between T.O.,
stirring power and stirring time (Zhang and
Thomas, 2003).
According to Figure 2-23, stirring times about 10- 15 minutes are necessary to
remove inclusions (they go to the slag and they are removed to it). Larger stirring flow or
longer time is detrimental because:
1- The eye can be opened and reoxidation is produced.
2- Increases the danger of slag entrainment
3- Produces particle collisions into large inclusions
And also it affects other operation conditions as:
4- Ladle lining erosion is produced (increased operation cost).
5- Increases the heat losses (increase operation cost).

Master Thesis- J. Pérez McMaster University- Materials Science and Engineering
Final Report- Steelmaking Course 38
Engh and Lindskog (1975) presented a fluid mechanical model for inclusion
removal from liquid steel, where the total oxygen content after stirring time (t) is given by:
Ct / Ci ≈ 27/te ε−
Where Ci and Ct are initial total oxygen content and after stirring respectively, t is
stirring time and ε is stirring power.
In trials made in Ternium Siderar it is possible to see that 15 minutes is enough to
remove inclusions; Figure 2-25 shows the inclusion evolution in 5 mm2 surface area
measured by EDS.
0
50
100
150
200
250
0 10 20 30 40Minutes of Stirring
Qua
ntity
of i
nclu
sion
s
Figure 2-25. Relationship between inclusion content and gas bubbling time in Ternium
Siderar (Brandaleze, Martin, Donayo, Pérez & Gomez, 2007).
2.9 Refractory
There are two main kinds of refractories, acid and basic ones; they are in contact
with the steel and can affect the cleanliness of it. Bannenberg (1995) studied the
relationship between oxygen activity and aluminum content in the steel with acid and
basic ladle refractories (Figure 2-26). The oxygen activity is close to the equilibrium in

Master Thesis- J. Pérez McMaster University- Materials Science and Engineering
Final Report- Steelmaking Course 39
basic refractory, but is larger than in the acid refractory, because the oxygen activity is
higher in these ones.
Figure 2-26. Oxygen activity in relationship to aluminum for basic and acid refractory
materials (Bannenberg, 1995).
For this reason and life of ladle refractory, nowadays only basic refractory is used
in aluminum killed steel. They do not affect the steel cleanliness considerably, but they
are very important in inclusion removal. The refractory wall acts as a capture site for
inclusions.

Master Thesis- J. Pérez McMaster University- Materials Science and Engineering
Final Report- Steelmaking Course 40
Chapter 3
MATHEMATICAL MODEL
3.1 General Aspects
The current thesis describe a mathematical model to estimate the inclusion
distribution (in quantity and size) during a secondary metallurgy process in a ladle
furnace; transformation and modification of inclusion during steel casting or calcium
treatment are not considered. Only aluminum oxide inclusions are considered; in low
carbon, aluminum killed steel, this approximation is good, because Al2O3 is the main
inclusion.
The model is based on the work of several authors to describe inclusion removal
to slag, refractory and bubbles, and reoxidation from slag and atmosphere (Wang, Lee
and Hayer (1996), Söder (2004), Hallberg, Jönsson, Jonsson and Eriksson (2005),
Zhang and Thomas (2002)).
Inclusion nucleation is not modeled; initial alumina inclusion particle size
distributions are taken from plant measurements.
3.1.1. Assumptions and Second Order Effects which Have Been Neglected
3.1.1.1 Eye Area:
- This parameter is defined as the steel surface that is free of slag, where the
steel is in contact with the atmosphere and reoxidation is produced.

Master Thesis- J. Pérez McMaster University- Materials Science and Engineering
Final Report- Steelmaking Course 41
- Eye area is calculated as a function of gas flow rate, ladle height and slag
thickness.
3.1.1.2 Inclusions Removed by Slag, Bubbles and Refractory:
- Stirring power and temperature are kept constant in each step.
- Calculations are made for only one type of inclusion (alumina).
- The bubbles are of identical size and uniformly distributed in the two phase
plume.
- After each time step the melt is considered homogeneous and the distribution of
inclusions is uniform in the melt.
- Inclusions in the size range of radius 1- 10 um are considered in calculations,
and they are assumed to be spherical.
- Inclusion formation from slag and refractory is neglected.
- The time of each step is one second.
3.1.1.3 Reoxidation:
- Reoxidation may occur by oxygen transfer from the slag to steel.
- Reoxidation in the eye is considered.
3.1.1. 4 Second Order Effects Neglected:
- Inclusion of other compositions besides alumina.
- Initial inclusion sizes are kept during the process, inclusion growth is not
calculated. Inclusion growth calculations increase the complexity of the model
with little effect on the results; this is further justified in Section 3.2.7.

Master Thesis- J. Pérez McMaster University- Materials Science and Engineering
Final Report- Steelmaking Course 42
- Slag entrainment or other exogenous inclusions are neglected.
- No inclusion transformation is considered.
3.2 Description: Framework of Model
3.2.1 Initial Inclusion Number (NRo):
The number of inclusions at the beginning of treatment depends of the oxidation
level in the tapping and the size distribution of inclusions.
The model considers a size distribution with three different groups (small,
medium and large), where Ri is the inclusion radius for each one, the inclusion radius
and portion of it in the total content are taken from the plant data immediately after
aluminum addition.
The inclusions are produced by deoxidation of steel with aluminum according
Equation 2-2 (where alumina activity is equal to 1).
2 Al + 3 O à Al2O3(s) K = a[Al]2 a[O]
3 Log K = -62680/ T +
31.85(2-2)
The quantity of particles formed depends of the dissolved oxygen content at the
end of blowing (OIni) and the dissolved oxygen level after deoxidation (OEq). The last
oxygen content is not measured; it can be estimated by a correlation with the aluminum
level after tapping, where from Equation 2-2:

Master Thesis- J. Pérez McMaster University- Materials Science and Engineering
Final Report- Steelmaking Course 43
[ ]3/1
2
85.3162680
]10[Al
T
O aa
+−
=
(3-1)
Considering the activity of any component to be a function of its concentration
and according Equation 3-1 (Turkdogan, 2001), where fO=antilog-3.9[%Al] and fAl=1.
[ ]3/1
2
85.3162680
]})%{
10[1%Al
T
O fAlfOEq
+−
=
(3-2)
This is a oxygen in equilibrium with aluminum (free oxygen and oxygen contained
in the alumina particles).
The number of total Al2O3 molecules (N) produced is defined in Equation 3-3,
where 48 is molecular weight of oxygen (g/ mol; considering 3 atoms of oxygen in each
molecule of alumina), Feρ is the steel density (kg/m3), 1000 is a conversion factor
(density) and NA is Avogadro’s number (1/mol). The aluminum weight is not necessary,
because the Al2O3 particles produced can be described by each one of its reagents
(Equation 2-2).
Fe
AEqIni NOON
ρ48)%(%1000 −
= (3-3)
Zhang, Pluschkell and Thomas (2002) developed a theory to explain the quantity
of alumina molecules which can be found in an inclusion of any radius (for example of

Master Thesis- J. Pérez McMaster University- Materials Science and Engineering
Final Report- Steelmaking Course 44
radius i, RI). The number of molecules (I) included in an inclusion of radius i (RI) is
shown in Equation 3-4, where RM = 2.719 10-10 m for an alumina molecule:
3)/( MI RRI = (3-4)
The alumina molecules coalesce as inclusions of several sizes. The quantity of
particles of each radius (NRoi) at tapping depends of the inclusion radius (RI), the portion
of inclusion of each size (“Z”, this value is taken from plant data) and the Al2O3 molecular
radius (RM). It is calculated as Equation 3-5:
INOOZ
NRFe
AEqIniOI ρ048.0
)( −=
(3-5)
“Z” value is taken from 4 heats sampled and evaluated according to Section 4.4
and 4.5. The alumina inclusion distribution for the first sample of each one of these heats
after the deoxidation are drawn in Figure 3.1.

Master Thesis- J. Pérez McMaster University- Materials Science and Engineering
Final Report- Steelmaking Course 45
0
2
4
6
8
10
12
14
0 1 2 3 4 5 6 7 8 9Diameter (microns)
Incl
usio
n nu
mbe
r/ Sa
mpl
e860630
860613
880558
880595
Figure 3-1. Distribution of alumina inclusion in heats analyzed after deoxidation.
Most of the inclusions are between 1 and 5 microns, considering three different
groups: inclusions with diameter below 2 microns (54% of total), between 2 and 5 (38%)
and between 5 and 10 microns (8%) according to Figure 3-2.
0
5
10
15
20
25
30
35
40
45
2 5 10 Diameter (microns)
Incl
usio
n nu
mbe
r/ Sa
mpl
e
860630
860613
880558
880595
Figure 3-2. Quantity of alumina inclusions in each group for the heats evaluated.

Master Thesis- J. Pérez McMaster University- Materials Science and Engineering
Final Report- Steelmaking Course 46
The model calculates this initial inclusion number by each size; the inclusion
evolution is calculated for the equations group described below for each inclusion size.
3.2.2 Inclusion Removed by Bubbles Model (from Wang, Lee and Hayer, 1996):
The model uses the Wang, Lee and Hayer (1996) concept. The inclusion can be
removed by the bubble only if it is attached to it. The attachment probability P is P =
PC*PA*(1 – PD), where PC is the collision probability and PA is the probability of catching
an inclusion by adhesion. The model considers which all inclusions attached to the
bubbles are removed from the steel and there is non detachment (PD = 0).
To explain the collision probability (PC), an isolated bubble rising through a group
of inclusions must be considered. Figure 3-3 shows a flow pattern formed by a series of
streamlines around the bubble.
Figure 3-3. Schematic representation of collision of inclusion with a bubble (Wang, Lee &
Hayer, 1996).
I
•

Master Thesis- J. Pérez McMaster University- Materials Science and Engineering
Final Report- Steelmaking Course 47
The inclusion trajectory is defined by the streamline which passes through its
centre. Inclusions collide with the bubble when they have a grazing streamline at ROC
distance from the centre of bubble; inclusions with streamline distance longer than ROC
cannot be attached to the bubble. The collision probability (PC) is defined as the ratio of
the area AOC = (π ROC2) and ABP = (π (RB + RI)2), for a particle diameter (DI) smaller than
bubble diameter (DB) which is the normal condition in steelmaking:
2
2
)( IB
OC
BP
OCC RR
RAAP
+==
(3-6)
ROC is unknown and must be determined from the mathematical description of the
grazing streamline. Several models have been developed with different complexities in
the mathematical expressions, but with similar results for the collision probability (Wang,
Lee & Hayer, 1996) for a range of Reynolds Number from 1 to 500.
Yoon and Luttrell (1989) developed a relatively simple model; it involves the
Stokes and potential flow equations to obtain an empirical stream function ( Ψ ) for 1 <
Re < 100. The authors consider that this equation can be applied for Reynolds number
larger than 100 but below 500.
++−++−=Ψ 111
15Re
41
43
2sin 2
72.022 B
BBBBBRV BB θ
(3-7)
Where B = (Ri + RB)/ RB. When Reynolds number is close 0, the equation shows
the results for Stokes Law only.

Master Thesis- J. Pérez McMaster University- Materials Science and Engineering
Final Report- Steelmaking Course 48
According to Figure 3-3, the maximal distance so that ROC = RB + RI along the
particle path trajectory when θ = 90°. For smaller distance of far ahead of the bubble:
BI
OC
RRR
+=θsin (3-8)
Which can be substituted in Equation 3-7 to yield:
BOC
VR Ψ
=22
(3-9)
Heindel and Bloom (1999) defined a system of equations in polar coordinates
(spherical coordinates projected onto the x-y plane) for bubble and particle velocities.
These equations combined with Equations 3-6, 3-7 and 3-9 give the collision probability
as a function of K1, K2 and Reynolds number, according Equation 3-10:
( ) ( )32
22
2
272.0
21 1115
)2(Re223
11
KK
KKK
KPC +
−
+
+++
−=
(3-10)
Where K1 and K2 are the dimensionless relation by velocity and diameter for
inclusion and bubble; they are summarized in Equations 3-11 and 3-12:
B
Z
VVK =1
(3-11)

Master Thesis- J. Pérez McMaster University- Materials Science and Engineering
Final Report- Steelmaking Course 49
B
I
DDK =2
(3-12)
Some inclusions which have low probability to be attached by collision may be
removed from the steel by adhesion. In the adhesion process, the liquid film thinning
between a bubble and a particle is controlled by the molecular forces at the interface. If
the particle is not wetted, the liquid film will be unstable and will rupture at a critical film
thickness (HCr). Schulze and Birzer (1987) obtained two empirical relationships
(Equations 3-13 and 3-14) for critical film thickness, surface tension (σ ), contact angle
(θ ) and Hamaker constant (A13B). Equation 3-13 is used to calculate the critical film
thickness.
( )[ ] 16.08 cos1100010*33.2 θσ −= −CrH (3-13)
16.013
810*79.3 BCr AH −= (3-14)
The Hamaker constant (A) is the measure of the Van der Waals force between
particles (in a particle- liquid- bubble system), it is described by the number of molecules
in a unit volume (q1), and the constant in London’s equation for interaction between two
atoms ( 1β ).
12
12 βπ qA = (3-15)

Master Thesis- J. Pérez McMaster University- Materials Science and Engineering
Final Report- Steelmaking Course 50
Osborne-Lee (1988) showed that the Van der Waals force has very weak
temperature dependence, so London’s constant does not change with temperature and
only q1 is a function of it. Taniguchi, Kikuchi & Ise (1996) resolved Equation 3-12 for
Al2O3 in liquid steel, where Hamaker constant (A13B) is 2.3*10-20, and 1 denotes particle
(alumina), 3 liquid (steel) and B gas bubble.
There is a time for the drainage of the liquid film between the gas and the
inclusion until the time film rupture occurs, TF. TF was verified by Schulze (1989) in his
experiments using a pendant water drop and a high speed camera. The inclusion
approaches the gas bubble and a thin liquid steel film develops between the inclusion
and the bubble; the film gradually drains until the film rupture occurs and the inclusion is
attached.
If the collision time is longer than the film drainage time the inclusion will be
attached by collision, but if this time is shorter than TF, the inclusion will rebound away
from the bubble or slide on the bubble surface. If the sliding time is longer than TF the
attachment will occur during sliding, but if this time is shorter than TF the inclusion will
slide away.
( )[ ] 2
2
32.1
1808322100
−
=π
σαµ
Cr
IBZFeF GH
RVVT (3-16)
The inclusions can float up in a calm bath by density difference (Stokes law). In a
gas-stirred liquid metal, the rising velocity in z direction (Vz) is a function of the gas flow
rate. In a stirred bath, it is difficult to calculate the relative velocity (Vr = Vb - Vz) of a
bubble and an inclusion (Vz). Oeters (1994) defined terminal inclusion velocity (Vz) for
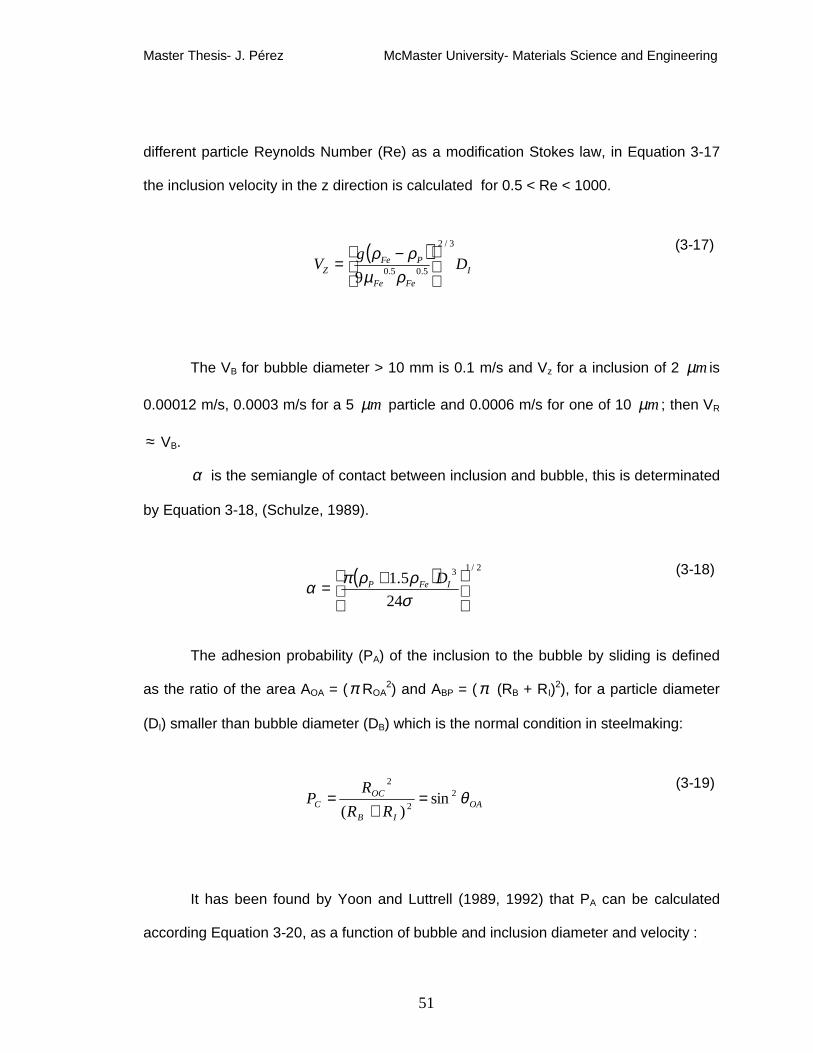
Master Thesis- J. Pérez McMaster University- Materials Science and Engineering
Final Report- Steelmaking Course 51
different particle Reynolds Number (Re) as a modification Stokes law, in Equation 3-17
the inclusion velocity in the z direction is calculated for 0.5 < Re < 1000.
( )I
FeFe
PFeZ DgV
3/2
5.05.09
−=
ρµρρ (3-17)
The VB for bubble diameter > 10 mm is 0.1 m/s and Vz for a inclusion of 2 mµ is
0.00012 m/s, 0.0003 m/s for a 5 mµ particle and 0.0006 m/s for one of 10 mµ ; then VR
≈ VB.
α is the semiangle of contact between inclusion and bubble, this is determinated
by Equation 3-18, (Schulze, 1989).
( ) 2/13
245.1
+=
σρρπ
α IFeP D
(3-18)
The adhesion probability (PA) of the inclusion to the bubble by sliding is defined
as the ratio of the area AOA = (π ROA2) and ABP = (π (RB + RI)2), for a particle diameter
(DI) smaller than bubble diameter (DB) which is the normal condition in steelmaking:
OAIB
OCC RR
RP θ2
2
2
sin)(
=+
= (3-19)
It has been found by Yoon and Luttrell (1989, 1992) that PA can be calculated
according Equation 3-20, as a function of bubble and inclusion diameter and velocity :

Master Thesis- J. Pérez McMaster University- Materials Science and Engineering
Final Report- Steelmaking Course 52
−
++−+−−
+−
= ZBIB
F VVXXXXXDD
TPA .114
215
Re4
14312exparctan2sin 34
72.0
32
(3-20)
Considering K2 from Equation 3-12:
21 KX += (3-21)
It is assumed that the inclusions are removed by stirring only if the particle is
attached to the bubble, then the quantity of inclusions of radius i removed by stirring
(NRBi) is function of the PC, PA, gas flow rate, the distance which have to run (bath
height, H), the quantity of particles of each size (NRI) and the bubble size.
VTDWPTPQHNR
tNR
OB
lSteeACIBI
23
=∂
∂ (3-22)
3.2.3 Eye Area (Krishnapisharody and Irons, 2007):
Several authors (Anagbo and Brimacombe (1990), Sahajwalla, Castillejos and
Brimacombe (1990), Yonezawa and Schwerdtfeger (2000), Guo and Irons (2002),
Krishnapisharody and Irons (2007)) have worked to explain the effect of different
variables such as gas flow rate, nozzle size, ladle height, and so on over the eye area.
Krishnapisharody and Irons (2007) developed mathematical models to relate the
eye area with the gas flow rate and bath height. They found that the surface area of the
exposed eye (AEye) has a non linear relation with the gas flow rate (Q, in cubic meter per
second), ladle height (H, in meter) and also slag thickness, according Equation 3-23.

Master Thesis- J. Pérez McMaster University- Materials Science and Engineering
Final Report- Steelmaking Course 53
( )[ ]16.111414.05.146.274.078.322.0 −+= −− HQHQAEye
(3-23)
The eye area is important because affects the number of inclusions produce by
reoxidation (Equation 3-41 and 3-43) and it gives the useful area to remove inclusions by
slag (Equation 3-24).
3.2.4 Inclusion Removal according to Slag Model (by Hallberg, Jönsson, Jonsson and
Eriksson, 2005):
Inclusions float up through the liquid metal into the slag where they are removed.
The inclusions float up in a calm bath by density difference (Stokes law). In a gas-stirred
liquid metal, the rising velocity in z direction (Vz) is a function of the gas flow rate
(Equation 3-17).
The model assumes that all the inclusions which reach the slag are removed by
it. The number of particles of i radius per unit volume, which are removed to slag (NSlagi)
per unit time is:
VNRVA
tN IZSlagSlag =∂
∂ (3-24)
where the slag area (ASlag) is the difference between the ladle area (ALadle) and the AEye
calculated in Equation 3-23.
EyeLadleSlag AAA −= (3-25)
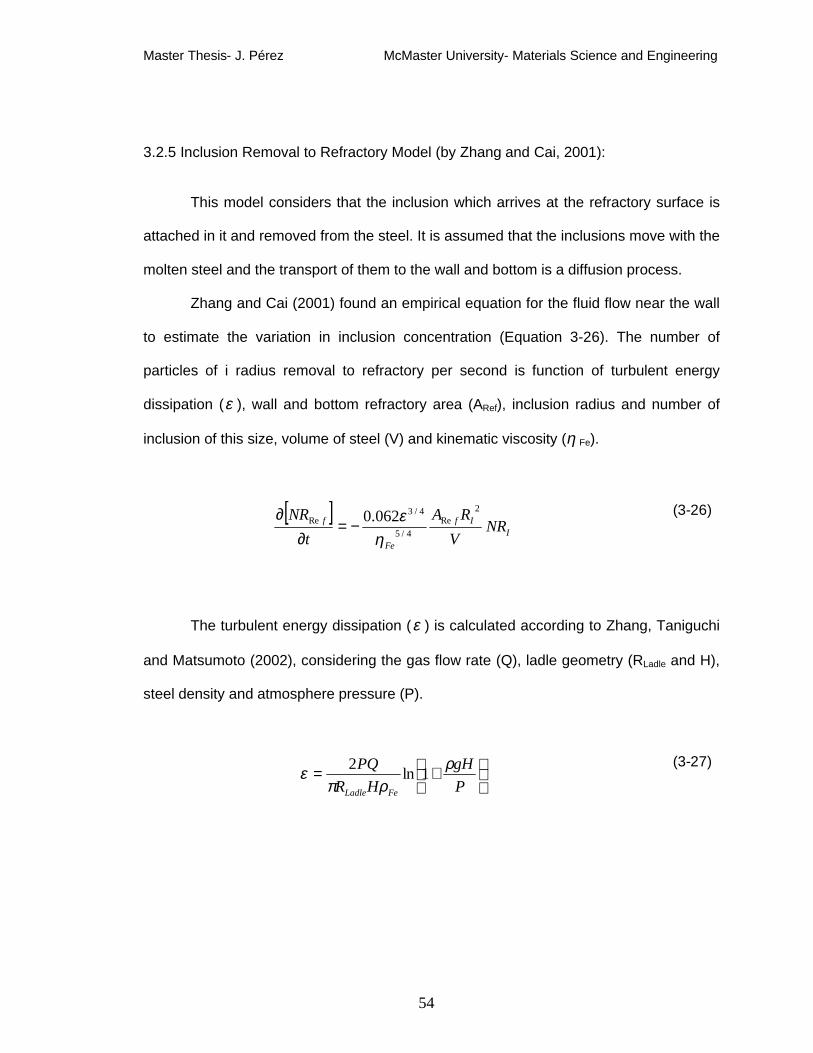
Master Thesis- J. Pérez McMaster University- Materials Science and Engineering
Final Report- Steelmaking Course 54
3.2.5 Inclusion Removal to Refractory Model (by Zhang and Cai, 2001):
This model considers that the inclusion which arrives at the refractory surface is
attached in it and removed from the steel. It is assumed that the inclusions move with the
molten steel and the transport of them to the wall and bottom is a diffusion process.
Zhang and Cai (2001) found an empirical equation for the fluid flow near the wall
to estimate the variation in inclusion concentration (Equation 3-26). The number of
particles of i radius removal to refractory per second is function of turbulent energy
dissipation (ε ), wall and bottom refractory area (ARef), inclusion radius and number of
inclusion of this size, volume of steel (V) and kinematic viscosity (η Fe).
[ ]I
If
Fe
f NRV
RAt
NR 2Re
4/5
4/3Re 062.0
ηε
−=∂
∂ (3-26)
The turbulent energy dissipation (ε ) is calculated according to Zhang, Taniguchi
and Matsumoto (2002), considering the gas flow rate (Q), ladle geometry (RLadle and H),
steel density and atmosphere pressure (P).
+=
PgH
HRPQ
FeLadle
ρρπ
ε 1ln2 (3-27)
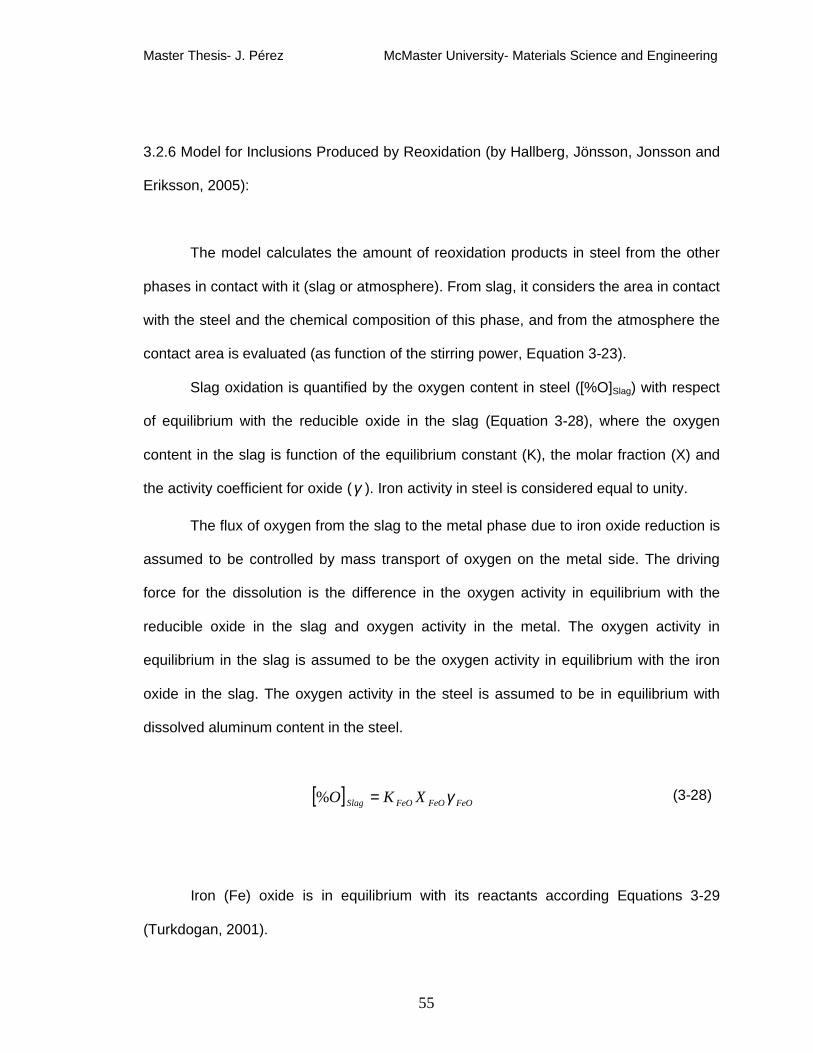
Master Thesis- J. Pérez McMaster University- Materials Science and Engineering
Final Report- Steelmaking Course 55
3.2.6 Model for Inclusions Produced by Reoxidation (by Hallberg, Jönsson, Jonsson and
Eriksson, 2005):
The model calculates the amount of reoxidation products in steel from the other
phases in contact with it (slag or atmosphere). From slag, it considers the area in contact
with the steel and the chemical composition of this phase, and from the atmosphere the
contact area is evaluated (as function of the stirring power, Equation 3-23).
Slag oxidation is quantified by the oxygen content in steel ([%O]Slag) with respect
of equilibrium with the reducible oxide in the slag (Equation 3-28), where the oxygen
content in the slag is function of the equilibrium constant (K), the molar fraction (X) and
the activity coefficient for oxide (γ ). Iron activity in steel is considered equal to unity.
The flux of oxygen from the slag to the metal phase due to iron oxide reduction is
assumed to be controlled by mass transport of oxygen on the metal side. The driving
force for the dissolution is the difference in the oxygen activity in equilibrium with the
reducible oxide in the slag and oxygen activity in the metal. The oxygen activity in
equilibrium in the slag is assumed to be the oxygen activity in equilibrium with the iron
oxide in the slag. The oxygen activity in the steel is assumed to be in equilibrium with
dissolved aluminum content in the steel.
[ ] FeOFeOFeOSlag XKO γ=% (3-28)
Iron (Fe) oxide is in equilibrium with its reactants according Equations 3-29
(Turkdogan, 2001).

Master Thesis- J. Pérez McMaster University- Materials Science and Engineering
Final Report- Steelmaking Course 56
FeOs à Fe + O ][][ OFeK γγ= 6937/5730 +−= TLogKFeO (3-29)
The activity of iron oxide is calculated as a function of all oxides content in a
multicomponent slag (CaO- SiO2- MgO- MnO- FeO- Al2O3 slag) according to the Ohta
and Suito (1998) model:
047.0%0214.0%
07.19%267.0%676.0
2
32 −+−+
= CaOSiO
OAlMgOLogaFeO
(3-30)
And the molar fraction for each oxide (X) is calculated as:
∑=
OxidesPMFeOX FeO
FeO/% (3-31)
Where the oxide addition (∑Oxides ) is summarized in Equation 3-32:
232
232 %%%%%%SiOOAlCaOMnOMgOFeO PM
SiOPM
OAlPM
CaOPM
MnOPM
MgOPM
FeOOxides +++++=∑ (3-32)
The oxygen content in the steel ([%O]Eq) represents the dissolved oxygen in the
steel in equilibrium with the aluminum content is summarized in Equation 3-1.
The reoxidation rate is calculated from the difference between the oxygen content
in the slag (Equation 3.28) and present in the steel (Equation 3.1), affected by the slag
area and the oxygen mass transfer coefficient (Ko,i). The oxygen content in the slag and

Master Thesis- J. Pérez McMaster University- Materials Science and Engineering
Final Report- Steelmaking Course 57
in the steel is calculated with each time step and the area of the slag is calculated which
each change in the gas flow rate.
[ ] [ ] [ ]( ) SlagIOEqSlagSteel
Tot AKOOWt
O,%%1%
−=∂
∂ (3-33)
The oxygen mass transfer coefficient is a function of the diffusion coefficient of
oxygen in steel (Do) and transfer time ( Et ) according Higbie’s surface theory (Equation
3-34). This theory is applicable for mass transfer between two liquids. Transport is
assumed to be controlled in the metal side.
5.0
, 2
=
E
OIO t
DKπ
(3-34)
Considering that Et is described in Equation (3-35) by eye and (3-36) by slag:
eye
eyeE v
Rt =
(3-35)
Slag
SlagE v
Rt =
(3-36)

Master Thesis- J. Pérez McMaster University- Materials Science and Engineering
Final Report- Steelmaking Course 58
And eyeSlag vv ⟨ , slag phase control diffusion. The Slagv can be defined as a function
of gas flow rate (Q ) and the slag area ( SlagA ):
SlagSlag A
Qv = (3-37)
Higbie’s theory for this model is summarized in the Equation 3-38
5.0
, 2
=
SlagLadle
OIO AR
QDKπ
(3-38)
Changing the slag area to eye area in Equation 3-33 and 3-38, the slag oxidation
to atmospheric oxygen in Equation 3-33, reoxidation by the atmosphere is obtained (3-
39).
[ ] [ ] [ ]( )∑=
−=∂
∂
1,%%1%
IEyeIOEqAir
Steel
Tot AKOOWt
O (3-39)
5.0
, 2
=
EyeLadle
OIO AR
QDKπ
(3-40)
In this thesis inclusion growth mechanisms are not considered the alumina
particles produced by reoxidation are new particles and are assumed to have only one

Master Thesis- J. Pérez McMaster University- Materials Science and Engineering
Final Report- Steelmaking Course 59
size (it is impossible to validate the inclusion size distribution produced only by
reoxidation). Three different inclusion diameters have been studied in this project 2, 5
and 10 mµ ; when the model is running for a given total oxygen value with the three
different sizes in separate ways, there are more smaller inclusions (2 mµ ) than larger
ones (10 mµ ). The latter ones are more harmful for steel cleanliness (according to
Section 2.3); and reoxidation is undesirable in the secondary metallurgy process
(Section 2.7.1). Therefore, the model considers that reoxidation produces inclusions with
a diameter of 10 mµ .
The number of particles of radius IR produced by reoxidation is calculated as the
variation of total oxygen with respect to time and other properties of the particle and the
gas (molecular relation ratio, density and molar weight):
( )[ ]
OOPI
PPFe
Tot
I
MRMt
O
tRN
ηρηρ
π 3
6104
%
9−
∂∂
=∂
∂(3-41)
3.2.7 Inclusion Distribution and Total Oxygen:
In this thesis inclusion growth mechanisms are not considered; the initial size
distribution of inclusions is taken after deoxidation according Equation 3-5 using plant
data. The agglomeration effect of smaller inclusions by bubbling to form bigger ones
(which float up easier) is neglected as well as the growth of inclusions by reoxidation, in
which case it is considered which one inclusion size (10 mµ ) is produced (Section
3.2.6). The assumption that the inclusions do not grow simplifies the model; this

Master Thesis- J. Pérez McMaster University- Materials Science and Engineering
Final Report- Steelmaking Course 60
simplification is justified because from a process or practical standpoint there is not much
difference between a number of inclusions that are a little bit bigger in diameter and a
number of inclusions that is a little bigger of the same diameter, within the narrow
bounds of plant data.
Starting from the assumption that the inclusions do not grow, they are removed
from the steel by bubbles, slag or refractory or they can be added by reoxidation. Then
the total number of inclusions of each size per second is calculated as the initial inclusion
number (and addition of inclusions produced by reoxidation in case of bigger inclusion)
less the addition of the inclusions removed by bubbling, refractory and slag.
tRN
tRN
tRN
tRN
tRN
tRN SlagIfracIBubblingIoxIInitialITotI
∂
∂−
∂
∂−
∂
∂−
∂∂
+∂
∂=
∂∂ )()()()()()( ReRe
(3-42)
The total change in oxygen per second can be estimated as the increase in the
final number of inclusions of radius i in time t, considering the fraction of each inclusion
(Xi) and the volume and weight of steel, atomic weight and Avogadro’s Number (Na),
according to Equation 3-43.
[ ]ASteel
III
i
FinalI
NWVRX
tRN
tTotalO 2
1
16000)(% ∑= ∂
∂=
∂∂
(3-43)

Master Thesis- J. Pérez McMaster University- Materials Science and Engineering
Final Report- Steelmaking Course 61
Chapter 4
EXPERIMENTAL METHODS AND RESULTS
4.1 Description of Ternium Siderar Plant
The samples to validate the model were taken in Ternium Siderar Argentina. The
integrated steelmaking plant produces 2.8 million tons per year of tin plate, cold and hot
rolled steel.
90% of its production is low carbon aluminum killed steel and the rest of it is
aluminum-silicon-manganese killed steel. They are used in automotive, domestic and
building industries.
Hot metal supplied by two blast furnaces arrives at the steelmaking shop by
torpedo cars (Figure 4-1, a). It is charged into a hot metal ladle and is carried to a
modern desulphurization station to remove the sulfur by lime and magnesium coinjection
(Figure 4-1, b). The desuphurized hot metal and metallic scrap are charged in the BOF
to produce steel by oxidation by oxygen injected at 2.2 Mach velocity. There are three
basic oxygen furnaces (BOF) of 200 T of liquid steel (Figure 4-1, C); two of them are in
operation and the third is in maintenance at any time. Steel is tapped from the BOF to a
200 T ladle with two bottom porous plugs for bubbling.
All secondary metallurgy processes are made in the ladle furnace and a trimming
station (Figure 4-1, d). All production is treated with calcium to modify the inclusions,

Master Thesis- J. Pérez McMaster University- Materials Science and Engineering
Final Report- Steelmaking Course 62
then these calciumaluminate inclusions have lower melting point than steel and they are
not clog the nozzle during casting (Section 2.4).
Casting is made in a two line continuous caster, and slabs of 200 mm thickness
are produced with width between 790- 1650 mm (Figure 4-1, e).
(a) (b)
(c) (d)
(e)
Figure 4-1. Steelmaking process in Ternium Siderar: (a) Torpedo cars from the blast
furnace, (b) Hot metal ladle in desulphurization station, (c) Basic oxygen furnace, (d)
Ladle furnace, (e) Continuous casting exit. Property of Ternium Siderar company.
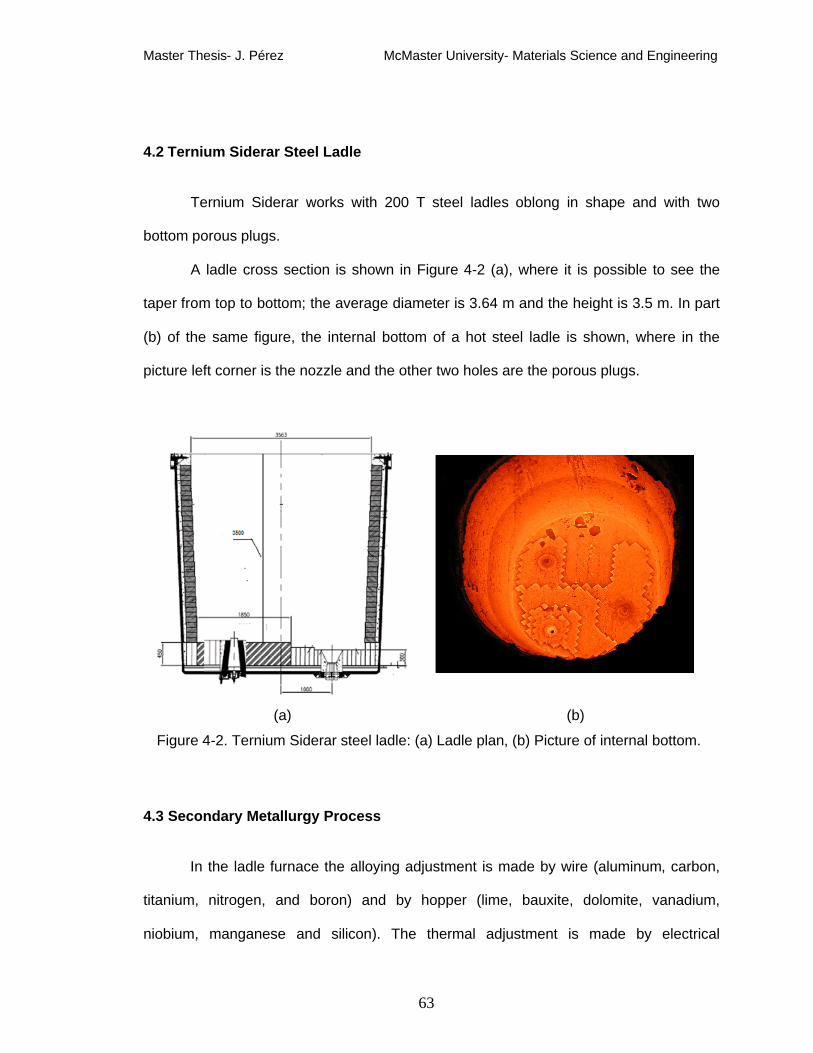
Master Thesis- J. Pérez McMaster University- Materials Science and Engineering
Final Report- Steelmaking Course 63
4.2 Ternium Siderar Steel Ladle
Ternium Siderar works with 200 T steel ladles oblong in shape and with two
bottom porous plugs.
A ladle cross section is shown in Figure 4-2 (a), where it is possible to see the
taper from top to bottom; the average diameter is 3.64 m and the height is 3.5 m. In part
(b) of the same figure, the internal bottom of a hot steel ladle is shown, where in the
picture left corner is the nozzle and the other two holes are the porous plugs.
(a) (b)
Figure 4-2. Ternium Siderar steel ladle: (a) Ladle plan, (b) Picture of internal bottom.
4.3 Secondary Metallurgy Process
In the ladle furnace the alloying adjustment is made by wire (aluminum, carbon,
titanium, nitrogen, and boron) and by hopper (lime, bauxite, dolomite, vanadium,
niobium, manganese and silicon). The thermal adjustment is made by electrical
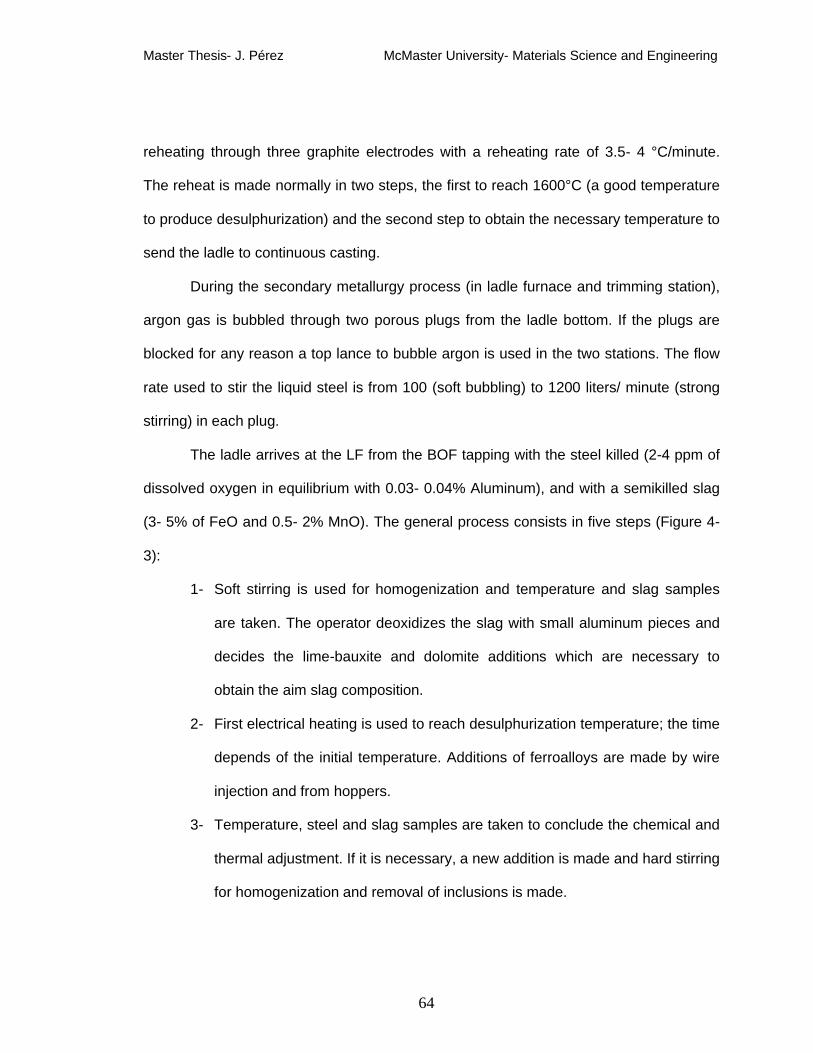
Master Thesis- J. Pérez McMaster University- Materials Science and Engineering
Final Report- Steelmaking Course 64
reheating through three graphite electrodes with a reheating rate of 3.5- 4 °C/minute.
The reheat is made normally in two steps, the first to reach 1600°C (a good temperature
to produce desulphurization) and the second step to obtain the necessary temperature to
send the ladle to continuous casting.
During the secondary metallurgy process (in ladle furnace and trimming station),
argon gas is bubbled through two porous plugs from the ladle bottom. If the plugs are
blocked for any reason a top lance to bubble argon is used in the two stations. The flow
rate used to stir the liquid steel is from 100 (soft bubbling) to 1200 liters/ minute (strong
stirring) in each plug.
The ladle arrives at the LF from the BOF tapping with the steel killed (2-4 ppm of
dissolved oxygen in equilibrium with 0.03- 0.04% Aluminum), and with a semikilled slag
(3- 5% of FeO and 0.5- 2% MnO). The general process consists in five steps (Figure 4-
3):
1- Soft stirring is used for homogenization and temperature and slag samples
are taken. The operator deoxidizes the slag with small aluminum pieces and
decides the lime-bauxite and dolomite additions which are necessary to
obtain the aim slag composition.
2- First electrical heating is used to reach desulphurization temperature; the time
depends of the initial temperature. Additions of ferroalloys are made by wire
injection and from hoppers.
3- Temperature, steel and slag samples are taken to conclude the chemical and
thermal adjustment. If it is necessary, a new addition is made and hard stirring
for homogenization and removal of inclusions is made.

Master Thesis- J. Pérez McMaster University- Materials Science and Engineering
Final Report- Steelmaking Course 65
4- Second electrical heating is used; the time depends of the last temperature
and the aim temperature for the continuous casting process.
5- Soft stirring to float out inclusions is used; temperature and steel samples are
taken.
6- In this process the temperature increases by electrical heating and decreases
by stirring.
1555
1560
1565
1570
1575
1580
1585
1590
1595
3 6 9 12 15 18 21 24Minutes
Tem
pera
ture
(°C
)
0
100
200
300
400
500
600
700
800
900
1000
Gas
Flo
w R
ate
(l/m
in)
TemperatureStirring
TemperatureSlag additions
TemperatureSlag & Steei
Samples
Slag & Steei Additions
TemperatureSlag & Steei
Samples
Figure 4-3. Steps of the ladle furnace process
The last part of the secondary metallurgy process is in the trimming station (TS);
it is a new station which was built in Ternium Siderar in 1997 to increase the productivity
of the ladle furnace (because it decreased the LF process time from 40 to 25 minutes
plus 15 minutes in the TS). Here only soft stirring and calcium treatment are performed.
This process consists in 3 steps (Figure 4-4):
1- Soft stirring is used to float out inclusions; this time can be longer if it is a very
low carbon steel or a clean steel where more flotation time is required.
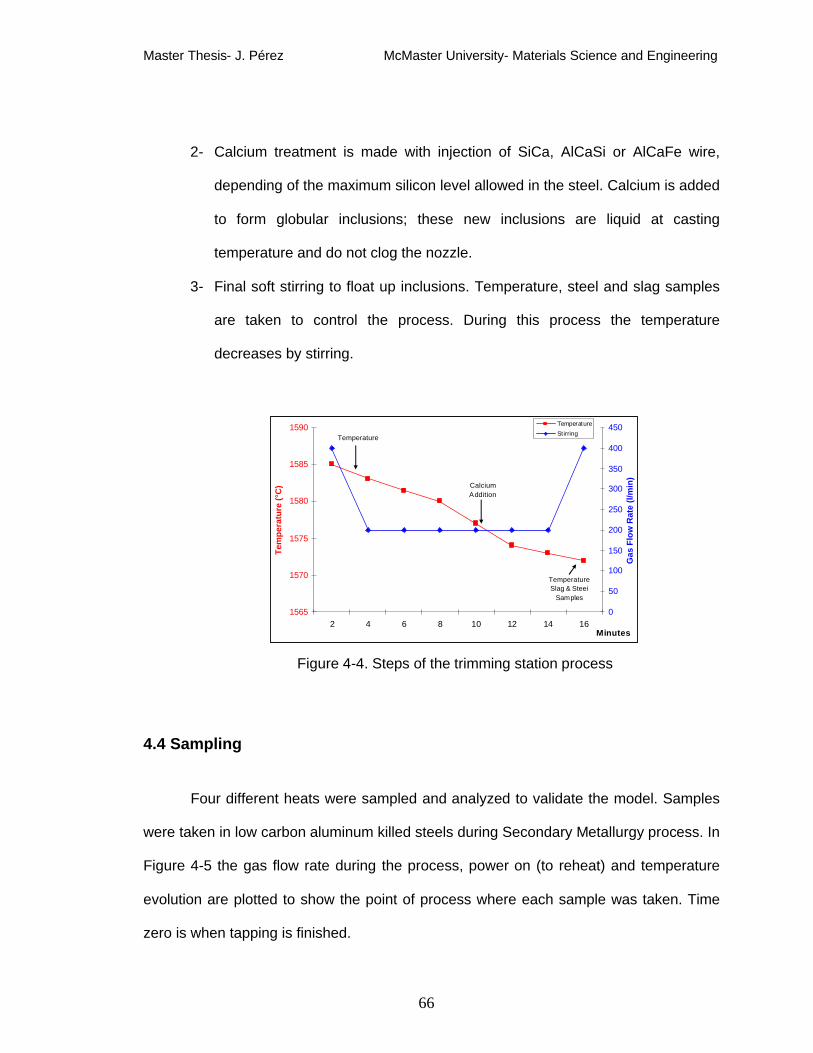
Master Thesis- J. Pérez McMaster University- Materials Science and Engineering
Final Report- Steelmaking Course 66
2- Calcium treatment is made with injection of SiCa, AlCaSi or AlCaFe wire,
depending of the maximum silicon level allowed in the steel. Calcium is added
to form globular inclusions; these new inclusions are liquid at casting
temperature and do not clog the nozzle.
3- Final soft stirring to float up inclusions. Temperature, steel and slag samples
are taken to control the process. During this process the temperature
decreases by stirring.
1565
1570
1575
1580
1585
1590
2 4 6 8 10 12 14 16Minutes
Tem
pera
ture
(°C
)
0
50
100
150
200
250
300
350
400
450
Gas
Flo
w R
ate
(l/m
in)
TemperatureStirringTemperature
Calcium Addition
TemperatureSlag & Steei
Samples
Figure 4-4. Steps of the trimming station process
4.4 Sampling
Four different heats were sampled and analyzed to validate the model. Samples
were taken in low carbon aluminum killed steels during Secondary Metallurgy process. In
Figure 4-5 the gas flow rate during the process, power on (to reheat) and temperature
evolution are plotted to show the point of process where each sample was taken. Time
zero is when tapping is finished.

Master Thesis- J. Pérez McMaster University- Materials Science and Engineering
Final Report- Steelmaking Course 67
0
200
400
600
800
1000
1200
1400
1600
1800
0 20 40 60 80 100 120Minutes
L/m
inFlow rate
Pow er On
Temp
Figure 4-5. Schematic secondary metallurgy process to show the time of samples.
The samples are described below; in all these points temperature, slag and steel
were sampled:
- S0: Sample 0 is the sample after tapping when deoxidation is finished.
- L0: It is the first sample when the ladle arrives in the Ladle Furnace, before the
slag deoxidation and adjustment.
- L1: It is the sample after the first heating and slag adjustment.
- L2: It is the sample after the strong stirring, in general all the additions were
made before it.
- L3: It is after the second electric heating and when the aim steel composition is
obtained.
- T1: It is in the trimming station after the soft stirring and before the calcium
injection.
Samples after calcium treatment are not taken because this process is not
included in the current model.
S0 L0 L1 L2 L3 T1
Master Thesis- J. Pérez McMaster University- Materials Science and Engineering
Final Report- Steelmaking Course 68
The steel sampler is the lollipop kind without any killing agent (zirconium is not
used, because it modifies the inclusion content and morphology). It is taken to analyze
the chemical composition and then must be prepared for the SEM to investigate the
inclusion content.
(a) (b)
Figure 4-6 Samples: (a) Lollipop steel sample, (b) Slag sample.
4.5 Analysis
Slag composition is determined by X-ray fluorescence in a compacted pellet of
milled slag, Figure 4.7. The X- ray equipment is an ARL 9800 XP SIM-SEQ XRF
(analysis by sequential in fixed channels and calibration by UniQuantâ®, a special
software package). The slag is crushed, a magnet is passed to remove the metallic iron,
and then a pellet is formed by pressure. The compositions of Ca, Mg, Mn, Si, Fe, S, Al,
P, Ti are taken as pure elements and after they are expressed as %weight of oxide.
(Appendix B).
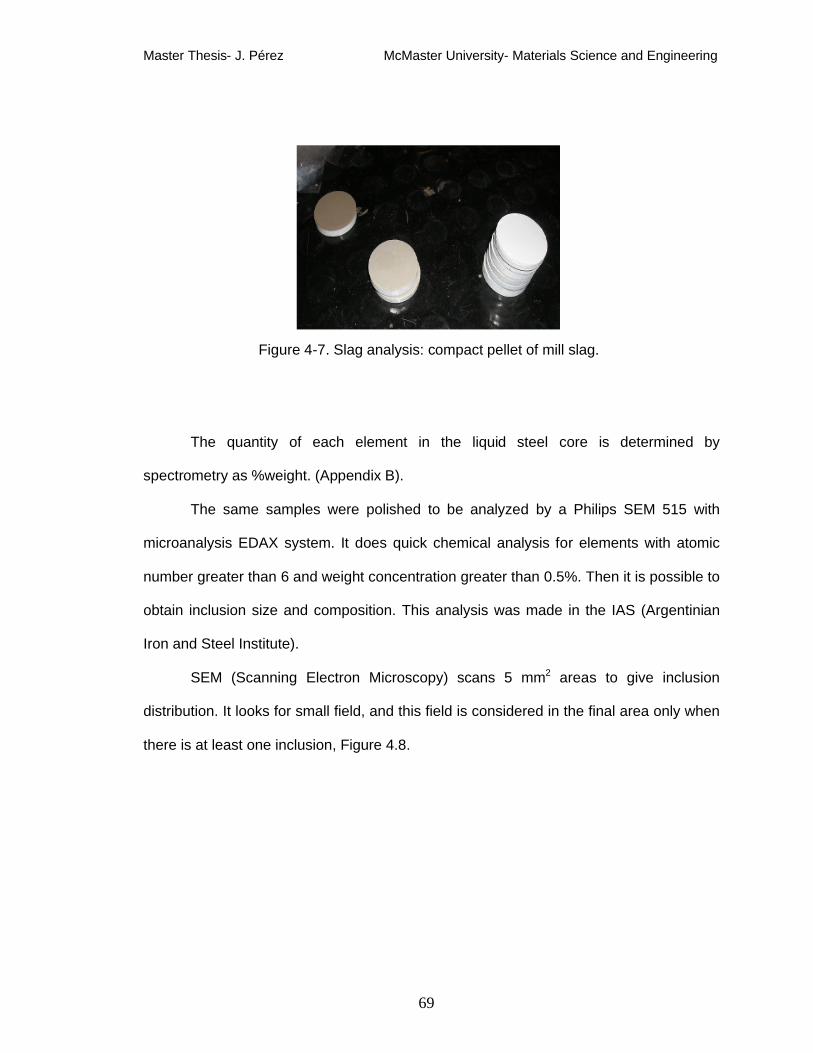
Master Thesis- J. Pérez McMaster University- Materials Science and Engineering
Final Report- Steelmaking Course 69
Figure 4-7. Slag analysis: compact pellet of mill slag.
The quantity of each element in the liquid steel core is determined by
spectrometry as %weight. (Appendix B).
The same samples were polished to be analyzed by a Philips SEM 515 with
microanalysis EDAX system. It does quick chemical analysis for elements with atomic
number greater than 6 and weight concentration greater than 0.5%. Then it is possible to
obtain inclusion size and composition. This analysis was made in the IAS (Argentinian
Iron and Steel Institute).
SEM (Scanning Electron Microscopy) scans 5 mm2 areas to give inclusion
distribution. It looks for small field, and this field is considered in the final area only when
there is at least one inclusion, Figure 4.8.

Master Thesis- J. Pérez McMaster University- Materials Science and Engineering
Final Report- Steelmaking Course 70
Figure 4-8. Inclusion analysis: inclusion seen in SEM (Espinosa, 2005).
SEM- EDAX (Winkler, Angeli & Mayr) allows analysis of morphology (size and
shape) and chemistry of nonmetallic inclusions, with EDAX microanalysis system. It
consists of a conventional scanning microscope (SEM) and chemical microanalysis for
each inclusion is conducted by use of a lithium drifted energy dispersive silicon X-ray
detector (EDAX). The equipment analyzes representative peaks for each element and
gives an Excel file with the number of inclusions, size and chemical composition in each
field. This data must be filtered to separate the real inclusions from porosity (high iron
content), and abrasive incrustations (SiC presence), etc. The data base from each
sample was analyzed manually to determinate the quantity and composition of inclusion
distribution.
4.6 Results
4.6.1 Steel and Slag Composition for Heats
The complete composition of the steel is summarized in Appendix B. Manganese
(Mn) and Aluminum (Al) are the only elements considered by the model. The evolution of

Master Thesis- J. Pérez McMaster University- Materials Science and Engineering
Final Report- Steelmaking Course 71
these metals during secondary metallurgy is shown in Figures 4.9 and 4.10 for the four
heats, where each line corresponds to a different heat.
0.00
0.01
0.02
0.03
0.04
0.05
SO L10 L1 L2 L3 T1 Sample
%A
l
880558880595860613860630
Figure 4-9. Aluminum analysis of the steel during secondary metallurgy
0.10
0.15
0.20
0.25
0.30
0.35
0.40
SO L10 L1 L2 L3 T1Sample
%M
n
880558880595860613860630
Figure 4-10. Manganese analysis of the steel during secondary metallurgy
All the slag’s oxides are used to calculate slag oxidation in the model. FeO is
plotted because it is a direct indicator of slag oxidation; other oxides are plotted in
Appendix B.

Master Thesis- J. Pérez McMaster University- Materials Science and Engineering
Final Report- Steelmaking Course 72
1
2
3
4
5
6
7
SO L10 L1 L2 L3 T1Sample
%Fe
O
880558880595880613860630
Figure 4-11. Iron oxide trend during secondary metallurgy
The values of sulfur and phosphorous oxide are always lower than 0.8%, and for
this reason are not considered by the model.
The complete analysis of each heat (steel, slag and temperature) and the
process conditions (oxygen activity, stirring, aluminum addition, etc) are summarized in
the Appendix B.
4.6.2 Inclusion Composition
The inclusion composition is summarized in the ternary diagrams of Figure 4-12
for one heat (880558); the diagrams for all heats are plotted in Appendix C (quite similar
results, for heats 880595 and 860630). The CaO- MgO and Al2O3 composition plotted in
the ternary diagrams are weight percent, they are adjusted at 100% as if they were the
only oxides in the slag. All these samples are before the calcium treatment and the
composition is affected by deoxidation (Al2O3), and oxides from slag (CaO and MgO). In
this particular heat the quantity of pure Al2O3 inclusions increases during the process;
this is the opposite observation to Graham (Graham 2008). The inclusions Al2O3-MgO or

Master Thesis- J. Pérez McMaster University- Materials Science and Engineering
Final Report- Steelmaking Course 73
Al2O3- CaO in general are larger than pure Al2O3 inclusions, and for this reason they can
float up easier than smaller ones. In a good secondary metallurgy process, most of the
inclusions are Al2O3 inclusions (Figure 4-12 (e)).
(a) Inclusions composition in So (b) Inclusions composition in L0
(c) Inclusions composition in L1 (d) Inclusions composition in L2
Al2O3
CaO
MgO
CaO
Al2O3MgO
MgO
CaO
Al2O3
CaO
MgO Al2O3

Master Thesis- J. Pérez McMaster University- Materials Science and Engineering
Final Report- Steelmaking Course 74
(e) Inclusions composition in L3
Figure 4-12. Ternary diagram with the inclusion composition during process of heat 880558.
The fourth heat (860613) shows similar tendency but the chemical composition of
the final inclusions has Al2O3 and CaO (Figure 4-13). It may be explained by the high
CaO content in the slag of this heat.
(a) Inclusions composition in So (b) Inclusions composition in Lo
MgO Al2O3
CaO
CaO
MgO Al2O3
CaO
MgO Al2O3

Master Thesis- J. Pérez McMaster University- Materials Science and Engineering
Final Report- Steelmaking Course 75
(c) Inclusions composition in L1 (d) Inclusions composition in L2
(e) Inclusions composition in L3
Figure 4-13. Ternary diagram with the inclusion composition during process of heat 860613.
4.7 Model Results Compared with Experimental Data
The quantity, size and composition of the inclusions were analyzed for each
sample. In the examination of all samples the inclusions were divided in four size groups,
diameter below 2 µm, below 5 µm, below 10 µm and below 20 µm. In the last group only
CaO
MgO Al2O3
CaO
MgO Al2O3
CaO
MgO Al2O3
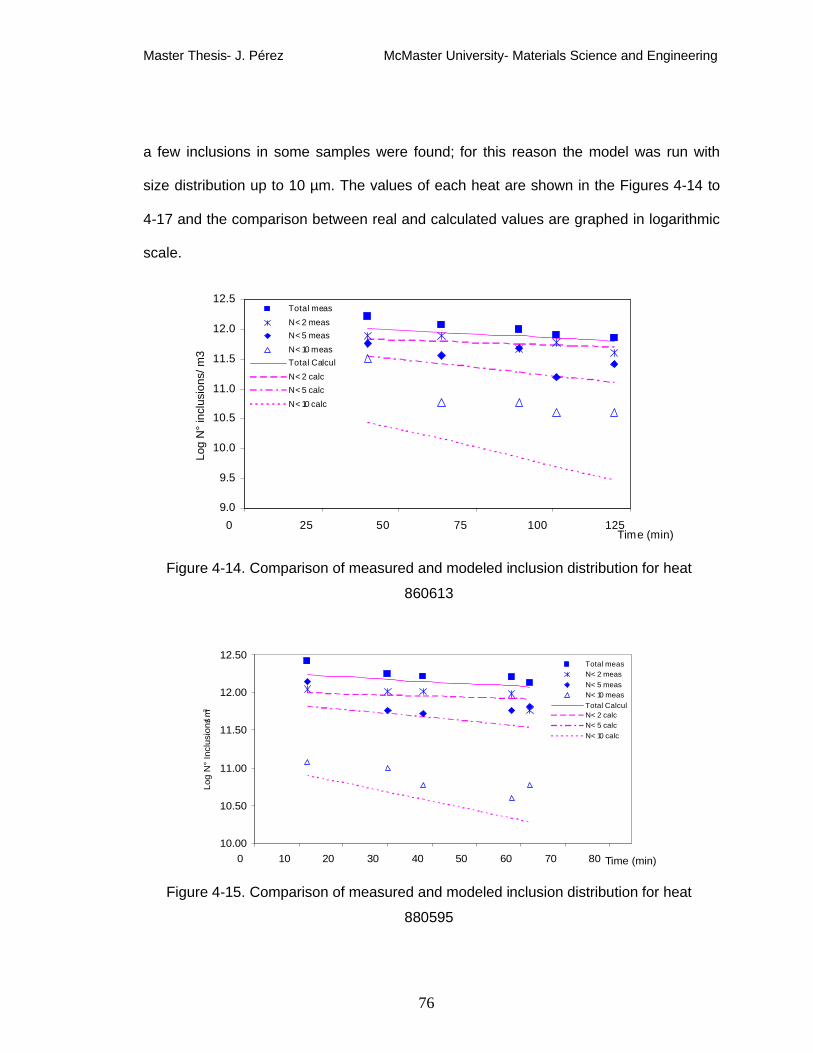
Master Thesis- J. Pérez McMaster University- Materials Science and Engineering
Final Report- Steelmaking Course 76
a few inclusions in some samples were found; for this reason the model was run with
size distribution up to 10 µm. The values of each heat are shown in the Figures 4-14 to
4-17 and the comparison between real and calculated values are graphed in logarithmic
scale.
9.0
9.5
10.0
10.5
11.0
11.5
12.0
12.5
0 25 50 75 100 125Time (min)
Log
N°
incl
usio
ns/ m
3
Total measN< 2 measN< 5 measN< 10 measTotal CalculN< 2 calcN< 5 calcN< 10 calc
Figure 4-14. Comparison of measured and modeled inclusion distribution for heat
860613
10.00
10.50
11.00
11.50
12.00
12.50
0 10 20 30 40 50 60 70 80 Time (min)
Log
N°
Incl
usio
ns/ m
3
Total measN< 2 measN< 5 measN< 10 measTotal CalculN< 2 calcN< 5 calcN< 10 calc
Figure 4-15. Comparison of measured and modeled inclusion distribution for heat
880595

Master Thesis- J. Pérez McMaster University- Materials Science and Engineering
Final Report- Steelmaking Course 77
10.2
10.7
11.2
11.7
12.2
0 10 20 30 40 50 60 70 80Time (min)
Log
N in
clus
ions
/ m3
Total measN< 2 measN< 5 measN< 10 measTotal CalculN< 2 calcN< 5 calcN< 10 calc
Figure 4-16. Comparison of measured and modeled inclusion distribution for heat
860588
9.5
10.0
10.5
11.0
11.5
12.0
12.5
0 10 20 30 40 50 60 70 80 90 100 110 120Time (min)
Log
N°
Incl
usio
ns/ m
3
Total measN< 2 measN< 5 measN< 10 measTotal CalculN< 2 calcN< 5 calcN< 10 calc
Figure 4-17. Comparison of measured and modeled inclusion distribution for heat
860630
Generally, there is very good agreement between the model and the data. The
reasons for this are examined in the Discussion.

Master Thesis- J. Pérez McMaster University- Materials Science and Engineering
Final Report- Steelmaking Course 78
Chapter 5
DISCUSSION
In the previous Chapter, very good agreement between the model and
experimental results was presented. In the following sections, the reasons for the good
agreement will be examined and the sensitivity to assumptions will be explored.
5.1 Bubble Diameter and Terminal Velocity
Different authors (Oeters, 1994; Hoefele & Brimacombe, 1979) studied bubble
diameter as a function of gas flow rate; these models use density, surface tension, gas
flow rate and the inner nozzle diameter as variables. They were set for the conditions
used in this work and the results are shown in Figure 5-1; the gas flow rate is considered
in the plant data range (200 to 1400 l/min of inert gas) and the inner nozzle or pore
diameter of the porous plug is 0.020 m.

Master Thesis- J. Pérez McMaster University- Materials Science and Engineering
Final Report- Steelmaking Course 79
1
23
0
10
20
30
40
200 400 600 800 1000 1200 1400
Q (l/ min)
d B(m
m)
Figure 5-1. Correlation between the bubble diameter (dB) and the gas flow rate (Q). 1:
Meersmann (Oeters, 1994), 2: Davidson (Oeters, 1994), (Qg = (40- 1000)*10-6 m3/s), 3:
Hoefele&Brimacombe, (1979), (Qg > 200*10-6 m3/s).
The correlation for bubble diameter by different authors gives diameters between
15 and 35 mm respect to flow rate. Irons and Guthrie (1981) demonstrated that bubbles
in liquid metal are larger than in water models because of the bubble volume is
proportional to surface tension and bubbles spread across the nozzle. Their studies with
different nozzles show that the normal bubble gas diameter in steel is larger than 30 mm.
The bubble size is unknown in the present study, so this value is assumed.
The terminal velocity of the bubble depends of bubble diameter; velocity
increases when the bubble is larger, and the velocity is function of the gas flow rate
because it determines the size of the bubble. Since the bubble diameter is around 30
mm for metal bubbling, a sensitivity analysis on the effect of different bubble diameter on
the terminal velocity is shown in Figure 5-2 for velocity correlations from different authors
(Levich, 1962; Peebles & Garber, 1953; Davis & Taylor, 1950). There is a variation of 40
% for this bubble size.
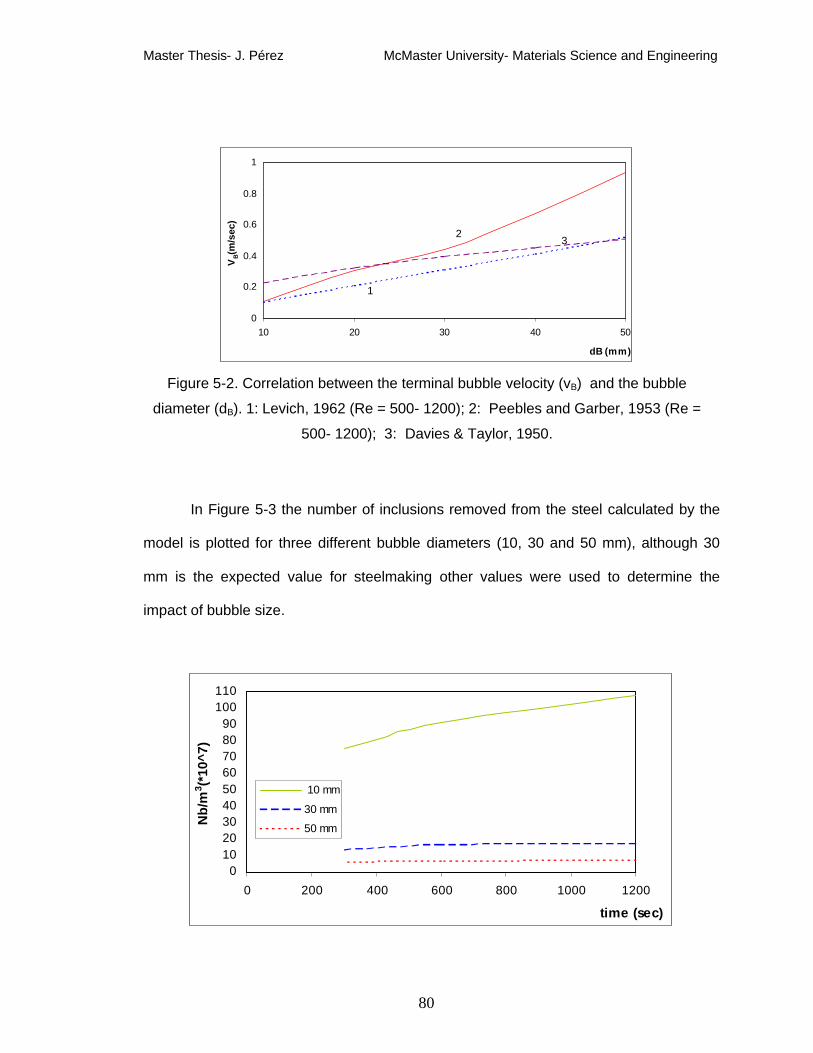
Master Thesis- J. Pérez McMaster University- Materials Science and Engineering
Final Report- Steelmaking Course 80
3
1
2
0
0.2
0.4
0.6
0.8
1
10 20 30 40 50
dB (mm)
VB(
m/s
ec)
Figure 5-2. Correlation between the terminal bubble velocity (vB) and the bubble
diameter (dB). 1: Levich, 1962 (Re = 500- 1200); 2: Peebles and Garber, 1953 (Re =
500- 1200); 3: Davies & Taylor, 1950.
In Figure 5-3 the number of inclusions removed from the steel calculated by the
model is plotted for three different bubble diameters (10, 30 and 50 mm), although 30
mm is the expected value for steelmaking other values were used to determine the
impact of bubble size.
0102030405060708090
100110
0 200 400 600 800 1000 1200
time (sec)
Nb/
m3 (*
10^7
)
10 mm
30 mm
50 mm

Master Thesis- J. Pérez McMaster University- Materials Science and Engineering
Final Report- Steelmaking Course 81
Figure 5-3. Variation of number of inclusions per cubic meter removed by bubbling
(Nb/m3) during process for different bubble diameter.
The number of inclusions removed by bubbling increases when the bubble
diameter is smaller, bubbles with diameter between 30 to 50 mm have similar behavior
to remove inclusions respect to the time of bubbling. Smaller bubbles achieve a better
cleanliness according this model, but the production of bubbles with diameter smaller
than 30 mm requires a change in the gas injection technology for metal stirring.
The current model contemplates three inclusion removal mechanisms: removal
by refractory, slag and bubbling, and the reoxidation mechanism which increase the
number of inclusion. Removal by bubbling is the mechanism affected by bubble size.
Figure 5-3 shows that there is some difference in the rate of inclusion removal between a
bubble with 30 or 50 mm diameter (Equation 3.22), but the other factors such as
reoxidation and removal by slag balance this effect to achieve a similar cleanliness value
where the final inclusion numbers are quite similar (Figure 5-4).
95
100
105
110
115
120
125
130
0 200 400 600 800 1000 1200
time (sec)
Nf/m
3 (*10
^10)
10 mm
30 mm
50 mm

Master Thesis- J. Pérez McMaster University- Materials Science and Engineering
Final Report- Steelmaking Course 82
Figure 5-4. Variation of final remaining number of inclusion per cubic meter (Nf/m3) after
removal by bubbling during processing for different bubble diameters.
The impact of qualitative bubbles (smaller than 30 mm diameter) in this removal
mechanism is quantitative greater than a 30 mm bubble . This concept comes from the
Wang, Lee and Hayes theory (Section 2.8 of this thesis), where the probability of smaller
bubbles colliding with an inclusion is very high. Although the effect of velocity is the
opposite (smaller bubbles float up lower than larger ones), finally smaller bubbles collide
easily with an inclusion and more inclusions are removed attached by these bubbles.
5.2 Effect of Each Mechanism on Inclusion Removal
Different mechanisms are described to model the inclusion removal (bubbling,
slag and refractory) and inclusion increment (reoxidation) during the secondary
metallurgy process. The initial number of inclusions (produced according to the
deoxidation practice at the end of primary metallurgy process), is increased by
reoxidation during the process, by reoxidation from the atmosphere and by the slag if it is
oxidized. Figure 5-5 shows the number of inclusions produced by reoxidation depending
on initial conditions of 500 ppm of oxygen dissolved before deoxidation practice and after
deoxidation the steel contains 0.02% Al and 0.3% Mn. These are in equilibrium with a
ladle slag with 4% FeO, 1%MnO, 8% MgO, 55% CaO, 4% SiO2 and 28% Al2O3, steel
temperature of 1600 °C, and stirring rate of 600 l/min.

Master Thesis- J. Pérez McMaster University- Materials Science and Engineering
Final Report- Steelmaking Course 83
3.5
4
4.5
5
5.5
6
6.5
7
7.5
8
8.5
0 200 400 600 800 1000 1200Time (s)
Log
Nin
clus
ion
/ m3
Figure 5-5. Effect of inclusion number increment produced by reoxidation
The start of in Figure 5-5 is one second after nucleation occurs (this is the
minimum time to run this model), and reoxidation is low. During the process the number
of inclusions increases by reoxidation and its impact depends of slag oxidation and the
exposed eye to atmosphere (which is a function of gas flow rate). The individual effects
of slag and stirring on reoxidation will be developed in section 5.3.
The other three mechanisms developed in the model work opposite to
reoxidation; they remove inclusions during the process reducing the final number of
them. Figure 5-6 shows the quantity of inclusions removed by each mechanism from the
steel bath over the process. Figure 5-6 was based on the same initial conditions as
Figure 5-5.

Master Thesis- J. Pérez McMaster University- Materials Science and Engineering
Final Report- Steelmaking Course 84
7.3
7.8
8.3
8.8
9.3
9.8
0 200 400 600 800 1000 1200Time (s)
Log
Nin
clus
ion
/ m3
Nslag
Nrefrac
Nbubble
Figure 5-6. Quantity inclusions remaining by removal effect of each mechanism during
the process
Removal by refractory is directly proportional to refractory area and initial number
of inclusions, and a function of gas flow rate through the turbulent energy dissipation (ε )
according to Equation 3-26. This can be simplified for each inclusion size as:
[ ]VA
tNR ff Re
4/3Re ε
∝∂
∂ (5-1)
Equation 5-1 it shows that this mechanism is important in comparing different
ladle sizes because the refractory area has more impact than the gas flow rate according
to Equation 3.27. Starting from the relationship refractory area over steel volume (ARef/
V), it is possible to see that tall and narrow ladles have more surface area and residence

Master Thesis- J. Pérez McMaster University- Materials Science and Engineering
Final Report- Steelmaking Course 85
time to remove inclusions than short and wide ones. For a fixed ladle size the variable is
the stirring but this mechanism has less impact than removal by bubbling and slag.
Inclusion removed by bubbling and slag have a similar effect. Although removal
by slag is greater than by bubbling (Figure 5-6); their curves have the same shape. It can
be explained through the equations which regulate each mechanism. Removal by
bubbling calculated by Equation 3-22, depends of some constants related to the ladle
(height and steel volume), to the bubbles (diameter and velocity) and particles (inclusion
diameter and velocity) which explain the probability of an inclusion to be removed by a
bubble according to collision and adhesion probability. The main variables are
summarized in Equation 5-2 for the rate of inclusion removal for particles of different
radius.
[ ]AC
Bi PQTPt
NR∝
∂∂
(5-2)
Inclusion removal by bubbling is directly proportional to gas flow rate, when the
bubble diameter is fixed (as explained Section 5.1). The other important factor is the
relationship between inclusion size and bubble collision and adhesion (calculated by PC
and PA).
When inclusion removal by slag is reviewed, Equation 3-24 shows that gas flow
rate is not considered and the mechanism depends of inclusion velocity in z direction
and the slag area. But the slag area is function of flow rate, because it is the ladle area
less the eye area and this latter variable depends on gas flow rate according Equation 3-
23.

Master Thesis- J. Pérez McMaster University- Materials Science and Engineering
Final Report- Steelmaking Course 86
Removal by slag is the most important mechanism to remove inclusions
according this model, but really this is not the fundamental mechanism; it is the result of
flotation of inclusions. In this mechanism a major simplification was considered; the
model considers that all inclusions which arrive at the slag are caught by it. This
simplification implies that inclusion dissolution in the slag is instantaneous and it does
not depend of the slag composition as Sridhar and Cramb and Valdez and Cramb
explained (Section 2.7.2). For slags that are far from Al2O3 saturated this simplification is
good, but this assumption may not be appropriate when the slag viscosity is high or it is
saturated with MgO.
An important assumption must be done as regards the inclusion dissolution in the
slag. There is dissolution only there is a mixing between the slag and the steel, therefore
the inclusions are removed by the slag only during the bubbling process.
5.3 Reoxidation Effect (by Slag and Atmosphere)
The effect of slag oxidation state on the inclusion numbers produced by
reoxidation is shown in Figure 5-7. The model was run for two different slag oxidation
levels, for both cases the initial oxygen content before deoxidation practice was 600
ppm, and the gas flow rate for both processes was 500 l/min. The steel was deoxidized
with aluminum, when the deoxidation practice finished the steel bath contained 0.3% of
manganese in both cases and the aluminum registered as in Table 5-1. Since the steel
and slag are in equilibrium, for low aluminum content in equilibrium with high oxygen
content in the metal bath (according to Equation 3.1) a high oxidation state in the slag is
expected; all these values are summarized in Table 5-1 as High Slag Oxidation. On the
other hand Low Slag oxidation is considered when the residual aluminum content is high,

Master Thesis- J. Pérez McMaster University- Materials Science and Engineering
Final Report- Steelmaking Course 87
because the oxygen in equilibrium with it must be low and the same condition for the
slag. All the steps (different times) have been run with the same values; there are no
other changes in steel and slag compositions or flow rate.
Table 5-1. Steel and slag composition for reoxidation mechanism tests. Slag
Oxidation%Al %FeO %MnO %CaO %MgO %Al2O3 %SiO2
NRO
(1/m3)NRF
(1/m3)
Low 0.03 2 0.5 56 8 29.5 4 1.66*1012 1.46*1012
High 0.01 8 3 52 7 27 4 1.64*1012 1.45*1012
Table 5-1 shows also the number of the inclusions produced by deoxidation
practice (NRO) and after 900 sec (NRF) of treatment for both situations. When
deoxidation is poor, the initial number of inclusions is lower than for a strong deoxidation
because part of the oxygen remains dissolved in the steel bath. When the model runs
with these parameters, lower inclusion content at the end of treatments is obtained with
high oxidation in the slag and low aluminum content in the steel. Although high oxidation
in the slag in equilibrium with low aluminum dissolved would appear to be a better
situation, it is not possible in practice where low oxygen content is necessary to cast the
steel and for other refining processes as desulphurization. Considering that the oxygen
dissolved in the steel must be lower than 5 ppm to be able to cast the steel in continuous
casting, if Equation 3-1 is applied the oxygen dissolved is 5 ppm in equilibrium with
0.03% of aluminum, when this equation is applied by the high oxidation in the slag
condition where the aluminum in the steel is 0.01% the oxygen dissolved is 12 ppm.
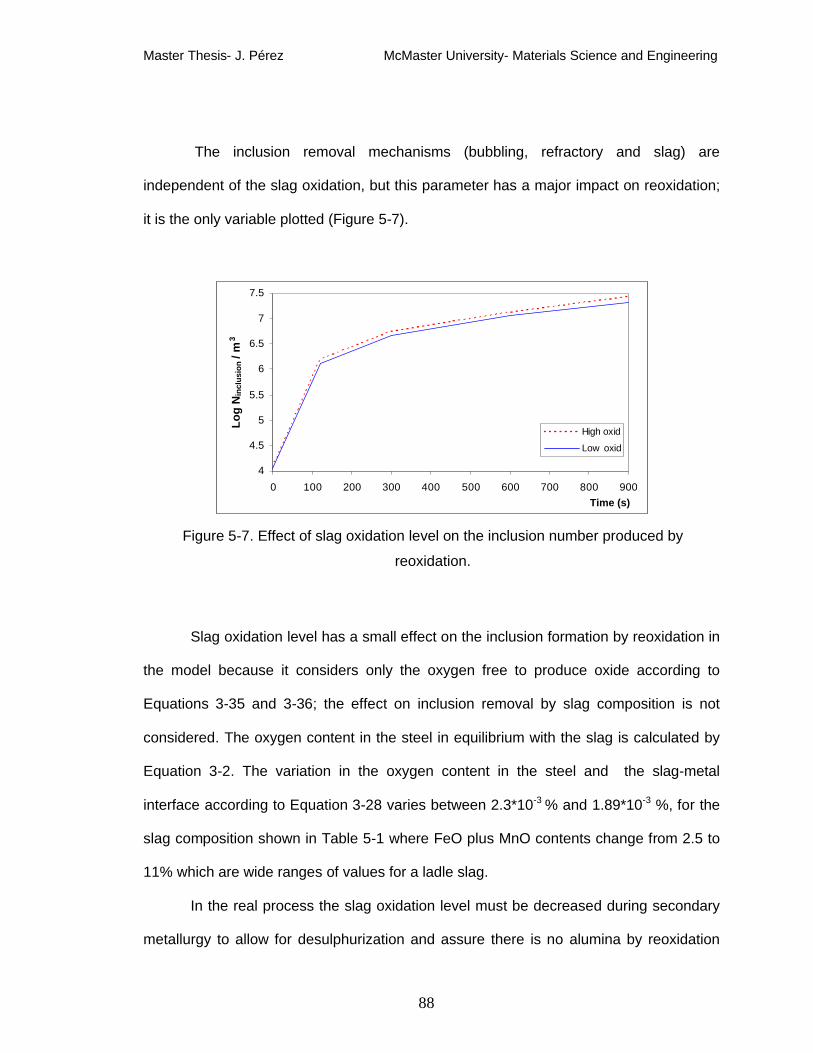
Master Thesis- J. Pérez McMaster University- Materials Science and Engineering
Final Report- Steelmaking Course 88
The inclusion removal mechanisms (bubbling, refractory and slag) are
independent of the slag oxidation, but this parameter has a major impact on reoxidation;
it is the only variable plotted (Figure 5-7).
4
4.5
5
5.5
6
6.5
7
7.5
0 100 200 300 400 500 600 700 800 900Time (s)
Log
Nin
clus
ion
/ m3
High oxid
Low oxid
Figure 5-7. Effect of slag oxidation level on the inclusion number produced by
reoxidation.
Slag oxidation level has a small effect on the inclusion formation by reoxidation in
the model because it considers only the oxygen free to produce oxide according to
Equations 3-35 and 3-36; the effect on inclusion removal by slag composition is not
considered. The oxygen content in the steel in equilibrium with the slag is calculated by
Equation 3-2. The variation in the oxygen content in the steel and the slag-metal
interface according to Equation 3-28 varies between 2.3*10-3 % and 1.89*10-3 %, for the
slag composition shown in Table 5-1 where FeO plus MnO contents change from 2.5 to
11% which are wide ranges of values for a ladle slag.
In the real process the slag oxidation level must be decreased during secondary
metallurgy to allow for desulphurization and assure there is no alumina by reoxidation
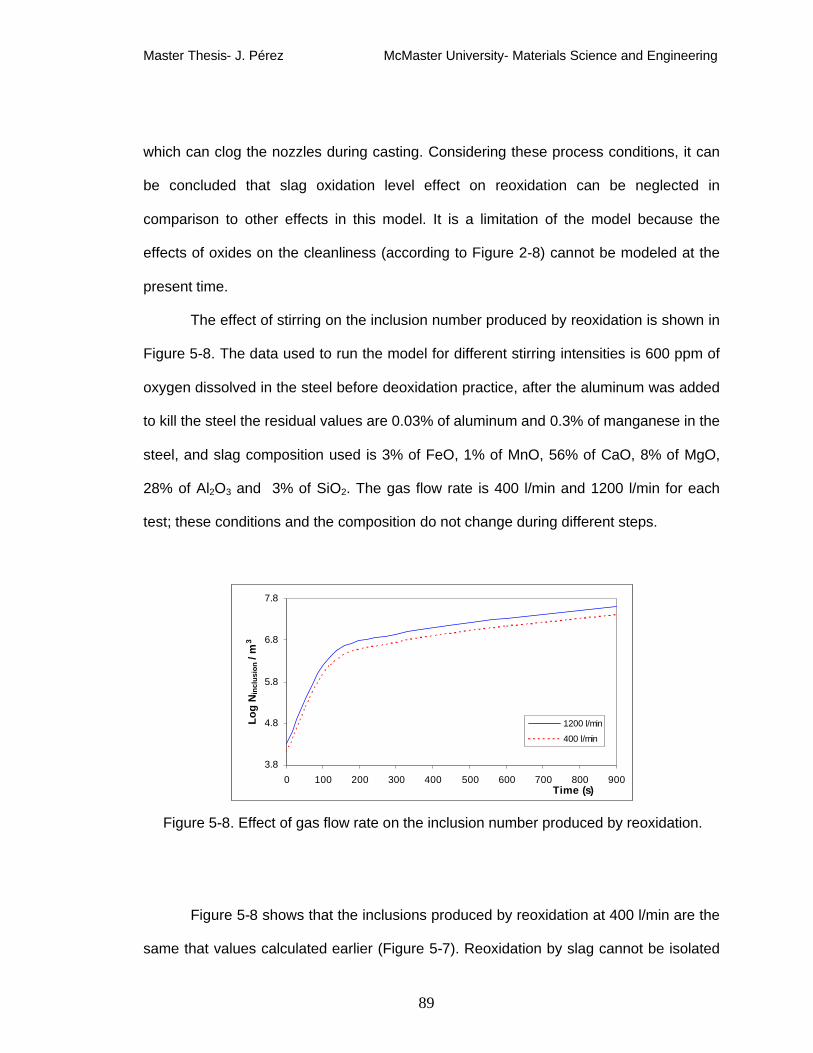
Master Thesis- J. Pérez McMaster University- Materials Science and Engineering
Final Report- Steelmaking Course 89
which can clog the nozzles during casting. Considering these process conditions, it can
be concluded that slag oxidation level effect on reoxidation can be neglected in
comparison to other effects in this model. It is a limitation of the model because the
effects of oxides on the cleanliness (according to Figure 2-8) cannot be modeled at the
present time.
The effect of stirring on the inclusion number produced by reoxidation is shown in
Figure 5-8. The data used to run the model for different stirring intensities is 600 ppm of
oxygen dissolved in the steel before deoxidation practice, after the aluminum was added
to kill the steel the residual values are 0.03% of aluminum and 0.3% of manganese in the
steel, and slag composition used is 3% of FeO, 1% of MnO, 56% of CaO, 8% of MgO,
28% of Al2O3 and 3% of SiO2. The gas flow rate is 400 l/min and 1200 l/min for each
test; these conditions and the composition do not change during different steps.
3.8
4.8
5.8
6.8
7.8
0 100 200 300 400 500 600 700 800 900Time (s)
Log
Nin
clus
ion
/ m3
1200 l/min
400 l/min
Figure 5-8. Effect of gas flow rate on the inclusion number produced by reoxidation.
Figure 5-8 shows that the inclusions produced by reoxidation at 400 l/min are the
same that values calculated earlier (Figure 5-7). Reoxidation by slag cannot be isolated

Master Thesis- J. Pérez McMaster University- Materials Science and Engineering
Final Report- Steelmaking Course 90
from gas stirring because it provides the liquid stirring for the reoxidation reactions which
are controlled by transport on the metal side. The driving force is the difference in the
oxygen potential between the phases. According to Equation 3-36 oxygen produced by
reoxidation is a function of the oxygen potential difference between steel and slag
([%O]Steel - [%O]Slag), the oxygen mass transfer coefficient ( IO,κ ) and the contact surface
area (Acontact), summarized in Equation 5-3:
ContactIOPhaseTotTot AOO
tO ,),][%]([%][%
,κ−∝∂
∂ (5-3)
It is important to note in Figure 5-8 the reoxidation varies with the gas flow rate,
basically by the impact over the contact surface (the eye area). The eye area varies from
3.34 m2 for 400 l/min of gas flow rate to 5.92 m2 for 1200 l/min (calculated by Equation 3-
23). The gas flow rate influences oxygen mass transfer coefficient too because of it is
function of gas flow rate and contact area (Equation 3-38).
5.4 Effect of Stirring Power on the Inclusion Removal by Bubbling and Slag
Although the stirring power affects reoxidation, it is important for removal of
inclusions by other mechanisms such as bubbling and slag capture.
The final number of inclusions after removal by slag during the process is plotted
in Figure 5-9 for the same conditions that Figure 5-8, considering normal stirring for
mixing and homogenization (400 l/min) and a strong flow rate (1200 l/min).

Master Thesis- J. Pérez McMaster University- Materials Science and Engineering
Final Report- Steelmaking Course 91
12.14
12.16
12.18
12.2
12.22
0 100 200 300 400 500 600 700 800 900Time (s)
Log
Nin
clus
ion
/ m3
1200 l/min
400 l/min
Figure 5-9. Effect of gas flow rate on the number of inclusion removal by slag.
According to Figure 5-9 softer stirring is better for inclusion removal by slag than
a stronger one (the final number of inclusions at 900 seconds is lower when the stirring is
softer). This is because the mechanism of removal by slag developed in the current
model, considers that all the inclusions which arrive at the slag are removed from the
steel; with this concept the most important variable for the mechanism is the contact area
for slag- steel. Slag area is calculated as the difference between the ladle area (a
constant for each plant) and the eye area (according Equation 3.23); in this case the slag
area varies from 7.07 m2 by 400 l/min of argon flow rate to 4.48 m2 by 1200 l/min. This
variation in slag area according to gas flow rate explains the difference in the inclusion
removal shown in Figure 5-8.
The effect of stirring on inclusion flotation (i.e., attachment to bubbles) is not
considered here, but rather in inclusion removal by bubbling; by slag removal
mechanism (Equation 3-24) particles float up by velocity in z direction (Equation 3-17)
where the inclusion diameter is important.

Master Thesis- J. Pérez McMaster University- Materials Science and Engineering
Final Report- Steelmaking Course 92
The effect of stirring on inclusion removal by bubbling is plotted in Figure 5-10 for
the same process conditions as Figure 5-8.
8.25
8.5
8.75
9
9.25
9.5
9.75
10
0 100 200 300 400 500 600 700 800 900Time (s)
Log
Nin
clus
ion
/ m3
1200 l/min
400 l/min
Figure 5-10. Effect of gas flow rate on the number of inclusion removal by bubbling.
An increase in gas flow rate improves the inclusion removal by bubbling; this
effect is shown in Figure 5-10, where stronger stirring is more efficient to removal
inclusion than a softer one (where the final inclusion number at the end of treatment is
lower by strong stirring). This is because removal by bubbling mechanism developed in
the current model is directly proportional to gas flow rate (Equation 3-22).
The other factors considered in removal by bubbling mechanism are independent
of the gas flow rate (as probability of collision and adhesion) but they are very affected
by inclusion size. This effect will be developed in Section 5.5.

Master Thesis- J. Pérez McMaster University- Materials Science and Engineering
Final Report- Steelmaking Course 93
5.5 Effect of Inclusion Size on Efficiency by Different Removal Mechanisms
The model considers three different inclusion sizes according to the experimental
ranges (2, 5 and 10 µm). All the Al2O3 produced starting from the initial oxygen content is
divided in inclusions of different sizes, 54% of oxygen forms inclusion of 2 µm, 38%
produces 5 µm inclusions and the last 8% is contained in the 10 µm ones according to
Figure 3-2.
Although, during reoxidation, inclusions of different sizes can be produced, the
model considers all the alumina produced by reoxidation forms particles of only one size.
It is not possible to validate the inclusion size distribution only by reoxidation, Section
3.2.6.
Figure 5-11 shows the impact of inclusion size in the slag removal mechanisms,
where the 5 µm inclusions are removed easier than the 2 µm ones. This is because the
larger inclusions have faster flotation velocity (according Equation 3-17, velocity in
direction “z” is function of the inclusion diameter) than smaller particles.
8.8
9.3
9.8
10.3
0 100 200 300 400 500 600 700 800 900Time (s)
Log
Nin
clus
ion
/ m3
2 um
5 um
10 um
Figure 5-11. Impact of inclusion size on the particle remaining number after slag removal
mechanism.

Master Thesis- J. Pérez McMaster University- Materials Science and Engineering
Final Report- Steelmaking Course 94
The contradiction presented in Figure 5-11 with the largest inclusions (10 µm
particles) is explained by the initial inclusion number. The number of inclusions removed
by slag depends of the initial inclusion number for each time (Equation 3.24). The initial
particle number for 10 µm inclusions is very low with respect the other ones; for this
reason their removal looks lower than for smaller inclusion sizes.
Similar behavior regulates the bubbling removal mechanism. The collision
probability is proportional to inclusion diameter (Figure 2-19) while adhesion probability
increases with a decrease in the inclusion size (Figure 2-20). Although both effects are
opposite the overall inclusion removal by bubbling is increased for larger particle sizes,
as the effect shown in Figure 5-12 to 2 and 5 µm inclusion diameters, where the number
of particles remaining in the steel are drawn (considering a cumulative number of
inclusion removed).
8.0
8.3
8.5
8.8
9.0
9.3
0 100 200 300 400 500 600 700 800 900Time (s)
Log
Nin
clus
ion
/ m3
2 um
5 um
10 um
Figure 5-12. Impact of inclusion size on the number of particles remaining after bubbling
removal mechanism.

Master Thesis- J. Pérez McMaster University- Materials Science and Engineering
Final Report- Steelmaking Course 95
Inclusion removal by bubbling for 10 µm particle diameter in Figure 5-12 shows
similar results as in Figure 5-11, this is because it is function of the inclusion initial
number (Equation 3.22). The difference between the positions of the curve of 10 µm
inclusion with respect to the other inclusion sizes in both figures can be explained by
Table 5-2, where the inclusions removal by bubbling and slag were calculated with the
same conditions of Figure 5-8 over 10 seconds of processing without considering the
initial inclusion number.
Table 5-2. Effect of inclusion size on the bubbling and slag removal mechanism without
consideration of the initial inclusion number for each particle size.
Inclusion DiameterNumber of inclusions
removed by Slag/m3 over 10 seconds
Number of inclusions removed by Bubbling/m3
over 10 seconds
2 µm 20.23 * 106 62.88 * 104
5 µm 216.13 * 106 292.03 * 104
10 µm 598.10 * 106 747.43 * 104
Removal of the largest inclusions compared to particles of 5 µm diameter has a
similar relationship for both mechanisms (2.8 times by slag compared with 2.6 times by
the bubbling mechanism). A large difference is shown in Table 5-2 between the removal
of 10 µm inclusions compared to that of 2 µm particles. The larger inclusions are
removed by slag 29.6 times faster than the smaller ones and this relationship is 11.9 for
removal by bubbling.

Master Thesis- J. Pérez McMaster University- Materials Science and Engineering
Final Report- Steelmaking Course 96
5.6 Results of Model for Different Process Conditions
One of the most important variables in the secondary metallurgy process is the
gas bubbling flow rate; because stirring is necessary to homogenize the steel chemically
and thermally, to dissolve the ferroalloys and to desulphurize; but it impacts inclusion
removal and generation as was presented in Sections 5.3 and 5.4.
Three different stirring levels were run in the model to study the impact of this
variable on steel cleanliness: optimal stirring (with initial strong stirring (800 l/min)
followed by soft stirring to promote inclusion flotation (200 l/min)), low stirring which is
insufficient to float up inclusions (100 l/min during the whole process) and over stirring
(strong stirring during the process, 1200 l/min). The final inclusion number is plotted in
Figure 5-13; the other conditions used are: 0.03% Al and 0.3% Mn, 1.5% FeO, 0.5% Mn,
57% CaO, 8% MgO, 30% Al2O3 and 3% SiO2.
12.15
12.16
12.17
12.18
12.19
12.20
12.21
0 200 400 600 800 1000 1200Time (s)
Log
Nin
clus
ion
/ m3
Optimal
Low
Over
Figure 5-13. Impact of stirring level during process on the total inclusion number.

Master Thesis- J. Pérez McMaster University- Materials Science and Engineering
Final Report- Steelmaking Course 97
The model was run in four steps: 1, 120, 600 and 1200 seconds. Starting from
600 seconds there are differences among the stirring levels. Over stirring is always
poorer to remove inclusions than the others, because of the reoxidation is high. Low
stirring has a smaller final inclusion number in step of 600 seconds, but the final value is
higher this is because stirring to flotation is insufficient with respect to the optimal
bubbling.
The optimal stirring process should present a better inclusion removal rate than
the value shown in Figure 5-13, because the strong stirring is produced at the beginning
to coalesce inclusions and to form bigger ones which float up easier than smaller
particles (Miki, Thomas, Denissov & Shimada 1997 and Zhang & Thomas 2003,
developed in section 2.8.2). But the model does not consider inclusion growth and for
this reason the beneficial effect is lower than expected.
An interesting point is the effect of stirring level on small and large inclusions.
Most of the total inclusion number is formed by the 2 µm inclusions; Figure 5-14 plotted
the stirring impact over the smallest particles.
11.90
11.91
11.92
11.93
11.94
0 200 400 600 800 1000 1200Time (s)
Log
Nin
clus
ion
/ m3
Optimal
Low
Over
Figure 5-14. Impact of stirring level during process on the inclusion number of diameter 2
µm.

Master Thesis- J. Pérez McMaster University- Materials Science and Engineering
Final Report- Steelmaking Course 98
The smallest inclusions are more easily removed by soft stirring than by stronger
stirring. As was explained in Section 5.2, reoxidation affects small inclusions more than
large ones and small particles are removed less by bubbling and slag than large particles
(Section 5.4).
Removal of inclusion of 10 µm is studied in Figure 5-15, where for this inclusion
size the removal is directly proportional to the gas flow rate. Because the reoxidation has
a low impact on large inclusions, and particles removal by bubbling and slag both of
which increase with stronger stirring.
10.8
10.84
10.88
10.92
10.96
11
0 200 400 600 800 1000 1200Tim e (s)
Log
Nin
clus
ion
/ m3
Optimal
Low
Over
Figure 5-15. Impact of stirring level during process on the inclusion number of diameter
10 µm.
Using Figures 5-13 to 5-15 it can be concluded that if the optimal stirring is not
possible, it is preferable an over stirring than understir, because the strong stirring easily
removes the largest inclusions which can produce defects (Section 2.3).
The current model cannot explain an important impact of the strong stirring over
the steel cleanliness, the slag entrapment. Strong stirring produces a steel- slag
emulsion and slag can be entrapped producing macroinclusions (exogenous inclusions),
but this effect has not been modelled yet.

Master Thesis- J. Pérez McMaster University- Materials Science and Engineering
Final Report- Steelmaking Course 99
Another factor that is important in the secondary metallurgy process is the initial
oxidation level before aluminum deoxidation. This model was run for two different
situations: high initial oxidation (1200 ppm O) and low oxidation (500 ppm O), the other
variables used were: 0.03% Al and 0.3% Mn, 1.5% FeO, 0.5% Mn, 57% CaO, 8% MgO,
30% Al2O3 and 3% SiO4 and 400 l/min of gas flow rate. The results are summarized in
Figure 5-16.
12.05
12.15
12.25
12.35
12.45
12.55
0 200 400 600 800 1000 1200Time (s)
Log
Nin
clus
ion
/ m3
High
Low
Figure 5-16. Impact of the initial oxidation level over the total final inclusion number.
Figure 5-16 shows that the steel cleanliness achieved depends directly of the
initial oxygen level (when the steel is killed only with aluminum). As the quantity of
inclusions depends of the initial oxygen is not necessary to see the effect of this factor on
the different inclusion sizes.
From this figure it can be concluded that to obtain the same quantity of inclusions
at the end of treatment flotation time must increase when the initial oxygen level is
higher. Another option to achieve low inclusion content with high initial oxidation is

Master Thesis- J. Pérez McMaster University- Materials Science and Engineering
Final Report- Steelmaking Course 100
making a predeoxidation with carbon and then continues with aluminum; this is a very
common practice used by steelmakers.
Master Thesis- J. Pérez McMaster University- Materials Science and Engineering
Final Report- Steelmaking Course 101
Chapter 6
CONCLUSIONS
6.1 Summary and Conclusions
The thesis presents a mathematical model for the ladle metallurgy furnace that may
be used by process engineers to analyze the impact of bubbling, slag and initial
oxidation level on inclusion distribution control (quantity and size of them). The sampling
practice employed in Ternium Siderar for this study, allowed obtaining samples of
aluminum killed steel with different level of the main variables analyzed.
The primary findings of this investigation are the following:
1. The number of inclusion remaining after the process according the initial inclusion
number and removal mechanism is calculated according to Equation 3.42 and the total
oxygen content by Equation 3.43.
2. The initial inclusion size distribution considers three different groups whose initial
number is determined according to the samples analyzed. They are: inclusions with
diameter below 2 microns (54% of total), below 5 (38%) and 10 microns (8%).
3. Immediately after aluminum is added deoxidation is produced, it generates an initial
number of inclusions that decreases during the process and it may increase only by
reoxidation. The increment by reoxidation depends of slag oxidation and the exposed
area to atmosphere (“eye”, which is a function of gas flow rate). When oxidation level is

Master Thesis- J. Pérez McMaster University- Materials Science and Engineering
Final Report- Steelmaking Course 102
greater at the beginning of process more inclusions are formed and more time of
bubbling is necessary to achieve a good cleanliness level.
4. Refractory area provides a site for inclusion removal; it is function of refractory
surface and of the gas flow rate. With similar stirring power, tall and narrow ladles are
better to remove inclusions than short and wide ones. This mechanism has less impact
than removal by bubbling and slag.
5. Removal by bubbling mechanism is directly proportional to gas flow rate, and
function of the relationship between inclusion size and bubble collision and adhesion
probabilities. The probability of an inclusion to be attached to a bubble is independent of
the gas flow rate but it is affected by inclusion size.
6. Inclusion removal by slag is the most important mechanism to remove inclusions
according this model; its effect is similar to the bubbling one because it depends of
inclusion velocity in z direction and the slag area (function of gas flow rate). This is not
the fundamental mechanism; it is the result of the flotation of inclusions. A major
simplification was considered; all inclusions which arrive at the slag are caught by it, it
implies that inclusions dissolve in the slag instantaneously without depending of the slag
composition (effect important according to Sridhar & Cramb and Valdez & Cramb). For
slags that are far from Al2O3 saturated this simplification is good, but it is not
appropriated when the slag viscosity is high or it is saturated with MgO. According to the
model the slag composition only impacts on the reoxidation mechanism.
7. The driving force for reoxidation is the difference in the oxygen potential between the
phases. Reoxidation reactions are controlled by transport on the metal side; so
reoxidation by slag cannot be isolated from gas stirring. It increases with the gas flow
rate basically because enlarges the eye area (Krishnapisharody & Irons) and the oxygen

Master Thesis- J. Pérez McMaster University- Materials Science and Engineering
Final Report- Steelmaking Course 103
mass transfer coefficient. The model presents a limitation with respect to the effect of the
slag oxidation on the steel cleanliness; it calculates lower inclusion content at the end of
treatment in a steel with an initial poor deoxidation (in equilibrium with high slag
oxidation) which in other one with strong deoxidation. It would appear to be a better
situation, it is not possible in the practice where low oxygen content is necessary to cast
the steel and for refining processes such as desulphurization. The model considers all
the particles produced by reoxidation are only one size, because it is not possible to
validate the inclusion size distribution produced only by this mechanism.
8. Softer stirring is better for removal inclusion by slag than stronger one, because
according this model the most important variable for this mechanism is the contact area
for slag- steel. Slag area is calculated as the difference between the ladle area and the
eye area. By slag removal mechanism particles float up by velocity in z direction where
the inclusion diameter is important. The current model cannot explain the slag
entrapment (exogenous inclusions); a steel- slag emulsion can be produced where slag
is entrapped by strong stirring.
9. The number of inclusions removed by bubbling increases when the bubble diameter
is smaller. Bubbles smaller than 30 mm diameter remove four times as many inclusions
as one of 30 mm; they have a high probability of collision with inclusion and may remove
more inclusions although their velocity is lower than larger ones (Wang, Lee and Hayes
theory). The production of bubbles with diameter smaller than 30 mm is not possible with
current gas injection technology for metal stirring (Irons and Guthrie, 1981). Considering
removal by bubbling for bubbles with diameter between 30 to 50 mm the difference is
slight; but this effect is balanced by reoxidation and removal by slag balance to achieve a
quite similar inclusion numbers.

Master Thesis- J. Pérez McMaster University- Materials Science and Engineering
Final Report- Steelmaking Course 104
10. Larger inclusions are removed by slag easier than smaller ones, due to their higher
flotation velocity. Similar behavior regulates the bubbling removal mechanism, the
collision probability is proportional to inclusion diameter while adhesion probability
increases with a decrease in the inclusion size, and although both effects are opposite
the overall inclusion removal by bubbling is increased for larger particle sizes.
11. Stirring is fundamental in the secondary metallurgy process. Over stirring produces a
poor inclusion removal because the reoxidation is high. Low stirring does not produce
reoxidation, but the final particle value is high due to insufficient stirring for flotation. The
optimal stirring process (strong stirring at the beginning to coalesce inclusions and to
form bigger ones; Miki, Thomas, Denissov & Shimada and Zhang & Thomas) should
present a better inclusion removal than value found by the model, because it does not
consider inclusion growth and for this reason the beneficial effect is lower than expected.
12. An interesting point is the effect of stirring level on small and large inclusions. The
smallest inclusions are more easily removed by soft stirring than by a stronger one.
Reoxidation produces more small inclusions than larger ones (considering a fixed
oxygen increment) and small particles are removed less by bubbling and slag than large
particles. Removal of large inclusions is directly proportional to the gas flow rate;
reoxidation has a low impact on large inclusions, and particles removal by bubbling and
slag increase with stronger stirring. It can be concluded that if the optimal stirring is not
possible, it is preferable an over stirring than understir, because the strong stirring easily
removes the largest inclusions which can produce defects.
13. The inclusions found are pure alumina (product of deoxidation) and with oxides from
slag (CaO and MgO). The data analyzed shows that the quantity of pure Al2O3 inclusions
increases during the process; this is the opposite observation to Graham (Graham

Master Thesis- J. Pérez McMaster University- Materials Science and Engineering
Final Report- Steelmaking Course 105
2008). The inclusions Al2O3-MgO or Al2O3- CaO in general are larger than pure Al2O3
inclusions, for this reason they can float up easier than smaller ones.
6.2 Future Work
This project gives tools to model the effect the some of most important variables to
affect the inclusion control in ladle metallurgy furnace. Points identified requiring further
researching are:
1. The effect of slag composition in the inclusion removal by slag with low basicity (high
viscosity) or MgO saturated.
The current assumption that the inclusions are dissolved instantly, if the chemical
and physical properties of slag (viscosity and the driving forces) do not allow kinetics of
dissolution enoughly fast, inclusions remain near the interface and increases the risk of
reentrainment.
2. Inclusion growing by stirring.
Gas bubbling is effective to remove inclusions because bubbles collide with the
inclusions and float up them faster than an inclusion alone, it is an important variable
used in inclusion control.
3. Removal mechanism by inclusion modified by calcium treatment.
Calcium treatment modified the inclusion morphology and the effect of the
mechanisms studied respect to the alumina inclusion. It is a process used in many
steelshops.
Master Thesis- J. Pérez McMaster University- Materials Science and Engineering
Final Report- Steelmaking Course 106
BIBLIOGRAPHY
Ahlborg K., Bieniosek T. and Tucci J. (1993). Slag Making Practices at the LTV Steel
Cleaveland Works. 76th Steelmaking Conference Proc., ISS, Warrendale, 469-473.
Anagbo P.E. and Brimacombe J. K. (1990). Plume Characteristics and Liquid Circulation
in Gas Injection through a Porous Plug. Metallurgical Transactions B, vol 21B, pp 637-
48.
Aoki J., Zhang L. and Thomas B. (2005). Modelling of Inclusion Removal in Ladle
Refining. 3rd International Congress on the Science and Technology of Steelmaking ICS
Proceedins, AISTech, 319- 332.
Bannenberg N.. (1995). Interactions between the Refractory Material and the Steel and
its Effect on the Clean Steel Production. Stahl und Eisen, 115, 2, 75- 82.
Bonilla C. (1995). Slivers in Continous Casting, 78th Steelmaking Conference
Proceedings, Vol 78, ISS, Warredake, 41- 45.
Brandaleze E., Martin A., Donayo R., Pérez J. and Gómez A. (2007). Study of the
evolution of microinclusions during ladle furnace refining at Siderar in order to review the
downloading criteria. 7th International Conference on Clean Steel.
Braun T.B., Elliot J.F. & Flemings M.C. (1979). The Clustering of Alumina Inclusions.
Met. Trans. B, 10B, 171- 184.
Bristow D., Carter R., Frakes H., Lewis D., Mang J. and Sattelberger S. (2000).
Ferroalloys and Alloying Additives Handbook: 2nd Edition. New York: Shieldalloy
Metallurgical Corporation.

Master Thesis- J. Pérez McMaster University- Materials Science and Engineering
Final Report- Steelmaking Course 107
Clift R., Grace J.R. and Weber M.E. (1978). Bubbles, drops and particles. Academic
Press, 27, 112, 130, 172.
Cramb A. and Jimbo I. (1989). Calculation of the Interfacial Properties of Liquid Steel-
Slag System. ISIJ Int., 16, 157-165.
Davis R.M. and Taylor G. (1950). The Mechanics of Large Bubbles Rising through
Liquids in Tubes. Proc. Royal Society, Series A, 200, N° A1062, 375- 390.
Dekkers R. (2002). Chapter 4. Ph D Thesis, 25- 41.
Dekkers R. (2002). Chapter 10, Ph D Thesis, 133- 151.
Elliot J. and Gleiser M. (1960). Thermochemistry for Steelmaking (Vol. 1). Reading
Mass.: Addison- Wesley Pub. Co.
Engh T.A. and Lindskog N. (1975). A Fluid Mechanical Model of Inclusion Removal.
Scandinavian Journal of Metallurgy, 4, 49-54.
Espinosa C. (2005). Chapter 4, Mechanical Engineer Thesis, UBA. 24- 31.
Ghosh A. (2001) Secondary Steelmaking: Principles and Applications. Chapter 4, 79-
102.
Graham K. (2008). Chapter 4, Ph D Thesis, 105- 124.
Graham K. (2008). Chapter 5, Ph D Thesis, 207- 251.
Guo D. and Irons G.A. (2002). A Water Model and Numerical Study of the Spout Height
in a Gas Stirred Vessel. Metallurgical Transaction B, 33B, 377- 384.

Master Thesis- J. Pérez McMaster University- Materials Science and Engineering
Final Report- Steelmaking Course 108
Hallberg M., Jönsson P.G., Jonsson T.L. and Eriksson R. (2005). Process Model of
Inclusion Separation in a Stirred Steel Ladle. Scandinaviasn Journal of Metallurgy, 34,
41- 56.
Heindel T. and Bloom F. (1999). Exact and Approximate Expressions for Bubble/ Particle
Collision. Submitted to Journal of Colloid and Interface Science, 1- 40.
Hoefele E. O. and Brimacombe J.K. (1979). Flow Regimes in Submerged Gas Injection.
Metallurgical Transaction B, 10B, 631- 648.
Irons G.A. and Guthrie R.I.L. (1981). Bubbling behavior in Molten Metals. Canadian
Metallurgical Quarterly, Vol 19, N° 4, 381- 387.
Krishnapisharody K. and Irons G. (2007). A Study of Spout on Bath Surfaces from Gas
Bubbling: Part I. Experimental Investigation. Metallurgical and Materials Transaction
38B, 367-375.
Kor G.J.W. and Glaws P.C. (1998). Chapter 11: Steelmaking and Refining Volume, The
AISE Steel Foundation, 694-713.
Lange K.W. (1988). Thermodynamic and Kinetic Aspects of Secondary Steelmaking
Process. International Materials Review. Vol 33, 53- 89.
Levich V.G. (1962). Physicochemical hydrodynamics. Englewood Cliffs, 395- 470.
Lu D. (1992). Kinetics Mechanisms and Modeling of Calcium Treatment of Steel. PhD
Thesis.
Miki Y., Thomas G., Denissov A. and Shimada Y. (1997). Model of Inclusion Removal
during RH Degassing of the Steel. Iron Steelmaker, 24, N°8, 31.

Master Thesis- J. Pérez McMaster University- Materials Science and Engineering
Final Report- Steelmaking Course 109
Nakashima K. and Okamura K. (1992). Behavior of Fines in the Blast Furnace. Proc. 4th
Conf. Molten Slags and Fluxes, ISIJ, 505- 510.
Oeters F. (1994). Metallurgy of Steelmaking. VSHD, Berlín, 225- 240.
Oertel L.C., Costa E and Silva A. (1999). Application of Thermodynamic Modelling to
Slag-Metal Equilibria in Steelmaking. Calphad, v 23, n 3-4, 379- 391.
Ohta H. and Suito H. (1998). Activities of SiO2 and Al2O3 and Activity Coefficients of FetO
and MnO in CaO-SiO2-Al2O3-MgO Slags. Metallurgical Materials Transaction B, Vol. 29
B, 119- 129.
Osborne-Lee I.W. (1988). Particles on Surface I. K. L. Mittal Plenum Press, New York
and London, 77.
Pan W., Uemura K-I and Koyama S. (1992). Cold Model Experiment on Entrapment of
Inclusions in Steel by Inert Gas. Tetsu-to-Hagane, Vol 78, N 8, 87
Peebles F.N. and Garber H.J. (1953). The Motion of Gas Bubbles in Liquids. Chemical
Rng. Prog, 49, 88.
Robinson S.W., Martin I.W. & Pickering F.B. (1979). Formation of Alumina in Steel and
its Dissemination during Mechanical Working. Met Techn, 157- 169.
Sahajwalla V., Castillejos A.H. and Brimacombe J.K. (1990). The Spout of Air Jets
Upwardly Injected into a Water Bath. Metallurgical Transaction B, 21B, 71- 80.
Sano M. and Mori K. (1976). Bubble Formation from Single Nozzles in Liquid Metals.
Trans. Japan Institute of Metals 17, 344- 352.
Schulze H.J. (1989). Hydrodynamics of Bubble-Mineral Particle Collisions. Mineral
Process and Extractive Metallurgy Rev 5, 43-76.
Master Thesis- J. Pérez McMaster University- Materials Science and Engineering
Final Report- Steelmaking Course 110
Schulze H.J. (1992). Probability of Particle Attachment on Gas Bubbles by Sliding.
Advances Colloid Interface Science. Vol 40, 283.
Schulze H.J. and Birzer J.O. (1987). Stability on Thin Liquid Film on Langmuir-Blodgett
Layers on Silica Surfaces. Colloids Surface, 24, 209- 224.
Söder M. (2004). PhD Thesis, Growth and Removal of Inclusions during Ladle Refining.
Sridhar S., Cramb A.W., Lee S.H., Tse C., Yi K.W., Chevrier V. and Orrling C. (2001).
Separation and Dissolution of Al2O3 Inclusions at Slag/ Metal Interfaces. Journal of Non-
Cristalline Solids, 282, 41- 48.
Taira S., Nakashima K. and Mori K. (1993). Kinetic Behavior of Dissolution of Sintered
Alumina into CaO-SiO2-Al2O3 Slags. ISIJ Int. 33(1) , 116-123.
Taniguchi S., Kikuchi A., Ise T. and Shoji N. (1996). Model Experiment on the
Coagulation of Inclusion Particles in Liquid Steel. ISIJ International, 36, S117.
Turkdogan E. T. (1996), Fundamentals of Steelmaking. The Institute of Materials
(London, England), Chapter 9.
Turkdogan E. T. (2001), Retrospect on Technology Innovations in Ferrous
Pyrometallurgy. Canadian Metallurgical Quarterly, Vol. 40, N° 3, 255- 308.
Valdez M., Prapakorn K., Cramb A.W. and Sridhar S. (2002). Dissolution of Alumina
Particles in CaO- Al2O3- SiO2- MgO Slags. Iron and Steelmaking, Vol 29, 47- 52.
Van der Eijk C., Grong O. and Walmsley J. (2000). Effect of Deoxidation Practice on the
Inclusion Formation in Low Alloy Structural Steels. 6Th International Conference on
Molten Slags, Fluxes and Salts.
Master Thesis- J. Pérez McMaster University- Materials Science and Engineering
Final Report- Steelmaking Course 111
Wang L., Lee H-G and Hayer P. (1996). Prediction of the Optimum Bubble Size for
Inclusion Removal from Molten Steel by Flotation. ISIJ Int., 36, N° 1, 7- 16.
Weber M. E. and Paddock D. (1983). Interceptional and Gravitational Collision
Efficiencies for Single Collectors at Intermediate Reynolds Number. Journal Colloid
Interface Science, 94, N° 2, 328.
Wijk O. (1995). Inclusion Engineering. Scaninject VII. 7th International Conference on
Refining Process. Part I, 35-67.
Wilson W. and McLean A. (1980): Desulphurization of Iron and Steel and Sulphide
Shape Control. Warrendale, PA: Iron and Steel Society of AIME.
Winkler W., Angeli J. and Mayr M. (2006). Automated SEM-EDX Cleanness Analysis
and its Application in Metallurgy. 7th International Worshop Progress in Analytical
Chemistry in the Steel and Metal Industries. Luxemburg. 16- 18.
Yonezawa K. and Schwerdtfeger K. (2000). Dynamics of the Spout of the Gas Plumes
Descharging from a Melt: Experimental Investigation with a Large-Scale Water Models.
Metallurgical Transaction B, 31B, 461- 468.
Yoon R.H. and Luttrell G.H. (1989). The Effect of Bubble Size on Fine Particle Flotation.
Mineral Process and Extractive Metallurgy Rev 5, 101-122.
Yoon R.H. and Luttrell G.H. (1992). A Hydrodynamic Model for Bubble-Particle
Attachment. Journal Colloid Interface Science, 154, 129-137.
Zhang L. and Cai K. (2001). Experimental and Theoretical Study on the Cleanliness of
Steel. 84Th Steelmaking Conference Proceedings. ISS/AIME, Vol 84, 275-291.
Zhang L. and Taniguchi S. (2000). Fundamentals of Inclusion Removal from Liquid Steel
by Bubble Flotation. International Materials Reviews, Vol 45, N° 2, 59- 82.
Master Thesis- J. Pérez McMaster University- Materials Science and Engineering
Final Report- Steelmaking Course 112
Zhang L., Pluschkell W. and Thomas B. (2002). Nucleation and Growth of Alumina
Inclusion during Deoxidation. 85th Steelmaking Conference (Nashville), Vol 85, 463- 476.
Zhang L. and Thomas B.G. (2002). Alumina Inclusion Behaviour During Steel
Deoxidation. 7th European Electric Steelmaking Conf., Vol. II, Associazione Italiana di
Metallurgia, 2.77.
Zhang L. and Thomas B. (2003). State of the Art in Evaluation and Control of Steel
Cleanliness. ISIJ, Vol 43, 3, 271- 291.
Zhang L. and Thomas B. (2003). Inclusions in Continuous Casting of Steel. XXIV
National Steelmaking Symposium Mexico, 138- 183.
Zhang L., Taniguchi S. and Matsumoto K. (2002). Water Model Study on Inclusion
Removal from Liquid Steel by Bubble Flotation under Turbulent Conditions. Iron and
Steelmaking, Vol 29, N° 5, 326- 336.

Master Thesis- J. Pérez McMaster University- Materials Science and Engineering
Final Report- Steelmaking Course 113
APPENDIX
Appendix A: Model
% Define Variables:
% n -- Number of input samples
% a -- Collision efficiency
% A13b -- Hamaker constant of inclusion- liq steel-bubble system
% aFeO -- FeO activity coefficient in the slag
% alfa -- Semiangle of contact between inclusion and bubble
% Aeye -- Eye area without slag (m2)
% Al -- Aluminium content in the steel (%)
% AlO -- Alumina content in slag (%)
% ALadle -- Ladle are (m2)
% ASlag -- Slag area (m2)
% AWall -- Refractory area (m2)
% B -- Constant (Miyashita equation)
% Ca -- CaO content in slag (%)
% dB -- Diameter of the bubble (m)
% dFe -- Steel density (Kg/ m3)
% dg -- Gas density (Kg/ m3)
% di -- Diameter of the inclusion (m)
% dp -- Particle density, Al2O3 is consider (Kg/ m3)
% DO -- Diffusion coeficient of oxygen in steel (m2/ s)
% E -- Turbulent energy dissipation (m2/ s3)
% Fe -- FeO content in slag (%)
% G -- Dimensionless constant
% g -- Gravity acceleration (m/ s2)
% H -- Height of ladle (steel height) (m)

Master Thesis- J. Pérez McMaster University- Materials Science and Engineering
Final Report- Steelmaking Course 114
% i -- Number of molecules in each particle
% hcr -- Critical film thickness (m)
% koi -- Mass transfer coefficient (depends of stirring intensity for slag)
% koi1 -- Mass transfer coefficient (depends of stirring intensity for eye)
% KFeO -- FeO equilibrum constant
% KMnO -- MnO equilibrum constant
% m -- Total number of molecules function of total oxygen (1/m3)
% Mg -- MgO content in slag (%)
% Mn -- MnO content in slag (%)
% Mns -- Manganese content in the steel (%)
% Mo -- Molar Weigh of Oxygen (Kg)
% Mp -- Molar Weigh of particle, Al2O3 is considered (Kg)
% MCa -- Molar CaO weigth
% MFe -- Molar FeO weigth
% MMg -- Molar MgO weigth
% MMn -- Molar MnO weigth
% MSi -- Molar SiO2 weigth
% nO -- Effect oxygen in molar ratio
% nP -- Effect particle in molar ratio
% Na -- Avogadro's Number (1/ mol)
% N0 -- Initial number of total inclusions (1/m3)
% Nrb -- Total number of "effective adhesions" bubble- inclusion (1/ m3)
% Nref -- Number of iclusion of Ri removal to refractory (1/ m3)
% NSlag -- Number of particles removal to slag
% NRi -- Number of particles of Ri
% Nreo -- Number of particles produced by reoxidation (1/ m3)
% Nfi -- Number of total inclusions at the end of treatment (1/ m3)
% Oatm -- Oxygen in atmosphere for reoxidation (%)
% Odis -- Total Oxygen for reoxidation, it's dissolve oxygen (%)
% Oini -- Total oxygen befor tapping (ppm)
% Oint -- Oxygen in equilibrium with FeO and MnO of slag (%)
% Oeq -- Oxygen in equilibrium with aluminum content (%)

Master Thesis- J. Pérez McMaster University- Materials Science and Engineering
Final Report- Steelmaking Course 115
% Otot -- Total oxygen (ppm)
% Pa -- Adhesion probability
% Pc -- Collision posibility
% P -- Atmospheric pressure (bar)
% Q -- Flow caudal per Tn of steel(Nm3/ s * Tn steel)
% R -- Ideal gas constant (J/ mol K)
% Re -- Reynolds number
% Ri -- Radius of particle (m)
% rladlle -- Ladle radius (m)
% rm -- Radius of molecule (m)
% text1 -- Temperature (K)
% text1 -- Time input data (s)
% tf -- Film drainage and rupture time (s)
% T0 -- Temperature of the gas before pluges (K)
% totalm -- Total moles of oxides in the slag
% Si -- Silica content in slag (%)
% St -- Surface tension (N/m)
% sum_text1 -- Total time (s)
% uFe -- Steel viscosity (Kg/ m.s)
% ug -- Gas viscosity (Kg/ m.s)
% V -- Volume of the steel (m3)
% vb -- Velocity of the bubble (m/ s)
% vFe -- Kinematic viscosity (m2/ s)
% vStoke -- Velocity for Stoke's law (m/ s)
% vz -- Velocity for stirring in z direction (m/ s)
% VRi -- Volume of particles with Ri (m3)
% Wsteel -- Weight of steel (Kg)
% x -- Diameter relationship
% XFeO -- FeO molar fraction
% Initialize dFe,dp,g,Ri,uFe and vz
a = 0.3; % Collision efficiency

Master Thesis- J. Pérez McMaster University- Materials Science and Engineering
Final Report- Steelmaking Course 116
A13b = 2.3*10^-20; % Hamaker constant to Al2O3
B = 0.63; % Constant (Miyashita equation)
dFe = 6900; % Steel density
dg = 0.332; % Gas density
dp = 3960; % Particle density, consider Al2O3
Do = 3*10^-9; % Diffusion coefficient of oxygen in steel
g = 9.81; % Gravity acceleration
G = 4; % Dimensionless constant
kemp = 0.35; % Empirical constant to correct removal to slag
MO = 32; % Molar oxygen weigth
MP = 102; % Molar particle weigth
MCa = 56.1; % Molar CaO weigth
MFe = 71.9; % Molar FeO weigth
MMg = 40.3; % Molar MgO weigth
MMn = 70.9; % Molar MnO weigth
MSi = 60.1; % Molar SiO2 weigth
nP = 1; % Molar ratio particle- oxygen
nO = 3; % Molar ratio particle- oxygen
Na = 6.022*10^23; % Number of atoms per mol
N0 = 10000; % Initial number of inclusions
P = 1.013; % Atmospehric pressure (bar)
R = 8.314; % Ideal gas constant (J/ mol K)
rm = 2.719*10^-10; % Radius of molecule (m)
St = 1.4; % Surface tension (N/m)
uFe = 0.007; % Steel viscosity
ug = 0.0000225; % Gas viscosity
vFe = 0.000001; % Kinematic viscosity (m2/ s)
% Read in the first value (only in the beginning)
rladle = 1.82;
H = 3.5;

Master Thesis- J. Pérez McMaster University- Materials Science and Engineering
Final Report- Steelmaking Course 117
Wsteel = 193000;
T0 = 298;
Aladle = pi * rladle^2;
Oatm = 20.9;
set(handles.textnum,'string',num2str(handles.cont))
T = str2num(get(handles.edit1,'string'));
Q= str2num(get(handles.edit2,'string'));
Q = Q /(60*Wsteel);
Oini = str2num(get(handles.edit3,'string'))/10000;
Al = str2num(get(handles.edit4,'string'));
Mns = str2num(get(handles.edit5,'string'));
Fe = str2num(get(handles.edit6,'string'));
Mn = str2num(get(handles.edit7,'string'));
Ca = str2num(get(handles.edit8,'string'));
Mg = str2num(get(handles.edit9,'string'));
Si = str2num(get(handles.edit11,'string'));
Alo = str2num(get(handles.edit10,'string'));
% General calculations
V = Wsteel/ dFe;
hcr = 3.79*10^-8 * A13b^0.16;
E = 2 * Q * P * logm(1 + dFe * g * H/P)/ (pi * rladle * H * dFe);
% Calculate %O in the steel in equilibrium with Al content in it
Oeq = [10(-62680/T+31.85]/[Al*(10)-3.9Al];
% Calculate %O in the slag for FeO
KFeO = exp((-116100+48.4*T)/(R*T));
Master Thesis- J. Pérez McMaster University- Materials Science and Engineering
Final Report- Steelmaking Course 118
aFeO = 10^((0.676*Mg + 0.267*Alo - 19.07)/ Si + 0.0214*Ca - 0.047);
totalm = (Fe/MFe) + (Mn/MMn) + (Al0/Mp) +(Si/MSi) + (Ca/MCa) + (Mg/MMg);
XFeO = Fe/MFe / totalm;
Oint = KFeO * XFeO * aFeO;
m = (Oini - Oeq) * Wsteel * Na/ (V*16*3);
% Calculate Slag area
Aeye = 0.414 * (193 * Q/2)^-0.22 * H^3.78 *[(1 + 11.6 * (193*Q/2)^0.74 * H^-2.46)^1.5 -
1]*2;
ASlag = ALadle - Aeye;
Awall = pi * 2 * rladle * H;
% Calculate koi with Higbie's surface theory (A. Ghosh book):
koi = 20 * (D0 * Q/ (pi * rladle *Aslag))^0.33;
koi1 = 20 * (D0 * Q/ (pi * rladle *Aeye))^0.33;
%cGet the total time to run:
t = str2num(get(handles.edit12,'string'));
% BUBBLE MODEL
% General Calculation
db = 0.03;
vb = db * [g/ 36 * (dFe/ uFe)^0.5]^(2/3);
Re = vb * dg * db/ ug;
% REOXIDATION: Calculate Oxygen produce for Reoxidation (%Odis) at time text1
Odis = [((Oint - Oeq) * koi * ASlag) + ((Oatm - Oeq) * koi1 * Aeye)]/ Wsteel;
VRi = (Odis * dFe * Mp * np* 0.000001)/ (dp * M0 * n0);
% Initialize sum:
sum_NRi = 0;

Master Thesis- J. Pérez McMaster University- Materials Science and Engineering
Final Report- Steelmaking Course 119
sum_t = 0;
% CALCULATION Ri = 10^-6 (1.2 is considered, because with 1 there isn't
enough flotation compare with measured values)
Ri = 0.00000116;
di = 2 * Ri;
% Calculate particle velocity (vz)
vz = [g * (dFe - dp)/(9 * uFe^0.5 * dFe^0.5)]^(2/3) * di;
% Calculate number of particles of each radius
i = (Ri/rm)^3;
NR0 = m/ (5.4 * i);
step=10;
for ii = 1:step:t
if (ii == 1 && handles.cont==1)
sum_NRi = NRo;
else
sum_NRi = handles.Nfi;
end
sum_t = step;
% BUBBLE MODEL
% Calculation of some variables from the input datas
k1 = vZ/ vB;
k2 = di/ dB;
x = 1 + k2;

Master Thesis- J. Pérez McMaster University- Materials Science and Engineering
Final Report- Steelmaking Course 120
% Calculation particles removal to bubbles
alfa = [pi * (dp + 1.5*dFe)*di^3/ (24 * St)]^0.5;
tf = 2100 * uFe * (32 * (vZ-vB) * alfa)^1.2 * (pi/ 180)^2 * Ri^3 / (8 * G * St * hcr^2);
y = -2 * tF * [(1 - 0.75/x - 0.25/x^3 + Re^0.72/ 15 * (-2/ x^4 + 1/ x^3 + 1/ x)) * vB – vZ];
Pa = [sin(2*atan(exp(y/(db+di))))]^2;
Pc = k2^2/ (1-k1) * [1.5 + k2 + 2 * Re^0.72 * (2 + k2)/ (15 * x)]/ x^3;
Nrb = 3 * Q * H * sum_NRi * T * Pc * Pa * 193000/ (2 * dB * T0 * V);
% Calculation particles removal to refractory (Zhang model)
Nref = 0.062 * Awall * E^0.75 * Ri^2 * sum_NRi * sum_t/ (V * vFe^1.25);
% Calculate N of particles removal to slag at time text1
Nslag = sum_t * Aslag * vZ * sum_NRi/ V;
% Calculate N of particles with Ri at the end of treatment
NFi = sum_NRi - Nrb - Nslag - Nref;
% Calculate Total Oxygen at the end of treatment
Otot = 7.4 * NFi * i * 16000* V/ (Wsteel * Na);
% CALCULATION R1 = 2.5 10^-6
R1 = 0.0000025;
d1 = 2 * R1;

Master Thesis- J. Pérez McMaster University- Materials Science and Engineering
Final Report- Steelmaking Course 121
i1 = (R1/rm)^3;
NRo1 = m/ (3.8 * i1);
% Calculate particle velocity (vZ)
vZ1 = [g * (dFe - dp)/(9 * uFe^0.5 * dFe^0.5)]^(2/3) * d1;
if (ii == 1 && handles.cont==1)
sum_NR1 = NRo1;
else
sum_NR1 = handles.Nf1;
end
% BUBBLE MODEL
% Calculation of some variables from the input data
k3 = vZ1/ vB;
k4 = d1/ dB;
x1 = 1 + k4;
% Calculation particles removal to bubbles
alfa = [pi * (dP + 1.5*dFe)*d1^3/ (24 * St)]^0.5;
tf = 2100 * uFe * (32 * (vZ1 – vB) * alfa)^1.2 * (pi/ 180)^2 * R1^3 / (8 * G * St * hcr^2);
y1 = -2 * tf * [(1 - 0.75/x1 - 0.25/x1^3 + Re^0.72/ 15 * (-2/ x1^4 + 1/ x1^3 + 1/ x1)) * vB - vZ1];
Pa1 = [sin(2*atan(exp(y1/(dB+d1)))]^2;
Pc1 = k4^2/ (1-k3) * [1.5 + k4 + 2 * Re^0.72 * (2 + k4)/ (15 * x1)]/ x1^3;
Nrb1 = 3 * Q * H * sum_NR1 * T * Pc1 * Pa1* 193000/ (2 * dB * T0 * V);

Master Thesis- J. Pérez McMaster University- Materials Science and Engineering
Final Report- Steelmaking Course 122
% Calculation particles removal to refractory (Zhang model)
Nref1 = 0.062 * Awall * E^0.75 * R1^2 * sum_NR1 * sum_t/ (V * vFe^1.25);
% Calculate N of particles removal to slag at time text1
NSlag1 = sum_t * Aslag * vZ1 * sum_NR1/ V;
% Calculate N of particles with Ri at the end of treatment
Nf1 = sum_NR1 - Nrb1 – NSlag1 - Nref1;
% Calculate Total Oxygen at the end of treatment
Otot1 = 1 * Nf1 * i1 * 16000* V/ (Wsteel * Na);
% CALCULATION R2 = 0.000004
R2 = 0.000004;
d2 = 2 * R2;
% Calculate particle velocity (vZ)
vZ2 = [g * (dFe - dp)/(9 * uFe^0.5 * dFe^0.5)]^(2/3) * d2;
% Calculate number of particles of each radius

Master Thesis- J. Pérez McMaster University- Materials Science and Engineering
Final Report- Steelmaking Course 123
i2 = (R2/rm)^3;
NR02 = m/ (0.8 * i2);
if (ii == 1 && handles.cont==1)
sum_NR2 = NR02;
else
sum_NR2 = handles.Nf2;
end
% BUBBLE MODEL
% Calculation of some variables from the input datas
k5 = vZ2/ vB;
k6 = d2/ dB;
x2 = 1 + k6;
% Calculation particles removal to bubbles
alfa = [pi * (dp + 1.5*dFe)*d2^3/ (24 * St)]^0.5;
tF = 2100 * uFe * (32 * (vZ2 – vB) * alfa)^1.2 * (pi/ 180)^2 * R2^3 / (8 * G * St * hcr^2);
y2 = -2 * tF * [(1 - 0.75/x2 - 0.25/x2^3 + Re^0.72/ 15 * (-2/ x2^4 + 1/ x2^3 + 1/ x2)) * vB - vZ2];
Pa2 = [sin(2*atan(exp(y2/(dB+d2)))]^2;
Pc2 = k6^2/ (1-k5) * [1.5 + k6 + 2 * Re^0.72 * (2 + k6)/ (15 * x2)]/ x2^3;
Nrb2 = 3 * Q * H * sum_NR2 * T * Pc2 * Pa2 * 193000/ (2 * dB * T0 * V);
% Calculation particles removal to refractory (Zhang model)
Nref2 = 0.062 * Awall * E^0.75 * R2^2 * sum_NR2 * sum_t/ (V * vFe^1.25);

Master Thesis- J. Pérez McMaster University- Materials Science and Engineering
Final Report- Steelmaking Course 124
% Calculate N of particles removal to slag at time text1
NSlag2 = sum_t * ASlag * vZ2 * sum_NR2/ V;
% Calculate N of particles with Ri produced by reoxidation at time text1
Nreo2 = (3 * VRi * t)/ (4 * pi * R2^3);
% Calculate N of particles with Ri at the end of treatment
Nf2 = sum_NR2 - Nrb2 - NSlag2 - Nref2 + Nreo2;
% Calculate Total Oxygen at the end of treatment
Otot2 = 1.6 * Nf2 * i2 * 16000* V/ (Wsteel * Na);
handles.Nfi=Nfi;
handles.Nf1=Nf1;
handles.Nf2=Nf2;
end
% Tell user
fprintf ('The reoxidation for diameter < 10um is: %f\n', Nreo2);
fprintf ('The total oxygen at the end of treatment is: %f\n', Otot+Otot1+ Otot2+Oeq*10000);
fprintf ('The number of particles of diameter < 2um at the end of treatment is: %f\n',
Nfi/10^10);
fprintf ('The number of particles of diameter < 5 um at the end of treatment is: %f\n',
Nf1/10^10);

Master Thesis- J. Pérez McMaster University- Materials Science and Engineering
Final Report- Steelmaking Course 125
fprintf ('The number of particles of diameter < 10 um at the end of treatment is: %f\n',
Nf2/10^10);
fprintf ('The number of particles removal to bubble is: %f\n', Nrb);
fprintf ('The number of particles removal to bubble is: %f\n', Nrb1);
fprintf ('The number of particles removal to bubble is: %f\n', Nrb2);
fprintf ('The number of particles removal to slag is: %f\n', NSlag);
fprintf ('The number of particles removal to slag is: %f\n', NSlag1);
fprintf ('The number of particles removal to slag is: %f\n', NSlag2);
fprintf ('The time consider in this experiment is: %f\n\n', t);
Appendix B: Heats Process Parameters
B.1 Heat 880558, Initial Oxygen: 581 ppm
Sample Time (sec)
Temper (°K)
Flow rate (l/ min) % Al % Mn % FeO % MnO % CaO % MgO % Al2O3 % SiO2
So 240 1853 800 0.032 0.27 7 4.35 53.1 8.09 28.1 5.80L10 1800 1824 300 0.013 0.27 7 4.35 53.1 8.09 28.1 5.80L11 2340 1834 600 0.024 0.29 6.4 4.52 53.6 9.04 28.0 5.41L12 2700 1825 1100 0.019 0.335 2 1.35 55.2 11.90 29.4 5.59L13 3480 1862 700 0.028 0.38 2.4 1.56 54.3 10.50 29.2 5.12T1 4020 1856 400 0.024 0.38 1.9 1.62 54.4 10.40 28.9 5.13
Table B-1. Process Parameters for Heat 880558
B.2 Heat 880595, Initial Oxygen: 674 ppm
Sample Time (sec)
Temper (°K)
Flow rate (l/ min) % Al % Mn % FeO % MnO % CaO % MgO % Al2O3 % SiO2
So 720 1844 1000 0.040 0.34 4.4 2.95 54.7 12.3 28.3 5.85L10 1800 1826 300 0.037 0.35 3.1 2.84 54.4 12.0 28.0 5.58L11 2280 1821 500 0.041 0.37 3.1 0.97 49.7 13.8 29.8 5.08L12 3060 1870 600 0.034 0.36 2.8 0.97 49.7 12.9 29.8 5.08L13 3480 1854 600 0.037 0.36 2.8 0.81 50.8 12.9 30.0 5.30T1 3720 1850 400 0.037 0.36 1.5 0.66 51.2 12.4 30.0 5.20
Table B-2. Process Parameters for Heat 880595

Master Thesis- J. Pérez McMaster University- Materials Science and Engineering
Final Report- Steelmaking Course 126
B.3 Heat 860630, Initial Oxygen: 611 ppm
Sample Time (sec)
Temper (°K)
Flow rate (l/ min) % Al % Mn % FeO % MnO % CaO % MgO % Al2O3 % SiO2
So 1200 1854 800 0.021 0.136 6.77 3.02 52.9 8.59 28.8 8.24L10 2340 1830 300 0.015 0.135 6.69 3.12 51.1 8.30 28.4 8.20L11 3720 1888 500 0.028 0.163 6.32 3.10 50.6 8.56 28.1 8.02L12 5520 1861 1300 0.015 0.188 2.16 1.37 51.2 9.95 29.8 7.53L13 5940 1876 500 0.026 0.195 1.63 0.57 51.9 11.24 29.8 7.41T1 7200 1866 300 0.024 0.196 1.52 0.49 49.8 11.00 29.5 6.82
Table B-3. Process Parameters for Heat 860630
B.4 Heat 880613, Initial Oxygen: 760 ppm
Sample Time (sec)
Temper (°K)
Flow rate (l/ min) % Al % Mn % FeO % MnO % CaO % MgO % Al2O3 % SiO2
So 2400 1834 600 0.000 0.145 4.87 2.27 49.0 9.30 29.7 5.48L10 3840 1820 200 0.001 0.144 4.94 2.46 48.6 9.46 29.6 5.38L11 5340 1887 500 0.012 0.170 3.66 1.75 48.2 9.69 30.1 5.08L12 6060 1873 1000 0.013 0.181 1.98 0.93 49.5 11.46 30.7 4.77L13 6360 1883 500 0.033 0.183 1.51 0.93 50.8 11.35 31.0 4.65T1 7200 1867 300 0.026 0.185 1.44 0.43 50.3 11.00 30.8 4.47
Table B-4. Process Parameters for Heat 860613
48
4950
5152
53
5455
56
SO L10 L1 L2 L3 T1 Sample
%C
aO
880558 880595 880613 860630
Figure B-1. Calcium oxide evolution during secondary metallurgy

Master Thesis- J. Pérez McMaster University- Materials Science and Engineering
Final Report- Steelmaking Course 127
8
9
10
11
12
13
14
SO L10 L1 L2 L3 T1 Sample
%M
gO
880558 880595 880613 860630
Fig B-2. Magnesium oxide evolution during secondary metallurgy
4
5
6
7
8
9
SO L10 L1 L2 L3 T1 Sample
%Si
O 2
880558 880595 880613 860630
Figure B-3. Silica evolution during secondary metallurgy
27
28
29
30
31
32
SO L10 L1 L2 L3 T1 Sample
%A
l 2O3
880558 880595 880613 860630
Fig B-4. Alumina evolution during secondary metallurgy

Master Thesis- J. Pérez McMaster University- Materials Science and Engineering
Final Report- Steelmaking Course 128
0.0
0.1
0.2
0.3
0.4
0.5
0.6
SO L10 L1 L2 L3 T1Sample
%M
nO
880558880595880613860630
Fig B-5. Manganese oxide evolution during secondary metallurgy
Appendix C: Variation of Inclusion Composition during the Secondary Metallurgy
C.1 Inclusion Composition for Heat 880588
% Al %FeO %MgO %CaO %SiO2
SO 0.046 7.0 8.09 53.1 5.80L10 0.013L1 0.024 6.43 9.04 53.6 5.41L2 0.019 2.0 11.9 55.2 5.59L3 0.028 2.38 10.5 54.3 5.12T1 0.024 1.94 10.4 54.4 5.13
Table C-1 . Steel and slag composition for heat 880588
C.2 Inclusion Composition for Heat 860613
% Al %FeO %MgO %CaO %SiO2
SO 0 4.87 9.30 49.0 5.48L10 0.001 4.94 9.46 48.6 5.38L1 0.012 3.66 9.69 48.2 5.08L2 0.013 1.98 11.46 49.5 4.77L3 0.033 1.51 11.35 50.8 4.65T1 0.026 1.44 11.35 50.3 4.47
Table C-2 . Steel and slag composition for heat 860613

Master Thesis- J. Pérez McMaster University- Materials Science and Engineering
Final Report- Steelmaking Course 129
C.3 Inclusion Composition for Heat 880595
% Al %FeO %MgO %CaO %SiO2
SO 0.04 4.4 12.3 54.7 5.85L10 0.037 3.1 12.0 54.4 5.58L1 0.041 4.3 13.8 49.7 5.08L2 0.034L3 0.037 2.8 12.9 50.8 5.30T1 0.037 1.52 12.4 51.2 5.20
Table C-3. Steel and slag composition for
heat 880595
(a)
(b) (c)
CaO
MgO Al2O3
CaO
MgO Al2O3
CaO
MgO Al2O3

Master Thesis- J. Pérez McMaster University- Materials Science and Engineering
Final Report- Steelmaking Course 130
(d) (e)
Figure C-1. Inclusion composition for heat 880595: (a) S0; (b) L0; (c) L1; (d) L2; (e) L3
C.4 Inclusion Composition for Heat 860630
% Al %FeO %MgO %CaO %SiO2
SO 0 4.87 9.30 49.0 5.48L10 0.001 4.94 9.46 48.6 5.38L1 0.012 3.66 9.69 48.2 5.08L2 0.013 1.98 11.46 49.5 4.77L3 0.033 1.51 11.35 50.8 4.65T1 0.026 1.44 11.35 50.3 4.47
Table C-4. Steel and slag composition for
heat 860630
(a)
CaO
MgO Al2O3
CaO
MgO Al2O3
CaO
MgO Al2O3

Master Thesis- J. Pérez McMaster University- Materials Science and Engineering
Final Report- Steelmaking Course 131
(b) (c)
(d) (e)
Figure C-2. Inclusion composition for heat 860630: (a) S0; (b) L0; (c) L1; (d) L2; (e) L3
CaO
MgO Al2O3
CaO
MgO Al2O3
CaO
MgO Al2O3
CaO
MgO Al2O3