Including source correlation and atmospheric turbulence in ...
17
Published by the Acoustical Society of America Volume 22 http://acousticalsociety.org/ 168th Meeting of the Acoustical Society of America Indianapolis, Indiana 27-31 October 2014 Noise: Paper 2aNSb1 Including source correlation and atmospheric turbulence in a ground reflection model for rocket noise Kent L. Gee and Tracianne B. Neilsen Department of Physics and Astronomy, Brigham Young University, Provo, UT; [email protected], [email protected] Michael M. James Blue Ridge Research and Consulting, LLC, Asheville, NC; [email protected] Acoustic data collected in static rocket tests are typically influenced by ground reflections, but have been difficult to account for. First, the rocket plume is an extended radiator whose directionality results from source correlation. Second, partial coherence of the ground interaction due to atmospheric turbulence can play a significant role, especially for larger propagation distances. In this paper, a finite impedance- ground, single-source interference approach [G. A. Daigle, J. Acoust. Soc. Am. 65, 45-49 (1979)] that incorporates both amplitude and phase variations due to turbulence is extended to distributions of correlated monopoles. The theory for obtaining the mean-square pressure from multiple correlated sources in the presence of atmospheric turbulence is described. The effects of source correlation, ground effective flow resistivity, and turbulence parameters are examined. Finally, the model predictions compared favorably against data from two horizontal firings of GEM-60 solid rocket motors – one involving snow-covered terrain – allowing effective removal of the ground reflection from far-field power spectral densities out to the maximum measurement distance of 1220 m. Close to the motor, more physically realistic corrected spectra are obtained by increasing the modeled fluctuating index of refraction by two orders of magnitude. © 2014 Acoustical Society of America [DOI: 10.1121/2.0000002] Received 04 November 2014; published 23 November 2014 Proceedings of Meetings on Acoustics, Vol. 22, 040001 (2014) Page 1 Redistribution subject to ASA license or copyright; see http://acousticalsociety.org/content/terms. Download to IP: 128.187.207.57 On: Sat, 29 Nov 2014 15:41:03
Transcript of Including source correlation and atmospheric turbulence in ...

Published by the Acoustical Society of America
Volume 22 http://acousticalsociety.org/
168th Meeting of the Acoustical Society of America Indianapolis, Indiana 27-31 October 2014
Noise: Paper 2aNSb1
Including source correlation and atmospheric
turbulence in a ground reflection model for
rocket noise
Kent L. Gee and Tracianne B. Neilsen Department of Physics and Astronomy, Brigham Young University, Provo, UT; [email protected],
Michael M. James Blue Ridge Research and Consulting, LLC, Asheville, NC; [email protected]
Acoustic data collected in static rocket tests are typically influenced by ground reflections, but have been
difficult to account for. First, the rocket plume is an extended radiator whose directionality results from
source correlation. Second, partial coherence of the ground interaction due to atmospheric turbulence can
play a significant role, especially for larger propagation distances. In this paper, a finite impedance-
ground, single-source interference approach [G. A. Daigle, J. Acoust. Soc. Am. 65, 45-49 (1979)] that
incorporates both amplitude and phase variations due to turbulence is extended to distributions of
correlated monopoles. The theory for obtaining the mean-square pressure from multiple correlated
sources in the presence of atmospheric turbulence is described. The effects of source correlation, ground
effective flow resistivity, and turbulence parameters are examined. Finally, the model predictions
compared favorably against data from two horizontal firings of GEM-60 solid rocket motors – one
involving snow-covered terrain – allowing effective removal of the ground reflection from far-field power
spectral densities out to the maximum measurement distance of 1220 m. Close to the motor, more
physically realistic corrected spectra are obtained by increasing the modeled fluctuating index of
refraction by two orders of magnitude.
© 2014 Acoustical Society of America [DOI: 10.1121/2.0000002]Received 04 November 2014; published 23 November 2014Proceedings of Meetings on Acoustics, Vol. 22, 040001 (2014) Page 1
Redistribution subject to ASA license or copyright; see http://acousticalsociety.org/content/terms. Download to IP: 128.187.207.57 On: Sat, 29 Nov 2014 15:41:03

1. BackgroundIn static rocket firings, such as the GEM-60 solid rocket motor test shown in Figure 1, the
distributed, directional nature of the noise source, coupled with sound propagation over terrain
and through the atmosphere, makes spectral predictions difficult. Because of the variable terrain,
both in terms of impedance and topology, ground-based microphones are often impractical for
static test environments and microphones are therefore elevated. However, ground reflection
models based on a monopole source are unable to reasonably quantify multipath interference
effects on radiated rocket noise. The radiation from different regions of the plume will be
incident on the ground at different angles and their direct and reflected wave contributions will
all superpose to yield the measured pressure at a microphone location. The present task examines
the effect of a finite-impedance ground model that includes atmospheric turbulence on the
radiation from arrays of correlated and uncorrelated sources. Military jet aircraft noise over a
rigid ground has been previously modeled using line arrays of correlated and uncorrelated
monopoles (Morgan et al., 2012) meant to mimic the partially coherent nature of the jet noise
source. A similar approach can be employed here to calculate the change in sound pressure level
for correlated and uncorrelated source arrays due to a finite-impedance ground and atmospheric
turbulence relative to free-field cases.
Figure 1. (Left) Distant view of a GEM-60 solid rocket motor firing. (Right) Schematic superimposed
on a near-nozzle photograph showing how interference effects from multiple source locations might
occur at the same microphone (dashed, black circle).
2. Theory
A. Foundational ModelsTo model the reflection of sound from a monopole with complex amplitude, 𝑨 = 𝐴𝑒𝑖𝜃, off a
finite-impedance ground at a receiver location, ℛ, (see Figure 2) we employ the
extended-reacting ground approach by Embleton et al. (1983). In this model, the (complex)
spherical reflection coefficient, 𝑸 = 𝑄𝑒𝑖𝛾, is obtained by modeling the ground impedance using
the “effective flow resistivity,” 𝜎. (Delany, 1970) The direct and reflected path lengths are
K. L. Gee et al. Modeling ground reflections for rocket noise
Proceedings of Meetings on Acoustics, Vol. 22, 040001 (2014) Page 2
Redistribution subject to ASA license or copyright; see http://acousticalsociety.org/content/terms. Download to IP: 128.187.207.57 On: Sat, 29 Nov 2014 15:41:03

shown as 𝑟𝐷, and 𝑟𝑅, respectively. This model, however, assumes a perfectly coherent interaction
between the direct and reflected waves, a case that does not exist in practice because atmospheric
turbulence that results in a partially coherent wave addition.
Figure 2. Source and image, with differing path lengths and complex spherical reflection coefficient,
leading to multipath interference at receiver position, R.
Although more complicated models exist for inclusion of turbulence in modeling of wave
addition from ground reflections, Salomons et al. (2001) showed that an approach by Daigle
(1978,1979,1983) is sufficiently accurate for most practical calculations. The model assumes a
theory of homogenous, isotropic turbulence with Gaussian spatial correlation and both amplitude
and phase fluctuations, and its solution assumes a large source-receiver separation distance. For a
single source with unity amplitude, Daigle (1979) calculated the long-term average, mean-square
pressure at the observer location, ℛ, for both amplitude and phase fluctuations, over a finite-
impedance ground with impedance, 𝑸 = 𝑄𝑒𝑖𝛾. We have recast his Eq. (10) in a different form,
also allowing for a nonunity source amplitude, 𝐴, and can write the mean-square pressure as
⟨𝑝2̅̅ ̅⟩ = 𝐴2 [1 + ⟨𝑎2⟩
𝑟𝐷2 + 𝑄2
1 + ⟨𝑎2⟩
𝑟𝑅2 +
2𝑄
𝑟𝐷𝑟𝑅[(1 + ⟨𝑎2⟩𝜌) cos(𝜙 + 𝛾)𝑒−𝜎2(1−𝜌)]]. (1)
In Eq. (1), ⟨𝑎2⟩ is the amplitude fluctuation, which is assumed to be the same for both the direct
and reflected paths, 𝜙 = 𝑘(𝑟𝑟 − 𝑟𝑑), 𝜎2 is the variance of the turbulent phase fluctuation, and 𝜌is the amplitude and phase covariance function. (They are taken to be equal in the Daigle model).
The parameters, ⟨𝑎2⟩, 𝜎2, and 𝜌 can all be calculated for the geometry given two inputs, ⟨𝜇2⟩ and
𝐿, which are the mean-square fluctuating index of refraction and the effective turbulence length
scale, respectively. These can be measured or can represent adjustable empirical constants.
Typical values for near-ground propagation are ⟨𝜇2⟩ = 1 × 10⁻⁵ and 𝐿 = 1.1 m. Ranges of
values for different ambient conditions are provided by Johnson et al. (1987). The ground
impedance, 𝑸, is calculated according to Embleton et al., (1983) which overcomes limitations
described by Daigle in his paper. The first term in Eq. (1) represents the mean-square pressure,
including turbulent fluctuations for the direct source (or path), whereas the second term
represents the mean-square pressure for the image source or reflected path. The third term
represents the interaction between the direct and image sources. If the turbulence is perfectly
correlated over all space, 𝜌 → 1 and we have [(1 + ⟨𝑎2⟩) cos(𝜙 + 𝛾)] for the portion of the third
term in the square brackets. Furthermore, if turbulent amplitude fluctuations are neglected and
𝑄𝑒𝑖𝛾
𝐴𝑒𝑖𝜃
ℛ
𝑟𝐷
𝑟𝑅
Ground Plane
K. L. Gee et al. Modeling ground reflections for rocket noise
Proceedings of Meetings on Acoustics, Vol. 22, 040001 (2014) Page 3
Redistribution subject to ASA license or copyright; see http://acousticalsociety.org/content/terms. Download to IP: 128.187.207.57 On: Sat, 29 Nov 2014 15:41:03

⟨𝑎2⟩ → 0, the third term reduces to 2Qcos(𝜙 + 𝛾)/𝑟𝑑𝑟𝑟, which is expected result for a perfectly
coherent ground interaction.
B. Multi-source theoretical model We now extend the model from a single spherical source to multiple sources, since any
reasonable jet or rocket source model consists of an extended distribution. Recall that the
previously developed jet noise model (Morgan, 2012) is comprised of line arrays of both
uncorrelated and correlated monopoles. For the uncorrelated sources, the model can be
implemented for each source, labeled m, and its image and the total mean-square pressure found
by summing the mean-square pressure from each source. For 𝑀 incoherent (denoted inc)
sources, this summation is written as
⟨𝑝2̅̅ ̅⟩inc = ∑ ⟨𝑝2̅̅ ̅⟩𝑚
𝑀
𝑚=1
= ∑ 𝐴𝑚2 [
1 + ⟨𝑎2⟩𝑚
𝑟𝐷,𝑚2 + 𝑄𝑖
21 + ⟨𝑎2⟩𝑚
𝑟𝑅,𝑚2
𝑀
𝑚=1
+2𝑄𝑚
𝑟𝐷,𝑚𝑟𝑅,𝑚[(1 + ⟨𝑎2⟩𝑚𝜌𝑚) cos(𝜙𝑚 + 𝛾𝑚)𝑒−𝜎𝑚
2 (1−𝜌𝑚)]] .
(2)
For correlated sources, a different approach is needed. We have returned to the roots of the
Daigle method to consider the summation of two coherent sources of arbitrary amplitude and
phase and their partially coherent images. The scenario is shown in Figure 3.
Figure 3. Geometry for the mth and nth sources.
In the Daigle model of multipath sound propagation through turbulence, amplitude and phase
fluctuations are included by letting 𝐴 → 𝐴(1 + 𝑎) and 𝑘𝑟 → 𝑘𝑟 + 𝛿. The process of obtaining
⟨𝑝2̅̅ ̅⟩ consists of writing the expressions for the four source terms in the complex pressure sum,
finding its complex conjugate, multiplying the terms together, and then evaluating the long-term
statistics of the turbulent fluctuations. The process involves multiple pages of algebra, but the
answer is similar to that of the uncorrelated source, except it involves a total of 10 terms. The full
expression may be written as
𝑄𝑛𝑒𝑖𝛾𝑛𝑄𝑚𝑒𝑖𝛾𝑚
𝐴𝑚𝑒𝑖𝜃𝑚
𝐴𝑛𝑒𝑖𝜃𝑛
𝑟𝐷,𝑛
𝑟𝑅,𝑛 𝑟𝑅,𝑚
𝑟𝐷,𝑚
K. L. Gee et al. Modeling ground reflections for rocket noise
Proceedings of Meetings on Acoustics, Vol. 22, 040001 (2014) Page 4
Redistribution subject to ASA license or copyright; see http://acousticalsociety.org/content/terms. Download to IP: 128.187.207.57 On: Sat, 29 Nov 2014 15:41:03

⟨𝑝2̅̅ ̅⟩𝑚𝑛 =𝐴𝑚
2 (1 + ⟨𝑎2⟩)
𝑟𝐷,𝑚2 + 𝑄𝑚
2𝐴𝑚
2 (1 + ⟨𝑎2⟩)
𝑟𝑅,𝑚2 +
2𝐴𝑚2 𝑄𝑚
𝑟𝐷,𝑚𝑟𝑅,𝑚
(1 + ⟨𝑎2⟩𝜌1) cos 𝜙1𝑒−𝜎12(1−𝜌1)
+𝐴𝑛
2 (1 + ⟨𝑎2⟩)
𝑟𝐷,𝑛2 + 𝑄𝑛
2𝐴𝑛
2 (1 + ⟨𝑎2⟩)
𝑟𝑅,𝑛2 +
2𝐴𝑛2 𝑄𝑛
𝑟𝐷,𝑛𝑟𝑅,𝑛
(1 + ⟨𝑎2⟩𝜌2) cos 𝜙2𝑒−𝜎22(1−𝜌2)
+2𝐴𝑚𝐴𝑛
𝑟𝐷,𝑚𝑟𝐷,𝑛
(1 + ⟨𝑎2⟩𝜌3) cos 𝜙3𝑒−𝜎32(1−𝜌3)
+2𝐴𝑚𝐴𝑛𝑄𝑚
𝑟𝑅,𝑚𝑟𝐷,𝑛
(1 + ⟨𝑎2⟩𝜌4) cos 𝜙4𝑒−𝜎42(1−𝜌4)
+2𝐴𝑚𝐴𝑛𝑄𝑛
𝑟𝐷,𝑚𝑟𝑅,𝑛
(1 + ⟨𝑎2⟩𝜌5) cos 𝜙5𝑒−𝜎52(1−𝜌5)
+2𝐴𝑚𝐴𝑛𝑄𝑚𝑄𝑛
𝑟𝑅,𝑚𝑟𝑅,𝑛
(1 + ⟨𝑎2⟩𝜌6) cos 𝜙6𝑒−𝜎62(1−𝜌6).
(3)
In Eq. (3), the variance and covariance terms, 𝜎1→62 and 𝜌1→6, are evaluated for the paths
involved in each of the six terms. (See Eqs. (12) and (17) in Daigle, 1979). The different angle
terms, 𝜙1→6, are given as
𝜙1 = 𝑘(𝑟𝐷,𝑚 − 𝑟𝑅,𝑚) − 𝛾𝑚
𝜙2 = 𝑘(𝑟𝐷,𝑛 − 𝑟𝑅,𝑛) − 𝛾𝑛
𝜙3 = 𝑘(𝑟𝐷,𝑚 − 𝑟𝐷,𝑛) + (𝜃𝑚 − 𝜃𝑛)
𝜙4 = 𝑘(𝑟𝑅,𝑚 − 𝑟𝐷,𝑛) + (𝜃𝑚 − 𝜃𝑛) + 𝛾𝑚
𝜙5 = 𝑘(𝑟𝐷,𝑚 − 𝑟𝑅,𝑛) + (𝜃𝑚 − 𝜃𝑛) − 𝛾𝑛
𝜙6 = 𝑘(𝑟𝑅,𝑚 − 𝑟𝑅,𝑛) + (𝜃𝑚 − 𝜃𝑛) + (𝛾𝑚 − 𝛾𝑛).
The first two lines in Eq. (3) represent the independent squared pressure (with the mean-
square effects of turbulence) of the mth and nth sources and their images in the absence of
intersource coupling, similar to Eq. (2). The remaining four lines represent the partially coherent
coupling between the mth and nth source/image combinations.
Note again that that this represents the summation of just two sources. Extension of this
partially coherent addition for 𝑀 sources means that that we represent the overall squared
pressure as the sum of the incoherent contributions in Eq. (2) and the cross-coupling terms (the
last four lines) in Eq. (3). If we define these cross coupling terms as
⟨𝑝2̅̅ ̅⟩cross
=2𝐴𝑚𝐴𝑛
𝑟𝐷,𝑚𝑟𝐷,𝑛
(1 + ⟨𝑎2⟩𝜌3) cos 𝜙3𝑒−𝜎32(1−𝜌3)
+2𝐴𝑚𝐴𝑛𝑄𝑚
𝑟𝑅,𝑚𝑟𝐷,𝑛
(1 + ⟨𝑎2⟩𝜌4) cos 𝜙4𝑒−𝜎42(1−𝜌4)
+2𝐴𝑚𝐴𝑛𝑄𝑛
𝑟𝐷,𝑚𝑟𝑅,𝑛
(1 + ⟨𝑎2⟩𝜌5) cos 𝜙5𝑒−𝜎52(1−𝜌5)
+2𝐴𝑚𝐴𝑛𝑄𝑚𝑄𝑛
𝑟𝑅,𝑚𝑟𝑅,𝑛
(1 + ⟨𝑎2⟩𝜌6) cos 𝜙6𝑒−𝜎62(1−𝜌6),
(4)
we can express the total summation between the coherent sources as
K. L. Gee et al. Modeling ground reflections for rocket noise
Proceedings of Meetings on Acoustics, Vol. 22, 040001 (2014) Page 5
Redistribution subject to ASA license or copyright; see http://acousticalsociety.org/content/terms. Download to IP: 128.187.207.57 On: Sat, 29 Nov 2014 15:41:03
⟨𝑝2̅̅ ̅⟩coh = ⟨𝑝2̅̅ ̅⟩inc + ∑ ∑ ⟨𝑝2̅̅ ̅⟩cross
𝑀
𝑛=𝑚+1
𝑀−1
𝑚=1
. (5)
3. Application to Rocket Noise
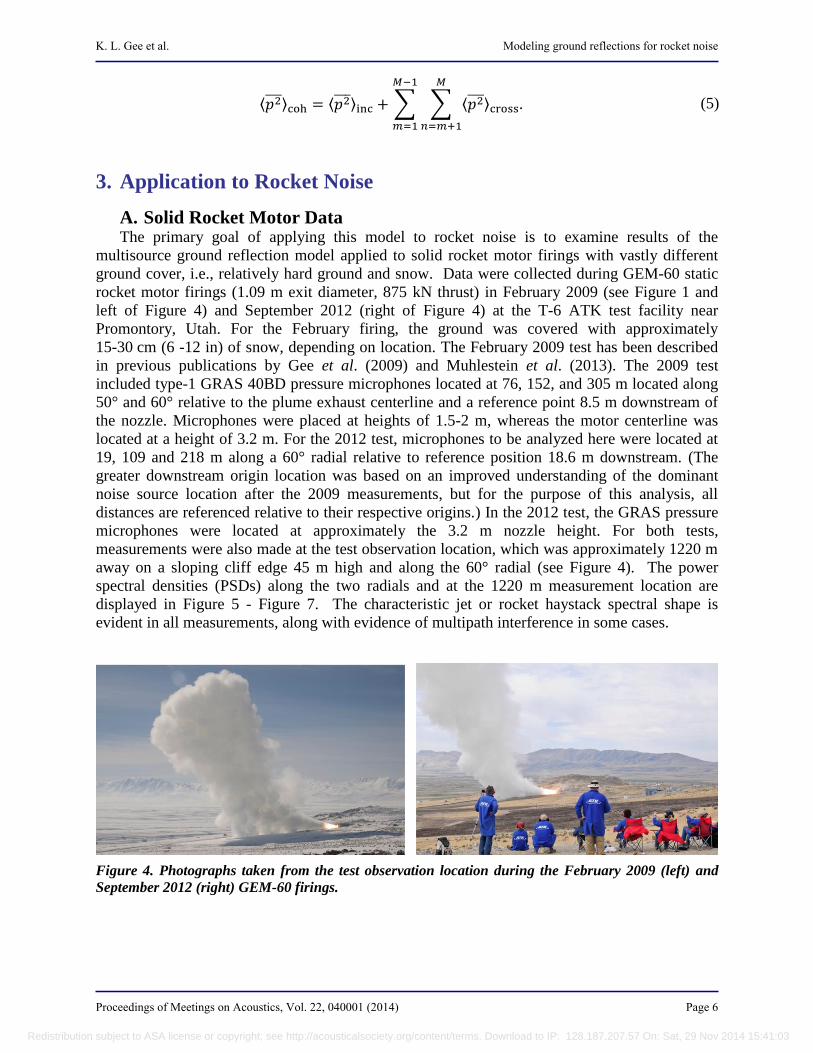
A. Solid Rocket Motor DataThe primary goal of applying this model to rocket noise is to examine results of the
multisource ground reflection model applied to solid rocket motor firings with vastly different
ground cover, i.e., relatively hard ground and snow. Data were collected during GEM-60 static
rocket motor firings (1.09 m exit diameter, 875 kN thrust) in February 2009 (see Figure 1 and
left of Figure 4) and September 2012 (right of Figure 4) at the T-6 ATK test facility near
Promontory, Utah. For the February firing, the ground was covered with approximately
15-30 cm (6 -12 in) of snow, depending on location. The February 2009 test has been described
in previous publications by Gee et al. (2009) and Muhlestein et al. (2013). The 2009 test
included type-1 GRAS 40BD pressure microphones located at 76, 152, and 305 m located along
50° and 60° relative to the plume exhaust centerline and a reference point 8.5 m downstream of
the nozzle. Microphones were placed at heights of 1.5-2 m, whereas the motor centerline was
located at a height of 3.2 m. For the 2012 test, microphones to be analyzed here were located at
19, 109 and 218 m along a 60° radial relative to reference position 18.6 m downstream. (The
greater downstream origin location was based on an improved understanding of the dominant
noise source location after the 2009 measurements, but for the purpose of this analysis, all
distances are referenced relative to their respective origins.) In the 2012 test, the GRAS pressure
microphones were located at approximately the 3.2 m nozzle height. For both tests,
measurements were also made at the test observation location, which was approximately 1220 m
away on a sloping cliff edge 45 m high and along the 60° radial (see Figure 4). The power
spectral densities (PSDs) along the two radials and at the 1220 m measurement location are
displayed in Figure 5 - Figure 7. The characteristic jet or rocket haystack spectral shape is
evident in all measurements, along with evidence of multipath interference in some cases.
Figure 4. Photographs taken from the test observation location during the February 2009 (left) and
September 2012 (right) GEM-60 firings.
K. L. Gee et al. Modeling ground reflections for rocket noise
Proceedings of Meetings on Acoustics, Vol. 22, 040001 (2014) Page 6
Redistribution subject to ASA license or copyright; see http://acousticalsociety.org/content/terms. Download to IP: 128.187.207.57 On: Sat, 29 Nov 2014 15:41:03

Figure 5. Power spectral densities along the 50° radial from the 2009 GEM-60 firing.
Figure 6. Power spectral densities along the 60° radial from the 2012 GEM-60 firing.
K. L. Gee et al. Modeling ground reflections for rocket noise
Proceedings of Meetings on Acoustics, Vol. 22, 040001 (2014) Page 7
Redistribution subject to ASA license or copyright; see http://acousticalsociety.org/content/terms. Download to IP: 128.187.207.57 On: Sat, 29 Nov 2014 15:41:03

Figure 7. Power spectral densities at the 1220 m measurement location along the 60° radial from both
motor firings.
B. Source Distribution Although a simple source-based model exists for rocket noise in the form of the prediction
methods outlined in NASA SP-7072 (Eldred, 1971), there is not an equivalent source model for
rocket noise incorporating realistic correlated source distributions. However, because only the
relative sound pressure level, ΔSPL, due to the ground is of interest in this paper, a
frequency-independent Rayleigh amplitude and slowly varying phase distributions were selected
for use. Other sources were tried, e.g., a 25-m line source with two periods of phase variation,
but results obtained from calculations as a function of range and height to the side of the
distribution maximum in Figure 8 are very similar to those shown subsequently. A more
rocket-like source distribution remains subject of future investigations, but the initial results
suggest the validity of the overall reasoning here.
Figure 8. Assumed frequency-independent amplitude and phase source distributions.
K. L. Gee et al. Modeling ground reflections for rocket noise
Proceedings of Meetings on Acoustics, Vol. 22, 040001 (2014) Page 8
Redistribution subject to ASA license or copyright; see http://acousticalsociety.org/content/terms. Download to IP: 128.187.207.57 On: Sat, 29 Nov 2014 15:41:03

C. Exercising of Source Model The source model has been used to investigate the effect of ground impedance and
atmospheric parameters on the relative sound pressure level, ΔSPL, for both the 2009 and 2012
measurement geometries. The ground impedance has been calculated for the 2009 test by
assuming 𝜎 = 30 cgs rayls and for the 2012 test by assuming 𝜎 = 3000 cgs rayls. These fall
within the range of parameters provided by Embleton et al. (1938) for snow (10 – 50 cgs rayls),
and between hard-packed sandy silt (800 – 2500 cgs rayls) and exposed, rain-packed earth (4000
– 8000 cgs rayls). Values for ⟨𝜇2⟩ and 𝐿, (the mean-square fluctuating index of refraction and the
effective turbulence length scale, respectively) were selected based on the work by Johnson et al.
(1987). On both days, the conditions were relatively sunny and the winds were light (<2 m/s) to
moderate (2-4 m/s). Consequently, ⟨𝜇2⟩ = 10−5 was used as the baseline fluctuating index of
refraction and 𝐿 was increased with height beginning from a value of 𝐿 = 1.1 m at a microphone
height of 1.5 m.
Figure 9 shows calculations for ΔSPL at the 305 m location for the 2009 test using the
assumed parameters provided in the caption. Four cases are shown: an incoherent (uncorrelated)
and a coherent (correlated) Rayleigh distribution from Figure 8, with and without atmospheric
turbulence. Note that because the range is much greater than the source extent, ΔSPL for coherent
and incoherent sources without turbulence collapse nearly exactly and are also essentially
identical to that of a monopole. A 6 dB boost in level at low frequencies caused by effectively
superposing the source and image is followed by a broad interference null resulting from the soft,
snow-covered ground. An additional high-frequency interference null is seen at approximately
10 kHz for the non-turbulent cases. It is the partial coherence between the source/image paths
and the sources (for the coherent case) when turbulence is present that completely removes the
presence of this null. Again, given that the distance from source to receiver is much greater than
the source dimensions, the incoherent source distribution with turbulence is essentially identical
to that of a monopole: The 6 dB boost at low frequencies due to coherent pressure addition gives
way to a 3 dB increase at high frequencies because the direct and reflected path signals are
essentially incoherent. The partially coherent interaction at mid frequencies effectively reduces
the depth of the interference null. In the case of the correlated Rayleigh distribution, it is the
partially coherent interaction between all the source/image combinations that reduces the depth
of the interference null from that of the incoherent source case.
Figure 10 shows the four source/turbulence combinations for the 2012 test at the 218 m
location for the estimated conditions. The significantly harder ground pushes the initial
interference null to much higher frequencies and then for the non-turbulent calculations, they
continue at nearly regular intervals. Again, the turbulence reduces the number of interference
nulls to one, and in the case of the correlated sources, eliminates it almost entirely. To investigate
the effects of independently changing parameters, two additional cases are shown in Figure 11
and Figure 12. In Figure 11, the impact of an essentially infinite ground impedance is tested.
Without turbulence, the nulls increase in frequency and in depth, but with turbulence, the depth
of the turbulent interference nulls is reduced. In Figure 12, the turbulent fluctuating index of
refraction is increased by an order of magnitude relative to Figure 10, again reducing the depth
of both of the turbulence-included ΔSPL curves. However, the change in ΔSPL for the coherent-
source case is less significant than the incoherent-source case. These examples help to illustrate
some of the changes expected in the model for different parameter choices for the same
geometry.
K. L. Gee et al. Modeling ground reflections for rocket noise
Proceedings of Meetings on Acoustics, Vol. 22, 040001 (2014) Page 9
Redistribution subject to ASA license or copyright; see http://acousticalsociety.org/content/terms. Download to IP: 128.187.207.57 On: Sat, 29 Nov 2014 15:41:03

Figure 9. Relative sound pressure level for 2009 GEM-60 test at 305 m, with a 1.5 m microphone
height, 𝝈𝒆𝒇𝒇 = 𝟑𝟎 cgs rayls, 𝑳 = 𝟏. 𝟏 m, and ⟨𝝁𝟐⟩ = 𝟏 × 𝟏𝟎−𝟓.
Figure 10. Relative sound pressure level for 2012 test at 218 m, with a 3.2 m microphone height,
𝝈𝒆𝒇𝒇 = 𝟑𝟎𝟎𝟎 cgs rayls, 𝑳 = 𝟐. 𝟓 m, and ⟨𝝁𝟐⟩ = 𝟏 × 𝟏𝟎−𝟓.
K. L. Gee et al. Modeling ground reflections for rocket noise
Proceedings of Meetings on Acoustics, Vol. 22, 040001 (2014) Page 10
Redistribution subject to ASA license or copyright; see http://acousticalsociety.org/content/terms. Download to IP: 128.187.207.57 On: Sat, 29 Nov 2014 15:41:03
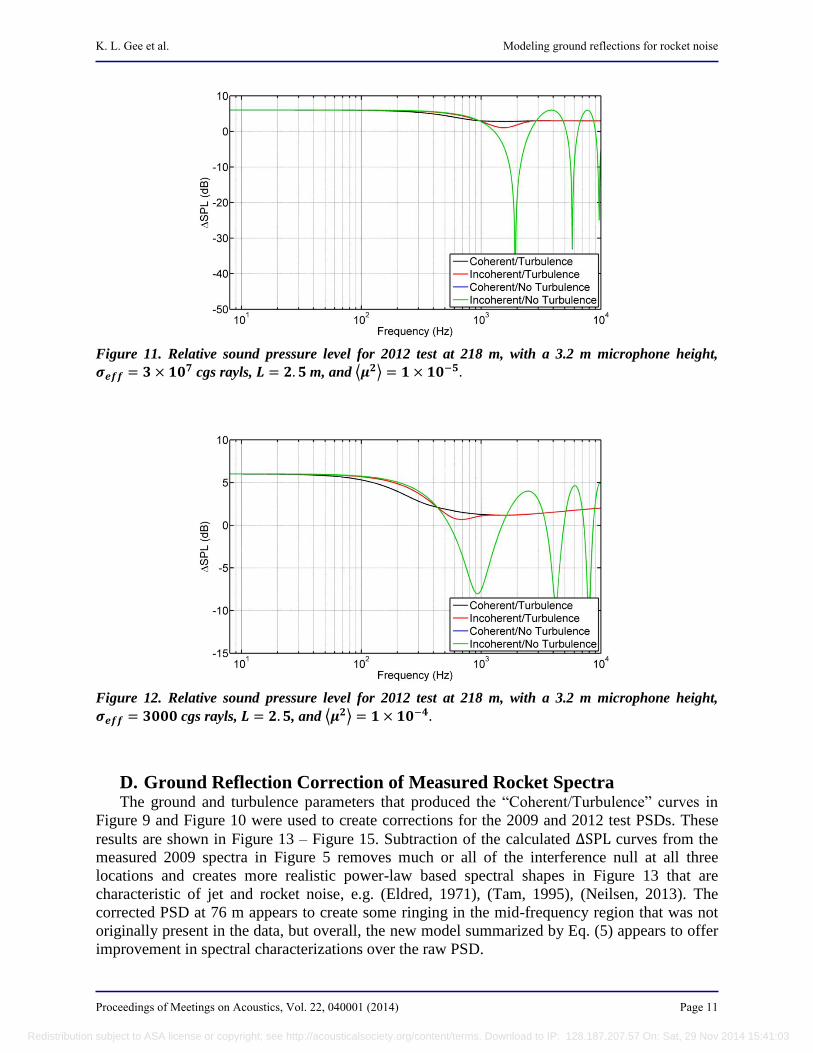
Figure 11. Relative sound pressure level for 2012 test at 218 m, with a 3.2 m microphone height,
𝝈𝒆𝒇𝒇 = 𝟑 × 𝟏𝟎𝟕 cgs rayls, 𝑳 = 𝟐. 𝟓 m, and ⟨𝝁𝟐⟩ = 𝟏 × 𝟏𝟎−𝟓.
Figure 12. Relative sound pressure level for 2012 test at 218 m, with a 3.2 m microphone height,
𝝈𝒆𝒇𝒇 = 𝟑𝟎𝟎𝟎 cgs rayls, 𝑳 = 𝟐. 𝟓, and ⟨𝝁𝟐⟩ = 𝟏 × 𝟏𝟎−𝟒.
D. Ground Reflection Correction of Measured Rocket Spectra The ground and turbulence parameters that produced the “Coherent/Turbulence” curves in
Figure 9 and Figure 10 were used to create corrections for the 2009 and 2012 test PSDs. These
results are shown in Figure 13 – Figure 15. Subtraction of the calculated ΔSPL curves from the
measured 2009 spectra in Figure 5 removes much or all of the interference null at all three
locations and creates more realistic power-law based spectral shapes in Figure 13 that are
characteristic of jet and rocket noise, e.g. (Eldred, 1971), (Tam, 1995), (Neilsen, 2013). The
corrected PSD at 76 m appears to create some ringing in the mid-frequency region that was not
originally present in the data, but overall, the new model summarized by Eq. (5) appears to offer
improvement in spectral characterizations over the raw PSD.
K. L. Gee et al. Modeling ground reflections for rocket noise
Proceedings of Meetings on Acoustics, Vol. 22, 040001 (2014) Page 11
Redistribution subject to ASA license or copyright; see http://acousticalsociety.org/content/terms. Download to IP: 128.187.207.57 On: Sat, 29 Nov 2014 15:41:03

For the 2012 test, correction of the 19 m PSD (see Figure 6) is postponed until the next
section. For the 2012 data at 109 and 218 m, there was little evidence of ground interference
effects in Figure 6. Consequently, the ΔSPL corrections must mimic this behavior, as was shown
in Figure 10. The corrected PSDs for these two distances are shown, along with the original
PSDs, in Figure 14. The correction serves mostly to reduce the amount of low-frequency energy
while leaving the spectral levels above 400 Hz relatively untouched. This results in an altered
spectral shape, particularly at 109 m. The physicality of either result cannot be verified at this
stage, but it is encouraging that both the measurement and the coherent-source, turbulent ground
reflection model indicate the absence of interference nulls.
Figure 13. Measured (see Figure 5) and ground-corrected spectra (dashed lines) from the 2009 GEM-
60 firing.
Figure 14. Measured (see Figure 6) and ground-corrected spectra (dashed lines) from the 2012 GEM-
60 firing at 109 and 218 m.
At 1220 m, the two spectra shown previously in Figure 7 have now been corrected using the
same turbulence parameters, 𝐿 = 7.0 m and ⟨𝜇2⟩ = 1 × 10⁻⁵, but with the respective flow
resistivities for the soft and hard ground. Although the Johnson et al. results suggest that a
K. L. Gee et al. Modeling ground reflections for rocket noise
Proceedings of Meetings on Acoustics, Vol. 22, 040001 (2014) Page 12
Redistribution subject to ASA license or copyright; see http://acousticalsociety.org/content/terms. Download to IP: 128.187.207.57 On: Sat, 29 Nov 2014 15:41:03

greater turbulence length scale be used for a microphone height of 45 m, the somewhat arbitrary
choice of 𝐿 = 7.0 m is based on the fact that the terrain slopes upwards toward cliff near the
measurement point and therefore the microphone is not actually located that far from the ground.
Values for 𝐿 = 5.0 to 𝐿 = 10.0 gave similar results for ΔSPL, so the choice of 𝐿 = 7.0 seems
relatively robust. The measured PSDs in Figure 15 showed the greatest difference between the
two spectra below 100 Hz. By correcting them using their respective ground impedances and the
same turbulence parameters, the two spectra now nearly overlay each other below 100 Hz where
the spectral differences were the largest. The fact that two spectra measured more than a
kilometer from two different firing made at two very different times of year overlay each other
with such consistency is remarkable in and of itself!
Figure 15. Measured (see Figure 7) and ground-corrected spectra (dashed lines) from the 2009 and
2012 GEM-60 firing at 1220 m. In both cases, 𝑳 = 𝟕. 𝟎 m and ⟨𝝁𝟐⟩ = 𝟏 × 𝟏𝟎−𝟓 was used.
E. Accounting for Near-Source Atmospheric Turbulence We have held off discussing the 19 m PSD from the 2012 test until this point because
attempts to apply the coherent-source ground reflection model in Eq. (5) with the same
turbulence parameters as used at 109 and 218 m reveals that the measured interference null is far
shallower than what the model would predict; i.e., the propagation paths are too short to account
for such a shallow interference null. This shallow interference null could be caused by the rocket
being a volume rather than a line source and this concept needs to be investigated. On the other
hand, the rocket plume entrains air and also produces nonacoustic temperature variations in the
near field (Giraud, 2010). Given these physical realities, it may be possible to model the
shallower measured interference null using an increased fluctuating index of refraction and or
turbulence length scale, while allowing at the outset that ⟨𝜇2⟩ and 𝐿 become empirical constants
in that that measurements of these parameters near a rocket do not exist. In this light, only
variations in ⟨𝜇2⟩ are considered at this time. Figure 16 - Figure 19 contain the measured and
corrected PSDs for ⟨𝜇2⟩ ranging four orders of magnitude – between ⟨𝜇2⟩ = 1 × 10⁻⁵ to ⟨𝜇2⟩ =1 × 10⁻². Figure 16 and Figure 17 show that ⟨𝜇2⟩ is too low in that subtraction of the ΔSPL from
the measure PSD results in sharp spectral peaks. On the other hand, Figure 19 shows only a
smooth reduction in spectral levels, meaning that no interference null was predicted (like at 109
K. L. Gee et al. Modeling ground reflections for rocket noise
Proceedings of Meetings on Acoustics, Vol. 22, 040001 (2014) Page 13
Redistribution subject to ASA license or copyright; see http://acousticalsociety.org/content/terms. Download to IP: 128.187.207.57 On: Sat, 29 Nov 2014 15:41:03
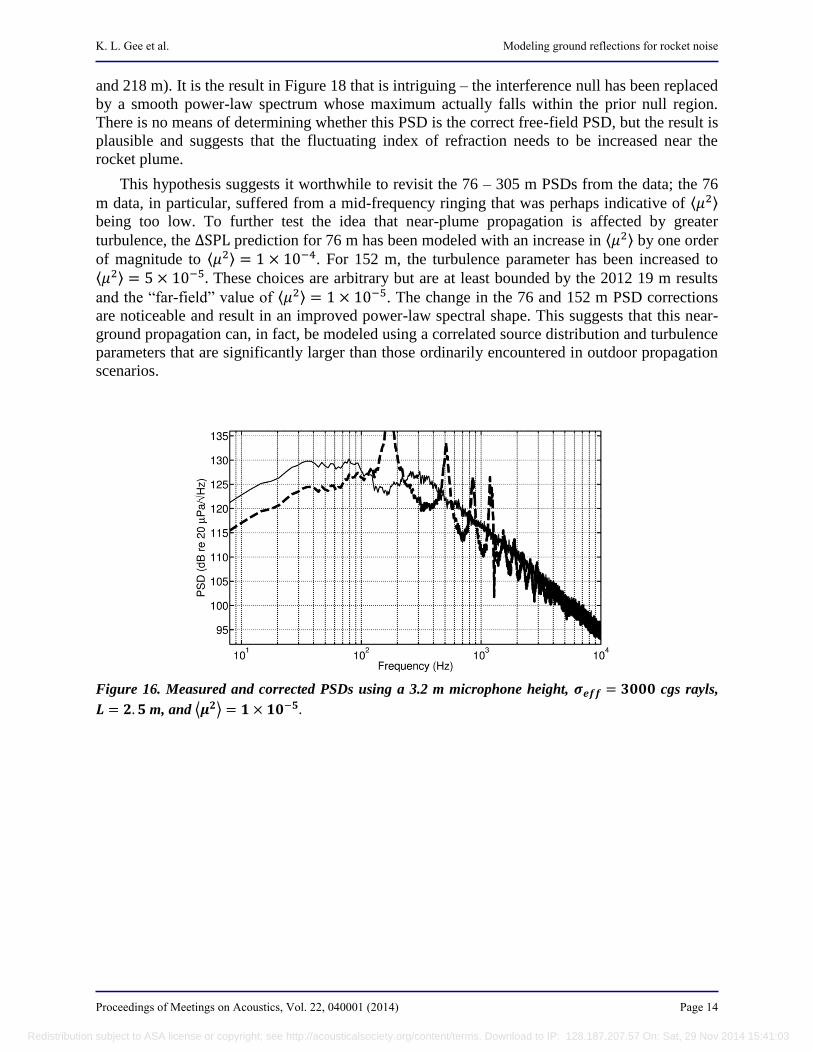
and 218 m). It is the result in Figure 18 that is intriguing – the interference null has been replaced
by a smooth power-law spectrum whose maximum actually falls within the prior null region.
There is no means of determining whether this PSD is the correct free-field PSD, but the result is
plausible and suggests that the fluctuating index of refraction needs to be increased near the
rocket plume.
This hypothesis suggests it worthwhile to revisit the 76 – 305 m PSDs from the data; the 76
m data, in particular, suffered from a mid-frequency ringing that was perhaps indicative of ⟨𝜇2⟩being too low. To further test the idea that near-plume propagation is affected by greater
turbulence, the ΔSPL prediction for 76 m has been modeled with an increase in ⟨𝜇2⟩ by one order
of magnitude to ⟨𝜇2⟩ = 1 × 10⁻⁴. For 152 m, the turbulence parameter has been increased to
⟨𝜇2⟩ = 5 × 10⁻⁵. These choices are arbitrary but are at least bounded by the 2012 19 m results
and the “far-field” value of ⟨𝜇2⟩ = 1 × 10⁻⁵. The change in the 76 and 152 m PSD corrections
are noticeable and result in an improved power-law spectral shape. This suggests that this near-
ground propagation can, in fact, be modeled using a correlated source distribution and turbulence
parameters that are significantly larger than those ordinarily encountered in outdoor propagation
scenarios.
Figure 16. Measured and corrected PSDs using a 3.2 m microphone height, 𝝈𝒆𝒇𝒇 = 𝟑𝟎𝟎𝟎 cgs rayls,
𝑳 = 𝟐. 𝟓 m, and ⟨𝝁𝟐⟩ = 𝟏 × 𝟏𝟎−𝟓.
K. L. Gee et al. Modeling ground reflections for rocket noise
Proceedings of Meetings on Acoustics, Vol. 22, 040001 (2014) Page 14
Redistribution subject to ASA license or copyright; see http://acousticalsociety.org/content/terms. Download to IP: 128.187.207.57 On: Sat, 29 Nov 2014 15:41:03

Figure 17. Measured and corrected PSDs using a 3.2 m microphone height, 𝝈𝒆𝒇𝒇 = 𝟑𝟎𝟎𝟎 cgs rayls,
𝑳 = 𝟐. 𝟓 m, and ⟨𝝁𝟐⟩ = 𝟏 × 𝟏𝟎−𝟒.
Figure 18. Measured and corrected PSDs using a 3.2 m microphone height, 𝝈𝒆𝒇𝒇 = 𝟑𝟎𝟎𝟎 cgs rayls,
𝑳 = 𝟐. 𝟓 m, and ⟨𝝁𝟐⟩ = 𝟏 × 𝟏𝟎−𝟑.
K. L. Gee et al. Modeling ground reflections for rocket noise
Proceedings of Meetings on Acoustics, Vol. 22, 040001 (2014) Page 15
Redistribution subject to ASA license or copyright; see http://acousticalsociety.org/content/terms. Download to IP: 128.187.207.57 On: Sat, 29 Nov 2014 15:41:03

Figure 19. Measured and corrected PSDs using a 3.2 m microphone height, 𝝈𝒆𝒇𝒇 = 𝟑𝟎𝟎𝟎 cgs rayls,
𝑳 = 𝟐. 𝟓 m, and ⟨𝝁𝟐⟩ = 𝟏 × 𝟏𝟎−𝟐.
Figure 20. Figure 13, but with increased fluctuating index of refraction at 76 and 152 m: ⟨𝝁𝟐⟩ =
𝟏 × 𝟏𝟎−𝟒 at 76 m and ⟨𝝁𝟐⟩ = 𝟓 × 𝟏𝟎−𝟓 at 152 m. The 305 m index remains at ⟨𝝁𝟐⟩ = 𝟏 × 𝟏𝟎−𝟓.
4. ConclusionThe relative sound pressure level due to turbulent-atmosphere, finite-impedance ground
reflections for extended distributions of correlated simple sources has been derived. The
modeling has made it possible to apply corrections to measured rocket noise spectra. The fact
that meaningful spectral corrections are obtained far from the plume using effective flow
resistivities, turbulence length scales, and fluctuating indices of refraction based on values found
in the literature inspires confidence in the plausibility of this modeling approach. However, the
fact that improved near-plume spectral corrections were obtained by increasing the effective
turbulence does not necessarily negate the physicality of the modeling approach; it may be, in
fact, that the near-plume entrained flow and temperature fluctuations can be represented by much
greater turbulence parameters.
K. L. Gee et al. Modeling ground reflections for rocket noise
Proceedings of Meetings on Acoustics, Vol. 22, 040001 (2014) Page 16
Redistribution subject to ASA license or copyright; see http://acousticalsociety.org/content/terms. Download to IP: 128.187.207.57 On: Sat, 29 Nov 2014 15:41:03

In that vein, there is much to be done to further investigate nuances of the modeling, e.g., the
assumptions and approximations that Daigle uses employs to derive and solve Eq. (1). We have
identified cases for which the Daigle model returns a negative squared pressure, something not
previously discussed in the literature, and we need to understand if this is a limit to the
underlying theory or the approximations made in producing a solution. Furthermore, a more
realistic source model could be used and a sensitivity analysis to the various input parameters
performed. Finally, the entire process needs to be rigorously experimentally validated to ensure
the spectral corrections that, at present, appear plausible, do, in fact, yield free-field spectra.
Acknowledgments We are grateful for the support of Alexandria Salton of Blue Ridge Research and Consulting,
LLC and NASA Marshall Space Flight Center, in particular R. Jeremy Kenny and Janice
Houston. We are also indebted to Kevin Rees and Roy Norris at ATK Space Systems Test
Services.
References (Daigle, 1978) G. A. Daigle, J. E. Piercy, and T. F. W. Embleton, ‘‘Effects of atmospheric turbulence on the
interference of sound waves near a hard boundary,’’ J. Acoust. Soc. Am. 64, 622–630 (1978).
(Daigle, 1979) G. A. Daigle, “Effects of atmospheric turbulence on the interference of sound waves above a
finite impedance boundary,” J. Acoust. Soc. Am. 65, 45-49 (1979).
(Daigle, 1983) G. A. Daigle, J. E. Piercy, and T. F. W. Embleton, ‘‘Line-of-sight propagation through
atmospheric turbulence near the ground,’’ J. Acoust. Soc. Am. 74, 1505–1513 (1983).
(Delany, 1970) M. E. Delany and E. N. Bazley, “Acoustical properties of fibrous absorbent materials,” Appl.
Acoust. 3, 105-116 (1970).
(Eldred, 1971) K.M. Eldred, “Acoustic Loads Generated by the Propulsion System”, NASA SP-8072, (1971).
(Embleton, 1983) T. F. W. Embleton, J. E. Piercy, and G. A. Daigle, “Effective flow resistivity of ground
surfaces determined by acoustical measurements,” J. Acoust. Soc. Am.74, 1239 – 1244 (1983).
(Gee, 2009) K. L. Gee, J. H. Giraud, J. D. Blotter, and S. D. Sommerfeldt, “Energy-based acoustical
measurements of rocket noise,” AIAA paper 2009-3165, May 2009.
(Giraud, 2010) J. H. Giraud, K. L. Gee, and J. E. Ellsworth, “Acoustic temperature measurement in a rocket
noise field,” J. Acoust. Soc. Am. 127, EL179-EL184 (2010).
(Johnson, 1987) M. A. Johnson, R. Raspet, and M. T. Bobak, “A turbulence model for sound propagation from
an elevated source above level ground,” J. Acoust. Soc. Am. 81, 638-646 (1987).
(Morgan, 2012) J. Morgan, T. B. Neilsen, K. L. Gee, A. T. Wall, and M. M. James, “Simple-source model of
high-power jet aircraft noise,” Noise Control Eng. J. 60, 435-449 (2012).
(Muhlestein, 2013) M. B. Muhlestein, K. L. Gee, T. B. Neilsen, and D. C. Thomas, “Prediction of nonlinear
noise propagation from a solid rocket motor,” Proc. Mtgs. Acoust. 18, 040006 (2013).
(Neilsen, 2013) T. B. Neilsen, K. L. Gee, A. T. Wall, and M. M. James, “Similarity spectra analysis of high-
performance jet aircraft noise,” J. Acoust. Soc. Am. 133, 2116 – 2125 (2013).
(Salomons, 2001) E. M. Salomons, V. E. Ostashev, S. F. Clifford, and R. J. Lataitis, “Sound propagation in a
turbulent atmosphere near the ground: An approach based on the spectral representation of refractive-index
fluctuations,” J. Acoust. Soc. Am. 109, 1881 – 1893 (2001).
(Tam, 1995) C. K. W. Tam, “Supersonic jet noise,” Annu. Rev. Fluid Mech. 27, 17-43 (1995).
K. L. Gee et al. Modeling ground reflections for rocket noise
Proceedings of Meetings on Acoustics, Vol. 22, 040001 (2014) Page 17
Redistribution subject to ASA license or copyright; see http://acousticalsociety.org/content/terms. Download to IP: 128.187.207.57 On: Sat, 29 Nov 2014 15:41:03