II. Answered Prayer Involves A III. Answered Prayer Involves A

Teacher Support Material(including Answers)

Acknowledgments
Learning Media and the Ministry of Education would like to thank Robyn Masanga (mathematics notes and answers), Mike Rogers (technology notes), and Christina Smith (ELL support) for their contributions to the teacher support material and Rob Julian for reviewing the answers and notes.
The photographs of the students on the cover are by Mark Coote and Adrian Heke. The photograph of the sheep is copyright © Amy K Casillas/Shutterstock; the photograph of the swimmer is copyright © Paul Sazonov/Shutterstock; the African frieze and the images of the bicycle and the rider are copyright © Bunkhouse graphic design; the abstract background image is copyright © ILeysen/Shutterstock.
All other illustrations and graphs are by Bunkhouse graphic design.The text and these images are copyright © Crown 2012.
Editorial team: Susan Slaughter, Kate Potter, June Hannah, Ian ReidDesigner: Bunkhouse graphic design.
Published 2012 for the Ministry of Education byLearning Media Limited, Box 3293, Wellington, New Zealand.www.learningmedia.co.nz
Copyright © Crown 2012All rights reserved. Enquiries should be made to the publisher.
Note: Teachers may copy these notes for educational purposes.
The Teacher Support Material (including Answers) is available online at www.nzmaths.co.nz/node/1992
Dewey number 510ISBN 978 0 7903 3810 1Item number 33810PDF ISBN 978 0 7903 3809 5Students’ book: item number 33807
Ministry of Education Customer Services: freephone 0800 660 662; freefax 0800 660 663; email: [email protected]; online: www.thechair.minedu.govt.nzPlease quote item number.
Teacher Support Material(including Answers)
ContentsIntroduction 2
Overview 3
Introduction to Technology-related Contexts 4
Support for English Language Learners 4
Support Material and Answers 6
Copymasters 41
2
Introduction
The books in the Figure It Out series are issued by the Ministry of Education to provide support material for use in New Zealand classrooms. The achievement objectives for mathematics and statistics and the key competencies referred to in this Teacher Support Material (including Answers) are from The New Zealand Curriculum.
Student books
The activities in the Figure It Out student books are written for New Zealand students and are set in meaningful contexts, including real-life and imaginary scenarios. The contexts in the level 3+–4+ Technology Transformations book refl ect the ethnic and cultural diversity and the life experiences that are meaningful to students in years 6–8. However, you should use your judgment as to whether to use the student book with older or younger students who are also working at these levels.
Figure It Out activities can be used as the focus for teacher-led lessons, for students working in groups, or for independent activities. You can also use the activities to fi ll knowledge gaps (hot spots), to reinforce knowledge that has just been taught, to help students develop mental strategies, or to provide further opportunities for students moving between strategy stages of the Number Framework.
Teacher Support Material (including Answers)
In this new format, the answers are placed with the support material that they relate to. The answers are directed to the students and include full solutions and explanatory notes. Students can use these for self-marking, or you can use them for teacher-directed marking. The teacher support material for each activity, game, or investigation includes comments on the mathematics and the technology-related context, as well as suggestions on teaching approaches. The Teacher Support Material (including Answers) for TechnologyTransformations can also be downloaded from the nzmaths website at www.nzmaths.co.nz/node/1992
Using Figure It Out in the classroom
Where applicable, each page of the student book starts with a list of equipment that the students will need in order to do the activities. Encourage the students to be responsible for collecting the equipment they need and returning it at the end of the session.
Many of the activities suggest different ways of recording the solution to the problem. Encourage your students to write down as much as they can about how they did investigations or found solutions, including drawing diagrams. Discussion and oral presentation of answers is encouraged in many activities, and you may wish to ask the students to do this even where the suggested instruction is to write down the answer.
Students will have various ways of solving problems or presenting the process they have used and the solution. You should acknowledge successful ways of solving questions or problems, and where more effective or effi cient processes can be used, encourage the students to consider other ways of solving a particular problem.

Overview of Technology Transformations, Levels 3+– 4+
Talking Technology
Colour-coding
Nifty Networks
Good Sport?
Faceprints
Working with Wool
Function Confusion
Where on Earth?
Going Global
Transport Trends
Pedal Power
Page in support material
Page in students’ book
FocusTitle
1–3
4–5
6–7
8–9
10–11
12–13
14
15–17
18–19
20
21–24
Teacher Support Material
Fi g u r e I t O utFi g u r e I t O ut
h ate(including Answers)
hnolTechnology
S t MTransformationsTransformations
TechnologyTransformations
3
6
11
14
17
20
22
24
27
31
34
37
Interpreting statistics
Using place value and limits of accuracy
Exploring networks and making conjectures
Interpreting statistics
Working with proportions
Making estimates
Finding and applying percentages
Exploring latitude and longitude
Describing locations using co-ordinates
Using statistics and percentages
Exploring probability

Introduction to the Technology-related Contexts
The contexts surrounding these mathematical activities are based on technology – its practice, body of knowledge, and relevance to society. As they engage with the activities, students may be inspired to further investigate a particular technological principle or issue.
While further investigation is encouraged, it should be remembered that the technology learning area has its own set of objectives. So before using any of these activities as part of your technology programme, refer to the technology learning area of The New Zealand Curriculum. In your technology programme, you need to give your students opportunities to engage in effective technological practice and to enhance their technological literacy.
For information on how to construct effective and exciting units of work, Techlink (www.techlink.org.nz) is an excellent resource. It provides in-depth analysis of what technology education is all about, along with case studies, examples of student work, and teachers’ inspiration.
Support for English Language Learners
Many students, including English language learners, need support in meeting the language demands of the curriculum. You can help them by identifying the language demands of particular activities before you begin teaching and by scaffolding tasks so that all students can participate fully.
As you and your students work with the activities, you can support them by providing:
• opportunities to notice language in context
• explanations, illustrations, and examples of language
• opportunities to encounter the same information many times and in many different forms (to hear it, see it, touch it, read it, say it, write it, draw it)
• opportunities to encounter language (through listening and reading) as well as to use it (in writing and speaking) in the context of the activities
• language-focused activities that are meaningful and contextualised.
After focusing on language in the given context, you will want to keep revisiting the same language in other contexts.
You may need to provide English language learners with any culturally specifi c prior knowledge needed for the activities. You will also want to ensure that you fi nd out about and make links to their prior knowledge, including cultural and linguistic knowledge.
All of the activities make multiple language demands. This support material includes strategies for supporting learners with selected English language demands for some mathematics activities. You can adapt and apply these strategies to support students with other language needs that you identify.
4

5
In this support material, the activities with support for English language learners are:
• Pages 1–3: Talking Technology: Supporting students with the language needed to describe data
• Pages 15–17: Where on Earth?: Supporting students with subject-specifi c vocabulary
• Page 20: Transport Trends: Supporting students with the language for making comparisons.
Some other useful resources are:
The English Language Learning Progressions (This was sent to all schools in 2008. PDFs of the four booklets are available online at http://esolonline.tki.org.nz/ESOL-Online/Student-needs/The-English-Language-Learning-Progressions)
Supporting English Language Learning in Primary Schools: A Guide for Teachers of Years 5 and 6 (SELLIPS). For information about ordering a PDF of this booklet, go to http://esolonline.tki.org.nz/ESOL-Online/Teacher-needs/Reviewed-resources/Supporting-English-Language-Learning-in-Primary-School-SELLIPS
Making Language and Learning Work 3: Integrating Language and Learning in Years 5 to 8 (DVD). For more information, see ESOL Online at http://esolonline.tki.org.nz/ESOL-Online/Teacher-needs/Reviewed-resources/Making-language-and-learning-work-DVDs
The Focus on English resource is designed to help teachers provide language support for mathematics, science, and social studies in years 7–10. It is available online at http://esolonline.tki.org.nz/ESOL-Online/Teacher-needs/Reviewed-resources/Cross-curricular/Focus-on-English
Principles of effective teaching and learning for English language learners, available online at http://esolonline.tki.org.nz/ESOL-Online/Teacher-needs/Pedagogy/Principles-of-effective-teaching-and-learning-for-English-language-learners
ESOL Online at www.esolonline.tki.org.nz
6
Pages 1–3: Talking Technology
Achievement Objectives• Number strategies and knowledge: Find fractions, decimals, and percentages of amounts expressed as whole numbers, simple fractions, and decimals (Number and Algebra, level 4)
• Statistical investigation: Plan and conduct investigations using the statistical enquiry cycle … (Statistics, level 4)
Mathematics StandardsThe approaches and thinking that students demonstrate as they engage with these tasks and problems can provide evidence in relation to the mathematics standards. For example:
• interpret results in context, identifying factors that produce uncertainty (Statistics, year 8).
Developing students’ mathematical understandingsStatistical thinking involves the exploration and use of patterns and relationships in data. There are four key processes:
• describing data – connecting the information in a table or graph with a real-life context
• organising and reducing data – ordering, grouping, and summarising data
• representing data – creating visual representations
• analysing and interpreting data – recognising patterns and trends and using them to make inferences and predictions.
In these activities, the students explore statistics relating to the use of cellphones, particularly their use in developing countries.
Exploring the technology-related contextmHealth is the provision of health-related services via mobile communications. In developing countries, mHealth initiatives seek to address obstacles related to large populations, high incidences of disease, shortages of health workers, limited money for healthcare services, and a lack of infrastructure for remote patients.
Some benefi ts of mHealth initiatives include:
• increased access to healthcare information, especially for remote communities
• improved ability to diagnose and track diseases
• more effective communication of public health information
• access to education and training for health workers.
Vocabulary alertaccessible, trade, affects, telecommunications, fi xed phone lines, broadband accounts, developing countries, functions, transfer (money), annual, rural
Teacher Support Material(including Answers)

7
Answers
Activity One
1. a. Answers will vary. Examples include:
• The proportion of people with cellphone accounts has increased from about 12 per 100 people to 68 per 100 (5 times) over the 10 years from 2000–2009.
• Cellphone use is increasing much faster than the other information and communication technologies shown on the graph.
• The proportion of people with fi xed line accounts has been declining since 2005. (This could be because people don’t need a fi xed phone line if they have a cellphone.)
b. Answers will vary. If the trends continued, there would be about 78 cellphone accounts and 17 fi xed phone lines for every 100 people.
2. a. The number of cellphones is similar to what the line on the graph would suggest.
b. The trend may continue for a while but it is unlikely that there will be more cellphone accounts than people in the world. It is likely that the number of fi xed line accounts will continue to decline slowly.
3. Discussion will vary. Globally, Internet usage nearly doubled between 2006 and 2011. The biggest increase has been in developing countries, particularly China and India. In 2006, less than half of the world’s Internet users lived in developing countries. In 2011, nearly two-thirds of Internet users lived in developing countries.
Alarm clock
Picture messaging
Voicemail
Internet access
Calculator
Text messaging
Voice call
68%
36%
34%
52%
82%
98%
88%
Here is a graph of data from the Ugandan survey. Your data may be quite different.
Cellphone Functions Used by Ugandan Students
alarm clock
10
20
30
40
50
60
70
80
90
100
picture messaging
voicemail Internetaccess
calculator textmessaging
voicecall
2. a. About 5.2 million (43.7 x 0.12 = 5.244)
b. About 22 million (43.7 ÷ 2 = 21.85)
3. a. $40 ($5 200 ÷ 130)
b. $400 ($40 is one-tenth, $40 x 10 = $400)
4. Discussion will vary. People in developing countries have much greater access to cellphones than to computers or health-related resources, such as hospital beds.
5. Investigation
Activity Two
1. Results will vary. The easiest way to compare survey results from two different groups is to convert the values to percentages. Here are the Ugandan survey results in percentages:
Per
cen
t w
ho
use
th
e fu
nct
ion
Function

8
Mathematics and Statistics Notes
Statistical literacy is the ability to read and interpret data. Statistics provides the means to organise large amounts of data in such a way that it communicates meaning. However, by presenting statistical information in a simplifi ed form, it is also possible to manipulate or misinterpret it.
Statistical information is seen as adding weight to a discussion because it is thought to be scientifi c. People often accept statistics without asking how data has been gathered or whether crucial information has been left out. Students need to be able to intelligently evaluate and interpret the statistical information they will encounter in everyday life.
In these activities, students encounter three types of data display: a line graph, pie graphs, and a bar graph. Discuss with your students how each type of graph relates to the data it represents. Line graphs are often used to show changes over time, pie graphs are useful for showing proportions, and bar graphs are used to make comparisons between categories.
Students use the graphs to explore statistics related to global ICT trends and, in particular, the rapid growth of cellphone and Internet use. Some of the stories behind the statistics relate to changes taking place in developing countries. Hans Rosling’s dynamic use of statistical tools to communicate trends in developing countries (available on TED talks at www.ted.com) shows how exciting statistics can be.
Activity One
Analysing and interpreting data involves recognising patterns and trends and using these to make inferences or predictions.
You may need to support your students as they work with large numbers (billions).
The graph on page 1 of the student book shows the number of ICT users per 100 people in the world. This is different from a percentage because some people have more than one cellphone. For example, in 2010, in Taiwan, the number of cellphones per 100 people in the population was 106.
Students may assume that population growth is responsible for the increased number of cellphone accounts – if there are more people on the planet, there are likely to be more cellphone users. However, this not the primary reason for the increase. The graph shows the number of cellphone accounts relative to the world population. Imagine that the world population is 100 and that 40 of these people have cellphone accounts. If the world population doubles (200) but the proportion of people with cellphone accounts stays the same (80 out of 200), the graph line would be fl at. Instead, the graph shows a much greater proportion of the world’s population now use cellphones.
The pie graphs in the student book are based on information from the ITU World Telecommunication ICT indicators database (see www.itu.int/ITU-D/ict/facts/2011/material/ICTFactsFigures2011.pdf) Students may be surprised to learn that in 2011, an estimated 65 percent of the world’s population were not Internet users. Discuss what proportion of the “Not using Internet” sector is likely to be people living in developing countries. (In 2011, approximately 80 percent of the world’s population lived in developing countries. This means that about nine-tenths of the “Not using Internet” sector represents people in developing countries.)
Interpreting visual representations such as graphs develops the key competency using language, symbols, and texts.
Activity Two
The purpose of the survey is to gather data that can be used to compare New Zealand student cellphone use with Ugandan student use.
Converting fractions to percentages makes it easy to compare them. This is particularly true of fractions with different denominators. For example, it is easier to compare 56% with 67% than to compare with . 14
2523

9
There were 50 students in the Ugandan survey, so each fraction has a denominator of 50. Students can work out the percentages by doubling. For example, = = 68%. Remind the students that a fraction and its percentage are in fact equivalent fractions; the percentage sign is simply a notation for hundredths.
Students who struggle with the concept of equivalent fractions can make a visual representation of each fraction. For example, ask the students to draw a 5 x 10 rectangle on squared paper and to colour in 34 squares. Splitting each square in two will show that is equivalent to (68%).
Students could use a bar graph or a pictogram to display the data. A pie graph is not suitable. Pie graphs are often associated with percentages because they display proportions within a whole. However, in this case, different functions are not mutually exclusive; many of the survey participants used their cellphones for more than one function. This explains why the percentages do not add up to 100.
3450
3450
68100
68100
Support for English Language Learners
Supporting students with the language needed to describe data
Some students may need support with understanding and using language to describe statistical data.
Describing data can involve a number of language areas. For example:
• verbs describing trends (increase, decline, fl uctuate, level off)
• tenses that signal time relationships (increased, is increasing, has been declining)
• prepositional phrases that signal time relationships (over the 10 years from, since 2005)
• prepositions and adverbs that modify numbers (from about … to …, approximately)
• language for making comparisons (much faster than, more … than, far greater than)
• long and complex noun phrases (the number of cellphone accounts, the cost of catching a bus from a rural area to a hospital, using cellphones to provide health services and information).
Note that discussing trends shown in a line graph often involves describing movement and time relationships. Verbs describing movement are often modifi ed by adverbs (rose sharply, declined rapidly, fell slightly), and nouns and adjectives are also often used (a sharp rise, a rapid decline, a slight fall).
If your students need support with some of these language areas, focus on one at a time. Then revisit and build on the language each time you work with data, across time and in a variety of contexts.
Below is an example of a process to support students with understanding and using verbs to describe trends.
Language focus: Introducing verbs describing data movements
Before beginning Activity One, display an enlarged version of the graph on page 1 and tell the students that you will be talking about statistics displayed in graphs and tables. Explain that fi rst you will explore graphs – their purposes and how they are made.
Discuss components of the graph. Prompt the students to identify the type of graph, the title, the x- and y-axes, and the key. Label each component. Discuss that line graphs often show changes over time.
Give small groups a set of eight simple line graphs. Each graph should show a different trend. Read out sentences that relate to each graph and ask students to identify the matching graph. Provide time between sentences for group discussion.
Ask the students what verbs they heard and then list them on the whiteboard. You could also include adverbs that modify the verbs and/or prepositional phrases modifying the numbers, according to your students’ strengths and needs.
Hand out cut-up sets of the sentences to each group and ask them to match them with the graphs. Display the correct answers and discuss the meanings of the verbs.

10
Technology-related student activities
• Discuss information and communication technologies used in your home and at school. How would life be different if these technologies were not available?
• Early versions of cellphones could only be used for making calls. Now cellphones are multifunctional. Choose a simple, everyday technological product and brainstorm ways to increase the number of functions it performs.
• Use information and communication technologies to collaborate on a project with students at other schools (nationally and internationally).
Use the information in the graph on page 1 of the student book to make sets of fi ve graphs, with a separate graph for each of the information and communication technologies. Working in groups of fi ve, students describe the information shown in their graph, without letting their classmates see it. The other students transfer the information to their own copies of the graph. If necessary, provide speaking frames to help students participate more easily. For example:
From 2000 to 2006, fi xed phone lines __________ from about __________ to approximately __________.
From 2006 to 2009, they __________ from __________ to __________.
Ask the students to compare their combined results with the graph on page 1.
For students who need support with constructing and describing bar charts, use a similar process to that described for line graphs.
Work through an example of Activity Two, question 1, co-constructing an example bar chart and comparisons. Then have students each conduct a survey, displaying their results in a bar chart. Have students sit back-to-back in pairs, describing their bar charts to each other and adding the other person’s information to their chart. This task is likely to involve the use of noun phrases and language to modify numbers. Encourage the students to make comparisons by asking them to construct sentences from their graphs, sharing their sentences with other pairs. They could then make charts and write sentences that compare their results with those of the Ugandan students.
Movement of Data
verbs adverbs nouns adjectives
increase, rise
decrease, fall, decline
fl uctuate
remain steady
level off
sharply
steeply
rapidly
slowly
slightly
steadily
increase, rise
decrease, fall, decline
sharp
steep
rapid
slow
slight
steady
Create charts of language for describing trends, including categories like those in the example below, and display them in the classroom.

11
Pages 4–5: Colour-coding
Achievement Objectives• Number strategies and knowledge: Know the relative size and place value structure of positive … integers … (Number and Algebra, level 4)
• Number strategies and knowledge: Find … percentages of amounts expressed as whole numbers … (Number and Algebra, level 4)
Mathematics StandardsThe approaches and thinking that students demonstrate as they engage with these tasks and problems can provide evidence in relation to the mathematics standards. For example:
• apply additive and multiplicative strategies fl exibly to whole numbers, ratios, and equivalent fractions (including percentages) (Number and Algebra, year 7).
Developing students’ mathematical understandingsA numeral is a symbol, or collection of symbols, that represents a number. The Hindu-Arabic numeral system we use was developed over thousands of years and has its roots in Babylonia. A key stage in its development was the introduction of zero by Indian mathematicians. This system allows us to represent very large numbers using a limited range of symbols. In this activity, students are introduced to an adaptation of this system. Coloured bands represent both the numbers 0–9 and powers of 10. Understanding that there are different systems of numeration can help students to develop their understanding of the Hindu-Arabic system and of place value.
Exploring the technology-related contextTechnology and science are closely related. Teachers often introduce students to the scientifi c concept of circuits, where power sources, outputs, and conductivity are investigated. Students then suggest electronic solutions to a particular problem or respond to an opportunity using their new knowledge. Once students understand the function of components such as switches, buzzers, resistors, capacitors, and LEDs, they enjoy designing simple lighting systems, alarms, “electronic” birthday cards, and interactive quiz boards.
These components can be so small that it is impossible to write technical specifi cations on them. In such cases, codes may be used. For instance, resistors use a system of coloured bands to indicate the amount of resistance.
Vocabulary alertresistors, current, delicate, components, ohms, appliance, expressed, represent, multiplier, tolerance band, equivalent, limits of accuracy, suggests
Answers
Activity
1. a. The colour code shows: how many zeros are in the multiplier; how many times ten has been multiplied by itself to get the multiplier; the power of ten of the multiplier.
b. Grey is 100 000 000; white is 1 000 000 000.
2. a. 33 × 10 = 330
b. 10 × 100 = 1 000
c. 47 × 1 000 = 47 000
d. 22 × 10 000 = 220 000
3. a. yellow, red, brown
b. brown, green, red
c. purple, grey, orange
4. a. 56 000 + 23 000 = 79 000, so purple, white, orange
b. 440 000 + 160 000 = 600 000, so blue, black, yellow
c. 7 900 + 6 100 = 14 000, so brown, yellow, orange

12
Mathematics and Statistics Notes
5. a. 10% of 32 000 = 3 20032 000 – 3 200 = 28 80032 000 + 3 200 = 35 200; so the resistance is between 28 800 and 35 200.
b. 5% of 2 400 = 1202 400 – 120 = 2 2802 400 + 120 = 2 520; so the resistance is between 2 280 and 2 520.
c. 20% of 600 = 120600 – 120 = 480600 + 120 = 720; so the resistance is between 480 and 720.
d. 2% of 18 000 = 36018 000 – 360 = 17 64018 000 + 360 = 18 360; so the resistance is between 17 640 and 18 360.
Students should enjoy using their knowledge of place value to decode the value of electrical resistors. Understanding the coding used in number systems develops the key competency using language, symbols, and texts.
Most students will see the link between the code and the number of zeros in the multiplier. Extend their thinking by showing them that the code also shows how many times 10 has been multiplied by itself. This lays the foundation for the concept of powers, which are introduced at level 5.
Students could use coloured markers to draw their answers to some questions.
Question 5 can be used to discuss variation and accuracy. Variation exists in all objects, whether natural or man-made. It may seem strange to the students that resistors do not provide an exact amount of resistance. Discuss with them that all measurements are approximations, only as accurate as is needed or practical. For example, measurements of length seldom need to be more accurate than the nearest millimetre. If we want to measure the length of the school fi eld, we would probably only measure it to the nearest metre.
Resistors have varying degrees of accuracy, and the level of tolerance required refl ects the sensitivity of the component it is being used with. The fourth band (the tolerance band) on a resistor states what the tolerance is. Although all measurements are approximations, sometimes it is important to know the limits of accuracy of a measurement: what is the range that the actual answer lies within? In many cases, these limits are assumed. For example, if I say that my height is 168 cm, my actual height is likely to be between 167.5 and 168.5 cm.
Percentages are useful for developing proportional reasoning. Using 10% as a base, students can learn to quickly estimate or calculate related percentages. For example, 10% of 800 is 80 (10% = = ). This can be used to fi nd a range of related percentages as shown in the table:
10100
110
12110
110
20% of 800 160
30% of 800 240
5% of 800 40
1% of 800
2% of 800
8
25% of 800 200
15% of 800 120
16
20% = 10% + 10% = 80 + 80
30% = 3 x 10% = 3 x 80
5% = of 10% = 80 ÷ 2
1% = of 10% = 80 ÷ 10
25% = 20% + 5% = 160 + 40
15% = 10% + 5% = 80 + 40
2% = of 20% = 160 ÷ 10
or 2% = 1% + 1% = 8 + 8
Encourage the students to use these techniques to fi nd the limits of accuracy for the resistors in question 5.

13
Colour Multiplier
Black* 1 1
Brown 10 1 x 10
Red 100 1 x 10 x 10
Orange 1 000 1 x 10 x 10 x 10
Yellow
Blue
Purple
Grey
10 000 1 x 10 x 10 x 10 x 10
1 000 000 1 x 10 x 10 x 10 x 10 x 10 x 10
10 000 000 1 x 10 x 10 x 10 x 10 x 10 x 10 x 10
100 000 000 1 x 10 x 10 x 10 x 10 x 10 x 10 x 10 x 10
Green 100 000 1 x 10 x 10 x 10 x 10 x 10
10 multiplied by itself Powers of 10
100
101
102
103
104
105
106
107
108
Code
1
0
2
3
4
6
7
8
5
Extension
Explore powers of 10 with your students.
* See www.homeschoolmath.net/teaching/zero-exponent-proof.php for a useful way to explain why any number to the power of zero is equal to one.
Technology-related student activities
• Use an LDR (light-dependent resistor) and a buzzer in a simple circuit to make a working model of an alarm that will activate when a light is turned on.
• Design a colour code for batteries of different voltage.
• Design a battery-voltage code that people with visual impairments could interpret.
• Research the effect that transistors have had on technological development. See www.nobelprize.org/educational/physics/transistor/history/index.html and www.ehow.com/facts_5183096_use-transistors.html

14
Answers
Activity One
1. a.–b. Answers will vary, depending on the pairs that are chosen. Possibilities include: the fi rst two numbers are the same; the middle two numbers are different.
2. a.–c. Answers will vary. One conjecture may be that “arrangements that have two numbers in the same position are connected”. For example, 3241 is connected to 3214 (fi rst two numbers the same), 1243 (middle two numbers the same), and 2341 (last two numbers the same). Having two numbers in the same position is the same as having two numbers different.
Activity Two
1.
Pages 6–7: Nifty Networks
Developing students’ mathematical understandingsForming a conjecture involves looking for a pattern or rule, testing it, and then either using it for further exploration, modifying it, or rejecting it. Introducing students to the process of making conjectures helps them to learn how to think and communicate mathematically.
In this activity, students explore a network that links 24 arrangements of the digits 1–4. They are asked to form a conjecture about why particular arrangements are connected. Students also solve a network puzzle involving products of three primes.
Exploring the technology-related contextThe Internet is an information network that links computers throughout the world. In technology education, ICT gives students the opportunity to design and plan outcomes, to present technological information to stakeholders, to research existing products and past designs, and to test models.
Vocabulary alertnetwork, interconnected, structure, represented, nodes, conjecture
Achievement Objective• Number strategies and knowledge: Use a range of multiplicative strategies when operating on whole numbers (Number and Algebra, Level 4)
Mathematics StandardsThe approaches and thinking that students demonstrate as they engage with these tasks and problems can provide evidence in relation to the mathematics standards. For example:
• use multiplication and division as inverse operations on whole numbers (year 8).
255
874 4 199 385 11 803
222
2 821
20 677
2. Discussions will vary.
3. Practical activity.

15
Network diagrams are a useful way to organise information. Unlike many other diagrams, the size and location of lines and shapes are irrelevant in network diagrams; all that matters is what is connected to what.
Activity One
Encourage students to use mathematical language as they explore the network diagram. For example, “My conjecture is that two numbers in the arrangement need to be different. At fi rst I thought this was different from Sasha’s conjecture, which is that two numbers have to be the same. Then we realised that having two numbers different is the same as having two numbers the same. I tested my conjecture by checking three nodes on separate parts of the network diagram, and it worked for all of them. I didn’t check all 24 nodes because it didn’t seem necessary. If I wanted to prove my conjecture, I could check all the nodes, but I am confi dent that my conjecture is true.”
Most students will identify that connected arrangements have exactly two numbers in the same position. However, each arrangement is only connected to three nodes, when for each there are six possible arrangements with two numbers in the same place. For example, for 1234, these six arrangements can be made: 1243, 1432, 1324, 4231, 3214, and 2134. Exploring other nodes will confi rm that the rule that determines which nodes are connected has a limiting component that excludes any arrangements where the numbers that remain unchanged are not the 1st and 2nd, 2nd and 3rd, or 3rd and 4th numbers.
The network in Activity One is based on a similar network created by the Isaac Newton Institute for Mathematical Sciences. See www.newton.ac.uk/wmy2kposters/june/index.html for further information about networks, including an explanation of how a network can be used to fi nd an effi cient pathway through a maze.
Activity Two
Problem solving is the core of mathematical thinking. By defi nition, a “problem” is something that may involve struggle. The process of grappling with a problem, returning to it after a break if necessary, develops persistence and resilience. Resist the temptation to simplify the network problem by guiding students through it. To do so is to rob students of the rewards of reaching a solution. And it does not help them develop problem-solving skills and dispositions.
Encourage students to look for possible strategies. Suggest that, even when using a strategy, it’s a good idea to work in pencil.
Once students reach a correct solution, tell them to return to the problem, asking themselves the following questions: What have I learned? Could I solve the problem again? Were any parts of my solution the result of luck? How could I use what I have learned to solve the problem more effi ciently? Then ask students to share their strategies with their classmates.
An example of a strategy is outlined below:First, list the fi rst 12 primes (2, 3, 5, 7, 11, 13, 17, 19, 23, 29, 31, 37).
Next, fi nd the 3 prime factors of each puzzle number. Some of these can be found using divisibility rules for 2, 3, 5, and 11 (see www.mathsisfun.com/divisibility-rules.html). Each factor has only been used twice; this information makes it easier to identify factors for the two largest numbers.
The prime factors of each number are:222 – 2, 3, 37255 – 3, 5, 17385 – 5, 7, 11874 – 2, 19, 232 821 – 7, 13, 314 199 – 13, 17, 1911 803 – 11, 29, 3720 677 – 23, 29, 31
Mathematics and Statistics Notes

16
There are 8 nodes and 12 lines in the diagram. Each pair of nodes is linked by a different common factor. Writing this factor beside each line helps to keep track of which factors have been used.
222 and 225 have been placed in the diagram. These two numbers have a common factor of 3. This leaves 2 and 37 for the lines joining the two adjacent nodes.
874 is the only other number with a factor of 2, and 11 803 is the only other number with a factor of 37, so these numbers can be added to the diagram:
Next, fi nd the number that is joined to both 255 and 874.
The factors of 255 are 3, 5, 17. The factors of 874 are 2, 19, 23. But some of these factors have already been used twice (2 and 3), so the “available” factors are 5, 17, 19, and 23. Looking at the list of factors, there is only one number with two of these primes as factors: 4 199.
It becomes increasingly easy to place the remaining numbers as the pool of available factors decreases. List the factors, cross out factors that have been used elsewhere, and identify which number combines two of the remaining factors (one from each side).
Students will enjoy learning how to create their own network puzzle for a classmate to solve. Encourage students to apply what they learned in question 2 to solve their classmate’s puzzle.
A related activity from the Figure It Out series is Safety in Numbers, found in the level 3+–4+ Technology in Practice book (pages 2–3).
Solving complex problems develops the key competency thinking.
The prime puzzle was adapted from a puzzle on the NRICH maths website (see http://nrich.maths.org/2414). The site provides further information about networks and several related activities.
Technology-related student activities
• Discuss information and communication technologies used in your home and at school. How would life be different if these technologies were not available?
• Use information and communication technologies to collaborate on a project with students at other schools (nationally and internationally).
255
874 4 199 385 11 803
222
2, 3, 37
2, 19, 23 11, 29, 37
32 37

17
Pages 8–9: Good Sport?
Achievement Objective• Statistical investigation: Conduct investigations using the statistical enquiry cycle:
– identifying patterns and trends in context, within and between data sets (Statistics, level 3)
Mathematics StandardsThe approaches and thinking that students demonstrate as they engage with these tasks and problems can provide evidence in relation to the mathematics standards. For example:
• investigate summary and comparison questions by using the statistical enquiry cycle:
– interpret results in context, accepting that samples vary (Statistics, year 6).
Developing students’ mathematical understandingsStatistical thinking involves the exploration and use of patterns and relationships in data. There are four key processes:
• describing data – connecting the information in a table or graph with a real-life context
• organising and reducing data – ordering, grouping, and summarising
• representing data – creating visual representations
• analysing and interpreting data – recognising patterns and trends and using them to make inferences and predictions.
In these activities, students explore statistics related to international sporting records.
Exploring the technology-related contextSports technologists aim to improve athlete performance through improved equipment, training methods, and nutrition. Even the slightest of margins can mean the difference between victory and defeat.
Some technological innovations cause controversy. In many sports, limits are placed on technological intervention. In an endeavour based on pushing the limits of human performance, deciding where to draw the line is not always straightforward.
Vocabulary alertperformance-enhancing, equipment, controversial, technique, polyurethane, performance-properties, drag, compressed, streamlined, non-textile, evidence, banned, track and fi eld event, javelin, redesigned, introduced, impact
Answers
Activity One
1. Discussion will vary. Possible comments include: the woollen swimsuit would absorb water, making a swimmer heavier and slower; the polyurethane swimsuit makes the body smooth, lessening resistance in the water and enabling the swimmer to move faster.
2. Discussion will vary. Olympic swimming times have continued to improve over time. Improved swimsuits have certainly played a role (see questions 3 and 4), but other factors have also been very important, for example, better nutrition, training, technique, and pool design.
18
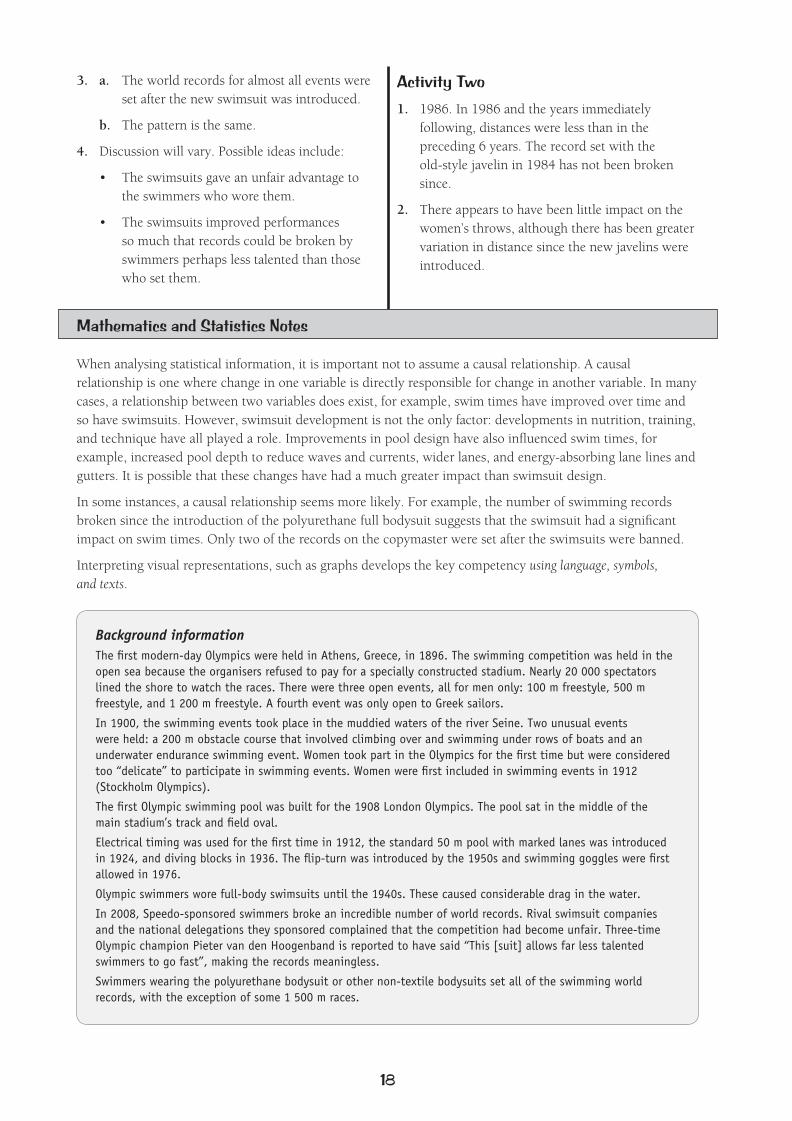
3. a. The world records for almost all events were set after the new swimsuit was introduced.
b. The pattern is the same.
4. Discussion will vary. Possible ideas include:
• The swimsuits gave an unfair advantage to the swimmers who wore them.
• The swimsuits improved performances so much that records could be broken by swimmers perhaps less talented than those who set them.
Activity Two
1. 1986. In 1986 and the years immediately following, distances were less than in the preceding 6 years. The record set with the old-style javelin in 1984 has not been broken since.
2. There appears to have been little impact on the women’s throws, although there has been greater variation in distance since the new javelins were introduced.
Mathematics and Statistics Notes
Background informationThe fi rst modern-day Olympics were held in Athens, Greece, in 1896. The swimming competition was held in the open sea because the organisers refused to pay for a specially constructed stadium. Nearly 20 000 spectators lined the shore to watch the races. There were three open events, all for men only: 100 m freestyle, 500 m freestyle, and 1 200 m freestyle. A fourth event was only open to Greek sailors.
In 1900, the swimming events took place in the muddied waters of the river Seine. Two unusual events were held: a 200 m obstacle course that involved climbing over and swimming under rows of boats and an underwater endurance swimming event. Women took part in the Olympics for the fi rst time but were considered too “delicate” to participate in swimming events. Women were fi rst included in swimming events in 1912 (Stockholm Olympics).
The fi rst Olympic swimming pool was built for the 1908 London Olympics. The pool sat in the middle of the main stadium’s track and fi eld oval.
Electrical timing was used for the fi rst time in 1912, the standard 50 m pool with marked lanes was introduced in 1924, and diving blocks in 1936. The fl ip-turn was introduced by the 1950s and swimming goggles were fi rst allowed in 1976.
Olympic swimmers wore full-body swimsuits until the 1940s. These caused considerable drag in the water.
In 2008, Speedo-sponsored swimmers broke an incredible number of world records. Rival swimsuit companies and the national delegations they sponsored complained that the competition had become unfair. Three-time Olympic champion Pieter van den Hoogenband is reported to have said “This [suit] allows far less talented swimmers to go fast”, making the records meaningless.
Swimmers wearing the polyurethane bodysuit or other non-textile bodysuits set all of the swimming world records, with the exception of some 1 500 m races.
When analysing statistical information, it is important not to assume a causal relationship. A causal relationship is one where change in one variable is directly responsible for change in another variable. In many cases, a relationship between two variables does exist, for example, swim times have improved over time and so have swimsuits. However, swimsuit development is not the only factor: developments in nutrition, training, and technique have all played a role. Improvements in pool design have also infl uenced swim times, for example, increased pool depth to reduce waves and currents, wider lanes, and energy-absorbing lane lines and gutters. It is possible that these changes have had a much greater impact than swimsuit design.
In some instances, a causal relationship seems more likely. For example, the number of swimming records broken since the introduction of the polyurethane full bodysuit suggests that the swimsuit had a signifi cant impact on swim times. Only two of the records on the copymaster were set after the swimsuits were banned.
Interpreting visual representations, such as graphs develops the key competency using language, symbols, and texts.

19
The Speedo LZR Racer swimsuit used ultrasonically bonded seams instead of traditional stitches. It had low-drag panels embedded within the fabric and was designed with help from NASA. There were complaints that the swimsuit unfairly increased levels of buoyancy. Some of the world-record-breaking swimmers wore two swimsuits during their races.
In 2009, the International Swimming Federation voted to ban non-textile (non-woven) swimsuits from 1 January 2010 to address the problem of measuring the performance of swimsuits, not the swimmers. The new ruling states that the maximum coverage allowed for a man’s swimsuit is from his navel to his knee and the maximum coverage allowed for a woman’s swimsuit is from her shoulder to her knee.
Technology-related student activities
• Discuss ethical issues related to sports technology, for example, the use of performance-enhancing drugs or the inequality between richer and poorer countries in terms of athletes having access to, or funds for, technology.
• Research a particular sport and the role technology has played in its development.
• Debate whether athletes with disabilities should be allowed to use technology to compete against able-bodied athletes.
• Research ways that technology is used to analyse athletes’ performances.
• Discuss possible consequences of placing no restrictions on the design or materials used for a piece of sports equipment, such as a tennis racquet.
• Investigate the characteristics of textiles. What is the difference between a textile and a non-textile swimsuit?

20
Answers
Activity
1. a. The images are different sizes, so we can’t compare the measurements. The face above has eyes that look further apart than the face below, but the measurement is smaller because the image is smaller.
b. i. 17 mmii. 22 mm
c. i. 0.35 mmii. 0.32 mm
d. The ratio for the face above is larger than the ratio for the face below. This tells the computer that, relatively speaking, the person above has eyes that are further apart than the person below.
2. a.–c. Practical activity. Answers will vary.
d. Divide C by D.
e. Answers will vary. Possible relationships include: the width of the mouth compared with the width of the face; the width of the face compared with the length of the head.
f.–g. Answers will vary.
h. The results for f and g should be very similar or the same. If there are minor differences, this will be because it is hard to take accurate measurements from a small image.
Pages 10–11: Faceprints
Achievement Objectives• Measurement: use appropriate scales, devices, and metric units for length … (Geometry and Measurement, level 4)
• Number strategies and knowledge: reason with linear proportions (Number and Algebra, level 5)
Mathematics StandardsThe approaches and thinking that students demonstrate as they engage with these tasks and problems can provide evidence in relation to the mathematics standards. For example:
• measure … the attributes of objects, using metric and other standard measures (Geometry and Measurement, year 7).
Developing students’ mathematical understandingProportion involves comparing one aspect of an object or image with another aspect. The emphasis is on the relationship between measurements, not the measurements themselves. Ratios can be used to quantify this comparison and can be expressed in several ways. For example, if a person’s arm span is 146 cm and their height is 150 cm, this can be expressed as an arm span : height ratio of 146:150 or or just 0.97 (146 ÷ 150). In this activity, students use ratios expressed as decimals to compare proportions in faces and demonstrate that proportions remain constant when an image is enlarged or reduced.
Exploring the technology-related contextTechnological advances have made it possible to quickly identify people by comparing information about their unique physiological features with database records. Some security systems use eye, voice, and hand geometry to allow access to restricted areas. A recent development is a prototype car that uses a fi nger-scanning system to adjust the mirrors and seats and to start the engine.
Vocabulary alertbiometry, voice patterns, faceprint, database, characteristics, unique, face recognition software, security camera
146150
21
3. a. Peter’s face
b. Answers will vary. Possible factors include: some faces have similar proportions; the image needs to be face-on; the person could be wearing sunglasses or a hat; the image needs to be high-defi nition to take accurate measurements; if the image is very small, it will be hard to differentiate between faces because the measurements will be less precise; the width of the mouth when a person is smiling is different from the width when they are pouting.
In this activity, students use measurement to explore proportions.
Discuss proportion with the class. As a fun introduction, show students some out-of-proportion images. These can be easily found by doing an Internet search for “out of proportion animals”.
A single measurement in an image tells us nothing unless we know that the image is life-sized or it comes with a scale. However, if there are two measurements, we can fi nd the size of one measurement compared with another. This makes the size of the image irrelevant because the relationship between the two measurements is constant.
Accuracy of measurement is important in this activity.
Ratios calculated from measurements in the larger image are likely to be more accurate than those derived from the smaller image. This is because precision of measurement is relative to size. (It’s easier to take meaningful measurements from a large picture than from a postage stamp.) So, in question 2, students are unlikely to get exactly the same results for f and g. Discuss the reasons for this with the students. If a student’s measurements are very different, check their measuring technique.
To identify which face matches the stored information, the students need to interpret the required distances. Two students measuring the width of the mouth may get slightly different results because of their different interpretations of where the mouths end. If the students have participated in Census at School (www.censusatschool.org.nz), they will understand the importance of defi ning the method in suffi cient detail for measurements to be consistent. This is a useful discussion point, and connections can be made to both the fallibility of computers in terms of guaranteeing a match with a stored faceprint and the need to carefully defi ne parameters when collecting data.
If time or access to cameras or computers is an issue, use the face copymaster provided instead of images of students.
Exploring situations that involve proportional reasoning develops the key competency thinking.
Note: The Focus on English resource on ESOL Online provides supplementary resources that may be useful for supporting learners with the language for measurement. See ESOL Online at http://esolonline.tki.org.nz/ESOL-Online/Teacher-needs/Reviewed-resources/Cross-curricular/Focus-on-English/Measurement
Technology-related student activities
• Do a plus, minus, interesting analysis of the use of voice- or fi nger-recognition to start a car.
• Brainstorm ways that face recognition technology could be used at school or in workplaces.
Mathematics and Statistics Notes

22
Answers
Activity One
1. Using estimation, a sensible answer would be about 50 seconds (s). For example, 9 hrs = 9 x 60 min = 540 min. Emily sheared 648 lambs. If she had sheared 1 lamb per min, she would only have sheared 540. If she had sheared 2 per min (30 s each) she would have sheared 1080. This shows that the approximate time is closer to 1 min than to 30 s.
2. The wool Emily sheared weighed 712 kg. She sheared 648 lambs. This means that, on average, the wool from each lamb was more than 1 kg.
3. a. 4. The wool weighed 712 kg. 712 ÷ 175 = 4.07 bales. (The bales aren’t an exact weight, so it makes sense to round down to 4.)
Pages 12–13: Working with Wool
Achievement Objectives• Number strategies and knowledge: Use a range of multiplicative strategies when operating on whole numbers (Number and Algebra, level 4)
• Measurement: Use … edge lengths to fi nd … the volumes of cuboids (Geometry and Measurement, level 4)
Mathematics StandardsThe approaches and thinking that students demonstrate as they engage with these tasks and problems can provide evidence in relation to the mathematics standards. For example:
• apply additive and simple multiplicative strategies fl exibly to whole numbers… (Number and Algebra, year 7).
Developing students’ mathematical understandingMathematics in real life is not always tidy, and sometimes an estimate makes more sense than a precise calculation. Being able to make a sensible estimate is a useful everyday skill. Estimating also allows students to check whether their answers to mathematical problems are likely to be correct.
Estimating requires a good feel for the number system. In these activities, students explore the effi ciency of different wool presses by making sensible estimates.
Exploring the technology-related contextShipping containers are an effi cient way to transport goods. Their standardised dimensions allow them to be easily stacked and then transferred from ships to rail and semi-trailer trucks. Containerisation has played an important role in the development of international trade.
Vocabulary alertshearing, techniques, pressing, bales, wool press, estimate, fl eece, export, shipping container
b. About 160 lambs. 648 lambs ÷ 4 bales = 162. (You could also divide 175 kg by the average weight of one fl eece. 175 kg ÷ 1.1 kg = 159 lambs.)
Activity Two
1. Press Owner Min per bale
Bales per hour
Fleeces per bale
Fleeces per hour
Kip’s great-grandfather
30 16 322
Jim 15 32 1284
Alec 10 40 2406
Tracey 6 50 50010

23
Students should complete activities 1 and 2 without using a calculator. Estimating is very different from guessing. It involves making a calculation using known facts and/or relationships. Estimating strategies require good number sense and a sound understanding of the base 10 number system.
There are often several ways to reach an estimate and each way is likely to yield a somewhat different estimate. Students need to feel confi dent about using an approach that is different to those used by their classmates. Ask students to share their methods so that they are exposed to different approaches.
In Activity One, students are asked to estimate how long each lamb took if Emily sheared 648 lambs in 9 hours. An approximate answer is reasonable because the time to shear each lamb would vary depending on the weight of its wool, its temperament, and Emily’s energy levels. To work out how many lambs were sheared each hour, you could use 630 as an approximate number of sheep because 630 can be easily divided by 9. 630 ÷ 9 means that there were around 70 sheep per hour. There are 60 minutes in an hour, so if each sheep took a minute to shear, there would have been 60 sheep. Emily sheared more than this, so the estimate might be about 50 seconds per sheep.
Many students will be unfamiliar with long shearing competitions. Estimating how long it took Emily to shear each lamb helps to show the enormity of Emily’s feat; shearing a lamb every minute for 9 consecutive hours is easier to conceptualise than 648 lambs in 9 hours.
In question 2, the students are asked whether the wool Emily sheared met the weight requirement for the record. Students don’t need to use a calculator to work this out. If the wool mass from 648 lambs weighed 712 kg, then the average mass of the fl eeces was more than 1 kg, which is more than the 0.9 kg required.
Activity Two
This activity requires students to use proportional reasoning to make estimates. Ask the students to share the strategies that they used; have a class discussion about their usefulness. Sharing strategies develops the key competency participating and contributing.
Note the use of proportional reasoning throughout: if you multiply the number of fl eeces by 4, the number of hours also needs to be multiplied by 4.
Activity Three
The bales can be stacked 3 high, 3 across, and 4 deep. Students could draw a 3D-sketch of the container and use it to work out how many bales fi t across each edge. Note that calculating the volume of the shipping container and then dividing it by the volume of one bale is not an appropriate method because the bales are not a perfect fi t.
Mathematics and Statistics Notes
2. There are lots of ways to make an estimate. Here are some examples:
Kip’s great-grandfather’s press could bale 32 fl eeces per hr. Using 30 as a “friendly number”, the amount of time it would take to bale the wool from 4 000 sheep is:
30 x 100 hrs = 3 000 sheep, 30 x 30 hrs = 900 sheep, 30 x 3 = 90 sheep
100 + 30 + 3 = 133 hrs to do 3 990 sheep, so 134 hrs is a sensible estimate for 4 000 sheep.
Jim’s press: 128 per hr, so use 125 as a friendly number
125 in 1 hr 250 in 2 hrs 500 in 4 hrs 1 000 in 8 hrs 4 000 in 32 hrs
Alec’s press: 240 per hr, so use 250 as a friendly number
250 in 1 hr 500 in 2 hrs 1 000 in 4 hrs 4 000 in 16 hrs
Tracey’s press: 500 per hr
500 in 1 hr 1 000 in 2 hrs 4 000 in 8 hrs
Activity Three
1. 36 bales. (2.35 ÷ 0.75 = 3.13, so 3 bales across. 2.4 ÷ 0.75 = 3.2, so 3 bales high. 5.9 ÷ 1.35 = 4.4, so 4 bales deep. 3 x 3 x 4 = 36)
2. Yes. 36 bales weigh only 17 280 kg, and a shipping container can hold about 22 000 kg.

24
Technology-related student activities
• Research the benefi ts of wool. See www.campaignforwool.co.nz/technical-and-information for a wealth of related information.
• Research other ways that technology is used in New Zealand agriculture, for example, aerial top-dressing.
• Investigate agricultural inventions by looking at New Zealand Field Day websites.
• Investigate simple hydraulic and pneumatic systems that use balloons or syringes and plastic tubing. See whether you can make an object move by pushing air or water through a tube. Where are these types of systems used? (See www.ehow.com/list_6639308_school-projects-hydraulics.html)
• Debate the advantages and disadvantages of a particular agricultural technology. For example, aerial top-dressing helps a farmer to kill weeds but could be a nuisance (noise and spray-drift) for neighbouring farms.
Page 14: Function Confusion
Achievement Objective• Number strategies and knowledge: Find … decimals, and percentages of amounts expressed as whole numbers … and decimals (Number and Algebra, level 4)
Mathematics StandardsThe approaches and thinking that students demonstrate as they engage with these tasks and problems can provide evidence in relation to the mathematics standards. For example:
• apply additive strategies to decimals (Number and Algebra, year 7).
Developing students’ mathematical understandingExploring patterns in number relationships is the basis of algebraic thinking. This process involves studying change, looking for patterns, and identifying common structures. In this activity, students are presented with a cash register that has pre-programmed functions. By analysing the relationships between different inputs and outputs, students can identify what each function key has been programmed to do.
Exploring the technology-related contextA technological system is one that, once set up, can perform its function without human input. Systems save time and energy, allowing people to attend to other tasks.
Autopilot, cruise control, and electric ovens have programmable systems that use feedback from other systems to maintain altitude and direction, speed, or temperature. Most users don’t know how these systems work but trust that they are reliable and accurate.
Vocabulary alertprogrammable function keys, inputs, outputs, transactions
25
Algebraic thinking involves recognising patterns and structure. Encourage the students to look for change and for patterns within that change. For example, discuss with the students why Simon and Terry needed to try each function key with at least two different inputs to work out its effect. Consider F1, which doubles each input. Simon and Terry input $3, and the output is $6. There are two possibilities: does F1 “add 3” or “multiply by 2”? The answer only becomes clear when they input $5 and the output is $10. This is an example of proportional reasoning – the amount that the input is changed by is proportional to the size of the input. Compare this with F3: for F3, the change is the same regardless of the input (that is 1 is subtracted).
F2 decreases the input by 10%. $3 $2.70 and $5 $4.50. Students can use this relationship to identify the function of the F4 key: $3 $2.40 and $5 $4.00. The decrease resulting from F4 is twice the decrease resulting from the F2 key: 2 x 10% = 20%.
Note that inputting $3.00 and using the F1 button to get an output of $6.00 uses the same algebraic thinking as making x = 3 in the equation y = 2x and getting a solution of y = 6. The output changes as the input is changed, but the relationship between each input and output remains constant. For example, using F1, the output will always be twice the input.
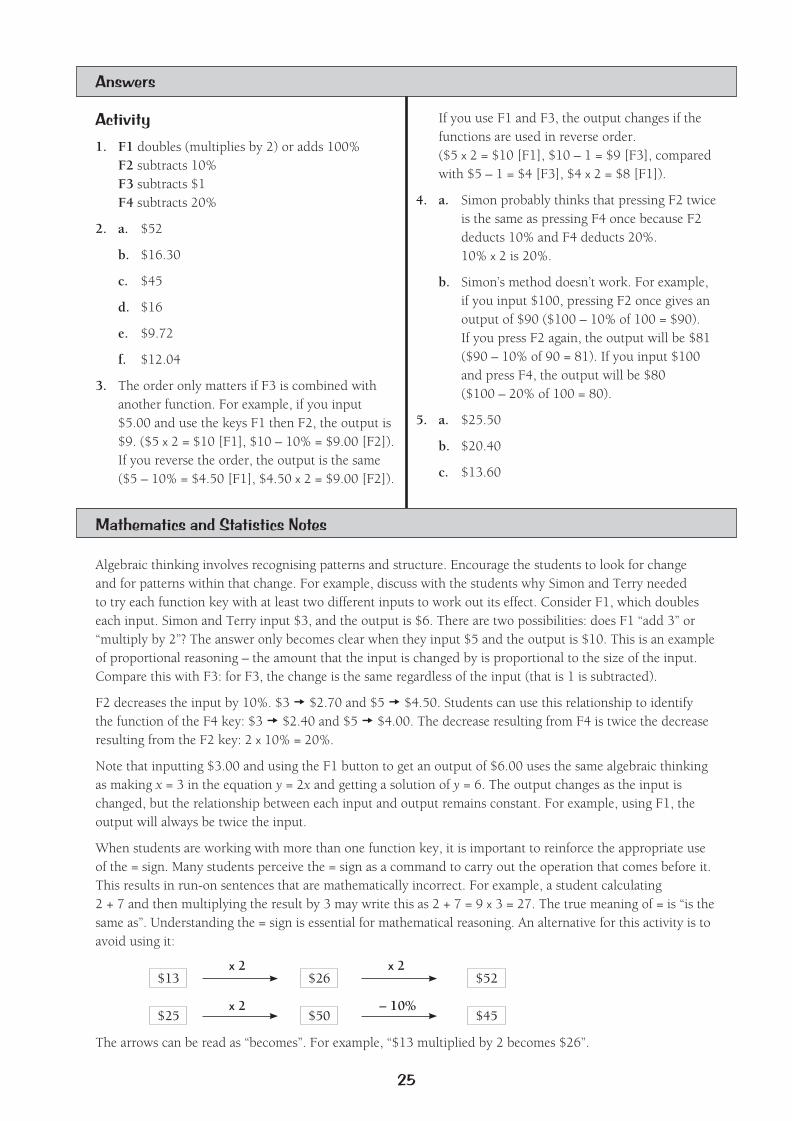
When students are working with more than one function key, it is important to reinforce the appropriate use of the = sign. Many students perceive the = sign as a command to carry out the operation that comes before it. This results in run-on sentences that are mathematically incorrect. For example, a student calculating 2 + 7 and then multiplying the result by 3 may write this as 2 + 7 = 9 x 3 = 27. The true meaning of = is “is the same as”. Understanding the = sign is essential for mathematical reasoning. An alternative for this activity is to avoid using it:
Mathematics and Statistics Notes
Answers
Activity
1. F1 doubles (multiplies by 2) or adds 100%F2 subtracts 10%F3 subtracts $1F4 subtracts 20%
2. a. $52
b. $16.30
c. $45
d. $16
e. $9.72
f. $12.04
3. The order only matters if F3 is combined with another function. For example, if you input $5.00 and use the keys F1 then F2, the output is $9. ($5 x 2 = $10 [F1], $10 – 10% = $9.00 [F2]). If you reverse the order, the output is the same ($5 – 10% = $4.50 [F1], $4.50 x 2 = $9.00 [F2]).
If you use F1 and F3, the output changes if the functions are used in reverse order. ($5 x 2 = $10 [F1], $10 – 1 = $9 [F3], compared with $5 – 1 = $4 [F3], $4 x 2 = $8 [F1]).
4. a. Simon probably thinks that pressing F2 twice is the same as pressing F4 once because F2 deducts 10% and F4 deducts 20%. 10% x 2 is 20%.
b. Simon’s method doesn’t work. For example, if you input $100, pressing F2 once gives an output of $90 ($100 – 10% of 100 = $90). If you press F2 again, the output will be $81 ($90 – 10% of 90 = 81). If you input $100 and press F4, the output will be $80 ($100 – 20% of 100 = 80).
5. a. $25.50
b. $20.40
c. $13.60
$13x 2 x 2
x 2 – 10%
$26 $52
$25 $50 $45
The arrows can be read as “becomes”. For example, “$13 multiplied by 2 becomes $26”.

26
The order that the function keys are used in only matters when using F3. This is because F3 is the only additive function. This can be explored further by comparing equations, such as 3 x 2 – 1 = 5 and (3 – 1) x 2 = 4.
If only F1, F2, and F4 are used, the order doesn’t matter because these functions are multiplicative:• F1 (doubling) is “x 2”• F2 (subtracting 10%) is “x 0.9”• F4 (subtracting 20%) is “x 0.8”
The commutative law states that the order in which numbers are multiplied has no effect on the product (a x b = b x a). For example, 3 x 2 = 3 x 2.
Pressing the F2 button twice doesn’t give a discount of 20% because 10% is not a constant value. For example, 10% of $5 is not the same as 10% of $5.50.
This is a good discussion point. A related scenario involves increasing and then decreasing an amount by the same percentage. Most students think that increasing an amount by 10% and then decreasing the result by 10% will “undo” the 10% increase. This is because other operations they have used all have an “inverse function” (+ and –, x and ÷). However, if you increase $80 by 10%, you get $88, and if you reduce $88 by 10%, you get $79.20. The reason for the difference is that 10% of 80 has a smaller value than 10% of 88.
There is a way to reverse the effect of adding 10%. Multiplying $80 by 1.1 increases it by 10% ($88); dividing the result by 1.1 removes the 10%: $88 ÷ 1.1 = $80.
Making deductions and verifying the results develops the key competency thinking.
Technology-related student activities
• Investigate the function keys on a computer. What does each of them do?
• Create a keyboard macro.
• Brainstorm technological products that use systems. Rank them in terms of possible negative consequences if the system malfunctions.

27
Pages 15–17: Where on Earth?
Achievement Objectives• Measurement: Interpret and use scales, timetables, and charts (Geometry and Measurement, level 4)
• Position and orientation: Communicate and interpret locations and directions, using compass directions, distances, and grid references (Geometry and Measurement, level 4)
Mathematics StandardsThe approaches and thinking that students demonstrate as they engage with these tasks and problems can provide evidence in relation to the mathematics standards. For example:
• describe locations … using … co-ordinates (year 8).
Developing students’ mathematical understandingsGeometry is the study of shape, size, relative position, and space, and is one of the oldest branches of mathematics. The literal meaning of geometry is to “measure the Earth”. The accuracy with which we measure depends on both our needs and the sophistication of the tools available. The use of GPS technology enables people to pinpoint places on Earth with incredible speed and accuracy. In these activities, students explore latitude and longitude.
Exploring the technology-related contextNavigation involves knowing one’s current position and planning a route that will end up at a desired destination. Early explorers used features in the environment to guide their vessels across large distances. Other explorers used maps (which were often inaccurate) and compasses.
Developments in GPS technology allow people to navigate a path to unknown destinations with accuracy and speed.
Vocabulary alertseafarers, currents, cloud masses, GPS, navigational device, co-ordinates, latitude, longitude, degrees–minutes–seconds (of angles), locate, zoom function, estimate, scale
Answers
Activity
1. a. Practical activity
b. i.–ii. Practical activityiii. Cape Reinga
2. a. The Beehive (Wellington)
b. Mount Taranaki (Egmont National Park)
c. Waitangi
3. a. Practical activity
b. i.–ii. Practical activityiii. Approximately 30 metres
iv. The scale unit gets larger. The area shown on the map has increased, so a larger unit of measurement is needed.v. Approximately 2 kmvi. Approximately 110 km
4. a. Blenheim
b. Gisborne
c. Invercargill
d. Stewart Island
e. New Plymouth

28
Mathematics and Statistics Notes
These activities will develop students’ understanding of latitude and longitude and how they are used to describe locations. Using technology appropriately and using spatial visualisation to solve problems develops the key competency using language, symbols, and texts.
Some students wrongly perceive mathematics to be unrelated to them or their culture. In reality, mathematics is found in all cultures. For example, Polynesian peoples skilfully navigated across thousands of kilometres of ocean using sophisticated navigation techniques. Navigation skills were highly valued and were passed down orally, often by song. Important facts were memorised: the motion of specifi c stars and where these stars would rise and set on the ocean, weather conditions, times of travel, wildlife species and cloud formations on particular islands, the direction of ocean swells, colours of sea and sky, angles for approaching harbours. Consider inviting a parent or community member with knowledge in these areas to talk to the class.
Discuss with the students why it is useful to be able to identify a location. What situations require greater accuracy than others? Provide opportunities for students who share a fi rst language other than English to discuss their ideas in this language.
Latitude and longitude are used to describe the position of any point on the surface of the Earth.
Latitude and longitude are angles. Imagine a giant 40° angle with its vertex the centre of the Earth. One arm of the angle lies along the horizontal plane of the Equator. The other arm travels through the Earth until it reaches a point on the surface of the planet. This point has a latitude of 40°N.
The “distance” between the arms of the angle will be small near the vertex (the centre of the Earth) and large at the ends (the surface of the Earth), but the angle between the two arms is constant. On the surface of the planet, the distance between two points that are 1 degree of latitude apart is approximately 111 km. There is slight variation because the Earth is not a perfect sphere.
A degree can be divided into 60 minutes and each minute can be further divided into 60 seconds.
The latitude at the Equator is 0°, at the North Pole, it is +90°, and at the South Pole, it is –90°. One way for students to remember that lines of latitude are horizontal is to imagine the horizontal rungs of a ladder (“ladder-tude”).
Longitude lines on a globe (also known as meridians) meet at the poles and are widest at the Equator (about 111 km apart).
0° longitude is called the Prime Meridian. This meridian runs through the site of the British Royal Greenwich Observatory in London. The degrees continue 180° east and 180° west until they meet and form the International Date Line in the Pacifi c Ocean.
Explore the latitude and longitude website (http://itouchmap.com/latlong.html) yourself before doing this activity with your class. Familiarise yourself with how to enter the information and answer parts of question 3.
For question 1b (ii), the students need to enter the latitude and longitude values on the right-hand side of the screen where it says “Show point”. There are similar boxes on the left-hand side that should not be used.
For question 3, the students need to enter their address at the top of the webpage.
75°
60°
60°E 40°N
60°E Long.
40°N Lat.
45°
30°
15°
0° 60°15° 30° 45°

29
Students may need guidance using the scale on the map. One approach is to use an object, such as a fi nger width, part of their pencil’s length, or a ruler to defi ne a set measurement from the scale. They can use this to see how many of this “unit” fi t between the two points. Answers need only be estimates.
In question 4, students apply their knowledge of latitude and longitude to match co-ordinates with places on a map. Ask them to communicate how they determined which co-ordinates belong with which place and to listen to methods used by other students.
As a homework activity, the students could research systems of navigation, both historical and in current use. For example, how do people living in vast deserts locate objects they have buried? How did our Polynesian ancestors fi nd and colonise Aotearoa? How did a sextant work?
The Focus on English resource on ESOL Online provides supplementary resources that may be useful for supporting learners with the language for measurement. See ESOL Online at http://esolonline.tki.org.nz/ESOL-Online/Teacher-needs/Reviewed-resources/Cross-curricular/Focus-on-English/Measurement
Extension
A: Metres, nautical miles, and knots
The metre unit was originally defi ned as 1/10 000 000 (one ten-millionth) of the distance between a pole and the Equator.
If the distance from a pole to the Equator is 10 000 000 m and that corresponds to 90 degrees of latitude, what is the shortest distance between two points that differ by 1 degree of latitude?
Answer: 10 000 000 ÷ 90 = 111 111 m = about 111 km
The distance between two points with co-ordinates that differ by 1 minute of latitude can be found by dividing this distance by 60:
1 degree of latitude ÷ 60 = 1 minute of latitude
111 111 m ÷ 60 = 1 852 m (to the nearest metre)
This distance is known as a nautical mile and is used for measuring distances at sea. Boat speed is traditionally measured in knots. A knot is a speed of 1 nautical mile per hour, for example, a 50-knot wind moves at a speed of 50 nautical miles per hour.
B: Explore the impact of adding/subtracting whole numbers to/from negative numbers.
Start with the problem mentioned in the student book: “If I add 1 (to – 41), do I get – 40 or – 42?”
The students can use a vertical number line to show different latitudes and then use number lines to solve problems:
Latitude– 38– 39– 40– 41– 42– 43– 45– 46– 47– 48
Startinglatitude
Finallatitude
Move
a.
– 43 – 42+ 1
b.
– 46 + 3
c.
e.
– 45 + 4
– 46 – 40
– 45 – 39
d.
– 42 + 3
Answers
a. – 43
b. – 41
c. – 39
d. + 6
e. + 6
“+1” represents a movement of 1 degree north (up). Ask the students how they could represent a movement of 1 degree south (down).

30
Startinglatitude
Finallatitude
Move
a.
– 42 – 43– 1
b.
– 40 – 3
c.
e.
– 38 – 6
– 40 – 47
– 38 – 45
d.
– 42 – 3
Startinglatitude
Finallatitude
Move
a.
– 42 – 43– 1
b.
– 40 – 3
c.
e.
– 38 – 6
– 40 – 47
– 38 – 45
d.
– 42 – 3
Startinglatitude
Finallatitude
Move
a.
– 43
– 43
– 43
– 43
b.
c.
e.
– 43
– 43
d.
Have the students draw up their own table and fi ll in the “starting latitude” and “move” columns so that the fi nal latitude is always – 43, checking each other’s answers using their number lines.
Examples of possible problems:
Encourage the students to generalise patterns that they notice while doing the calculations, for example, “If I add on to a negative number, it becomes less negative.”
Support for English Language Learners
Supporting students with subject-specifi c vocabulary
Begin by deciding what vocabulary is important only for understanding the text and what language students are likely to encounter in many contexts. Focus language learning on the latter. Guide students as to which words are most important for them to learn (and which are low frequency and, therefore, lower priority). The English Language Learning Progressions: Introduction, pages 39–46, has useful information about vocabulary learning.
Identify 10–15 key words. Prepare defi nitions for these words (using pictures and diagrams as well as words) and simple example sentences. Give pairs of students 2–3 sentences, each with one of the key words highlighted. Have the pairs discuss what they think each highlighted word means. Give the students defi nitions and ask them to match each defi nition with a word. Ask pairs of students to explain their words to the rest of the group, encouraging them to use pictures, diagrams, or examples as they see fi t. Create a word bank by displaying the words and defi nitions on the classroom wall. Refer to the word bank during activities.
Technology-related student activities
• Early sailors could only determine latitude. How did they do it? Why was longitude a problem?
• Conduct a treasure hunt using clues and a handheld GPS.
Answers
a. – 43
b. – 44
c. – 45
d. – 7
e. – 7

31
Pages 18–19: Going Global
Achievement Objectives• Position and orientation: Communicate and interpret locations and directions, using compass directions, distances, and grid references (Geometry and Measurement, level 4)
• Measurement: Interpret and use scales, timetables, and charts (Geometry and Measurement, level 4)
Mathematics StandardsThe approaches and thinking that students demonstrate as they engage with these tasks and problems can provide evidence in relation to the mathematics standards. For example:
• describe locations and give directions, using scales, bearings, and co-ordinates (year 8).
Developing students’ mathematical understandingGeometry is the study of shape, size, relative position, and space and is one of the oldest mathematical sciences. The literal meaning of geometry is to “measure the Earth”. The accuracy with which we measure depends on both our needs and the sophistication of the measuring tools available. The use of satellite technology has enabled us to pinpoint places on Earth with incredible speed and accuracy. In these activities, students explore trilateration, the process of fi nding a location using distance from known locations. They also explore different representations of co-ordinates.
Exploring the technology-related contextNavigation involves knowing one’s current position and planning a route that will end up at a desired destination. Early explorers used features in the environment to guide their vessels across large distances. Other explorers used maps (which were often inaccurate) and compasses.
Developments in GPS technology allow people to navigate a path to unknown destinations with accuracy and speed.
Vocabulary alerttechnological advances, innovations, satellite technology, accuracy, locate, Global Positioning System (GPS), GPS receiver, signals, orbiting, trilateration, geocache
Answers
Activity One
1. a.
b. If 2 “known distances” are used, there are 2 possible points where the swimming pool could be located because the circles meet in 2 places. If a third known distance is added, the 3 circles only have one common point of intersection.
c. Using the grid references in the example, the swimming pool is located in square K3.
2. a.–d. Practical activity
A
1
23
45
67
89
1011
1213
1415
C E G I K M O Q SB D F H J L N P R T Scale 1 Km
Shopping Mall
School
Home
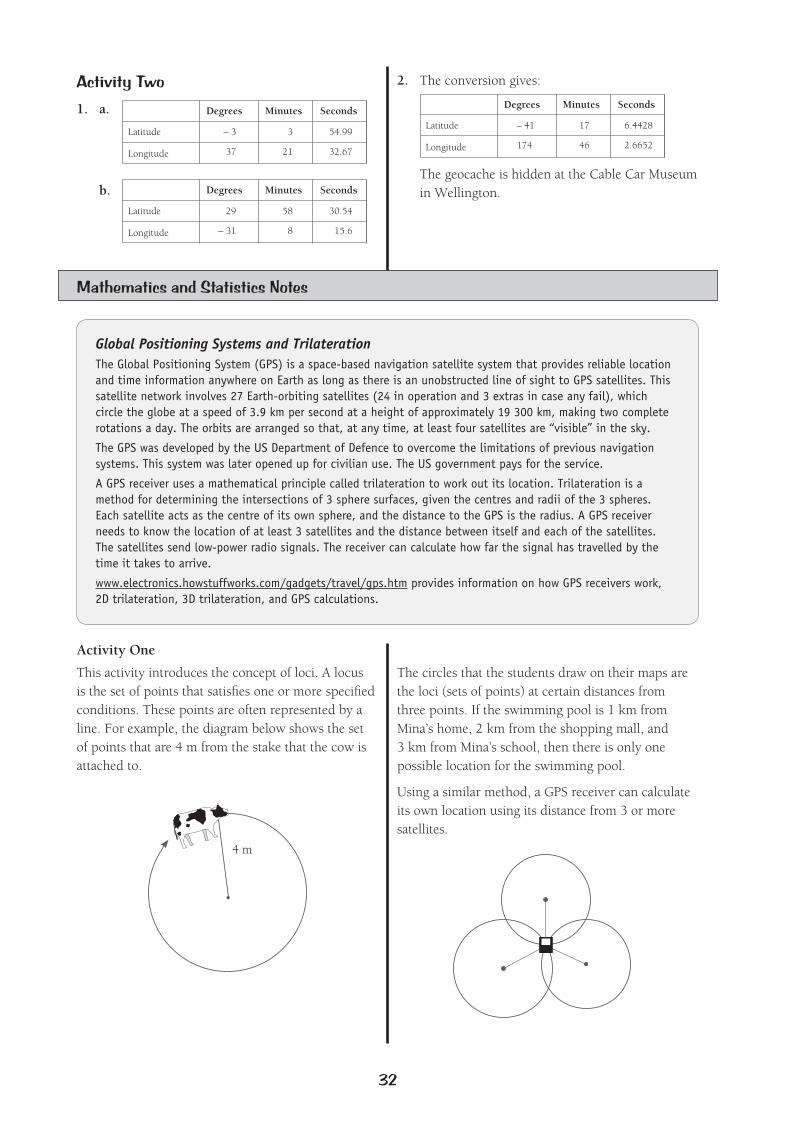
32
Activity Two
1. a.
Mathematics and Statistics Notes
Activity One
This activity introduces the concept of loci. A locus is the set of points that satisfi es one or more specifi ed conditions. These points are often represented by a line. For example, the diagram below shows the set of points that are 4 m from the stake that the cow is attached to.
Degrees
Degrees
Minutes
Minutes
Seconds
Seconds
Latitude
Latitude
– 3
29
3
58
54.99
30.54
37
– 31
21
8
32.67
15.6
Longitude
Longitude
Degrees Minutes Seconds
Latitude – 41 17 6.4428
174 46 2.6652Longitude
2. The conversion gives:
The geocache is hidden at the Cable Car Museum in Wellington.
Global Positioning Systems and TrilaterationThe Global Positioning System (GPS) is a space-based navigation satellite system that provides reliable location and time information anywhere on Earth as long as there is an unobstructed line of sight to GPS satellites. This satellite network involves 27 Earth-orbiting satellites (24 in operation and 3 extras in case any fail), which circle the globe at a speed of 3.9 km per second at a height of approximately 19 300 km, making two complete rotations a day. The orbits are arranged so that, at any time, at least four satellites are “visible” in the sky.
The GPS was developed by the US Department of Defence to overcome the limitations of previous navigation systems. This system was later opened up for civilian use. The US government pays for the service.
A GPS receiver uses a mathematical principle called trilateration to work out its location. Trilateration is a method for determining the intersections of 3 sphere surfaces, given the centres and radii of the 3 spheres. Each satellite acts as the centre of its own sphere, and the distance to the GPS is the radius. A GPS receiver needs to know the location of at least 3 satellites and the distance between itself and each of the satellites. The satellites send low-power radio signals. The receiver can calculate how far the signal has travelled by the time it takes to arrive.
www.electronics.howstuffworks.com/gadgets/travel/gps.htm provides information on how GPS receivers work, 2D trilateration, 3D trilateration, and GPS calculations.
The circles that the students draw on their maps are the loci (sets of points) at certain distances from three points. If the swimming pool is 1 km from Mina’s home, 2 km from the shopping mall, and 3 km from Mina’s school, then there is only one possible location for the swimming pool.
Using a similar method, a GPS receiver can calculate its own location using its distance from 3 or more satellites.
4 m
b.

33
Activity Two
You may like to have two students demonstrate the cube-locating activity to the class. Reinforce the link between this activity and the previous one. The pieces of string can be used to fi nd all points a specifi ed distance away from each chair leg. In this way, the string is the radius of a circle. The intersection of the three imaginary circles gives the correct location.
Activity Three
Additional information on geocaching is available at www.geocaching.com
The following website can be used for entering the geocache co-ordinates http://itouchmap.com/latlong.html. Explore the website yourself before using it with the class to make sure that you know how to enter the co-ordinates.
Extension
Explore loci with the class. In this activity, the students move around to form different loci. This is best done outside or in a large space.
Ask students to show the locus of points:
a. 2 metres away from a particular wall
b. 2 metres away from a fi xed point (a particular object placed on the fl oor)
c. 1 metre away from a line segment (a piece of rope placed on the ground)
d. at an equal distance from two lines (2 pieces of rope forming an angle)
e. an equal distance from two points.
Answers (the thinner line represents the position of the students):
walla. b. c.
d. e.
Working in groups with everyone contributing develops the key competency participating and contributing.
Students can draw sketches of loci in their books, creating stories to match each diagram. For example, a goat is tied to a 5-metre chain, which is attached to a peg in the fi eld. Sketch the locus of all points (the area of grass) that the goat can reach.
Technology-related student activities
• Research the history of GPS.
• Search for or hide a geocache.

34
Page 20: Transport Trends
Achievement Objectives• Statistical Investigation: Plan and conduct investigations using the statistical enquiry cycle:
– gathering, sorting, and displaying … whole-number data … to answer questions
– identifying trends in context, within and between data sets
– communicating fi ndings, using data displays (Statistics, level 3)
• Number strategies and knowledge: Find … percentages of amounts expressed as whole numbers, simple fractions, and decimals (Number and Algebra, level 4)
Mathematics StandardsThe approaches and thinking that students demonstrate as they engage with these tasks and problems can provide evidence in relation to the mathematics standards. For example:
• investigate summary, comparison, and relationship questions by using the statistical enquiry cycle:
− interpret results in context, accepting that samples vary (Statistics, year 6).
Developing students’ mathematical understanding Statistical thinking involves the exploration and use of patterns and relationships in data and comprises four key processes:
• describing data – connecting the information in a table or graph with a real-life context
• organising and reducing data – ordering, grouping, and summarising
• representing data – creating visual representations
• analysing and interpreting data – recognising patterns and trends and using them to make inferences and predictions.
Statistical enquiry is the process of exploring problems using an investigative cycle (for example, PPDAC: problem, plan, data, analysis, conclusion; see www.censusatschool.org.nz). Much of the value of a statistical investigation is lost if the focus is only on data gathering and making graphs. It is the stories that the graphs tell that are particularly valuable.
In these activities, the students investigate modes of transportation to school.
Exploring the technology-related contextAll forms of transportation need technology. Advances in transportation methods affect human interactions, for example, commerce and social relationships.
Many transportation techniques rely on fossil fuels. Increasing awareness of how these technologies affect the environment is leading some people to actively explore or use more sustainable alternatives.
Vocabulary alertmodes, preferences, public transport, personal preferences
Answers
Activity
1. Answers will vary. Some possible trends are: in 2008, there are more people driving and fewer passengers in cars, so more cars are on the road; fewer people are walking, cycling, and using public transport.
2. Answers will vary.

35
Statistical literacy is the ability to read and interpret data. Statistics provide the means to organise large amounts of data in such a way that it communicates meaning. However, by presenting statistical information in a simplifi ed form, it is possible to manipulate or misinterpret it.
Statistical information is seen as adding weight to a discussion because it is thought to be scientifi c. People often accept statistics without asking how data has been gathered or whether crucial information has been left out. Students need to be able to intelligently evaluate and interpret the statistical information they will encounter in everyday life.
Statistics play an important role in town planning. Analysing existing trends leads to more effective decision making and targeted policy development.
In this activity, students conduct a class survey and interpret statistical results to make inferences about the modes of transport students use to get to school. The students are required to plan and carry out an investigation and report fi ndings.
Activity
You may like to introduce this activity by encouraging your students to think about the different forms of transport available locally, how popular they are, and what impact they have on the environment.
Statistical Enquiry Cycle
Relate the questions in this activity to the statistical enquiry cycle (PPDAC). It is important to develop students’ statistical enquiry skills so they are aware of the decisions that need to be made when conducting an investigation and don’t simply follow steps as orchestrated by you as teacher.
Problem: What is it we are trying to fi nd out? For example, how do students get to school and how far do they travel?
Plan: How will we collect and record the data needed to answer the questions in question 2?
Data: Collect and record data.
Analysis: Calculate the percentage of car trips that were less than 5 km and compare it with the corresponding percentage from the Auckland study.
Conclusion: Comment on the trends in Sina’s data (question 1) and the class data; compare the two sets of data; discuss possible reasons for differences.
Students could use the Internet (www.wises.co.nz) to fi nd out how far away from school they live. Familiarise yourself with the website before asking the students to use it. It doesn’t matter if the website shows slightly different routes from those travelled by the students. Alternatively, give the students a map and ask them to use their ruler and the scale on the map to estimate what distance they travel to school.
Although students are not asked to display the results of their survey, they could do so. Creating visual representations of data develops the key competency using language, symbols, and texts.
Possible reasons why the students’ results may differ from Sina’s include, but are not limited to:
• The distance that students travel to get to school will be infl uenced by the catchment area of the school and whether the school is urban or rural.
• Sina’s survey is of adults. Year 5–8 students are too young to drive themselves to school.
• School buses are set up to take students directly to school. People travelling to work may not fi nd buses as convenient so may be more likely to drive.
Mathematics and Statistics Notes

36
Support for English Language Learners
Supporting students with the language for making comparisons
Language Focus: Making comparisons using adjectives and using nouns
Some students may benefi t from support with understanding and using language for making comparisons.
Before beginning the activity on page 20 of the student book, tell the students you are going to be comparing modes of transport used to get to work and school.
Explore the statistics for the number of people who drive and those who travel as passengers in cars. Ask the students to describe the statistics, prompting them to provide sentences comparing the two categories using nouns and adjectives, for example:
1. The percentage of people who drove in 1990 is higher than the percentage of people who were passengers.
2. The percentage of people who were passengers is lower than the percentage of people who drove.
3. In 1990, more people drove than were passengers in a car.
4. In 1990, fewer people were passengers in a car than drove a car.
Record the example sentences and underline the language used for making comparisons. Explain that adding -er and than is how we make comparisons with some adjectives. Co-construct more example sentences comparing the statistics, introducing the highest and the lowest.
Explore sentences 3 and 4 in the example above. Explain that we use more than and fewer than when we make comparisons with nouns. Note that we use less than rather than fewer than when the noun is uncountable. Co-construct more example sentences comparing the statistics and introducing most people.
Add another couple of examples and introduce sentences making comparisons between 1990 and 2008. Depending on the strengths and needs of your students, you could also introduce sentences with other adjectives such as popular and perhaps adverbials that further modify the meanings (for example, much more popular, far more popular, much less popular). You could put comparative forms of the adjectives onto a cline to illustrate the degrees they express (the least popular, less popular, popular, more popular, the most popular).
Have the students continue to discuss the trends in pairs and use the constructions above. If necessary, provide speaking frames like the ones below for some students to refer to.
The percentage of people who _____________ in _____________ is _____________ the percentage of people who _____________.
In _____________, _____________ people _____________ than _____________.
You may want to begin charts like the example below to help students understand and remember the rules for making comparisons with adjectives.
–er and –est double consonant + –er and –est
more and the mostless and the least
irregular
high, higher, highest big, bigger, biggest popular to more popular to the most popular
less popular to the least popular
good, better, best

37
Pages 21–24: Pedal Power
Achievement Objectives• Probability: Investigate situations that involve elements of chance by comparing experimental distributions
with expectations from models of the possible outcomes … (Statistics, level 4)
• Measurement: Interpret and use scales, timetables, and charts (Geometry and Measurement, level 4)
Mathematics StandardsThe approaches and thinking that students demonstrate as they engage with these tasks and problems can provide evidence in relation to the mathematics standards. For example:
• order the likelihood of outcomes for situations involving chance, checking for consistency between experimental results and models of all possible outcomes (Statistics, year 7).
Developing students’ mathematical understandingProbability is the likelihood of an event occurring, for example, the likelihood of throwing a 5 on a dice is 1/6. Experimental situations help students develop their understanding of chance and probability. Data-handling skills, such as gathering and organising data, also come into play. Meaningful learning takes place when a student’s intuitive understandings of probability are challenged by the results of an experiment.
Exploring the technology-related contextAll forms of transportation need technology. Advances in transportation methods affect human interactions, for example, commerce and social relationships.
Many transportation techniques rely on fossil fuels. Increasing awareness of how these technologies affect the environment is leading some people to actively explore or use more sustainable alternatives.
Transportation technology is not used only in forms of transport but also in technological control systems, such as traffi c lights.
Vocabulary alertconvenient, bicycle sharing, docking station, re-docked, charged, annual, minimum, planners, assigning
Answers
Activity One
1. Jane: $2.50 + $2 = $4.50Thomas: $2.50 + $0 = $2.50Steve: $2.50 + $10 = $12.50 Molly: $2.50 + $2 + $0 = $4.50
Technology-related student activities
• Debate the pros and cons of different modes of transport, or respond to starters such as “Nothing beats a bike” or “The 10 best things about the bus”.
• Research the development of a particular mode of transport, or a system within that mode, for example, sail development for ocean-going transport.
• Discuss what the world would be like if there were no cars.
2. a. 4 days. Buying 4 daily passes would be more expensive than buying a weekly pass. 4 x $2.50 = $10
b. 21 days. The cost of 20 daily passes is the same as an annual pass (20 x $2.50 = $50), but 21 days gives a free day (and each day after that is free).

38
1 2 3 4 5 6
Dice 2
Dice One
1 2 (1 + 1) 3 4 5 6 7
3
5
6
4
6
7
5
7
8
6
8
9
7
9
10
8
10
11
9
11
12
4 5 6 7 8 9 10
2 3 (2 + 1) 4 5 6 7 8
c. Nick should buy weekly passes. If he uses the bicycles most weekdays, the weekly pass is cheaper than buying 4 or 5 daily passes each week. 1 month is approximately 4 weeks. 4 weekly passes cost $32.00. This is cheaper than an annual pass.
Game
Practical activity
Activity Two
1. a.–c. Practical activity. Results will vary. It is likely that the totals 6, 7, and 8 were thrown most often.
2. a. Answers will vary.
b. There is likely to be some variation between individual results and the combined class results.
c. The combined class results are more useful. The more trials that are carried out, the closer the results will be to the actual probability or likelihood of getting each total.
3. a.
b. i. 7 ii. 2 and 12
c. Answers will vary, but it is likely that the totals that occurred least and most often in the combined class results will be the same as those that occurred least and most often in the table.
Activity Three
1. a. i. 27 ii. 11 iii. 7 iv. 7
b. Answers will vary. Planners need to consider: patterns of use, for example, stations positioned near a train station may need more bicycles than a station near a park; the expense of providing too many docks at a station that will not be used much.
2.–3. Practical activities

39
Mathematics and Statistics Notes
In these activities, students learn about a bicycle-sharing system and use experimental and theoretical probability to explore the likelihood of getting specifi c sums when two dice are thrown.
Activity One
Interpreting information from a table is an important everyday skill. Some students may forget to add the daily fee of $2.50 when working out the cost of the bicycle trips.
Game
Journeys can start and fi nish at the same station – this implies that the cyclist has completed a short errand.
At fi rst, students may spread their bicycles evenly across the stations. This may work, but the theoretical probabilities mean that some stations are more likely to be used than others. The game can be played again after investigating the probabilities in Activity Two. Discuss with the students how they could use the results of their investigation to improve the likelihood of success.
Activity Two
Probability can be a diffi cult concept for students to grasp. When two dice are thrown and the results added, several sums are possible. In this activity, students examine why some sums are more likely to be thrown than others.
Discuss the language of probability with the students.
When a pair of dice is thrown, there is no way to state with confi dence what the outcome will be. It could be any value between 2 and 12. However, some sums are more likely to occur than others. If we throw two dice 100 times, we would expect there to be more sums of 7 than sums of 2.
The likelihood of an event occurring (for example, getting a sum of 8) is the same as its probability.
In some cases, the theoretical probability of an event can be worked out by, for example, listing all the possible outcomes and seeing how many times the event is represented.
Experimental probability involves conducting a number of trials and using the results to estimate the probability of an event. The more trials we do, the closer the experimental probability will be to the theoretical probability (if this can be determined). This principle is sometimes referred to as the law of large numbers.
Reinforce to the students that although each number on a single dice has an equal chance of being thrown, when two dice are thrown the possible sums (2 – 12) are not equally likely.
Students are instructed to throw the two dice 40 times. The more trials they conduct, the more likely the results are to align with the theoretical probabilities. Combining the results of everyone in the class means that the number of trials increases dramatically.
It is important to link these three concepts:
• Students will each obtain their own unique set of results.
• When the results for the class are combined, a pattern will emerge. The combined results should refl ect the theoretical probabilities.
• While theoretical probabilities show which sums are more likely to be thrown, they do not enable us to confi dently predict a particular outcome or the set of results a particular student will get.
Probability is most useful when it comes to predicting long-term results. A frustrating aspect of probability is that, even if we know the theoretical probability of each sum, this knowledge may not help us predict what will happen in a short-term situation like a game. Throwing four 5s in a row is unlikely, but it’s not impossible. If students put more bicycles on stations 6, 7, and 8, they may have more successful trips, but then again, they may not. However, if all students take this approach, some students will have less successful journeys, but overall the class should have more successful journeys than if the bicycles had been distributed either randomly or equally. Investigate this with the class.

40
The Pedal Power game has some similarities to the board game Settlers of Catan. If your students have access to this game, encourage them to use their understanding of probability to decide where to place their game pieces.
Dealing with uncertainty and variation develops the key competency thinking.
Activity Three
In the previous version of the game, a bicycle could be placed at any of the stations, but in this new version, the station must have an available bicycle dock. Students allocate 16 docking spaces between all the stations.
Ask the students to discuss the question that Jun raises: Should they use the experimental results or the information in the “possible outcomes” table? Or is “chance” still the best bet?
Technology-related student activities
• Discuss whether a bicycle-sharing system would work in your area. Why or why not?
• Research the evolution of transportation control systems such as traffi c lights, railway switches, or air traffi c control.
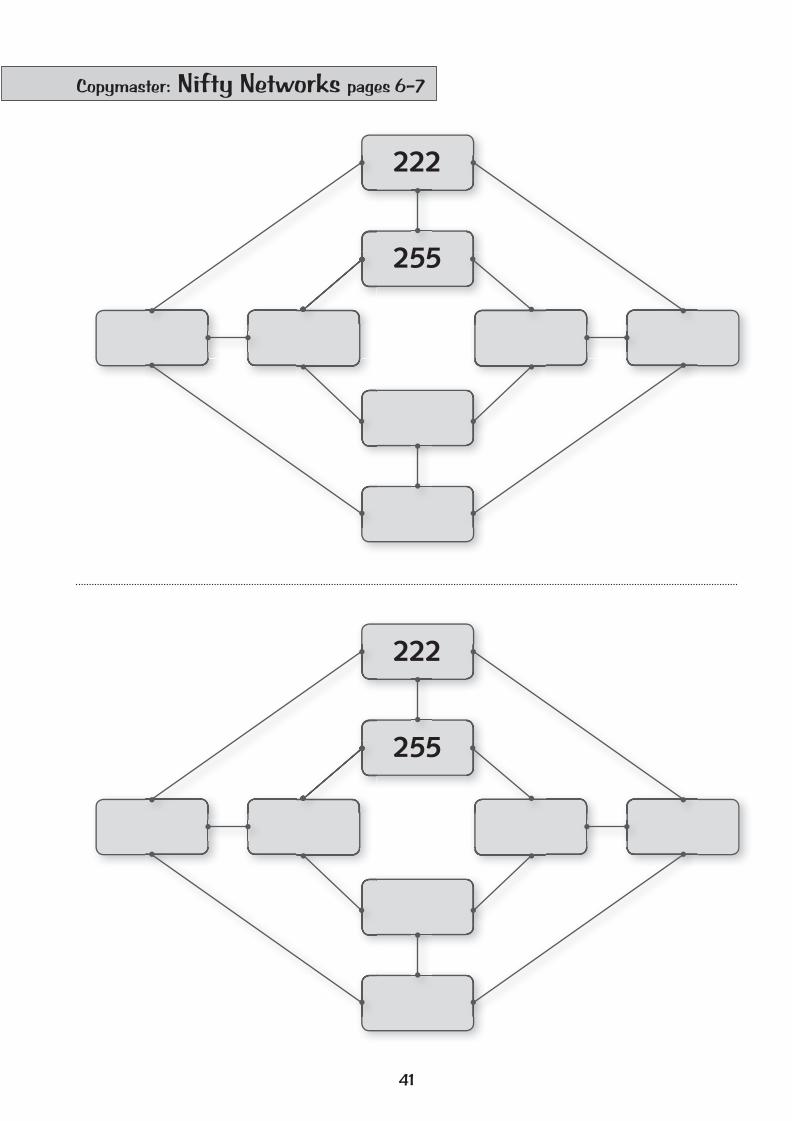
41
Copymaster: Nifty Networks pages 6–7
222
222
255
255
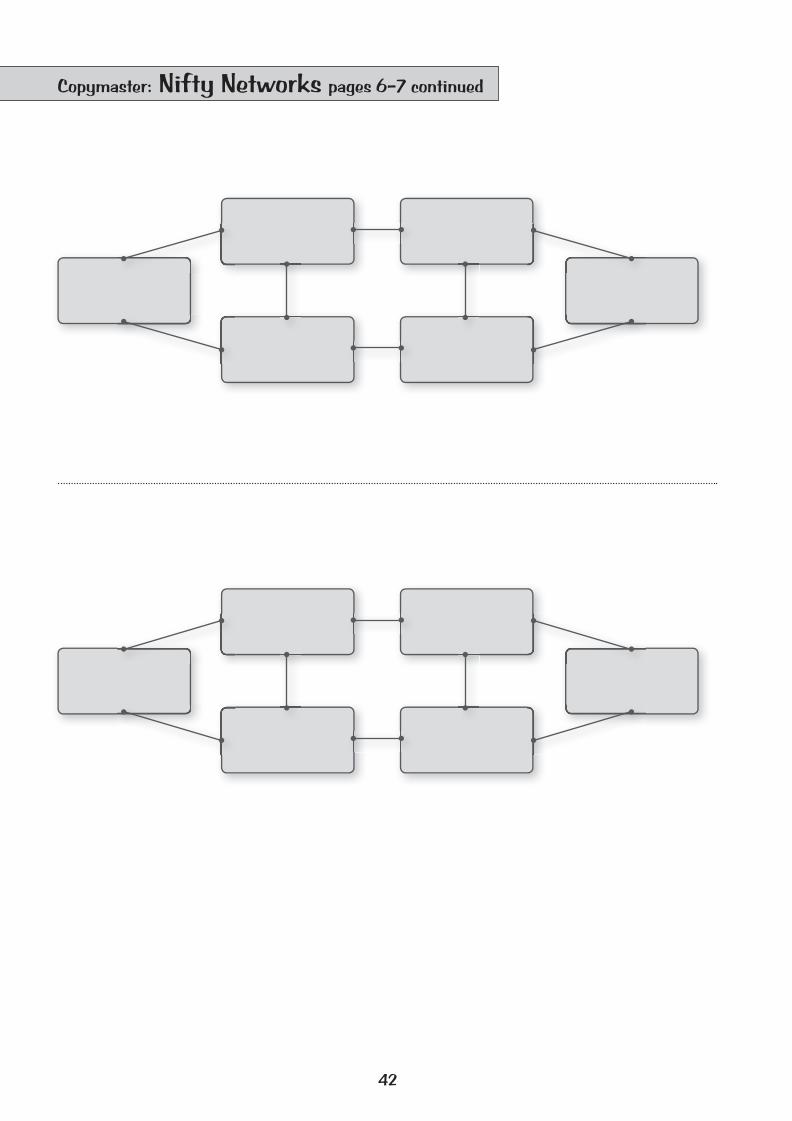
42
Copymaster: Nifty Networks pages 6–7 continued

43
Copymaster: Good Sport? pages 8–9
12
01900 1920 1940 1960 1980 2000 2020
Year
14
16
18
20
22
24
Tim
e (m
inut
es)
Men’s Olympic 1500 m Freestyle results (1912–2008)
40
0
1896 1916 1936 1956 1976 1996 2016
Year
45
50
55
60
65
70
Tim
e (s
econ
ds)
Men’s Olympic 100 m Freestyle results (1896 –2008)

44
Copymaster: Good Sport? pages 8–9 continued
World Swimming Records as at Oct 2011 (50 m course)
Women’s Events Time Name Date
50 m freestyle 23.73 Britta Steffen 2 August 2009
100 m freestyle 52.07 Britta Steffen 31 July 2009
200 m freestyle 1:52.98 Federica Pellegrini 29 July 2009
400 m freestyle 3:59.15 Federica Pellegrini 26 July 2009
800 m freestyle 8:14.10 Rebecca Adlington 16 August 2008
1 500 m freestyle 15:42.54 Kate Ziegler 17 June 2007
50 m backstroke 27.06 Zhao Jing 30 July 2009
100 m backstroke 58.12 Gemma Spofforth 28 July 2009
200 m backstroke 2:04.81 Kirsty Coventry 1 August 2009
50 m breaststroke 29.8 Jessica Hardy 7 August 2009
100 m breaststroke 1:04.45 Jessica Hardy 7 August 2009
200 m breaststroke 2:20.12 Annamay Pierse 30 July 2009
50 m butterfl y 25.07 Therese Alshammar 31 July 2009
100 m butterfl y 56.06 Sarah Sjöström 27 July 2009
200 m butterfl y 2:01.81 Liu Zige 21 October 2009
200 m individual medley 2:06.15 Ariana Kukors 27 July 2009
400 m individual medley 4:29.45 Stephanie Rice 10 August 2008
Men’s Records Time Name Date
50 m freestyle 20.91 César Cielo 18 December 2009
100 m freestyle 46.91 César Cielo 30 July 2009
200 m freestyle 1:42.00 Paul Biedermann 28 July 2009
400 m freestyle 3:40.07 Paul Biedermann 26 July 2009
800 m freestyle 7:32.12 Zhang Lin 29 July 2009
1 500 m freestyle 14:34.14 Sun Yang 31 July 2011
50 m backstroke 24.04 Liam Tancock 2 August 2009
100 m backstroke 51.94 Aaron Peirsol 8 July 2009
200 m backstroke 1:51.92 Aaron Peirsol 31 July 2009
50 m breaststroke 26.67 Cameron van der Burgh 29 July 2009
100 m breaststroke 58.58 Brenton Rickard 27 July 2009
200 m breaststroke 2:07.31 Christian Sprenger 30 July 2009
50 m butterfl y 22.43 Rafael Muñoz 5 April 2009
100 m butterfl y 49.82 Michael Phelps 1 August 2009
200 m butterfl y 1:51.51 Michael Phelps 29 July 2009
200 m individual medley 1:54.00 Ryan Lochte 28 July 2011
400 m individual medley 4:03.84 Michael Phelps 10 August 2008

45
Copymaster: Faceprints pages 10–11
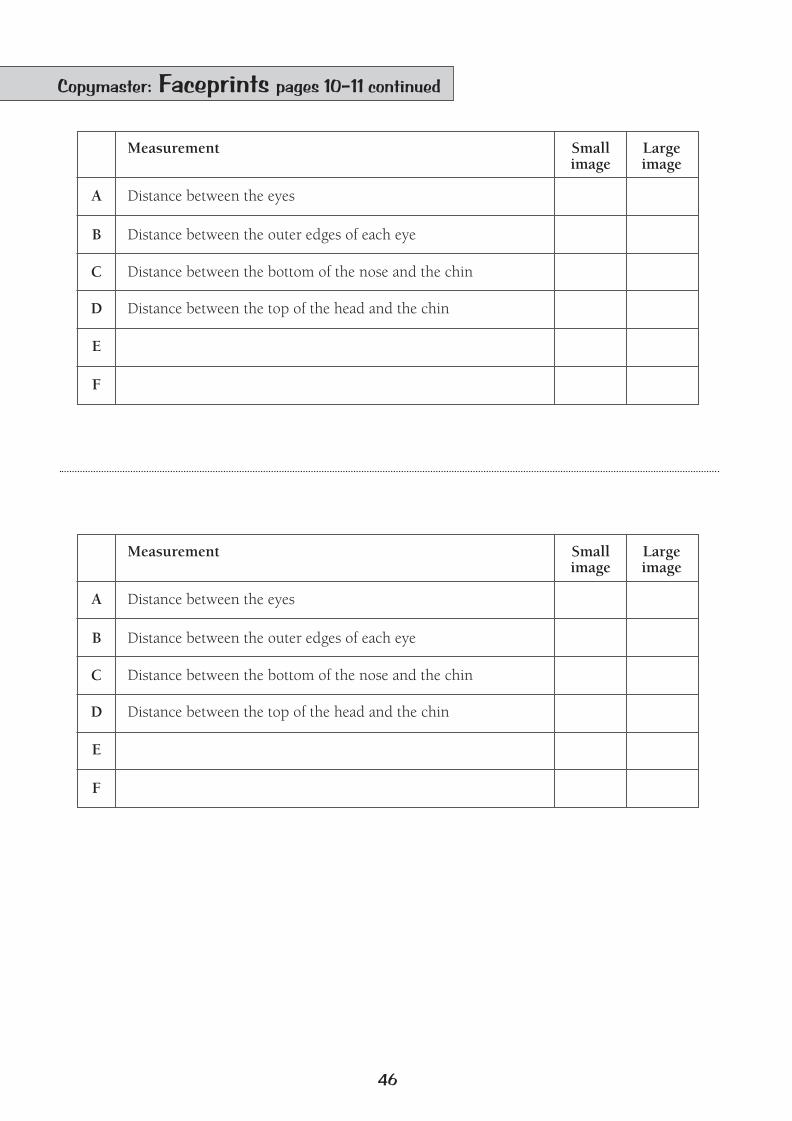
46
Copymaster: Faceprints pages 10–11 continued
Measurement
Measurement
Large image
Large image
Small image
Small image
A
A
B
B
C
C
D
D
E
E
F
F
Distance between the eyes
Distance between the eyes
Distance between the outer edges of each eye
Distance between the outer edges of each eye
Distance between the bottom of the nose and the chin
Distance between the bottom of the nose and the chin
Distance between the top of the head and the chin
Distance between the top of the head and the chin

47
Copymaster: Going Global pages 18–19
Scal
e 1
Km
Shop
ping
Mal
l
Scho
ol
Hom
e
Use
the
sca
le o
n th
e m
ap t
o se
t th
e w
idth
of y
our
com
pass
. T
he c
ross
es s
how
whe
re t
o pl
ace
the
com
pass
poi
nt.

48
Copymaster: Pedal Power pages 21–24
Sho
ps
Sch
ool
Hos
pita
l
2
5
87
69
11
4

49
Notes:


![FOCUS February 2003 FOCUS - Mathematical Association of ... · say exactly what I meant… [He asks] questions to draw out the answers. This technique thoroughly involves students](https://static.fdocuments.us/doc/165x107/5f0a9dea7e708231d42c82bf/focus-february-2003-focus-mathematical-association-of-say-exactly-what-i-meant.jpg)