Incidence of Genome Structure, DNA Asymmetry, and Cell
14
INVESTIGATION Incidence of Genome Structure, DNA Asymmetry, and Cell Physiology on T-DNA Integration in Chromosomes of the Phytopathogenic Fungus Leptosphaeria maculans Salim Bourras,* Michel Meyer,* Jonathan Grandaubert,* Nicolas Lapalu, † Isabelle Fudal,* Juliette Linglin,* Benedicte Ollivier,* Françoise Blaise,* Marie-Hélène Balesdent,* and Thierry Rouxel* ,1 *Institut National de la Recherche Agronomique (INRA), Research Unit 1290 BIOGER, F-78850 Thiverval-Grignon, France, and † INRA, Research Unit 1290 BIOGER, F-78026 Versailles Cedex, France ABSTRACT The ever-increasing generation of sequence data is accompanied by unsatisfactory functional annotation, and complex genomes, such as those of plants and filamentous fungi, show a large number of genes with no predicted or known function. For functional annotation of unknown or hypothetical genes, the production of collections of mutants using Agrobacterium tumefaciens–mediated transformation (ATMT) associated with genotyping and phenotyping has gained wide acceptance. ATMT is also widely used to identify pathogenicity determinants in pathogenic fungi. A systematic analysis of T-DNA borders was performed in an ATMT-mutagenized collection of the phytopathogenic fungus Leptosphaeria maculans to evaluate the features of T-DNA integration in its particular transposable element-rich com- partmentalized genome. A total of 318 T-DNA tags were recovered and analyzed for biases in chromo- some and genic compartments, existence of CG/AT skews at the insertion site, and occurrence of microhomologies between the T-DNA left border (LB) and the target sequence. Functional annotation of targeted genes was done using the Gene Ontology annotation. The T-DNA integration mainly tar- geted gene-rich, transcriptionally active regions, and it favored biological processes consistent with the physiological status of a germinating spore. T-DNA integration was strongly biased toward regulatory regions, and mainly promoters. Consistent with the T-DNA intranuclear-targeting model, the density of T-DNA insertion correlated with CG skew near the transcription initiation site. The existence of micro- homologies between promoter sequences and the T-DNA LB flanking sequence was also consistent with T-DNA integration to host DNA mediated by homologous recombination based on the microhomology- mediated end-joining pathway. KEYWORDS T-DNA mutagenesis Leptosphaeria maculans genome structure Gene Ontology The first eukaryotic (and fungal genome) to be sequenced was that of the budding yeast Saccharomyces cerevisiae (Goffeau et al. 1996). Since then, an ever-expanding number of fungal genomes has been made available, and the genome sequence of more than 300 isolates from more than 150 fungal species is currently available or in progress (http://cfgp.riceblast.snu.ac.kr/main.php; http://fungalgenomes.org/wiki/ Fungal_Genome_Links), with prospects for more fungal genome se- quencing, such as the 1000 fungal genome initiative (Grigoriev et al. 2011). Whereas high-throughput approaches, such as transcriptomics, proteomics, and comparative genomics between related species, have proved useful in eukaryotic genome annotation to predict the correct gene structure, functional annotation lags behind, and complex ge- nomes, such as those of plants and filamentous fungi, show a large number of genes with no predicted or known function [e.g., Arabidopsis Genome Initiative (2000)]. The dramatic increase in whole-genome Copyright © 2012 Bourras et al. doi: 10.1534/g3.112.002048 Manuscript received January 21, 2012; accepted for publication June 7, 2012 This is an open-access article distributed under the terms of the Creative Commons Attribution Unported License (http://creativecommons.org/licenses/ by/3.0/), which permits unrestricted use, distribution, and reproduction in any medium, provided the original work is properly cited. 1 Corresponding author: INRA, UR 1290 BIOGER, Avenue Lucien Brétignières, BP 01, F-78850 Thiverval-Grignon, France. E-mail: [email protected] Volume 2 | August 2012 | 891 Downloaded from https://academic.oup.com/g3journal/article/2/8/891/6028531 by guest on 16 January 2022
Transcript of Incidence of Genome Structure, DNA Asymmetry, and Cell
INVESTIGATION
Incidence of Genome Structure, DNA Asymmetry,and Cell Physiology on T-DNA Integration inChromosomes of the Phytopathogenic FungusLeptosphaeria maculansSalim Bourras,* Michel Meyer,* Jonathan Grandaubert,* Nicolas Lapalu,† Isabelle Fudal,*Juliette Linglin,* Benedicte Ollivier,* Françoise Blaise,* Marie-Hélène Balesdent,* and Thierry Rouxel*,1
*Institut National de la Recherche Agronomique (INRA), Research Unit 1290 BIOGER, F-78850 Thiverval-Grignon, France,and †INRA, Research Unit 1290 BIOGER, F-78026 Versailles Cedex, France
ABSTRACT The ever-increasing generation of sequence data is accompanied by unsatisfactory functionalannotation, and complex genomes, such as those of plants and filamentous fungi, show a large number ofgenes with no predicted or known function. For functional annotation of unknown or hypothetical genes,the production of collections of mutants using Agrobacterium tumefaciens–mediated transformation(ATMT) associated with genotyping and phenotyping has gained wide acceptance. ATMT is also widelyused to identify pathogenicity determinants in pathogenic fungi. A systematic analysis of T-DNA borderswas performed in an ATMT-mutagenized collection of the phytopathogenic fungus Leptosphaeriamaculans to evaluate the features of T-DNA integration in its particular transposable element-rich com-partmentalized genome. A total of 318 T-DNA tags were recovered and analyzed for biases in chromo-some and genic compartments, existence of CG/AT skews at the insertion site, and occurrence ofmicrohomologies between the T-DNA left border (LB) and the target sequence. Functional annotationof targeted genes was done using the Gene Ontology annotation. The T-DNA integration mainly tar-geted gene-rich, transcriptionally active regions, and it favored biological processes consistent with thephysiological status of a germinating spore. T-DNA integration was strongly biased toward regulatoryregions, and mainly promoters. Consistent with the T-DNA intranuclear-targeting model, the density ofT-DNA insertion correlated with CG skew near the transcription initiation site. The existence of micro-homologies between promoter sequences and the T-DNA LB flanking sequence was also consistent withT-DNA integration to host DNA mediated by homologous recombination based on the microhomology-mediated end-joining pathway.
KEYWORDS
T-DNAmutagenesisLeptosphaeriamaculans
genome structureGene Ontology
The first eukaryotic (and fungal genome) to be sequenced was that ofthe budding yeast Saccharomyces cerevisiae (Goffeau et al. 1996). Sincethen, an ever-expanding number of fungal genomes has been made
available, and the genome sequence of more than 300 isolates frommore than 150 fungal species is currently available or in progress(http://cfgp.riceblast.snu.ac.kr/main.php; http://fungalgenomes.org/wiki/Fungal_Genome_Links), with prospects for more fungal genome se-quencing, such as the 1000 fungal genome initiative (Grigoriev et al.2011). Whereas high-throughput approaches, such as transcriptomics,proteomics, and comparative genomics between related species, haveproved useful in eukaryotic genome annotation to predict the correctgene structure, functional annotation lags behind, and complex ge-nomes, such as those of plants and filamentous fungi, show a largenumber of genes with no predicted or known function [e.g., ArabidopsisGenome Initiative (2000)]. The dramatic increase in whole-genome
Copyright © 2012 Bourras et al.doi: 10.1534/g3.112.002048Manuscript received January 21, 2012; accepted for publication June 7, 2012This is an open-access article distributed under the terms of the CreativeCommons Attribution Unported License (http://creativecommons.org/licenses/by/3.0/), which permits unrestricted use, distribution, and reproduction in anymedium, provided the original work is properly cited.1Corresponding author: INRA, UR 1290 BIOGER, Avenue Lucien Brétignières, BP01, F-78850 Thiverval-Grignon, France. E-mail: [email protected]
Volume 2 | August 2012 | 891
Dow
nloaded from https://academ
ic.oup.com/g3journal/article/2/8/891/6028531 by guest on 16 January 2022
sequencing is thus accompanied by a dramatic difficulty to reach thefull biological value of the sequenced genomes with accurate iden-tification of the protein-coding genes, as well as the nature of thefunctional protein products. In yeast and in some model plants,such as Arabidopsis thaliana, this was partly achieved with theinvolvement of a wide community, which promoted the develop-ment of strain/line collections in which virtually every protein-coding gene in the genome was modified, for example, by deleting,tagging with green fluorescent protein (GFP), or engineering foroverexpression (Jones et al. 2008; Huh et al. 2003; Winzeler et al.1999; Alonso et al. 2003). Even with this wide involvement of theresearch community, ca. 1000 of 5796 (17%) of protein-encodinggenes in yeast and ca. one third of A. thaliana proteins still lacka functional annotation to date (Pena-Castillo and Hughes 2007;Kourmpetis et al. 2011).
Although the production of large collections of mutants with dis-rupted or inactivated genes associated with genotyping and phenotypinghas gained wide acceptance for functional annotation of unknown orhypothetical genes, this has only been developed in a few tractablemodel plant or fungal species, mainly using Agrobacterium tumefa-ciens–mediated transformation (ATMT) (Alonso et al. 2003; Michielseet al. 2005; Krishnan et al. 2009; Thole et al. 2010). Furthermore, thewhole-genome investigation for T-DNA tag distribution and thebiases linked with integration conditioning the possibility to reachsaturation mutagenesis has only been investigated for very few modelplant species [i.e., A. thaliana, rice, and Brachypodium distachyon(Alonso et al. 2003; Krishnan et al. 2009; Thole et al. 2010)], and onlyone phytopathogenic filamentous fungus, Magnaporthe oryzae (Choiet al. 2007; Meng et al. 2007).
Filamentous fungi, including M. oryzae, were first believed to havecompact genomes with very few repeated elements and repeat-rich ge-nomic regions. Filamentous fungi are amenable to ATMT (Michielseet al. 2005). Furthermore, biases linked with T-DNA integration in thegenome ofM. oryzae were indicated to be lower than in plants and theT-DNA integration was suggested to be “more canonical” than inplants (Choi et al. 2007). However, the sequencing of numerous fungalspecies indicates an extreme diversity of genomic complexity, genomesize, and genomic landscapes, ranging from those fungi with compactgenomes to fungi where massive transposable element (TE) invasiontook place, eventually resulting in genome sizes larger than that ofA. thaliana (e.g., Spanu et al. 2010). Filamentous fungi with complexgenomes also are characterized by compartmentalized, “two-speed”genomes in which specific compartments of the genome, usuallyTE-rich, are also enriched in genes involved in niche adaptation, suchas pathogenicity effectors in phytopathogenic fungi. Examples of thisencompass dispensable ‘B’ chromosomes of Fusarium (Ma et al.2010), TE-rich regions of the powdery mildew fungi (Spanu et al.2010), and AT-rich isochores comprising one third of the genomeof Leptosphaeria maculans (Rouxel et al. 2011). By comparison withM. oryzae, there is only preliminary information on how T-DNAintegration will happen in such genomes and how it will be useablefor saturation mutagenesis of genes involved in niche adaptation. Forexample, in the case of the fungal pathogen of oilseed rape, L. mac-ulans, analysis of 135 T-DNA integration events at a time when thegenome sequence was not available indicated T-DNA preferentiallyintegrated as a single copy in gene-rich regions of the fungal genome,but not in AT isochores (Blaise et al. 2007). The low frequency ofT-DNA tags corresponding to known or putative protein-codinggenes (19.3%) also suggested a probable bias toward intergenic and/orregulatory regions (Blaise et al. 2007). However, as underlined bysome authors (Meng et al. 2007), the absence of genome sequence for
L. maculans limited the analyses that could be performed (i.e., onfavored targets for T-DNA integration), and conclusions about thepossible bias toward promoter regions drawn by Blaise et al. (2007)could not be substantiated.
The objective of this article was to further evaluate the suitabilityof ATMT for random saturation mutagenesis in the compartmen-talized fungal genome of L. maculans and to further establish themechanism of T-DNA integration in fungal genomes, taking advan-tage of an increased collection of T-DNA–mutagenized isolates andavailability of the L. maculans genome sequence. One of the mainquestions to be addressed regarded the accessibility of AT isochoresof the genome and thus of genes involved in pathogenicity by theT-DNA. A total of 400 T-DNA tags were generated, and their patternof integration in the genome was investigated in terms of chromo-somal biases, distribution within chromosomes, distribution withinprotein-coding regions, and targeted motifs. In addition, a GeneOntology (GO) annotation was done and compared with that ofthe whole genome to identify possible insertion biases due to thephysiological stage of the germinating conidia at the time of ATMTprocess.
MATERIALS AND METHODS
Transformation of L. maculans germinating conidiaAll L. maculans transformants were issued from the A. tumefaciens–mediated transformation (ATMT) of the reference isolate v23.1.3(Attard et al. 2002) sequenced by Genoscope (Rouxel et al. 2011).Generation of the collection was described by Blaise et al. (2007)and increased for this study to ca. 5000 T-DNA–tagged lines.Briefly, ATMT was performed on germinating conidia using theA. tumefaciens strain C58pGV2260 harboring the binary vectorpBBH. The vector contains a hygromycin B resistance gene (hph)under the control of the Aspergillus nidulans gpdA promoter (Blaiseet al. 2007).
Definition of genome compartment for insertion ofT-DNA tagsL. maculans chromosomes were first compartmentalized based onnucleic acids composition in AT-rich and GC-equilibrated isochoresas described in Rouxel et al. (2011).
Following the automated annotation of the genome (Rouxel et al.2011) and regardless of the isochore structure of the genome, wegenerated four gene-centered collections of sequences: (i) codingregions, defined as sequences from start to stop codons, and furthersubdivided to introns and exons; (ii) gene-promoter regions; (iii) ter-minator regions; and (iv) intergenic regions, defined as the remaininggenomic sequences. Regulatory regions, and mainly promoters, areoften ill-defined in fungi. For this reason, when analyzing T-DNAtag position relative to genes in the M. oryzae genome, Meng et al.(2007) defined three sets of 500 bp, 750 bp, and 1000 bp for 59 pro-moter regions and downstream regulatory regions. However, the in-crease in size of regulatory regions did not drastically change thefeatures associated with the T-DNA–favored target (Meng et al.2007). In addition, the genome of L. maculans is more compact thanthat of M. oryzae in GC isochores [e.g., median size of intergenicregions in the case of head-to-tail ORFs is 670 bp (Rouxel et al.2011)]. We thus only investigated here one range of size for promotersand terminators: 500 bp upstream of gene start codons or downstreamof gene stop codons, respectively. Collections of gene-promoter, ter-minator, and intergenic regions were extracted using a Python script,departing from gene coordinates.
892 | Bourras et al.
Dow
nloaded from https://academ
ic.oup.com/g3journal/article/2/8/891/6028531 by guest on 16 January 2022
Recovery of T-DNA–flanking sequences and analysis ofT-DNA–targeted genesT-DNA–flanking sequences were recovered from genomic DNA bythermal asymmetric interlaced-PCR (tail-PCR) and PCR-walkingtechniques as described in Liu et al. (1995) and Balzergue et al.(2001), respectively. Sequencing was performed on PCR productsusing a Beckman Coulter CEQ 8000 automated sequencer (BeckmanCoulter, Fullerton, CA, USA) according to the manufacturer’s instruc-tions. All sequences were cured manually and aligned to L. maculansgenome sequence using BLASTn with a cutoff e-value of 1e210. Thelatter step was automated using a homemade script in Python. Theposition of an insertion site was defined as the position of the firstaligned nucleotide to a flanking sequence. All extracted positions weremapped and plotted on the L. maculans–assembled genome usinghomemade scripts in Python and R. Based on mapping of T-DNAinsertion sites, genes with a T-DNA tag in their promoter, terminator,or coding region were extracted, mapped, and analyzed for size, com-positional, and structural features. The latter step was automated usinghomemade scripts in Python.
Functional annotation using GOGO annotations of L. maculans–predicted genes were done withBlast2GO (Götz et al. 2008) as described in Rouxel et al. (2011).The NCBI “NR” database (October 16, 2009, release version) wasqueried with all predicted genes using BLAST algorithm version2.2.21 on the URGI high-throughput computing cluster (128 IntelXeon E5450). All genes were mapped according to GO, GeneInfo,Gene2accession, and PIR data, and then analyzed with Blast2GO,which applies GO annotations from BLAST search results. This pro-cess takes into account sequence similarity and the evidence code (EC)associated with GO annotations. Finally, GO annotations were en-riched using Annex and Interproscan data. In this work, we choseto use the “biological process” vocabulary for functional annotationand comparison between T-DNA–tagged genes and all genes of thegenome, because this GO vocabulary was found to better fit fungalbehavior when described from a physiological or phenotypical pointof view. In addition, it is the vocabulary for which the highest anno-tation number was obtained in yeast (Christie et al. 2009).
Statistical analysesBiases were assessed by calculating the standardized residuals betweenobserved and expected values as follows: SR¼ (Observed – Expected) /OExpected. SR calculation allows the detection of outlying observa-tions [i.e., those that appear to deviate from other members of thesample in which they occur (Grubbs 1969)]. In general, SR. 0 meansthe observed value is greater than expected, and by contrast, SR , 0
means the observed value is smaller than expected. To test whetherthe outlying observations deviate significantly from what is expected,the SR distribution following a normal distribution was estimatedusing the Kolmogorov-Smirnov test embedded in XLSTAT statisticalanalysis software version 2009.6.02 (with default parameters). There-fore, when the hypothesis of normal distribution was not rejected, SRexceeding the absolute value of 1.96 was considered a bias (i.e., sig-nificantly deviant from the rest of the data).
The Monte Carlo test on contingency tables was used as an alter-native to assess biases of T-DNA tags mapping. This nonparametrictest based on simulations assesses the independence between rows andcolumns. Then, when coupled with Fisher’s exact test, it determineswhether the difference between the observed and the theoretical valuesis significant. All calculations were performed using the appropriateXLSTAT function with default parameters.
The linear regression option of XLSTAT was used to model therelationships between data sets. A graphical output comprising theregression line and the 95% confidence intervals area was generatedusing the embedded function of the software.
RESULTS
Generation of the repertoire of T-DNA–flanking sequencesA subset of the collection of 5000 transformants of L. maculansobtained by ATMT was selected for sequencing the T-DNA insertionborders. Four-hundred sequences were obtained. Of these, 40 T-DNA–flanking sequences were generated by PCR walking (Balzergue et al.2001) and 360 by tail-PCR (Liu et al. 1995). BLASTn searches againstthe L. maculans genome indicated 33 sequences (8.25%) had no BLASThit (sequences too short for the BLASTn algorithm and sequencescorresponding to the bacterial vector). The remaining 367 sequenceswere filtered for ambiguous BLAST hits (poor homology below thecutoff e-value of 1e210), resulting in the final repertoire of 318 flankingsequences corresponding to single-locus T-DNA integration events inunique transformants. Of these, 217 sequences were obtained by se-quencing the left border (LB) of the T-DNA insertion, and 101 bysequencing its right border (RB).
Compartmentalization of the genome andT-DNA integrationsThe L. maculans genome is compartmentalized into two distinct ge-nomic landscapes: GC isochores (summing up 64% of the genomeand containing 95% of the genes) and AT isochores (summing up36% of the genome and 5% of the genes, but mainly consisting ofmosaics of inactivated and truncated TEs) (Rouxel et al. 2011). The
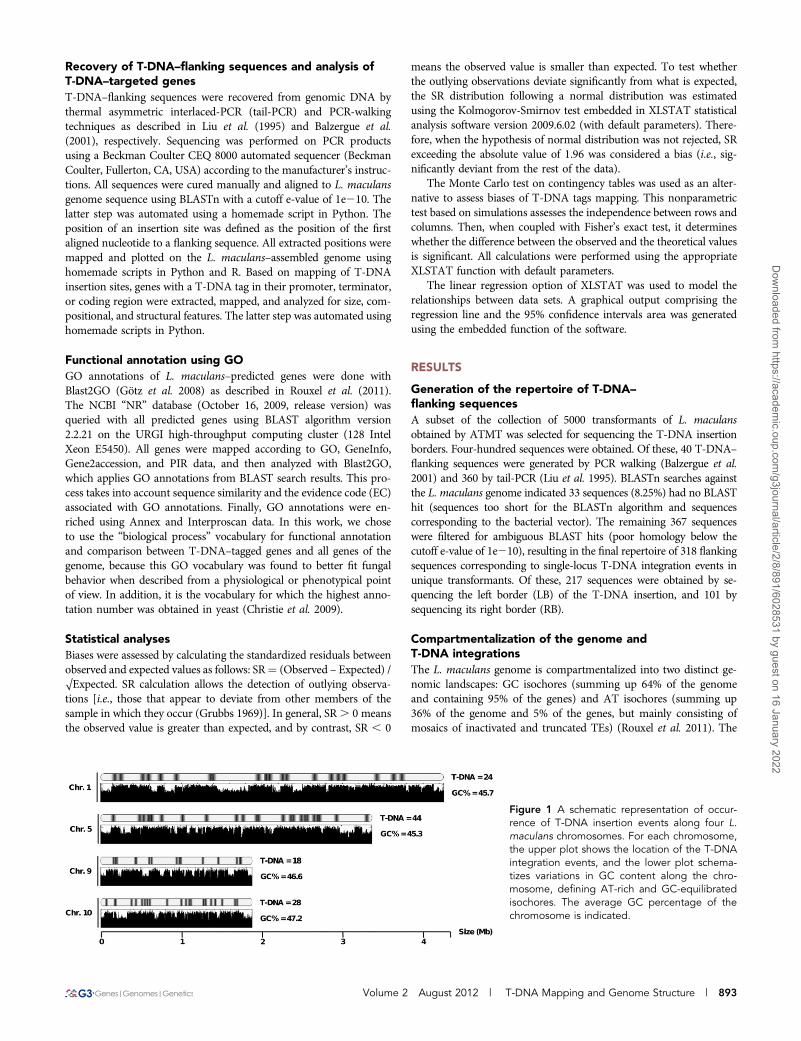
Figure 1 A schematic representation of occur-rence of T-DNA insertion events along four L.maculans chromosomes. For each chromosome,the upper plot shows the location of the T-DNAintegration events, and the lower plot schema-tizes variations in GC content along the chro-mosome, defining AT-rich and GC-equilibratedisochores. The average GC percentage of thechromosome is indicated.
Volume 2 August 2012 | T-DNA Mapping and Genome Structure | 893
Dow
nloaded from https://academ
ic.oup.com/g3journal/article/2/8/891/6028531 by guest on 16 January 2022
894 | Bourras et al.
Dow
nloaded from https://academ
ic.oup.com/g3journal/article/2/8/891/6028531 by guest on 16 January 2022
T-DNA insertions were graphically coincident to GC isochores in analmost systematic fashion (Figure 1), and 96.9% of T-DNA tags weremapped to GC isochores vs. only 3.1% that were mapped to ATisochores. AT isochores are further subdivided into three categories:telomeres (representing ca. 2% of the genome assembly); large-sizedisochores (13–325 kb, representing ca. 31% of the genome assembly)corresponding to complex mosaics of TEs; and mid-sized isochores(1–13 kb, summing up ca. 3% of the genome assembly) generallycorresponding to the insertion of a single TE within a GC isochore(Rouxel et al. 2011). The above-mentioned depletion of T-DNA in-tegration in AT isochores was mainly due to a very low amount ofintegrations in large AT isochores with only two cases observed(0.6%), whereas 1.6% of the tags were found in telomeres that maycontain active genes, including numerous copies of a RecQ telomere-linked helicase (Rouxel et al. 2011). No T-DNA tag was coincidentwith multiple loci in the genome, even in AT-rich compartments andtelomeres, due to sequence divergence generated by RIP acting onrepeated copies of TEs. Actually, even when mapping to a given TEfamily, the tag sequence, when unambiguous, was always sufficient toderive a single locus due to these sequence polymorphisms.
In addition to these two distinct compartments, the rDNA arraysumming up 1.7% of the genome assembly (Rouxel et al. 2011) wasalso underrepresented with no T-DNA tags targeting it.
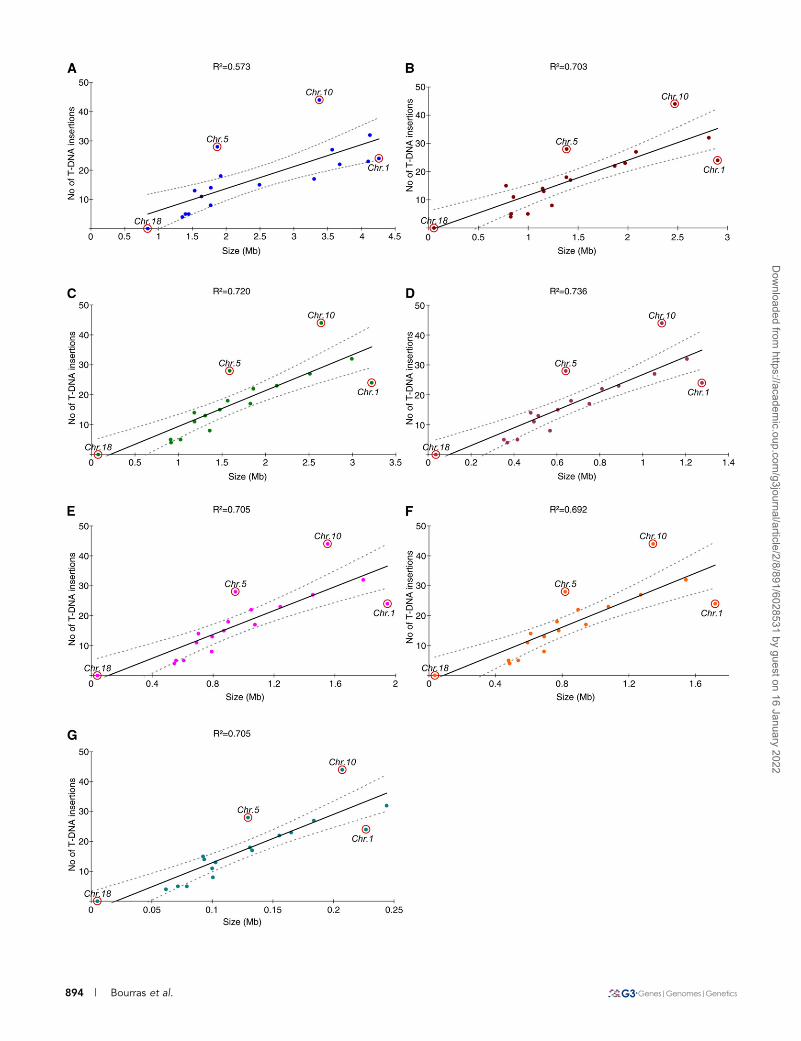
Chromosomal features and T-DNA integrationsThe number of T-DNA insertions per chromosome was thencompared with seven chromosomal features (Figure 2), and the dis-tribution of T-DNA insertions was plotted against each of these fea-tures. Globally, the number of T-DNA integrations was linearlycorrelated with all investigated features, but it better correlated withsize of the GC isochores within chromosomes (R2 ¼ 0.703) than with
total size of the chromosome (R2 ¼ 0.573). The favored insertion siteswere transcriptional regions (R2 ¼ 0.720), mainly regulatory regions(R2 ¼ 0.736) and introns (R2 ¼ 0.705) (Figure 2). Most chromosomes,except chromosomes 5, 10, and to a lesser extent, 1, showed sucha linear correlation between the number of T-DNA integrations andchromosomal features (see below).
Favored T-DNA insertion events in genic regionsNoticing that the chromosomal distribution of T-DNA tags wascorrelated to the size of gene-regulatory and gene-coding regionswithin chromosomes, we studied to what extent compartmentaliza-tion features are involved in profiling whole-genome T-DNA insertionoccurrence. In contrast to what is described in M. oryzae (Meng et al.2007; Choi et al. 2007), targeting of ORF was not significantly differentin L. maculans to what would be expected under the hypothesis ofrandom integration in the genome (Table 1). Biases assessment usingthe SR method showed that T-DNA insertions were less commonthan expected in intergenic regions (SR ¼ 26.67) and exons (SR ¼22.04) and more common in gene regulatory regions (SR ¼ 12.92)and gene introns (SR ¼ 4.24) (Table 1). Biases in favor of regulatoryregions were corroborated by the Monte-Carlo test. However, nosignificant bias was observed in intergenic regions and introns accord-ing to this analysis (data not shown).
Promoter features favoring T-DNA targetingBecause promoters are the main genomic regions in which T-DNAintegration occurred, we analyzed further promoter regions toinvestigate the involvement of host-DNA asymmetry and T-DNA–host-DNA shared microhomologies to favor the T-DNA targeting.Previous studies noticed an increased CG skew around transcriptionstart site in A. thaliana and other eukaryotes (Tatarinova et al. 2003).
Figure 2 Correlation between the number of T-DNA integrations and chromosomal features. The features investigated for each chromosomewere (A) chromosome size; (B) total size of the GC isochores; (C) total size of the transcriptional regions [defined as the sum of regulatorysequences (promoter + terminator) and gene-coding sequences (exons + introns)]; (D) total size of the regulatory regions (defined as the sum ofpromoter and terminator sequences); (E) total size of gene-coding regions (defined as the sum of exonic and intronic sequences); (F) total size ofthe exonic sequences; and (G) total size of the intronic sequences. Regression curves and the 95% confidence intervals are plotted in continuousand discontinuous lines, respectively.
n Table 1 Distribution of T-DNA insertion events within L. maculans genomic regions
Genomic Regions T-DNA Insertion Events
Type Size (Mb) % Genome Observed Expecteda SRb
Regulatoryc 11.8 26 200 83 12.9259 promotingc 5.9 13 122 41 12.6439 terminatingc 5.9 13 78 41 5.77Codingc 17.6 39 119 123 20.37Exons 15.3 34 86 107 22.04Introns 2.3 5 33 16 4.24Sharedc — — 41 —
Intergenicc 15.7 35 40 110 26.67aExpected number of T-DNA integration events (T-IE) [= (T-IE genomic density) · (genomic region size)]. Values were approximated to thenearest integer.
bStandardized residues. We considered a normal distribution of SRs because we cannot reject the null hypothesis as revealed by theKolmogorov-Smirnov test (P-value ¼ 0.976, a ¼ 0.05).
cRegulatory regions, defined as the sum of promoting and terminating regions of the 12,469 predicted genes of L. maculans; Gene-promoting regions, 500 bp upstream of the start codon; Gene-terminating regions, 500 bp downstream of the stop codon; Gene-codingregions, from start to stop codons, including introns; Shared, common regulatory regions shared by two head-to-tail nearby genes;Intergenic, genomic regions corresponding to none of the previous criteria. Note that overlaps between compartments may occur, leadingto a total number of sequences higher than 318.
Volume 2 August 2012 | T-DNA Mapping and Genome Structure | 895
Dow
nloaded from https://academ
ic.oup.com/g3journal/article/2/8/891/6028531 by guest on 16 January 2022
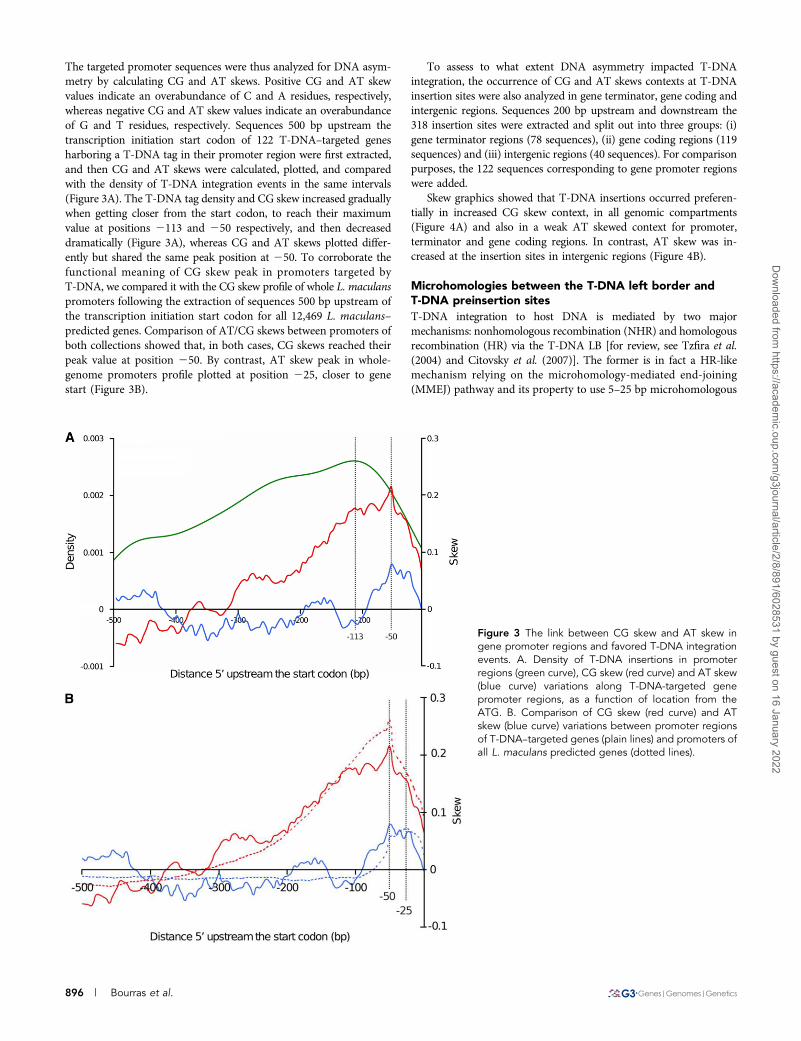
The targeted promoter sequences were thus analyzed for DNA asym-metry by calculating CG and AT skews. Positive CG and AT skewvalues indicate an overabundance of C and A residues, respectively,whereas negative CG and AT skew values indicate an overabundanceof G and T residues, respectively. Sequences 500 bp upstream thetranscription initiation start codon of 122 T-DNA–targeted genesharboring a T-DNA tag in their promoter region were first extracted,and then CG and AT skews were calculated, plotted, and comparedwith the density of T-DNA integration events in the same intervals(Figure 3A). The T-DNA tag density and CG skew increased graduallywhen getting closer from the start codon, to reach their maximumvalue at positions 2113 and 250 respectively, and then decreaseddramatically (Figure 3A), whereas CG and AT skews plotted differ-ently but shared the same peak position at 250. To corroborate thefunctional meaning of CG skew peak in promoters targeted byT-DNA, we compared it with the CG skew profile of whole L. maculanspromoters following the extraction of sequences 500 bp upstream ofthe transcription initiation start codon for all 12,469 L. maculans–predicted genes. Comparison of AT/CG skews between promoters ofboth collections showed that, in both cases, CG skews reached theirpeak value at position 250. By contrast, AT skew peak in whole-genome promoters profile plotted at position 225, closer to genestart (Figure 3B).
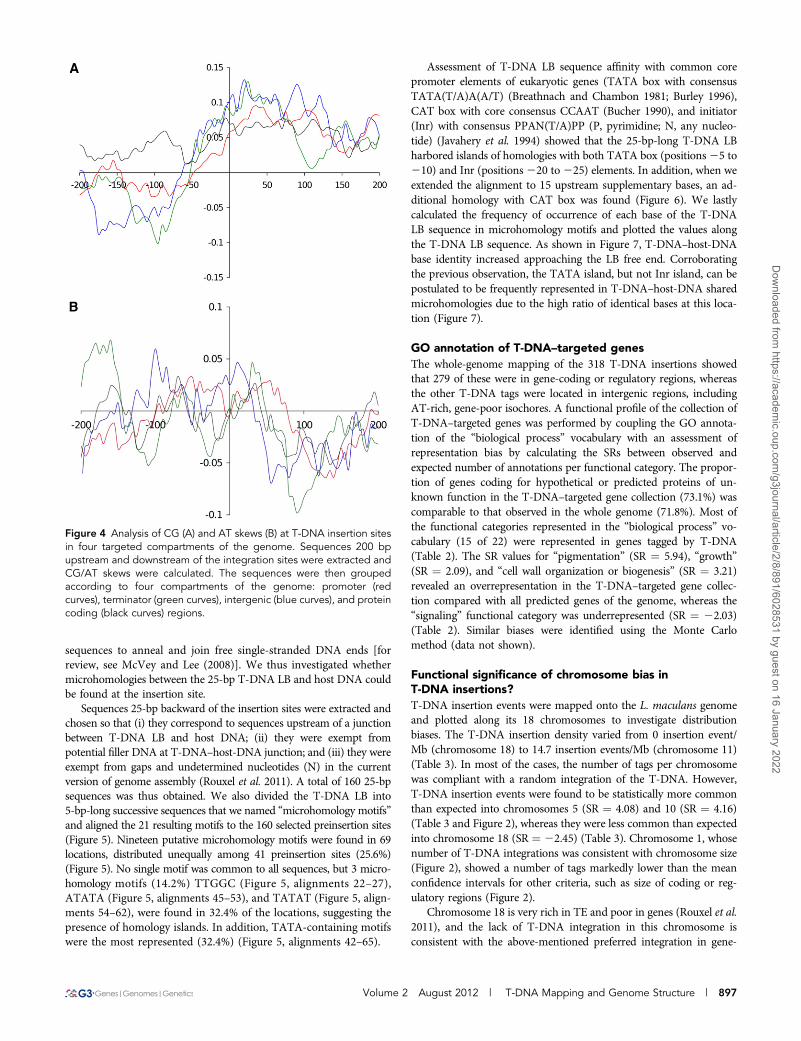
To assess to what extent DNA asymmetry impacted T-DNAintegration, the occurrence of CG and AT skews contexts at T-DNAinsertion sites were also analyzed in gene terminator, gene coding andintergenic regions. Sequences 200 bp upstream and downstream the318 insertion sites were extracted and split out into three groups: (i)gene terminator regions (78 sequences), (ii) gene coding regions (119sequences) and (iii) intergenic regions (40 sequences). For comparisonpurposes, the 122 sequences corresponding to gene promoter regionswere added.
Skew graphics showed that T-DNA insertions occurred preferen-tially in increased CG skew context, in all genomic compartments(Figure 4A) and also in a weak AT skewed context for promoter,terminator and gene coding regions. In contrast, AT skew was in-creased at the insertion sites in intergenic regions (Figure 4B).
Microhomologies between the T-DNA left border andT-DNA preinsertion sitesT-DNA integration to host DNA is mediated by two majormechanisms: nonhomologous recombination (NHR) and homologousrecombination (HR) via the T-DNA LB [for review, see Tzfira et al.(2004) and Citovsky et al. (2007)]. The former is in fact a HR-likemechanism relying on the microhomology-mediated end-joining(MMEJ) pathway and its property to use 5–25 bp microhomologous
Figure 3 The link between CG skew and AT skew ingene promoter regions and favored T-DNA integrationevents. A. Density of T-DNA insertions in promoterregions (green curve), CG skew (red curve) and AT skew(blue curve) variations along T-DNA-targeted genepromoter regions, as a function of location from theATG. B. Comparison of CG skew (red curve) and ATskew (blue curve) variations between promoter regionsof T-DNA–targeted genes (plain lines) and promoters ofall L. maculans predicted genes (dotted lines).
896 | Bourras et al.
Dow
nloaded from https://academ
ic.oup.com/g3journal/article/2/8/891/6028531 by guest on 16 January 2022
sequences to anneal and join free single-stranded DNA ends [forreview, see McVey and Lee (2008)]. We thus investigated whethermicrohomologies between the 25-bp T-DNA LB and host DNA couldbe found at the insertion site.
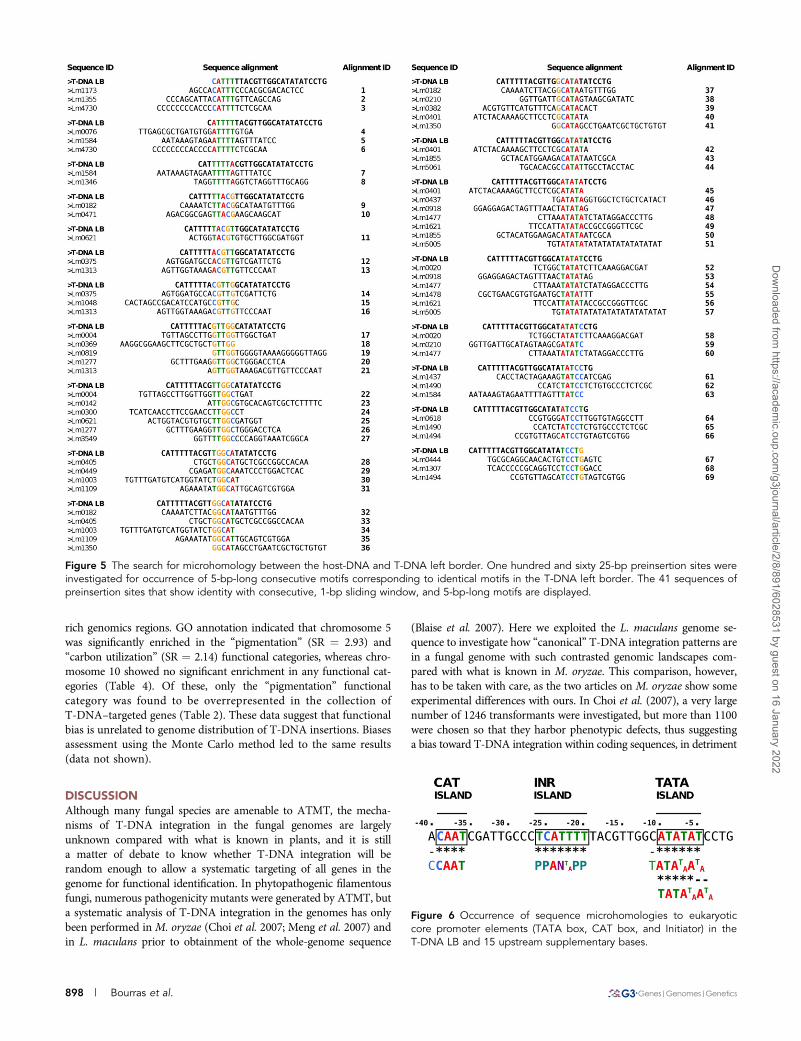
Sequences 25-bp backward of the insertion sites were extracted andchosen so that (i) they correspond to sequences upstream of a junctionbetween T-DNA LB and host DNA; (ii) they were exempt frompotential filler DNA at T-DNA–host-DNA junction; and (iii) they wereexempt from gaps and undetermined nucleotides (N) in the currentversion of genome assembly (Rouxel et al. 2011). A total of 160 25-bpsequences was thus obtained. We also divided the T-DNA LB into5-bp-long successive sequences that we named “microhomology motifs”and aligned the 21 resulting motifs to the 160 selected preinsertion sites(Figure 5). Nineteen putative microhomology motifs were found in 69locations, distributed unequally among 41 preinsertion sites (25.6%)(Figure 5). No single motif was common to all sequences, but 3 micro-homology motifs (14.2%) TTGGC (Figure 5, alignments 22–27),ATATA (Figure 5, alignments 45–53), and TATAT (Figure 5, align-ments 54–62), were found in 32.4% of the locations, suggesting thepresence of homology islands. In addition, TATA-containing motifswere the most represented (32.4%) (Figure 5, alignments 42–65).
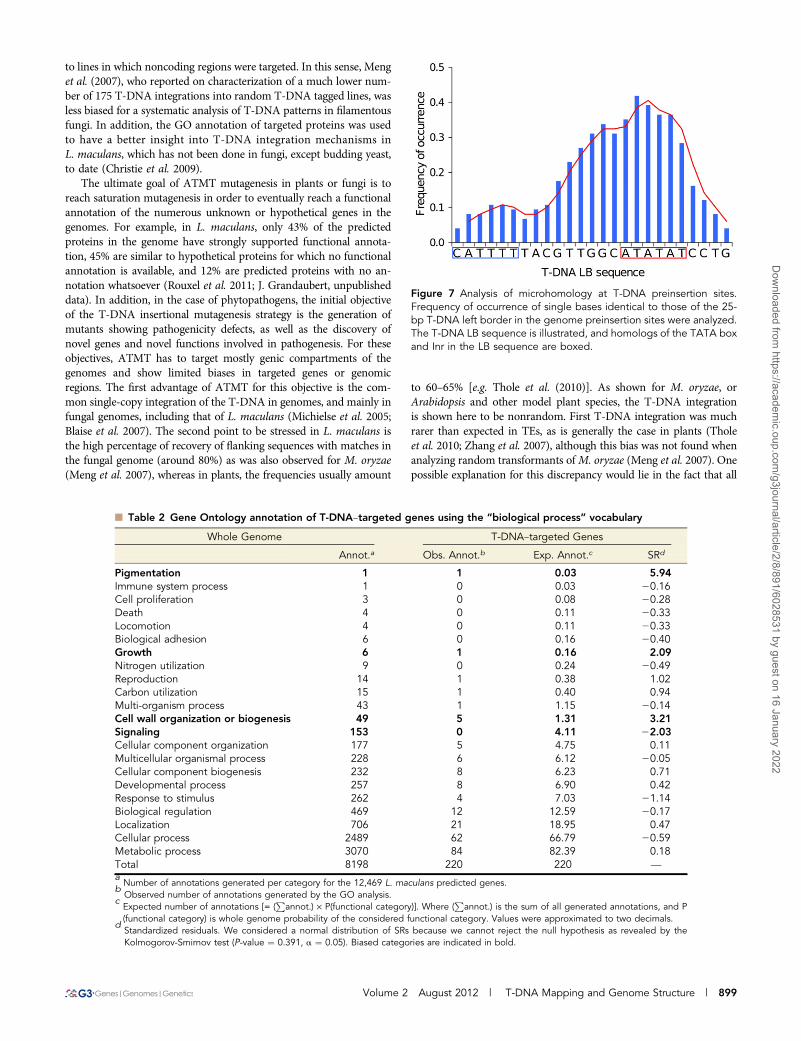
Assessment of T-DNA LB sequence affinity with common corepromoter elements of eukaryotic genes (TATA box with consensusTATA(T/A)A(A/T) (Breathnach and Chambon 1981; Burley 1996),CAT box with core consensus CCAAT (Bucher 1990), and initiator(Inr) with consensus PPAN(T/A)PP (P, pyrimidine; N, any nucleo-tide) (Javahery et al. 1994) showed that the 25-bp-long T-DNA LBharbored islands of homologies with both TATA box (positions25 to210) and Inr (positions220 to225) elements. In addition, when weextended the alignment to 15 upstream supplementary bases, an ad-ditional homology with CAT box was found (Figure 6). We lastlycalculated the frequency of occurrence of each base of the T-DNALB sequence in microhomology motifs and plotted the values alongthe T-DNA LB sequence. As shown in Figure 7, T-DNA–host-DNAbase identity increased approaching the LB free end. Corroboratingthe previous observation, the TATA island, but not Inr island, can bepostulated to be frequently represented in T-DNA–host-DNA sharedmicrohomologies due to the high ratio of identical bases at this loca-tion (Figure 7).
GO annotation of T-DNA–targeted genesThe whole-genome mapping of the 318 T-DNA insertions showedthat 279 of these were in gene-coding or regulatory regions, whereasthe other T-DNA tags were located in intergenic regions, includingAT-rich, gene-poor isochores. A functional profile of the collection ofT-DNA–targeted genes was performed by coupling the GO annota-tion of the “biological process” vocabulary with an assessment ofrepresentation bias by calculating the SRs between observed andexpected number of annotations per functional category. The propor-tion of genes coding for hypothetical or predicted proteins of un-known function in the T-DNA–targeted gene collection (73.1%) wascomparable to that observed in the whole genome (71.8%). Most ofthe functional categories represented in the “biological process” vo-cabulary (15 of 22) were represented in genes tagged by T-DNA(Table 2). The SR values for “pigmentation” (SR ¼ 5.94), “growth”(SR ¼ 2.09), and “cell wall organization or biogenesis” (SR ¼ 3.21)revealed an overrepresentation in the T-DNA–targeted gene collec-tion compared with all predicted genes of the genome, whereas the“signaling” functional category was underrepresented (SR ¼ 22.03)(Table 2). Similar biases were identified using the Monte Carlomethod (data not shown).
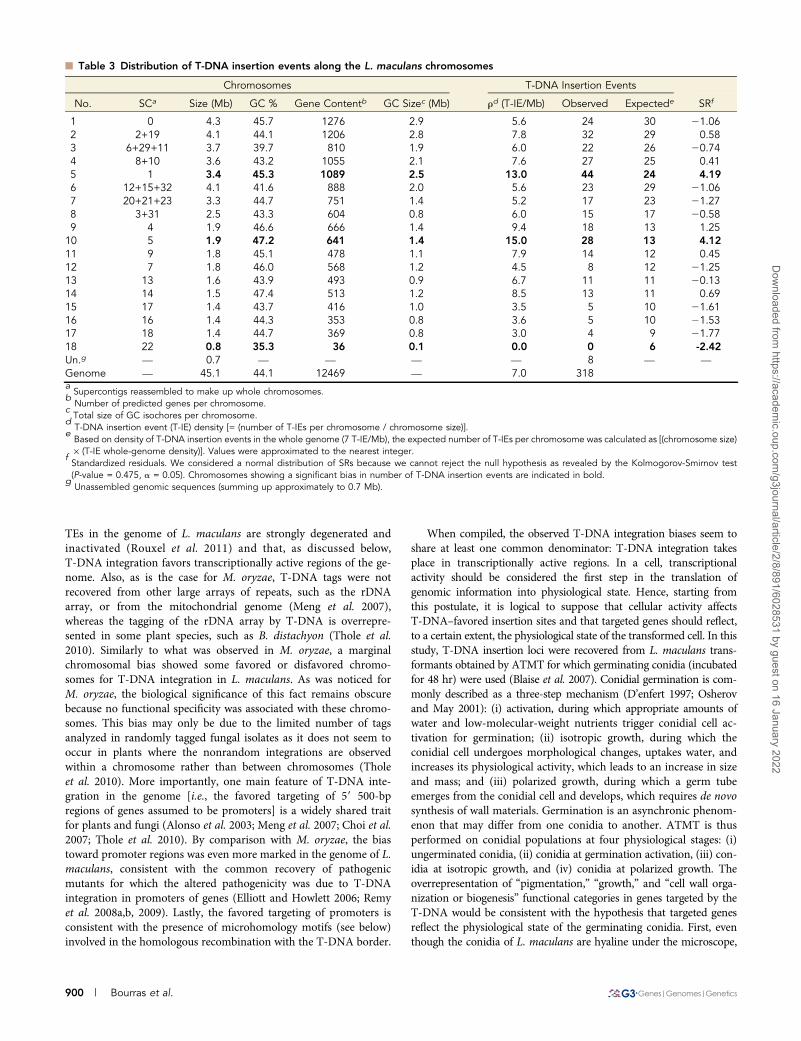
Functional significance of chromosome bias inT-DNA insertions?T-DNA insertion events were mapped onto the L. maculans genomeand plotted along its 18 chromosomes to investigate distributionbiases. The T-DNA insertion density varied from 0 insertion event/Mb (chromosome 18) to 14.7 insertion events/Mb (chromosome 11)(Table 3). In most of the cases, the number of tags per chromosomewas compliant with a random integration of the T-DNA. However,T-DNA insertion events were found to be statistically more commonthan expected into chromosomes 5 (SR ¼ 4.08) and 10 (SR ¼ 4.16)(Table 3 and Figure 2), whereas they were less common than expectedinto chromosome 18 (SR ¼ 22.45) (Table 3). Chromosome 1, whosenumber of T-DNA integrations was consistent with chromosome size(Figure 2), showed a number of tags markedly lower than the meanconfidence intervals for other criteria, such as size of coding or reg-ulatory regions (Figure 2).
Chromosome 18 is very rich in TE and poor in genes (Rouxel et al.2011), and the lack of T-DNA integration in this chromosome isconsistent with the above-mentioned preferred integration in gene-
Figure 4 Analysis of CG (A) and AT skews (B) at T-DNA insertion sitesin four targeted compartments of the genome. Sequences 200 bpupstream and downstream of the integration sites were extracted andCG/AT skews were calculated. The sequences were then groupedaccording to four compartments of the genome: promoter (redcurves), terminator (green curves), intergenic (blue curves), and proteincoding (black curves) regions.
Volume 2 August 2012 | T-DNA Mapping and Genome Structure | 897
Dow
nloaded from https://academ
ic.oup.com/g3journal/article/2/8/891/6028531 by guest on 16 January 2022
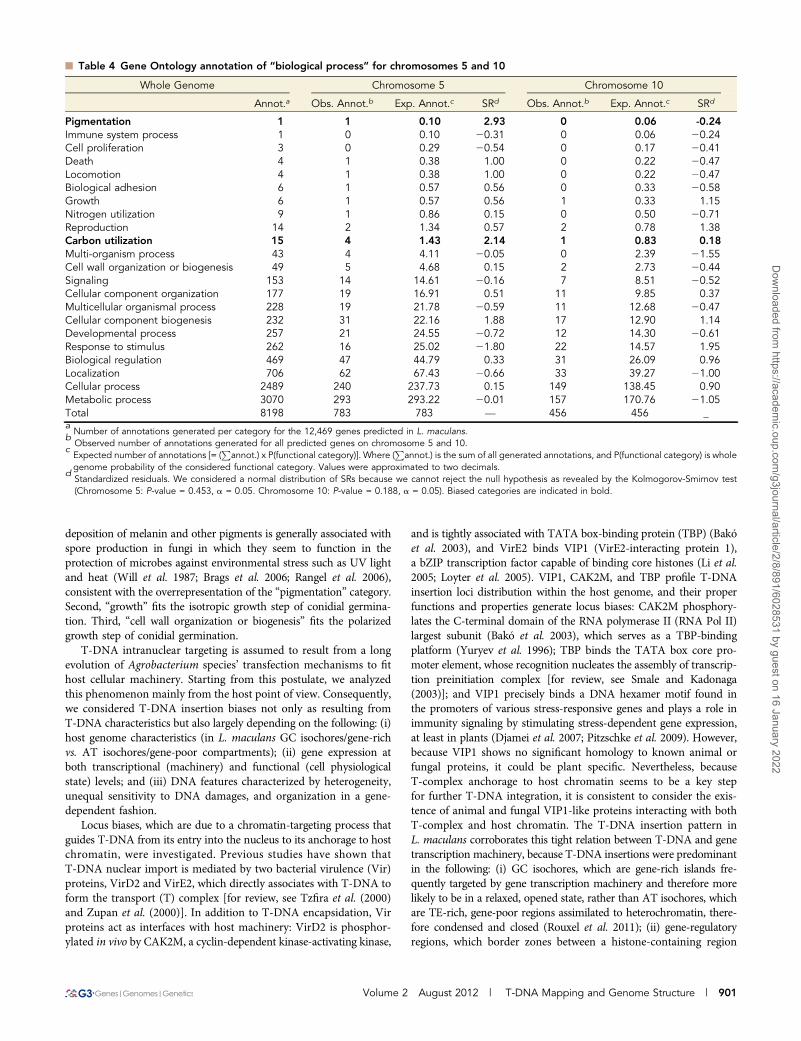
rich genomics regions. GO annotation indicated that chromosome 5was significantly enriched in the “pigmentation” (SR ¼ 2.93) and“carbon utilization” (SR ¼ 2.14) functional categories, whereas chro-mosome 10 showed no significant enrichment in any functional cat-egories (Table 4). Of these, only the “pigmentation” functionalcategory was found to be overrepresented in the collection ofT-DNA–targeted genes (Table 2). These data suggest that functionalbias is unrelated to genome distribution of T-DNA insertions. Biasesassessment using the Monte Carlo method led to the same results(data not shown).
DISCUSSIONAlthough many fungal species are amenable to ATMT, the mecha-nisms of T-DNA integration in the fungal genomes are largelyunknown compared with what is known in plants, and it is stilla matter of debate to know whether T-DNA integration will berandom enough to allow a systematic targeting of all genes in thegenome for functional identification. In phytopathogenic filamentousfungi, numerous pathogenicity mutants were generated by ATMT, buta systematic analysis of T-DNA integration in the genomes has onlybeen performed in M. oryzae (Choi et al. 2007; Meng et al. 2007) andin L. maculans prior to obtainment of the whole-genome sequence
(Blaise et al. 2007). Here we exploited the L. maculans genome se-quence to investigate how “canonical” T-DNA integration patterns arein a fungal genome with such contrasted genomic landscapes com-pared with what is known in M. oryzae. This comparison, however,has to be taken with care, as the two articles on M. oryzae show someexperimental differences with ours. In Choi et al. (2007), a very largenumber of 1246 transformants were investigated, but more than 1100were chosen so that they harbor phenotypic defects, thus suggestinga bias toward T-DNA integration within coding sequences, in detriment
Figure 5 The search for microhomology between the host-DNA and T-DNA left border. One hundred and sixty 25-bp preinsertion sites wereinvestigated for occurrence of 5-bp-long consecutive motifs corresponding to identical motifs in the T-DNA left border. The 41 sequences ofpreinsertion sites that show identity with consecutive, 1-bp sliding window, and 5-bp-long motifs are displayed.
Figure 6 Occurrence of sequence microhomologies to eukaryoticcore promoter elements (TATA box, CAT box, and Initiator) in theT-DNA LB and 15 upstream supplementary bases.
898 | Bourras et al.
Dow
nloaded from https://academ
ic.oup.com/g3journal/article/2/8/891/6028531 by guest on 16 January 2022
to lines in which noncoding regions were targeted. In this sense, Menget al. (2007), who reported on characterization of a much lower num-ber of 175 T-DNA integrations into random T-DNA tagged lines, wasless biased for a systematic analysis of T-DNA patterns in filamentousfungi. In addition, the GO annotation of targeted proteins was usedto have a better insight into T-DNA integration mechanisms inL. maculans, which has not been done in fungi, except budding yeast,to date (Christie et al. 2009).
The ultimate goal of ATMT mutagenesis in plants or fungi is toreach saturation mutagenesis in order to eventually reach a functionalannotation of the numerous unknown or hypothetical genes in thegenomes. For example, in L. maculans, only 43% of the predictedproteins in the genome have strongly supported functional annota-tion, 45% are similar to hypothetical proteins for which no functionalannotation is available, and 12% are predicted proteins with no an-notation whatsoever (Rouxel et al. 2011; J. Grandaubert, unpublisheddata). In addition, in the case of phytopathogens, the initial objectiveof the T-DNA insertional mutagenesis strategy is the generation ofmutants showing pathogenicity defects, as well as the discovery ofnovel genes and novel functions involved in pathogenesis. For theseobjectives, ATMT has to target mostly genic compartments of thegenomes and show limited biases in targeted genes or genomicregions. The first advantage of ATMT for this objective is the com-mon single-copy integration of the T-DNA in genomes, and mainly infungal genomes, including that of L. maculans (Michielse et al. 2005;Blaise et al. 2007). The second point to be stressed in L. maculans isthe high percentage of recovery of flanking sequences with matches inthe fungal genome (around 80%) as was also observed for M. oryzae(Meng et al. 2007), whereas in plants, the frequencies usually amount
to 60–65% [e.g. Thole et al. (2010)]. As shown for M. oryzae, orArabidopsis and other model plant species, the T-DNA integrationis shown here to be nonrandom. First T-DNA integration was muchrarer than expected in TEs, as is generally the case in plants (Tholeet al. 2010; Zhang et al. 2007), although this bias was not found whenanalyzing random transformants ofM. oryzae (Meng et al. 2007). Onepossible explanation for this discrepancy would lie in the fact that all
Figure 7 Analysis of microhomology at T-DNA preinsertion sites.Frequency of occurrence of single bases identical to those of the 25-bp T-DNA left border in the genome preinsertion sites were analyzed.The T-DNA LB sequence is illustrated, and homologs of the TATA boxand Inr in the LB sequence are boxed.
n Table 2 Gene Ontology annotation of T-DNA–targeted genes using the “biological process” vocabulary
Whole Genome T-DNA–targeted Genes
Annot.a Obs. Annot.b Exp. Annot.c SRd
Pigmentation 1 1 0.03 5.94Immune system process 1 0 0.03 20.16Cell proliferation 3 0 0.08 20.28Death 4 0 0.11 20.33Locomotion 4 0 0.11 20.33Biological adhesion 6 0 0.16 20.40Growth 6 1 0.16 2.09Nitrogen utilization 9 0 0.24 20.49Reproduction 14 1 0.38 1.02Carbon utilization 15 1 0.40 0.94Multi-organism process 43 1 1.15 20.14Cell wall organization or biogenesis 49 5 1.31 3.21Signaling 153 0 4.11 22.03Cellular component organization 177 5 4.75 0.11Multicellular organismal process 228 6 6.12 20.05Cellular component biogenesis 232 8 6.23 0.71Developmental process 257 8 6.90 0.42Response to stimulus 262 4 7.03 21.14Biological regulation 469 12 12.59 20.17Localization 706 21 18.95 0.47Cellular process 2489 62 66.79 20.59Metabolic process 3070 84 82.39 0.18Total 8198 220 220 —aNumber of annotations generated per category for the 12,469 L. maculans predicted genes.
bObserved number of annotations generated by the GO analysis.
cExpected number of annotations [= (
Pannot.) · P(functional category)]. Where (
Pannot.) is the sum of all generated annotations, and P
(functional category) is whole genome probability of the considered functional category. Values were approximated to two decimals.d
Standardized residuals. We considered a normal distribution of SRs because we cannot reject the null hypothesis as revealed by theKolmogorov-Smirnov test (P-value ¼ 0.391, a ¼ 0.05). Biased categories are indicated in bold.
Volume 2 August 2012 | T-DNA Mapping and Genome Structure | 899
Dow
nloaded from https://academ
ic.oup.com/g3journal/article/2/8/891/6028531 by guest on 16 January 2022
TEs in the genome of L. maculans are strongly degenerated andinactivated (Rouxel et al. 2011) and that, as discussed below,T-DNA integration favors transcriptionally active regions of the ge-nome. Also, as is the case for M. oryzae, T-DNA tags were notrecovered from other large arrays of repeats, such as the rDNAarray, or from the mitochondrial genome (Meng et al. 2007),whereas the tagging of the rDNA array by T-DNA is overrepre-sented in some plant species, such as B. distachyon (Thole et al.2010). Similarly to what was observed in M. oryzae, a marginalchromosomal bias showed some favored or disfavored chromo-somes for T-DNA integration in L. maculans. As was noticed forM. oryzae, the biological significance of this fact remains obscurebecause no functional specificity was associated with these chromo-somes. This bias may only be due to the limited number of tagsanalyzed in randomly tagged fungal isolates as it does not seem tooccur in plants where the nonrandom integrations are observedwithin a chromosome rather than between chromosomes (Tholeet al. 2010). More importantly, one main feature of T-DNA inte-gration in the genome [i.e., the favored targeting of 59 500-bpregions of genes assumed to be promoters] is a widely shared traitfor plants and fungi (Alonso et al. 2003; Meng et al. 2007; Choi et al.2007; Thole et al. 2010). By comparison with M. oryzae, the biastoward promoter regions was even more marked in the genome of L.maculans, consistent with the common recovery of pathogenicmutants for which the altered pathogenicity was due to T-DNAintegration in promoters of genes (Elliott and Howlett 2006; Remyet al. 2008a,b, 2009). Lastly, the favored targeting of promoters isconsistent with the presence of microhomology motifs (see below)involved in the homologous recombination with the T-DNA border.
When compiled, the observed T-DNA integration biases seem toshare at least one common denominator: T-DNA integration takesplace in transcriptionally active regions. In a cell, transcriptionalactivity should be considered the first step in the translation ofgenomic information into physiological state. Hence, starting fromthis postulate, it is logical to suppose that cellular activity affectsT-DNA–favored insertion sites and that targeted genes should reflect,to a certain extent, the physiological state of the transformed cell. In thisstudy, T-DNA insertion loci were recovered from L. maculans trans-formants obtained by ATMT for which germinating conidia (incubatedfor 48 hr) were used (Blaise et al. 2007). Conidial germination is com-monly described as a three-step mechanism (D’enfert 1997; Osherovand May 2001): (i) activation, during which appropriate amounts ofwater and low-molecular-weight nutrients trigger conidial cell ac-tivation for germination; (ii) isotropic growth, during which theconidial cell undergoes morphological changes, uptakes water, andincreases its physiological activity, which leads to an increase in sizeand mass; and (iii) polarized growth, during which a germ tubeemerges from the conidial cell and develops, which requires de novosynthesis of wall materials. Germination is an asynchronic phenom-enon that may differ from one conidia to another. ATMT is thusperformed on conidial populations at four physiological stages: (i)ungerminated conidia, (ii) conidia at germination activation, (iii) con-idia at isotropic growth, and (iv) conidia at polarized growth. Theoverrepresentation of “pigmentation,” “growth,” and “cell wall orga-nization or biogenesis” functional categories in genes targeted by theT-DNA would be consistent with the hypothesis that targeted genesreflect the physiological state of the germinating conidia. First, eventhough the conidia of L. maculans are hyaline under the microscope,
n Table 3 Distribution of T-DNA insertion events along the L. maculans chromosomes
Chromosomes T-DNA Insertion Events
No. SCa Size (Mb) GC % Gene Contentb GC Sizec (Mb) rd (T-IE/Mb) Observed Expectede SRf
1 0 4.3 45.7 1276 2.9 5.6 24 30 21.062 2+19 4.1 44.1 1206 2.8 7.8 32 29 0.583 6+29+11 3.7 39.7 810 1.9 6.0 22 26 20.744 8+10 3.6 43.2 1055 2.1 7.6 27 25 0.415 1 3.4 45.3 1089 2.5 13.0 44 24 4.196 12+15+32 4.1 41.6 888 2.0 5.6 23 29 21.067 20+21+23 3.3 44.7 751 1.4 5.2 17 23 21.278 3+31 2.5 43.3 604 0.8 6.0 15 17 20.589 4 1.9 46.6 666 1.4 9.4 18 13 1.2510 5 1.9 47.2 641 1.4 15.0 28 13 4.1211 9 1.8 45.1 478 1.1 7.9 14 12 0.4512 7 1.8 46.0 568 1.2 4.5 8 12 21.2513 13 1.6 43.9 493 0.9 6.7 11 11 20.1314 14 1.5 47.4 513 1.2 8.5 13 11 0.6915 17 1.4 43.7 416 1.0 3.5 5 10 21.6116 16 1.4 44.3 353 0.8 3.6 5 10 21.5317 18 1.4 44.7 369 0.8 3.0 4 9 21.7718 22 0.8 35.3 36 0.1 0.0 0 6 -2.42Un.g — 0.7 — — — — 8 — —
Genome — 45.1 44.1 12469 — 7.0 318aSupercontigs reassembled to make up whole chromosomes.
bNumber of predicted genes per chromosome.
cTotal size of GC isochores per chromosome.
dT-DNA insertion event (T-IE) density [= (number of T-IEs per chromosome / chromosome size)].
eBased on density of T-DNA insertion events in the whole genome (7 T-IE/Mb), the expected number of T-IEs per chromosome was calculated as [(chromosome size)· (T-IE whole-genome density)]. Values were approximated to the nearest integer.
fStandardized residuals. We considered a normal distribution of SRs because we cannot reject the null hypothesis as revealed by the Kolmogorov-Smirnov test(P-value = 0.475, a = 0.05). Chromosomes showing a significant bias in number of T-DNA insertion events are indicated in bold.
gUnassembled genomic sequences (summing up approximately to 0.7 Mb).
900 | Bourras et al.
Dow
nloaded from https://academ
ic.oup.com/g3journal/article/2/8/891/6028531 by guest on 16 January 2022
deposition of melanin and other pigments is generally associated withspore production in fungi in which they seem to function in theprotection of microbes against environmental stress such as UV lightand heat (Will et al. 1987; Brags et al. 2006; Rangel et al. 2006),consistent with the overrepresentation of the “pigmentation” category.Second, “growth” fits the isotropic growth step of conidial germina-tion. Third, “cell wall organization or biogenesis” fits the polarizedgrowth step of conidial germination.
T-DNA intranuclear targeting is assumed to result from a longevolution of Agrobacterium species’ transfection mechanisms to fithost cellular machinery. Starting from this postulate, we analyzedthis phenomenon mainly from the host point of view. Consequently,we considered T-DNA insertion biases not only as resulting fromT-DNA characteristics but also largely depending on the following: (i)host genome characteristics (in L. maculans GC isochores/gene-richvs. AT isochores/gene-poor compartments); (ii) gene expression atboth transcriptional (machinery) and functional (cell physiologicalstate) levels; and (iii) DNA features characterized by heterogeneity,unequal sensitivity to DNA damages, and organization in a gene-dependent fashion.
Locus biases, which are due to a chromatin-targeting process thatguides T-DNA from its entry into the nucleus to its anchorage to hostchromatin, were investigated. Previous studies have shown thatT-DNA nuclear import is mediated by two bacterial virulence (Vir)proteins, VirD2 and VirE2, which directly associates with T-DNA toform the transport (T) complex [for review, see Tzfira et al. (2000)and Zupan et al. (2000)]. In addition to T-DNA encapsidation, Virproteins act as interfaces with host machinery: VirD2 is phosphor-ylated in vivo by CAK2M, a cyclin-dependent kinase-activating kinase,
and is tightly associated with TATA box-binding protein (TBP) (Bakóet al. 2003), and VirE2 binds VIP1 (VirE2-interacting protein 1),a bZIP transcription factor capable of binding core histones (Li et al.2005; Loyter et al. 2005). VIP1, CAK2M, and TBP profile T-DNAinsertion loci distribution within the host genome, and their properfunctions and properties generate locus biases: CAK2M phosphory-lates the C-terminal domain of the RNA polymerase II (RNA Pol II)largest subunit (Bakó et al. 2003), which serves as a TBP-bindingplatform (Yuryev et al. 1996); TBP binds the TATA box core pro-moter element, whose recognition nucleates the assembly of transcrip-tion preinitiation complex [for review, see Smale and Kadonaga(2003)]; and VIP1 precisely binds a DNA hexamer motif found inthe promoters of various stress-responsive genes and plays a role inimmunity signaling by stimulating stress-dependent gene expression,at least in plants (Djamei et al. 2007; Pitzschke et al. 2009). However,because VIP1 shows no significant homology to known animal orfungal proteins, it could be plant specific. Nevertheless, becauseT-complex anchorage to host chromatin seems to be a key stepfor further T-DNA integration, it is consistent to consider the exis-tence of animal and fungal VIP1-like proteins interacting with bothT-complex and host chromatin. The T-DNA insertion pattern inL. maculans corroborates this tight relation between T-DNA and genetranscription machinery, because T-DNA insertions were predominantin the following: (i) GC isochores, which are gene-rich islands fre-quently targeted by gene transcription machinery and therefore morelikely to be in a relaxed, opened state, rather than AT isochores, whichare TE-rich, gene-poor regions assimilated to heterochromatin, there-fore condensed and closed (Rouxel et al. 2011); (ii) gene-regulatoryregions, which border zones between a histone-containing region
n Table 4 Gene Ontology annotation of “biological process” for chromosomes 5 and 10
Whole Genome Chromosome 5 Chromosome 10
Annot.a Obs. Annot.b Exp. Annot.c SRd Obs. Annot.b Exp. Annot.c SRd
Pigmentation 1 1 0.10 2.93 0 0.06 -0.24Immune system process 1 0 0.10 20.31 0 0.06 20.24Cell proliferation 3 0 0.29 20.54 0 0.17 20.41Death 4 1 0.38 1.00 0 0.22 20.47Locomotion 4 1 0.38 1.00 0 0.22 20.47Biological adhesion 6 1 0.57 0.56 0 0.33 20.58Growth 6 1 0.57 0.56 1 0.33 1.15Nitrogen utilization 9 1 0.86 0.15 0 0.50 20.71Reproduction 14 2 1.34 0.57 2 0.78 1.38Carbon utilization 15 4 1.43 2.14 1 0.83 0.18Multi-organism process 43 4 4.11 20.05 0 2.39 21.55Cell wall organization or biogenesis 49 5 4.68 0.15 2 2.73 20.44Signaling 153 14 14.61 20.16 7 8.51 20.52Cellular component organization 177 19 16.91 0.51 11 9.85 0.37Multicellular organismal process 228 19 21.78 20.59 11 12.68 20.47Cellular component biogenesis 232 31 22.16 1.88 17 12.90 1.14Developmental process 257 21 24.55 20.72 12 14.30 20.61Response to stimulus 262 16 25.02 21.80 22 14.57 1.95Biological regulation 469 47 44.79 0.33 31 26.09 0.96Localization 706 62 67.43 20.66 33 39.27 21.00Cellular process 2489 240 237.73 0.15 149 138.45 0.90Metabolic process 3070 293 293.22 20.01 157 170.76 21.05Total 8198 783 783 — 456 456 _aNumber of annotations generated per category for the 12,469 genes predicted in L. maculans.
bObserved number of annotations generated for all predicted genes on chromosome 5 and 10.
cExpected number of annotations [= (
Pannot.) x P(functional category)]. Where (
Pannot.) is the sum of all generated annotations, and P(functional category) is whole
genome probability of the considered functional category. Values were approximated to two decimals.d
Standardized residuals. We considered a normal distribution of SRs because we cannot reject the null hypothesis as revealed by the Kolmogorov-Smirnov test(Chromosome 5: P-value = 0.453, a = 0.05. Chromosome 10: P-value = 0.188, a = 0.05). Biased categories are indicated in bold.
Volume 2 August 2012 | T-DNA Mapping and Genome Structure | 901
Dow
nloaded from https://academ
ic.oup.com/g3journal/article/2/8/891/6028531 by guest on 16 January 2022

capable of anchoring the T-complex and a histone-less region that isthe gene-expressing DNA; and (iii) promoter region, in which ad-ditional binding opportunities (CAK2M, TBP) increase the proba-bility of T-complex anchorage and strengthen it.
T-complex anchorage to host chromatin is not synonymous withT-DNA insertion. For the latter to occur, DNA damage is mandatory,because the T-DNA integration process abuses HR and NHRpathways, two host-DNA double-strand break (DSB) repair machin-eries [for review, see Tzfira et al. (2004) and Citovsky et al. (2007)].Consequently, as additional factors that affect occurrence of T-DNAintegration events, we must consider both DSBs hotspots and DSBrepair efficiency. In eukaryotic cells, DSBs are common events result-ing from both environmental and endogenous factors. DSBs are alsocreated by converting single-strand lesions (Natarajan 1993) and ret-rotransposon activity (Gasior et al. 2006), and they occur preferentiallyin opened chromatin (Berchowitz et al. 2009) and transcriptionallyactive promoters, telomeres, and centromeres (Wu and Lichten1994; Baudat and Nicolas 1997; Blitzblau et al. 2007; Buhler et al.2007). However, not all occurring DSBs are repaired with the sameefficiency. In fact, telomeric regions and packed heterochromatin aredeficient in repair of DSBs (Ricchetti et al. 2003). Together, thesestudies highlight biases of DSB occurrence and repair that correlatewith T-DNA mapping biases in L. maculans. Actually, T-DNA in-tegration favored gene-rich GC isochores and not AT isochores thatexhibit heterochromatin characteristics in which chromatin is packedand DSB repair is likely to be deficient, and T-DNA integration eventsovermapped to gene promoter regions where DSBs are assumed tooccur frequently.
To corroborate mapping biases in T-DNA integration events, weanalyzed T-DNA LB, T-DNA preinsertion and insertion site sequen-ces, and T-DNA–targeted genes for particular compositional, struc-tural, and functional signatures, and we showed that T-DNA LBshares microhomologies with preinsertion sites, suggesting thatT-DNA integration may occur at least by HR in L. maculans. The samewas observed by Meng et al. (2007) and by Choi et al. (2007) in the M.oryzae genome, but the authors did not reach conclusive evidenceregarding the targeted motifs. Hence, T-DNA LB sequence affinitywith host DNA may affect T-DNA integration event distribution.Our results highlighted that T-DNA LB harbored microhomologieswith CAAT box, Inr, and TATA box of eukaryotic promoters. Also,TATA-containing micromology motifs were frequently shared be-tween T-DNA LB and its target sequence. These observations corre-late with frequent mapping of T-DNA insertions to gene promoterregions, in the sense that sequence affinity is mandatory for DNA endjoining by MMEJ [for review, see McVey and Lee (2008)].
DNA asymmetry was observed in both prokaryotic and eukaryoticgenomes. It is a consequence of many mechanisms, among whichgene expression is one of the better studied, and in which DNAasymmetry is seen as signatures indicating functional signals andDNA modifications (Touchon and Rocha 2008). DNA asymmetry isrevealed by the CG skew and AT skew. Previous studies noticed thatthe CG skew is stronger than the AT skew, at least in eubacteria(Francino and Ochman 1997; Frank and Lobry 1999; Tillier andCollins 2000) and that skew curves are associated with replicationorigin (Lobry, 1996a,b; Blattner et al. 1997; Kunst et al. 1997; Grigoriev1998) and transcription-coupled and splicing-coupled mutations(Touchon et al. 2004). In particular, CG skew peak is associated withgene expression level, at least in plants (Alexandrov et al. 2006), andtranscription initiation starts in eukaryotes, including fungi (Tatarinovaet al. 2003; Fujimori et al. 2005; Alexandrov et al. 2006). Altogether,these studies highlight a correlation between DNA asymmetry and
cellular activity–driven DNA manipulations and modifications ingeneral (replication, gene expression, mutations) and a tight associ-ation between an increased CG skew and gene transcription in par-ticular. T-DNA targeted to CG asymmetric DNA is thus consistentwith frequent insertions in transcriptionally active regions and genepromoter sequences.
CONCLUSIONSUsing a fungal genome showing contrasted genomic landscapes, ourdata substantiate the advantages of ATMT to reach a functionalannotation of genes, but they cast doubts on whether this strategy willbe able to target species-specific genes involved in pathogenicity thatreside in specific AT-rich compartments of the fungal genome. Themain particularities substantiating these points are (i) the commonsingle-copy integration of the T-DNA; (ii) the high frequency ofintegration within protein-coding genes (even if the introns arefavored targets), amounting to one third of the integration events in L.maculans; and (iii) the common occurrence in promoters favoring theaccess to genes whose complete inactivation would be too detrimentalfor the fungus. In contrast, under the hypothesis that genes specificallyinvolved in plant pathogenicity are hosted in specific compartments ofthe genome, we notice that T-DNA targeting to AT isochores is verylow compared with the percentage of these landscapes in the genome,but it is nevertheless consistent with the amount of genes hosted inAT isochores. More importantly, our work suggests the importance ofthe physiology of the fungus at the time of ATMT and the favoredtargeting of transcriptionally active regions of the genome. With mostof the genes involved in pathogenicity, such as those encoding effectorproteins, repressed during the vegetative growth of the fungus andoverexpressed at the onset of plant infection (Rouxel et al. 2011), theseare unlikely to be targeted by the T-DNA.
ACKNOWLEDGMENTS.B. was funded by a grant from the French Ministry of Research.
LITERATURE CITEDAlexandrov, N. N., M. E. Troukhan, V. V. Brover, T. Tatarinova, R. B. Flavell
et al., 2006 Features of Arabidopsis genes and genome discovered usingfull-length cDNAs. Plant Mol. Biol. 60: 69–85.
Alonso, J. M., A. N. Stepanova, T. J. Leisse, C. J. Kim, H. Chen et al.,2003 Genome-wide insertional mutagenesis of Arabidopsis thaliana.Science 301: 653–657.
Arabidopsis Genome Initiative, 2000 Analysis of the genome sequence ofthe flowering plant Arabidopsis thaliana. Nature 408: 796–815.
Attard, A., L. Gout, M. Gourgues, M. L. Kuhn, J. Schmit et al.,2002 Analysis of molecular markers genetically linked to the Leptos-phaeria maculans avirulence gene AvrLm1 in field populations indicatesa highly conserved event leading to virulence on Rlm1 genotypes. Mol.Plant-Microbe Interact. 15: 672–682.
Bakó, L., M. Umeda, A. F. Tiburcio, J. Schell, and C. Koncz, 2003 TheVirD2 pilot protein of Agrobacterium-transferred DNA interacts with theTATA box-binding protein and a nuclear protein kinase in plants. Proc.Natl. Acad. Sci. USA 100: 10108–10113.
Balzergue, S., B. Dubreucq, S. Chauvin, I. Le-Clainche, F. Le Boulaire et al.,2001 Improved PCR-walking for large-scale isolation of plant T-DNAborders. Biotechniques 30: 496–504.
Baudat, F., and A. Nicolas, 1997 Clustering of meiotic double-strand breakson yeast chromosome III. Proc. Natl. Acad. Sci. USA 94: 5213–5218.
Berchowitz, L. E., S. E. Hanlon, J. D. Lieb, and G. P. Copenhaver, 2009 Apositive but complex association between meiotic double-strand breakhotspots and open chromatin in Saccharomyces cerevisiae. Genome Res.19: 2245–2257.
902 | Bourras et al.
Dow
nloaded from https://academ
ic.oup.com/g3journal/article/2/8/891/6028531 by guest on 16 January 2022
Blaise, F., E. Remy, M. Meyer, L. Zhou, J. P. Narcy et al., 2007 A criticalassessment of Agrobacterium tumefaciens-mediated transformation asa tool for pathogenicity gene discovery in the phytopathogenic fungusLeptosphaeria maculans. Fungal Genet. Biol. 44: 123–138.
Blattner, F. R., G. Plunkett III, C. A. Bloch, N. T. Perna, V. Burland et al.,1997 The complete genome sequence of Escherichia coli K-12. Science277: 1453–1462.
Blitzblau, H. G., G. W. Bell, J. Rodriguez, S. P. Bell, and A. Hochwagen,2007 Mapping of meiotic single-stranded DNA reveals double-stranded-break hotspots near centromeres and telomeres. Curr. Biol. 17: 2003–2012.
Brags, G. U. L., D. E. Rangel, S. D. Flint, A. J. Anderson, and D. W. Roberts,2006 Conidial pigmentation is important to tolerance against solar-simulated radiation in the entomopathogenic fungus Metarhizium ani-sopliae. Photochem. Photobiol. 82: 418–422.
Breathnach, R., and P. Chambon, 1981 Organization and expression of eu-caryotic split genes coding for proteins. Annu. Rev. Biochem. 50: 349–383.
Bucher, P., 1990 Weight matrix descriptions of four eukaryotic RNApolymerase II promoter elements derived from 502 unrelated promotersequences. J. Mol. Biol. 212: 563–578.
Buhler, C., V. Borde, and M. Lichten, 2007 Mapping meiotic single-strandDNA reveals a new landscape of DNA double-strand breaks in Saccha-romyces cerevisiae. PLoS Biol. 5: e324.
Burley, S. K., 1996 The TATA box binding protein. Curr. Opin. Struct. Biol.6: 69–75.
Choi, J., J. Park, J. Jeon, M. H. Chi, J. Goh et al., 2007 Genome-wideanalysis of T-DNA integration into the chromosomes of Magnaportheoryzae. Mol. Microbiol. 66: 371–382.
Christie, K. R., E. L. Hong, and J. M. Cherry, 2009 Functional annotationsfor the Saccharomyces cerevisiae genome: the knowns and the knownunknowns. Trends Microbiol. 17: 286–294.
Citovsky, V., S. V. Kozlovsky, B. Lacroix, A. Zaltsman, M. Dafny-Yelin et al.,2007 Biological systems of the host cell involved in Agrobacterium in-fection. Cell. Microbiol. 9: 9–20.
D’Enfert, C., 1997 Fungal spore germination: insights from the moleculargenetics of Aspergillus nidulans and Neurospora crassa. Fungal Genet.Biol. 21: 163–172.
Djamei, A., A. Pitzschke, H. Nakagami, I. Rajh, and H. Hirt, 2007 Trojanhorse strategy in Agrobacterium transformation: abusing MAPK defensesignaling. Science 318: 453–456.
Elliott, C. E., and B. J. Howlett, 2006 Overexpression of a 3-ketoacyl-CoAthiolase in Leptosphaeria maculans causes reduced pathogenicity onBrassica napus. Mol. Plant-Microbe Interact. 19: 588–596.
Francino, M. P., and H. Ochman, 1997 Strand asymmetries in DNA evo-lution. Trends Genet. 13: 240–245.
Frank, A. C., and J. R. Lobry, 1999 Asymmetric substitution patterns: a re-view of possible underlying mutational or selective mechanisms. Gene238: 65–77.
Fujimori, S., T. Washio, and M. Tomita, 2005 GC-compositional strandbias around transcription start sites in plants and fungi. BMC Genomics6: 26.
Gasior, S. L., T. P. Wakeman, B. Xu, and P. L. Deininger, 2006 The humanLINE-1 retrotransposon creates DNA double-strand breaks. J. Mol. Biol.357: 1383–1393.
Goffeau, A., B. G. Barrell, H. Bussey, R. W. Davis, B. Dujon et al., 1996 Lifewith 6000 genes. Science 274: 546–567.
Götz, S., J. M. García-Gómez, J. Terol, T. D. Williams, S. H. Nagaraj et al.,2008 High-throughput functional annotation and data mining with theblast2GO suite. Nucleic Acids Res. 36: 3420–3435.
Grigoriev, A., 1998 Analyzing genomes with cumulative skew diagrams.Nucleic Acids Res. 26: 2286–2290.
Grigoriev, I. V., D. Cullen, S. B. Goodwin, D. Hibbett, T. W. Jeffries, et al.,2011 Fueling the future with fungal genomics. Mycology 2: 192–209.
Grubbs, F. E., 1969 Procedures for detecting outlying observations insamples. Technometrics 11: 1–21.
Huh, W. K., J. V. Falvo, L. C. Gerke, A. S. Carroll, R. W. Howson et al.,2003 Global analysis of protein localization in budding yeast. Nature425: 686–691.
Javahery, R., A. Khachi, K. Lo, B. Zenzie-Gregory, and S. T. Smale,1994 DNA sequence requirements for transcriptional initiator activityin mammalian cells. Mol. Cell. Biol. 14: 116–127.
Jones, G. M., J. Stalker, S. Humphray, A. West, T. Cox et al., 2008 Asystematic library for comprehensive overexpression screens in Saccha-romyces cerevisiae. Nat. Methods 5: 239–241.
Kourmpetis, Y. A., A. D. van Dijk, R. C. van Ham, and C. J. ter Braak,2011 Genome-wide computational function prediction of Arabidopsisproteins by integration of multiple data sources. Plant Physiol. 155: 271–281.
Krishnan, A., E. Guiderdoni, G. An, Y. I. Hsing, C. D. Han et al.,2009 Mutant resources in rice for functional genomics of the grasses.Plant Physiol. 149: 165–170.
Kunst, F., N. Ogasawara, I. Moszer, A. M. Albertini, G. Alloni et al.,1997 The complete genome sequence of the Gram-positive bacteriumBacillus subtilis. Nature 390: 249–256.
Li, J., A. Krichevsky, M. Vaidya, T. Tzfira, and V. Citovsky,2005 Uncoupling of the functions of the Arabidopsis VIP1 protein intransient and stable plant genetic transformation by Agrobacterium. Proc.Natl. Acad. Sci. USA 102: 5733–5738.
Liu, Y. G., N. Mitsukawa, T. Oosumi, and R. F. Whittier, 1995 Efficientisolation and mapping of Arabidopsis thaliana T-DNA insert junctionsby thermal asymmetric interlaced PCR. Plant J. 8: 457–463.
Lobry, J. R., 1996a Origin of replication of Mycoplasma genitalium. Science272: 745–746.
Lobry, J. R., 1996b Asymmetric substitution patterns in the two DNAstrands of bacteria. Mol. Biol. Evol. 13: 660–665.
Loyter, A., J. Rosenbluh, N. Zakai, J. Li, S. V. Kozlovsky et al., 2005 Theplant VirE2 interacting protein 1. A molecular link between the Agro-bacterium T-complex and the host cell chromatin? Plant Physiol. 138:1318–1321.
Ma, L. J., H. C. van der Does, K. A. Borkovich, J. J. Coleman, M. J. Daboussiet al., 2010 Comparative genomics reveals mobile pathogenicity chro-mosomes in Fusarium. Nature 464: 367–373.
McVey, M., and S. E. Lee, 2008 MMEJ repair of double-strand breaksdirector’s cut: deleted sequences and alternative endings. Trends Genet.24: 529–538.
Meng, Y., G. Patel, M. Heist, M. F. Betts, S. L. Tucker et al., 2007 Asystematic analysis of T-DNA insertion events in Magnaporthe oryzae.Fungal Genet. Biol. 44: 1050–1064.
Michielse, C. B., P. J. Hooykaas, C. van den Hondel, and A. F. Ram,2005 Agrobacterium-mediated transformation as a tool for functionalgenomics in fungi. Curr. Genet. 48: 1–17.
Natarajan, A. T., 1993 Mechanisms for induction of mutations and chro-mosome alterations. Environ. Health Perspect. 101: 225–229.
Osherov, N., and G. S. May, 2001 The molecular mechanisms of conidialgermination. FEMS Microbiol. Lett. 199: 153–160.
Pena-Castillo, L., and T. R. Hughes, 2007 Why are there still over 1000uncharacterized yeast genes? Genetics 176: 7–14.
Pitzschke, A., A. Djamei, M. Teige, and H. Hirt, 2009 VIP1 response ele-ments mediate mitogen-activated protein kinase 3-induced stress geneexpression. Proc. Natl. Acad. Sci. USA 106: 18414–18419.
Rangel, D. E., M. J. Butler, J. Torabinejad, A. J. Anderson, G. U. Braga et al.,2006 Mutants and isolates of Metarhizium anisopliae are diverse intheir relationships between conidial pigmentation and stress tolerance. J.Invertebr. Pathol. 93: 170–182.
Remy, E., M. Meyer, F. Blaise, M. Chabirand, N. Wolff et al., 2008a TheLmpma1 gene of Leposphaeria maculans encodes a plasma membraneH+-ATPase isoform essential for pathogenicity towards oilseed rape.Fungal Genet. Biol. 45: 1122–1134.
Remy, E., M. Meyer, F. Blaise, U. K. Simon, D. Kuhn et al., 2008b TheLmgpi15 gene, encoding a component of the glycosylphosphatidylinositolanchor biosynthesis pathway, is required for morphogenesis and patho-genicity in Leptosphaeria maculans. New Phytol. 179: 1105–1120.
Remy, E., M. Meyer, F. Blaise, U. K. Simon, D. Kuhn et al., 2009 A keyenzyme of the Leloir pathway is involved in pathogenicity of Leptos-phaeria maculans towards oilseed rape. Mol. Plant-Microbe Interact. 22:725–736.
Volume 2 August 2012 | T-DNA Mapping and Genome Structure | 903
Dow
nloaded from https://academ
ic.oup.com/g3journal/article/2/8/891/6028531 by guest on 16 January 2022
Ricchetti, M., B. Dujon, and C. Fairhead, 2003 Distance from the chro-mosome end determines the efficiency of double strand break repair insubtelomeres of haploid yeast. J. Mol. Biol. 328: 847–862.
Rouxel, T., J. Grandaubert, J. K. Hane, C. Hoede, A. P. van de Wouw et al.,2011 Diversification of effectors within compartments of the Leptos-phaeria maculans genome affected by RIP mutations. Nat. Commun. 2: 202.
Smale, S. T., and J. T. Kadonaga, 2003 The RNA polymerase II core pro-moter. Annu. Rev. Biochem. 72: 449–479.
Spanu, P. D., J. C. Abbott, J. Amselem, T. A. Burgis, D. M. Soanes et al.,2010 Genome expansion and gene loss in powdery mildew fungi revealtradeoffs in extreme parasitism. Science 330: 1543–1546.
Tatarinova, T., V. Brover, M. Troukhan, and N. Alexandrov, 2003 Skew inCG content near the transcription start site in Arabidopsis thaliana.Bioinformatics 19: i313–i314.
Thole, V., B. Worland, J. Wright, M. W. Bevan, and P. Vain,2010 Distribution and characterization of more than 1000 T-DNA tagsin the genome of Brachypodium distachyon community standard lineBd21. Plant Biotechnol. J. 8: 734–747.
Tillier, E. R., and R. A. Collins, 2000 The contributions of replication ori-entation, gene direction, and signal sequences to base-compositionasymmetries in bacterial genomes. J. Mol. Evol. 50: 249–257.
Touchon, M., and E. P. C. Rocha, 2008 A gentle guide to the analysis ofstrand asymmetry in genome sequences. Biochimie 90: 648–659.
Touchon, M., A. Arneodo, Y. d’Aubenton-Carafa, and C. Thermes,2004 Transcription-coupled and splicing-coupled strand asymmetriesin eukaryotic genomes. Nucleic Acids Res. 32: 4969–4978.
Tzfira, T., J. Li, B. Lacroix, and V. Citovsky, 2000 Nucleic acid transport inplant-microbe interactions: the molecules that walk through the walls.Annu. Rev. Microbiol. 54: 187–219.
Tzfira, T., Y. Rhee, M.-H. Chen, and V. Citovsky, 2004 Agrobacterium T-DNAintegration: molecules and models. Trends Genet. 20: 375–383.
Will, O. H., D. Dixon, A. Birney, and P. L. Thomas, 1987 Effects of far UVand visible light on germination of wild type and albino teliospores ofUstilago nuda. Can. J. Plant Pathol. 9: 225–229.
Winzeler, E. A., D. D. Shoemaker, A. Astromoff, H. Liang, K. Anderson et al.,1999 Functional characterization of the S. cerevisiae genome by genedeletion and parallel analysis. Science 285: 901–906.
Wu, T. C., and M. Lichten, 1994 Meiosis-induced double-strand break sitesdetermined by yeast chromatin structure. Science 263: 515–518.
Yuryev, A., M. Patturajan, Y. Litingtung, R. V. Joshi, C. Gentile et al.,1996 The C-terminal domain of the largest subunit of RNA polymeraseII interacts with a novel set of serine/arginine-rich proteins. Proc. Natl.Acad. Sci. USA 93: 6975–6980.
Zhang, J., D. Gu, Y. X. Chang, C. J. You, X. W. Li et al., 2007 Non-randomdistribution of T-DNA insertions at various levels of the genome hier-archy as revealed by analyzing 13 804 T-DNA flanking sequences from anenhancer-trap mutant library. Plant J. 49: 947–959.
Zupan, J., T. R. Muth, O. Draper, and P. C. Zambryski, 2000 The transfer ofDNA from Agrobacterium tumefaciens into plants: a feast of fundamentalinsights. Plant J. 23: 11–28.
Communicating editor: B. J. Andrews
904 | Bourras et al.
Dow
nloaded from https://academ
ic.oup.com/g3journal/article/2/8/891/6028531 by guest on 16 January 2022