Incidence of Fire in Heritage Buildings - FRSUG...Is it possible to quantify the incidence of fire...
74
Incidence of Fire in Heritage Buildings Henry Landis, MSc, GIFireE
Transcript of Incidence of Fire in Heritage Buildings - FRSUG...Is it possible to quantify the incidence of fire...
Incidence of Fire in Heritage Buildings
Henry Landis, MSc, GIFireE

Are you more at risk from Fire in a Heritage Building?
Is it possible to quantify the incidence of fire in Heritage buildings by comparing listing information provided by Historic England with incident reports of fires completed by English Fire and Rescue Services?
The above will be demonstrated as a proof of concept using data relating to the Suffolk, Cambridgeshire and Hampshire Fire and Rescue Service response area.
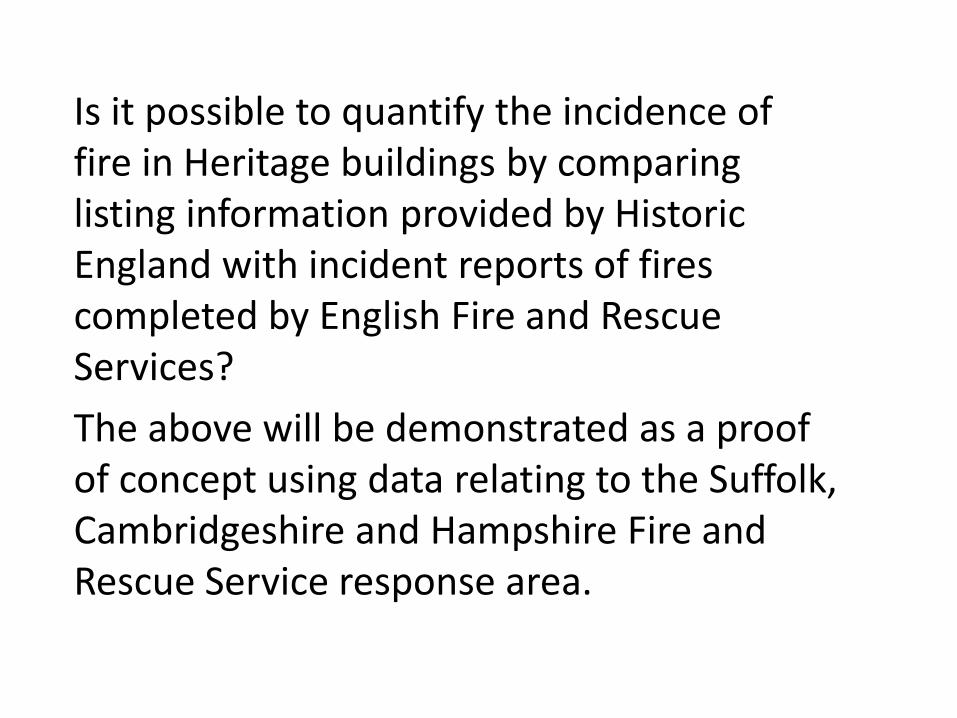
Uppark 1986
How many fires are there in Heritage Buildings?
© fire-defence.com

Prior Park College 1991
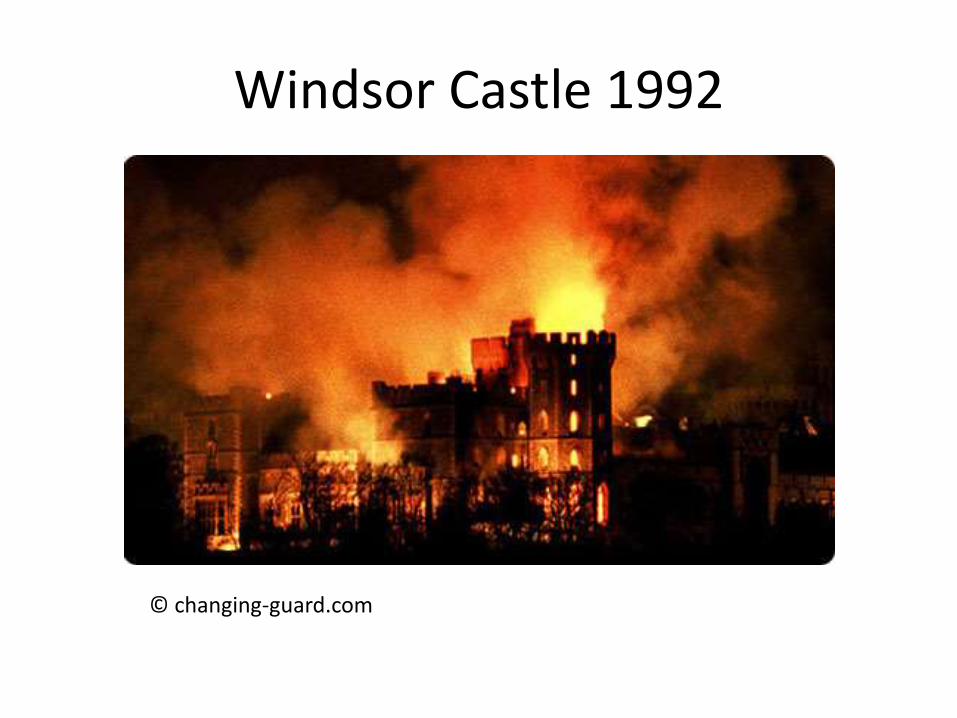
Windsor Castle 1992
© changing-guard.com
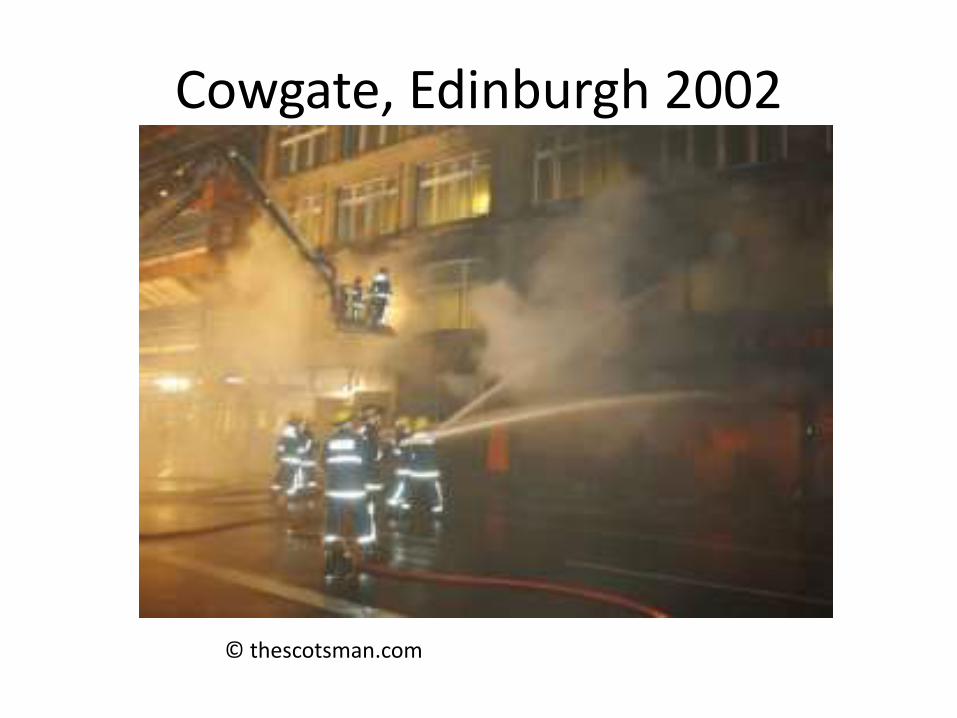
Cowgate, Edinburgh 2002
© thescotsman.com
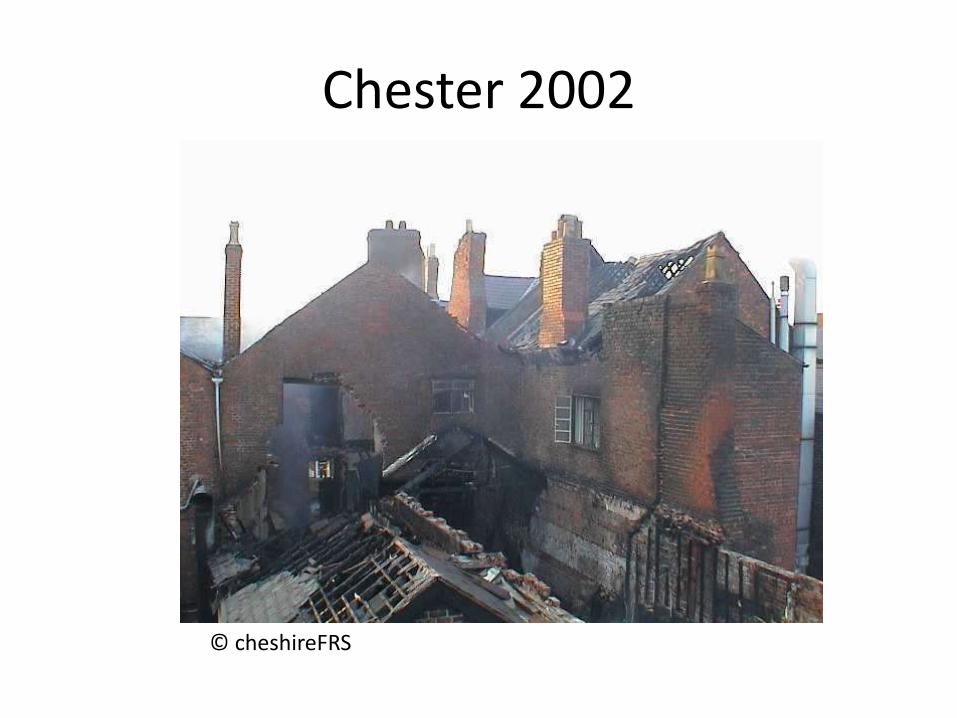
Chester 2002
© cheshireFRS
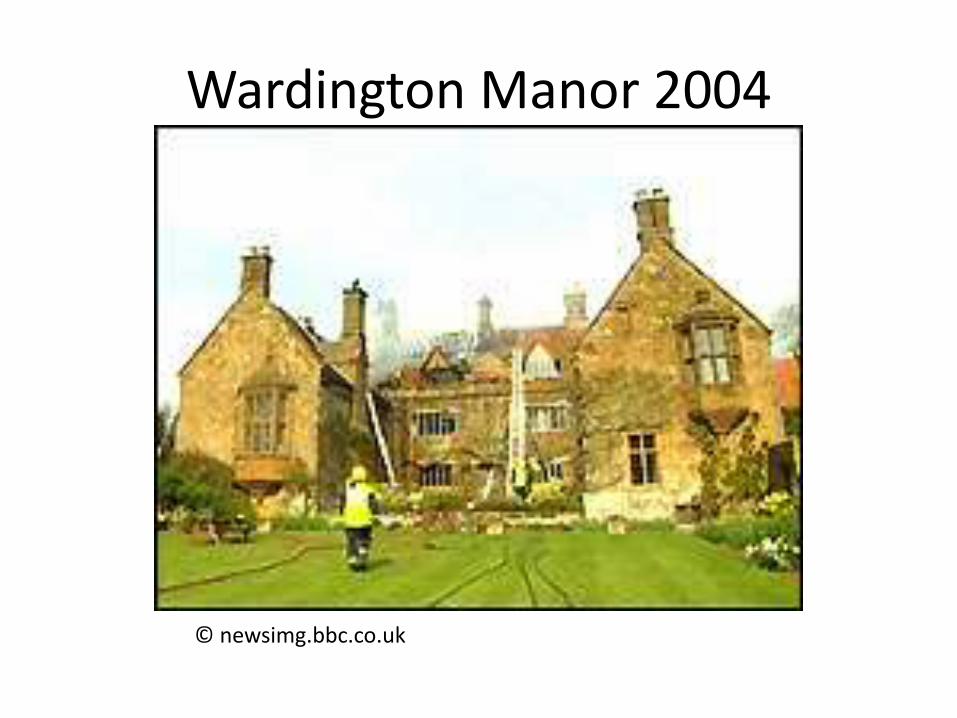
Wardington Manor 2004
© newsimg.bbc.co.uk

Hereford 2010
© static-secure.guim.co.uk
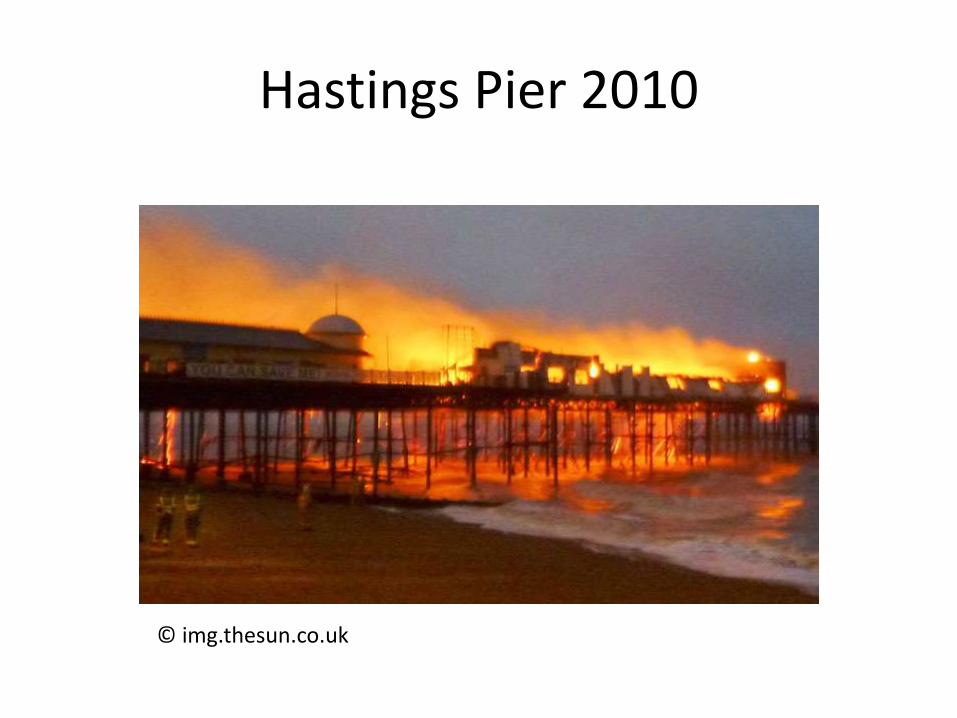
Hastings Pier 2010
© img.thesun.co.uk
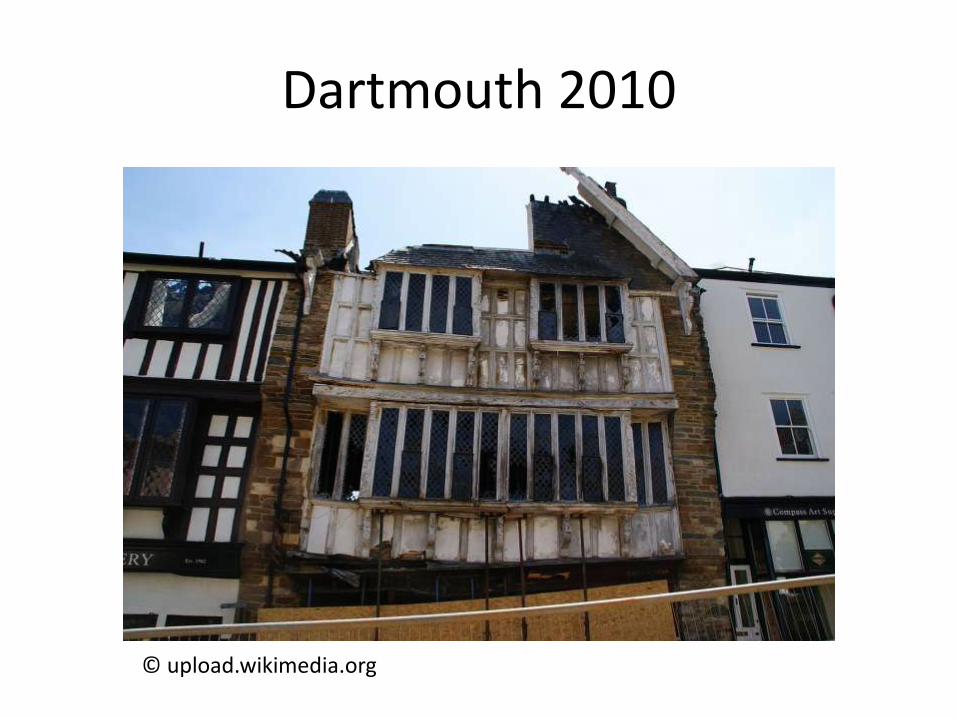
Dartmouth 2010
© upload.wikimedia.org
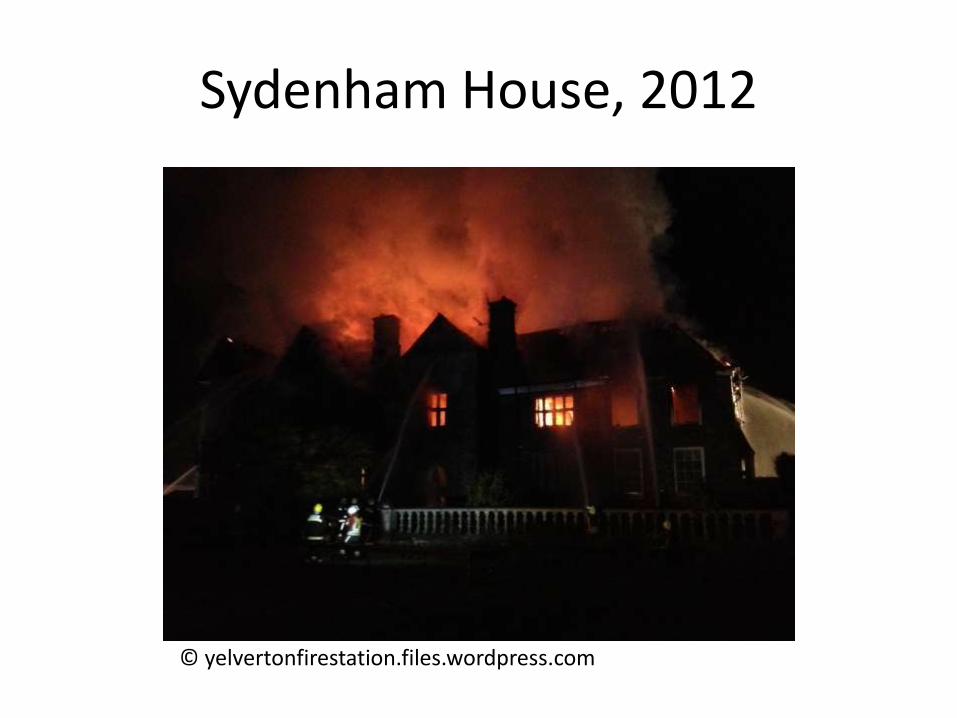
Sydenham House, 2012
© yelvertonfirestation.files.wordpress.com
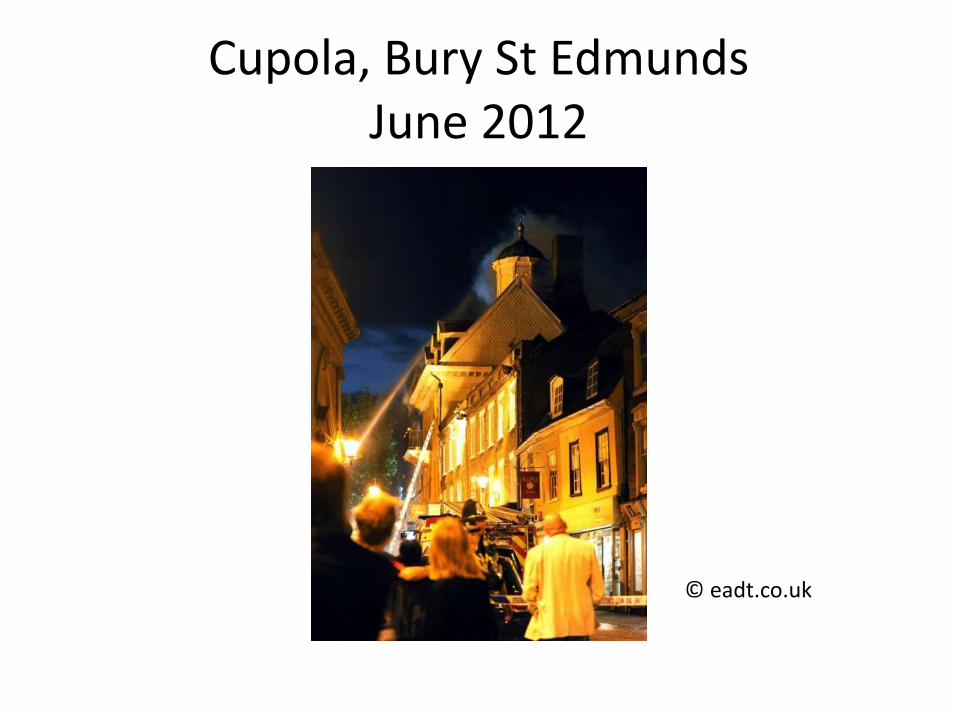
Cupola, Bury St EdmundsJune 2012
© eadt.co.uk

Cumin Museum 2013
© ichef-1.bbci.co.uk
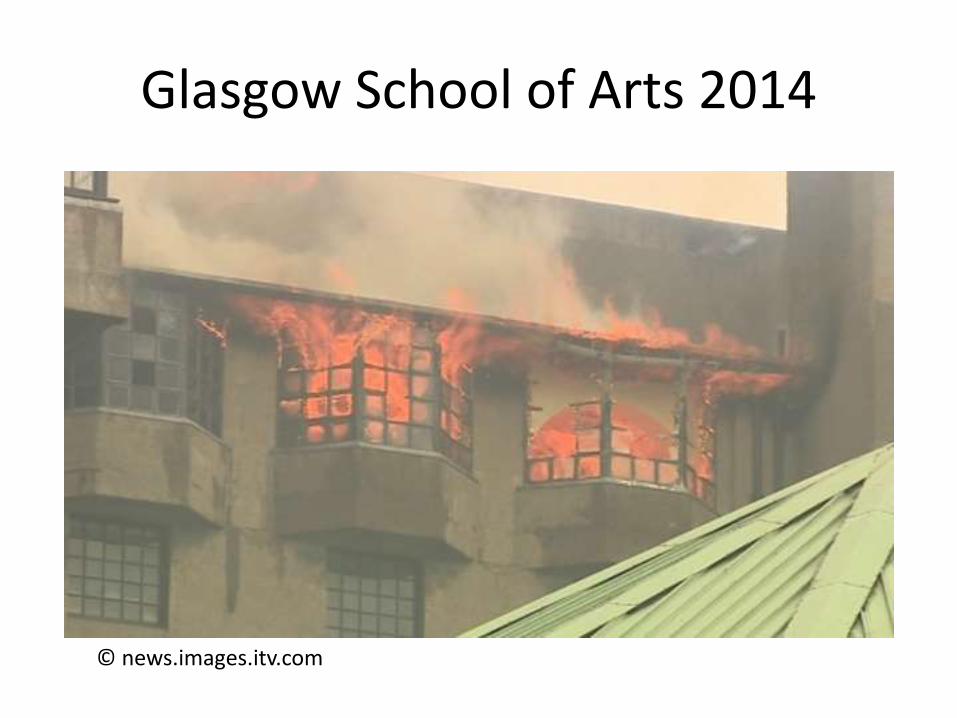
Glasgow School of Arts 2014
© news.images.itv.com
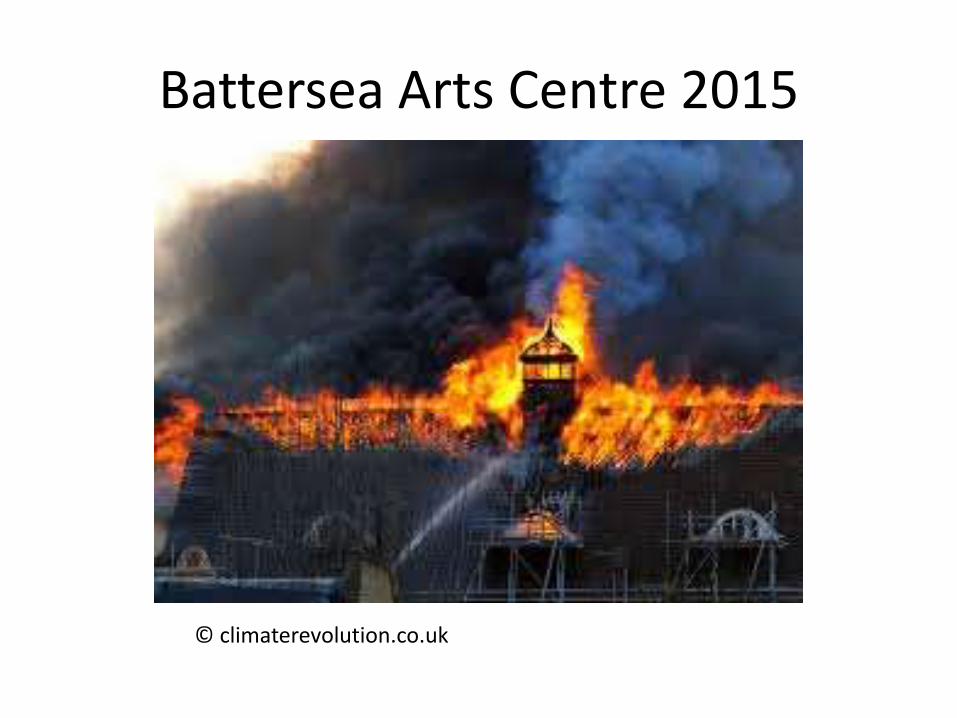
Battersea Arts Centre 2015
© climaterevolution.co.uk
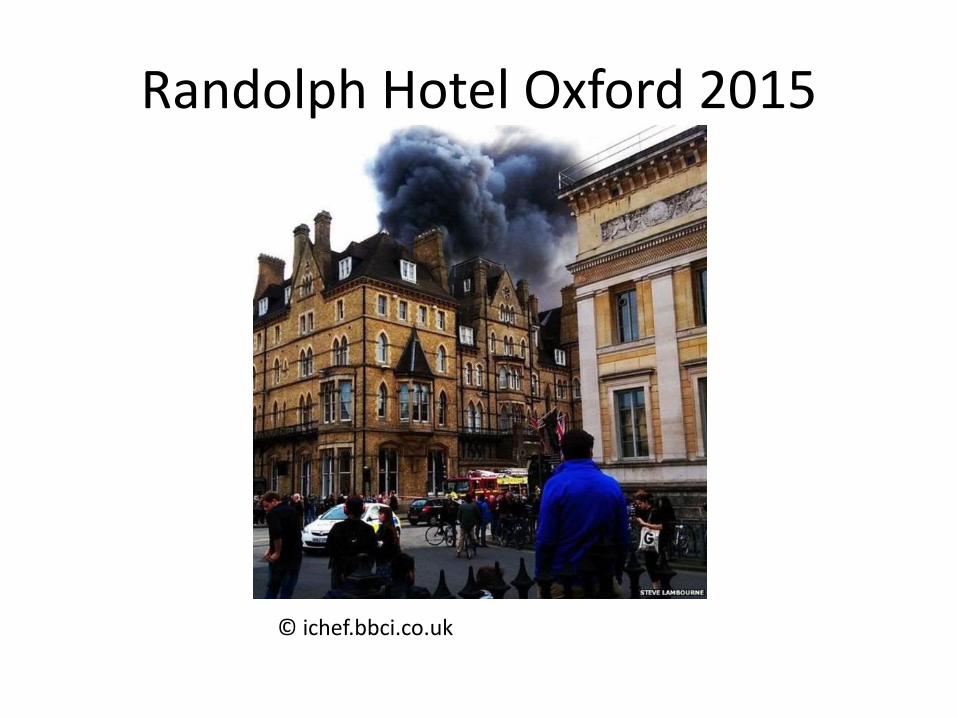
Randolph Hotel Oxford 2015
© ichef.bbci.co.uk
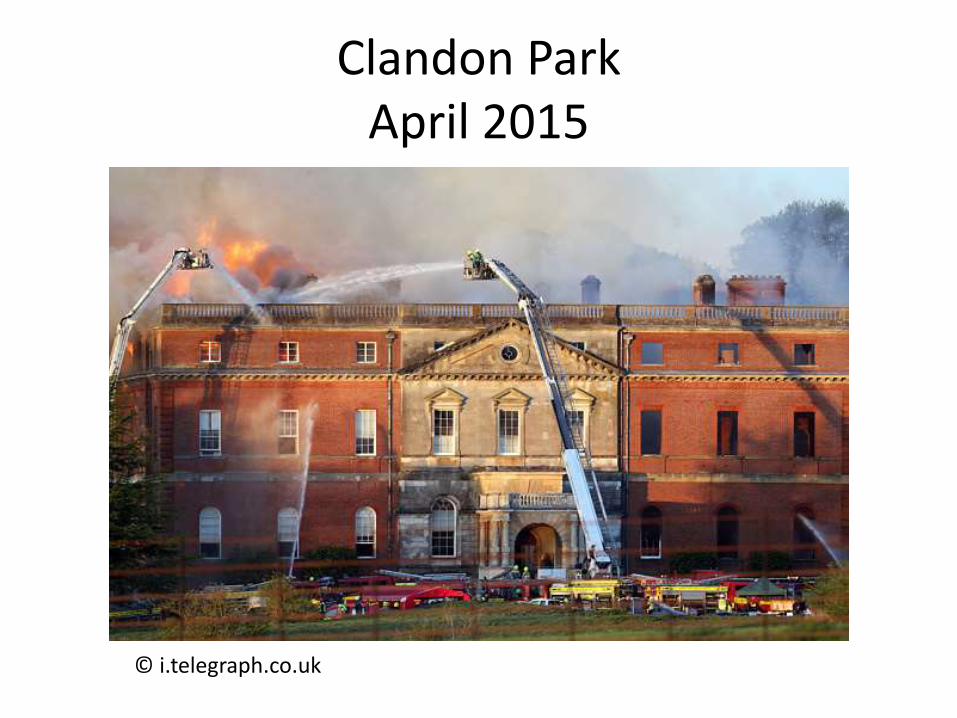
Clandon ParkApril 2015
© i.telegraph.co.uk
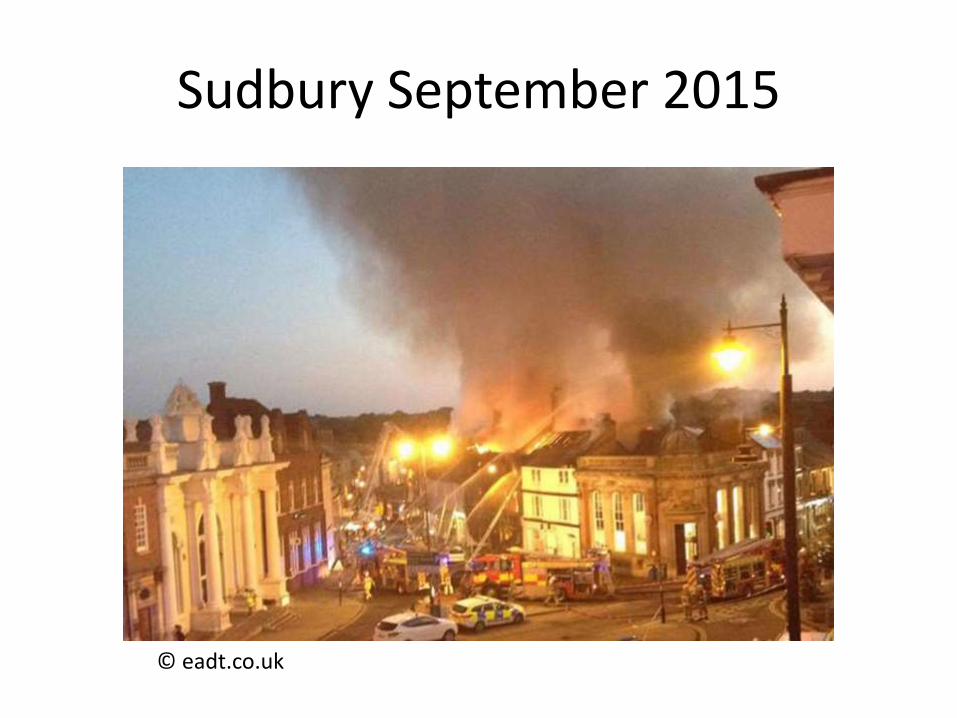
Sudbury September 2015
© eadt.co.uk
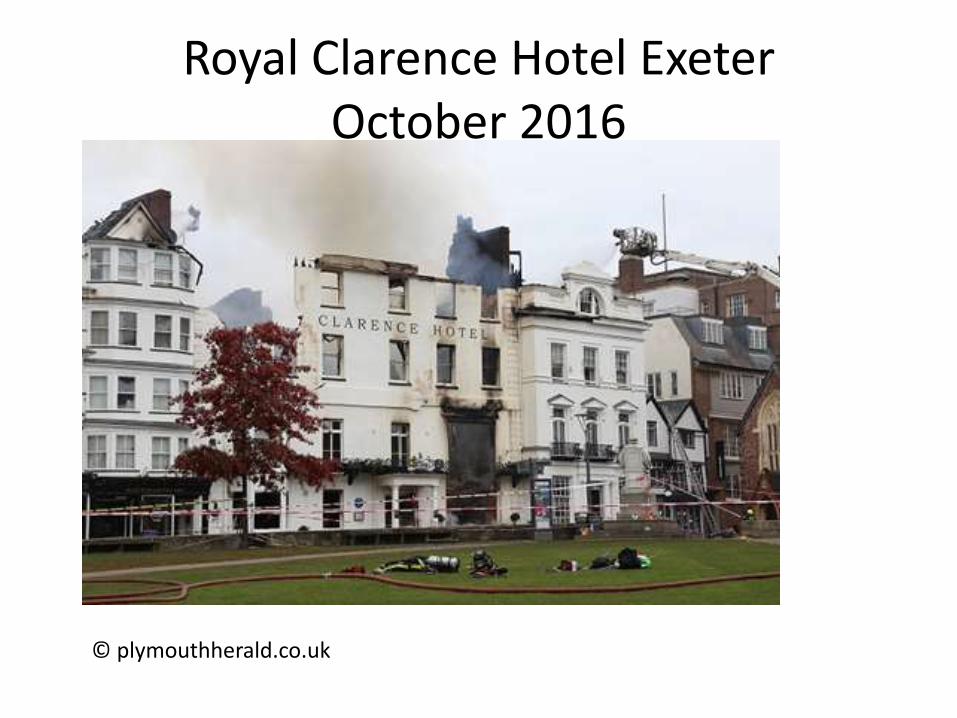
Royal Clarence Hotel Exeter October 2016
© plymouthherald.co.uk
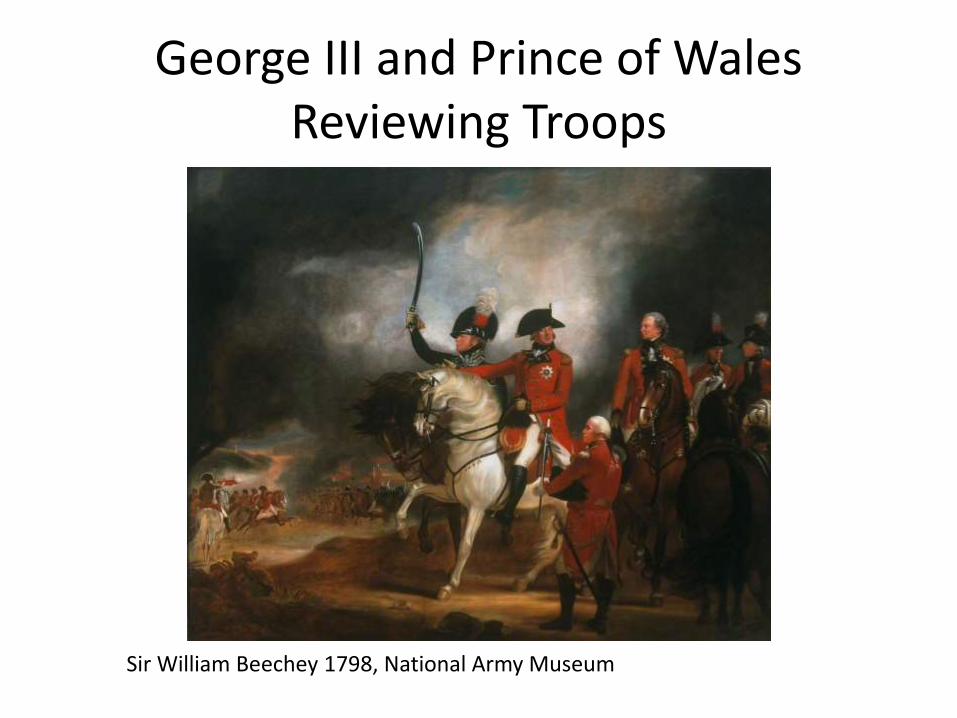
George III and Prince of Wales Reviewing Troops
Sir William Beechey 1798, National Army Museum
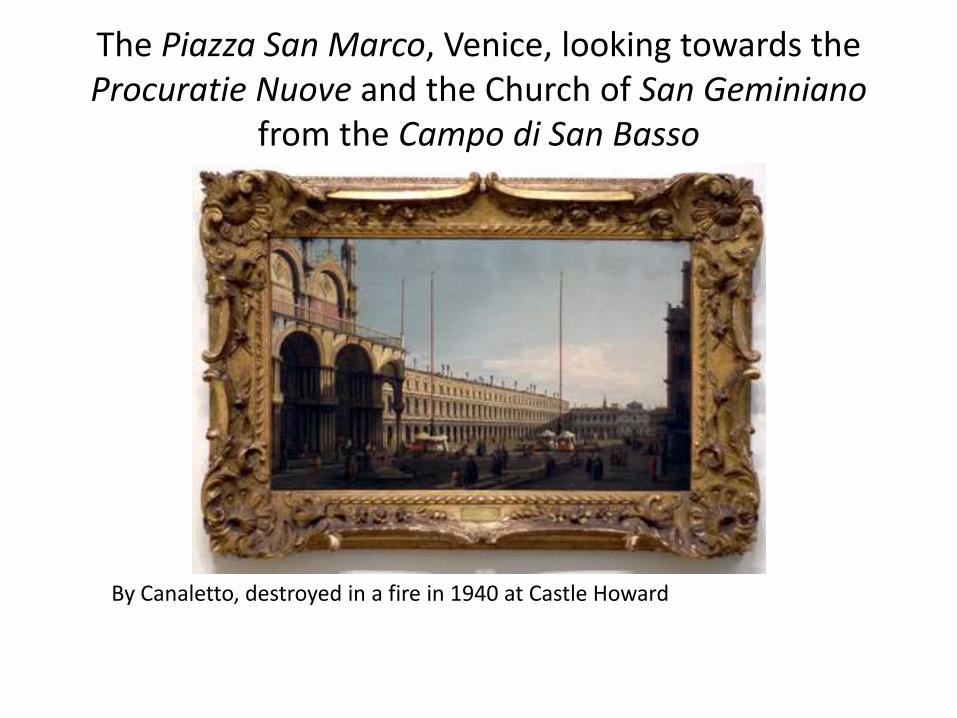
The Piazza San Marco, Venice, looking towards the Procuratie Nuove and the Church of San Geminiano
from the Campo di San Basso
By Canaletto, destroyed in a fire in 1940 at Castle Howard

We do not know how many fires we have in heritage buildings !
We do not know how many fires we have in heritage buildings !
●There are no statistics
Steve Emery
National Fire Advisor for Historic England
House of Lords - February 2016
To Summarise
• The single greatest risk to our built heritage is due to loss by fire.
• Fire destroys irreplaceable building fabric and contents
• There is much anecdotal evidence of the damage caused by fire, but there is no dataset that records the numbers of fires occurring in Heritage Buildings.
As fire statistics for fires in heritage buildings are not collected
• Risk factors leading to outbreak of fire
• How to protect heritage buildings from effect of fire
• How to measure efficacy of
– Prevention measures
– Fire Suppression
Without a monitoring system there is no evidence or method of evaluating
• Risk to heritage buildings, or
• Basic monitoring and evaluation of fire policies

How can we protect our heritage if we don’t
understand what the risk is?
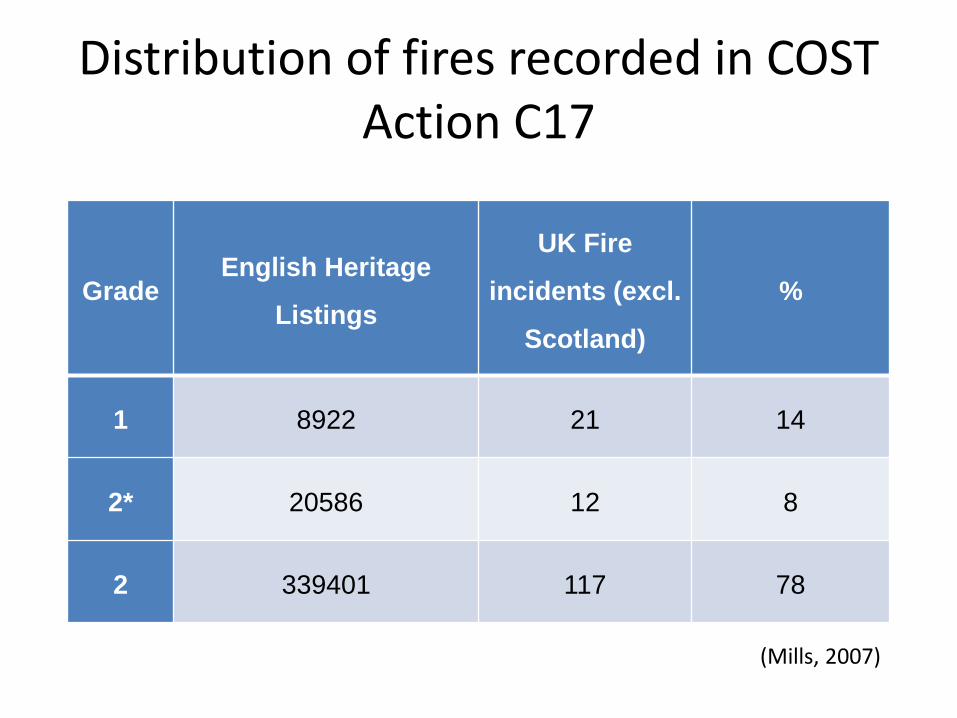
Distribution of fires recorded in COST Action C17
GradeEnglish Heritage
Listings
UK Fire
incidents (excl.
Scotland)
%
1 8922 21 14
2* 20586 12 8
2 339401 117 78
(Mills, 2007)
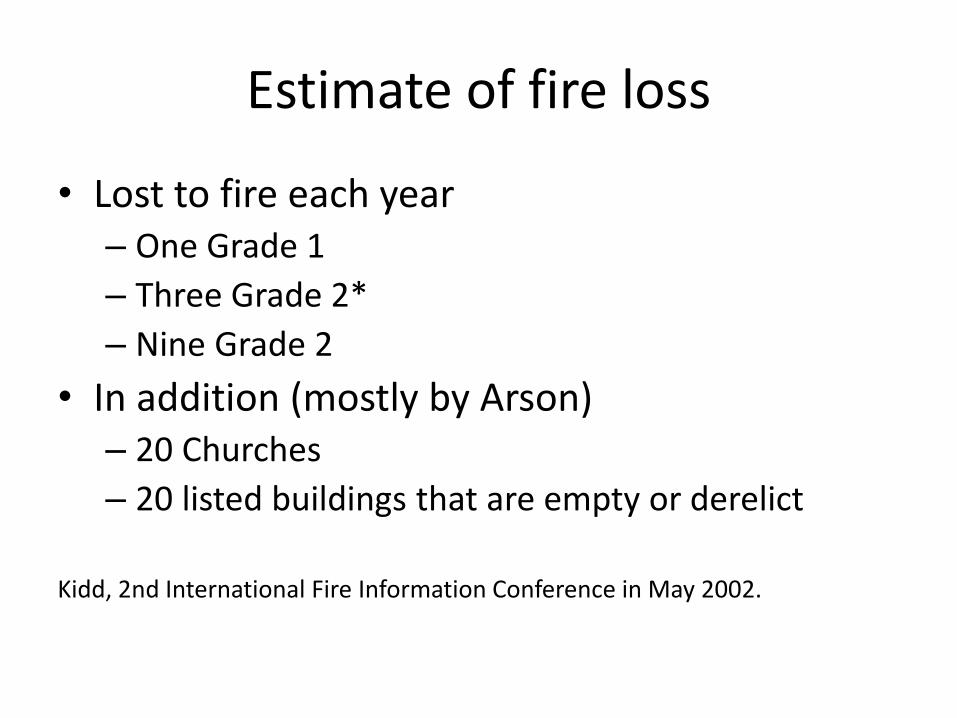
Estimate of fire loss
• Lost to fire each year– One Grade 1
– Three Grade 2*
– Nine Grade 2
• In addition (mostly by Arson)– 20 Churches
– 20 listed buildings that are empty or derelict
Kidd, 2nd International Fire Information Conference in May 2002.
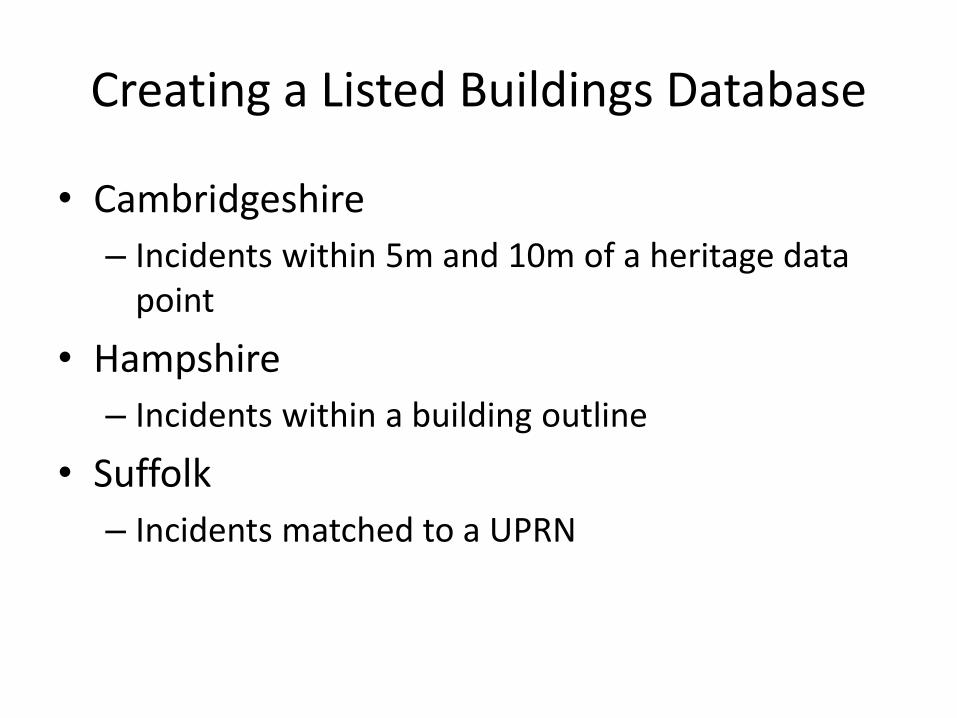
Creating a Listed Buildings Database
• Cambridgeshire
– Incidents within 5m and 10m of a heritage data point
• Hampshire
– Incidents within a building outline
• Suffolk
– Incidents matched to a UPRN
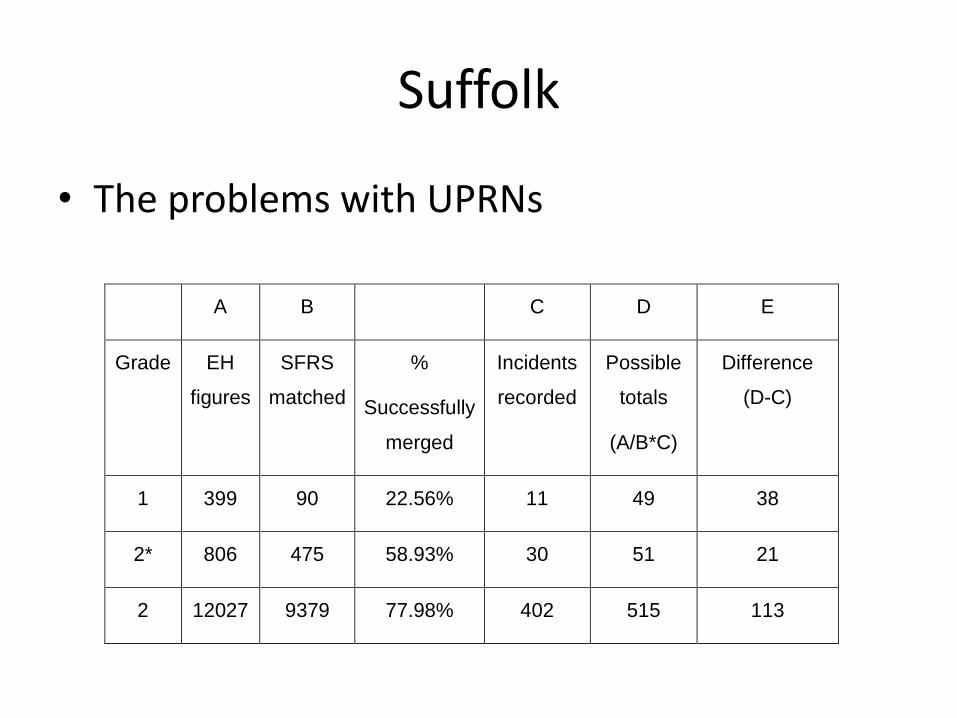
Suffolk
• The problems with UPRNs
A B C D E
Grade EH
figures
SFRS
matched
%
Successfully
merged
Incidents
recorded
Possible
totals
(A/B*C)
Difference
(D-C)
1 399 90 22.56% 11 49 38
2* 806 475 58.93% 30 51 21
2 12027 9379 77.98% 402 515 113
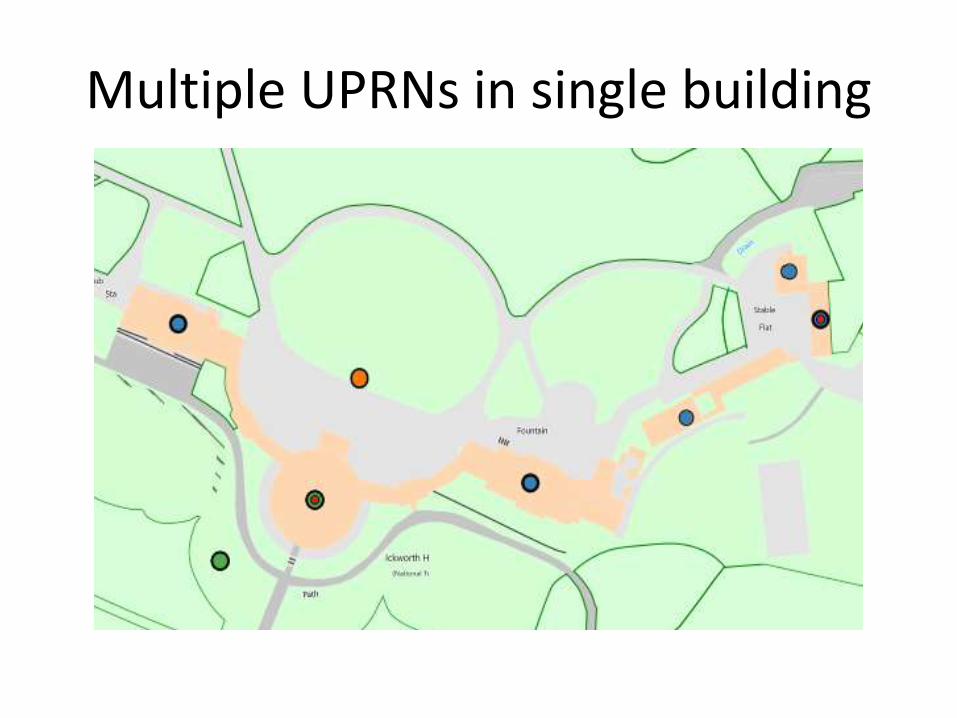
Multiple UPRNs in single building
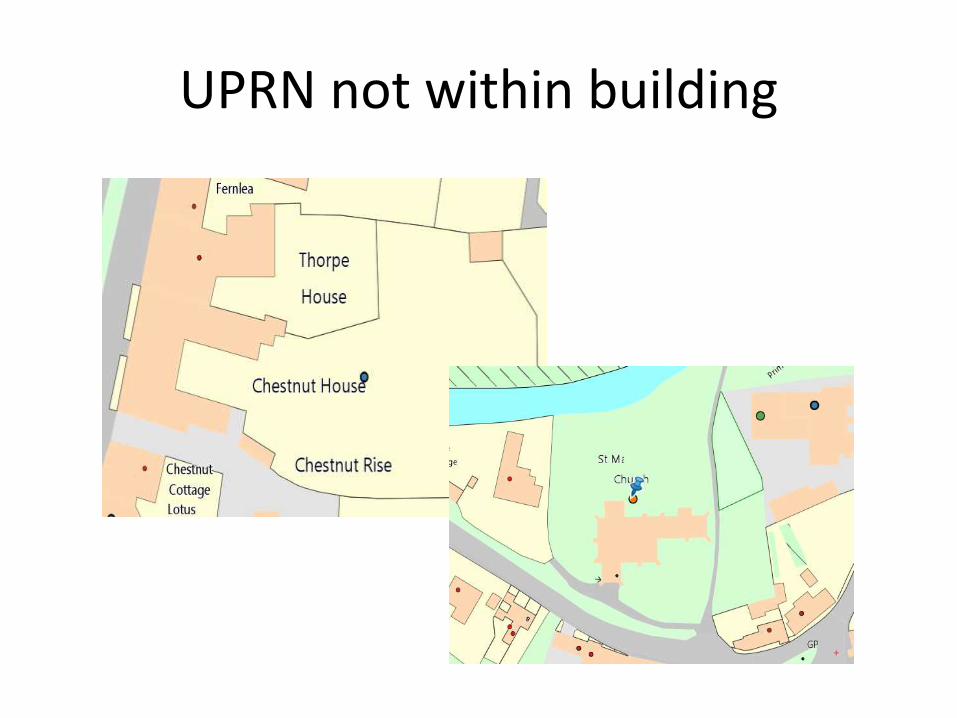
UPRN not within building
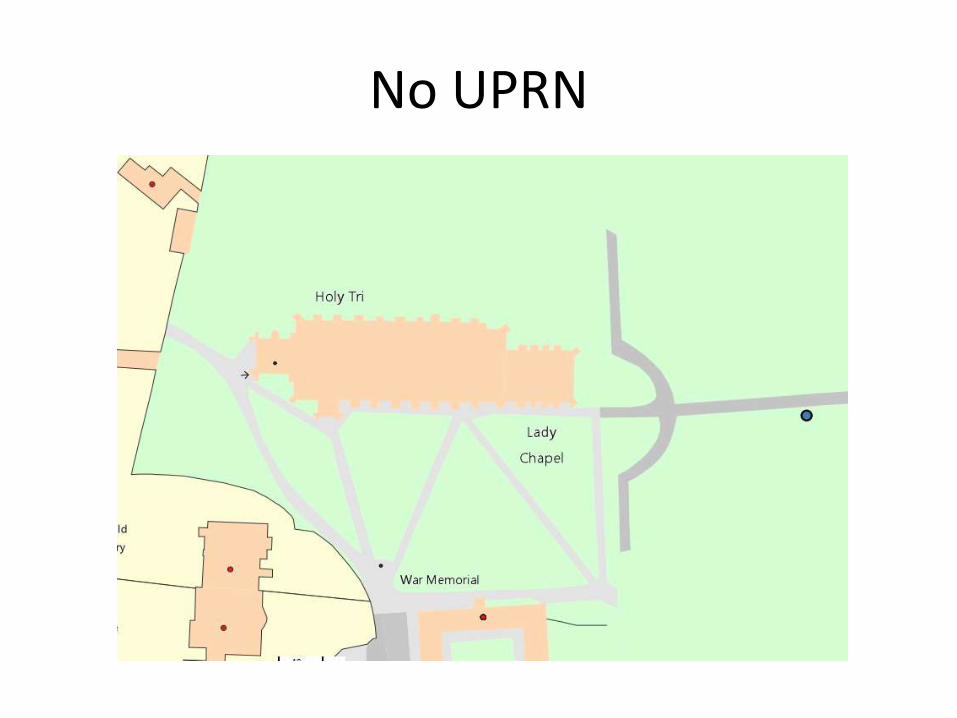
No UPRN
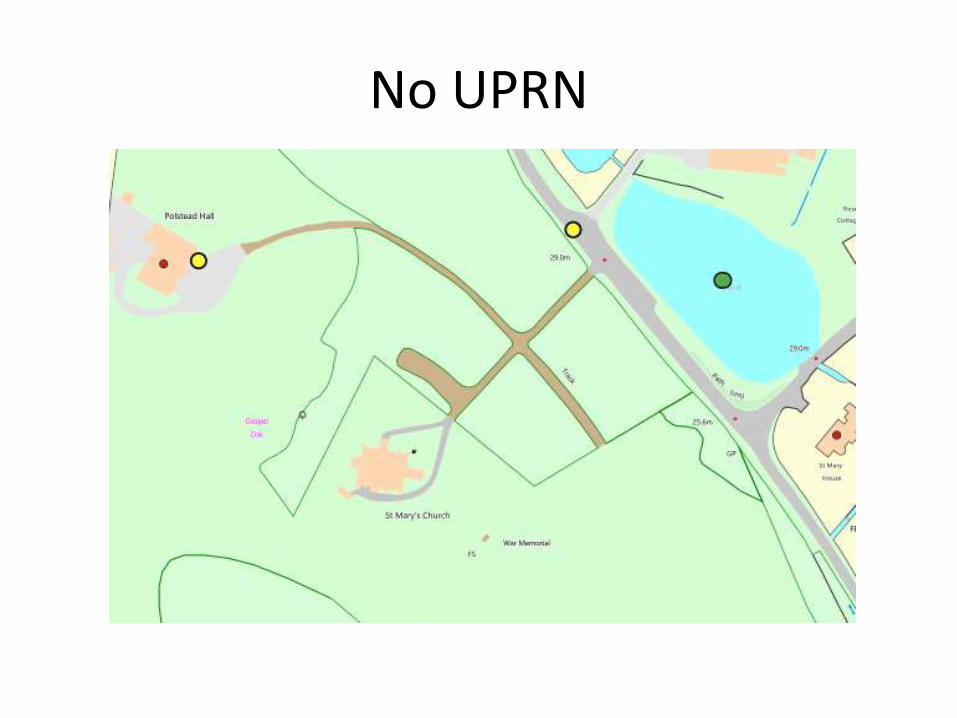
No UPRN
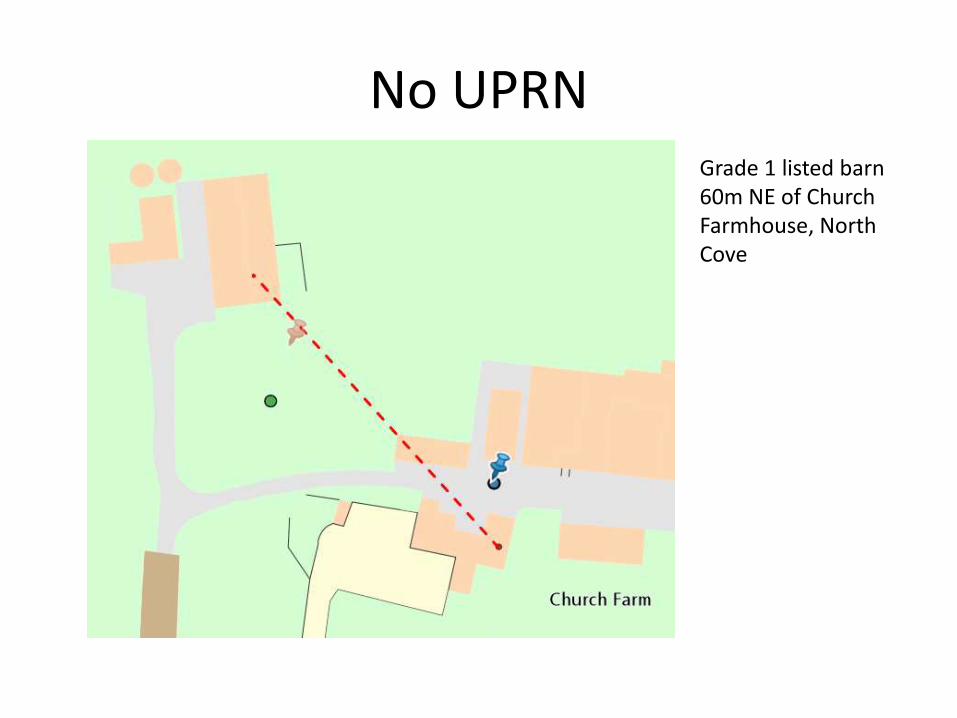
No UPRNGrade 1 listed barn 60m NE of Church Farmhouse, North Cove
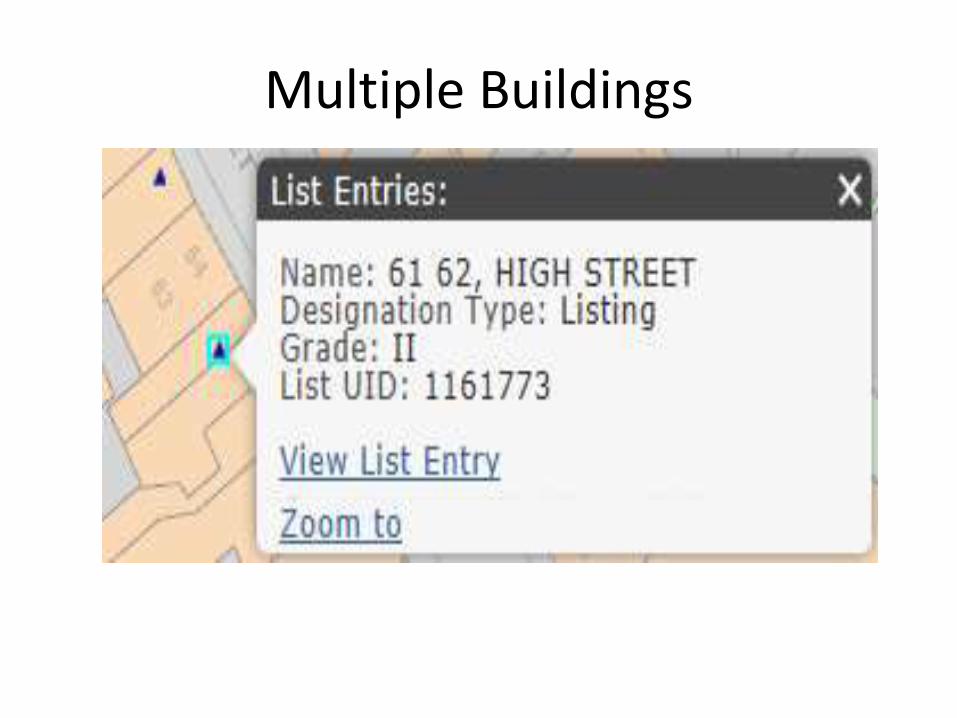
Multiple Buildings
Listing data, recorded incidents
and
Fire Frequency
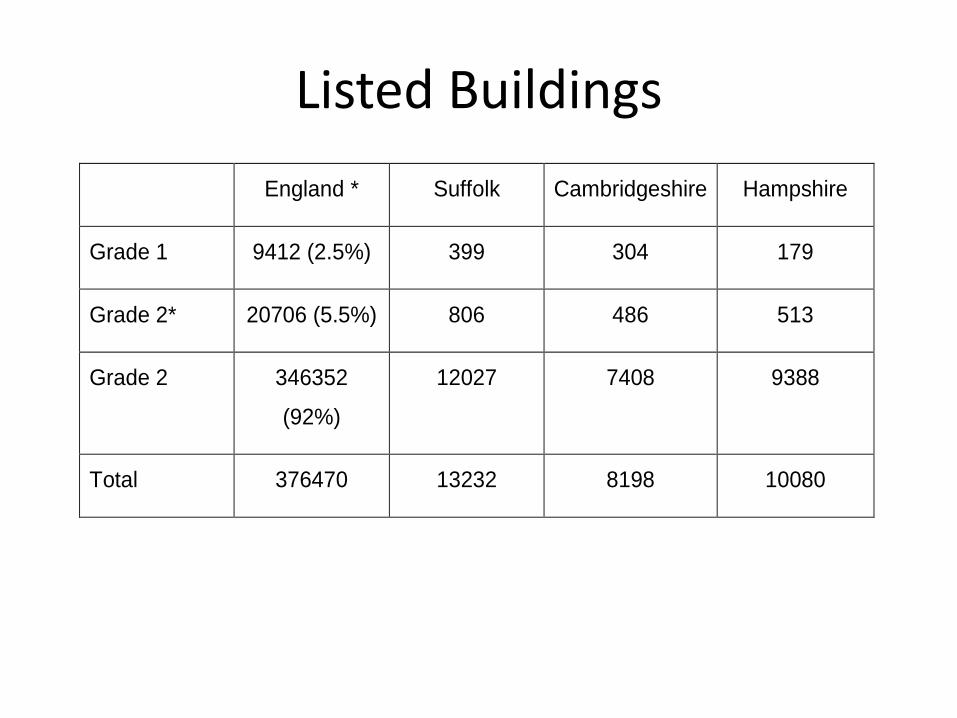
Listed Buildings
England * Suffolk Cambridgeshire Hampshire
Grade 1 9412 (2.5%) 399 304 179
Grade 2* 20706 (5.5%) 806 486 513
Grade 2 346352
(92%)
12027 7408 9388
Total 376470 13232 8198 10080
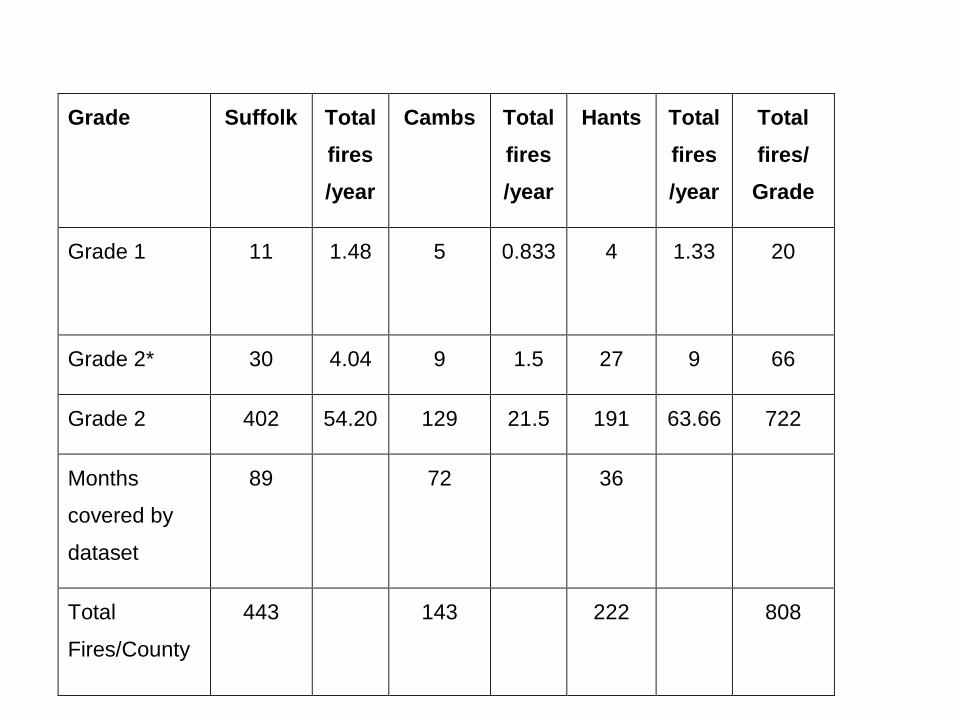
Grade Suffolk Total
fires
/year
Cambs Total
fires
/year
Hants Total
fires
/year
Total
fires/
Grade
Grade 1 11 1.48
5 0.833 4 1.33 20
Grade 2* 30 4.04 9 1.5 27 9 66
Grade 2 402 54.20 129 21.5 191 63.66 722
Months
covered by
dataset
89 72 36
Total
Fires/County
443
143 222 808
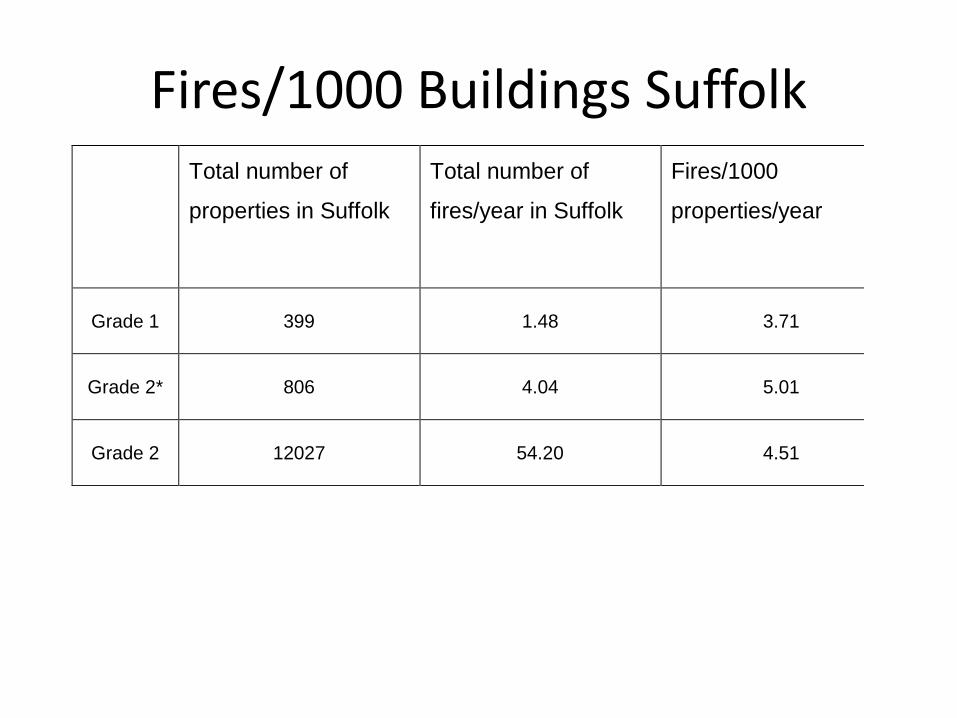
Fires/1000 Buildings Suffolk Total number of
properties in Suffolk
Total number of
fires/year in Suffolk
Fires/1000
properties/year
Grade 1 399 1.48 3.71
Grade 2* 806 4.04 5.01
Grade 2 12027 54.20 4.51
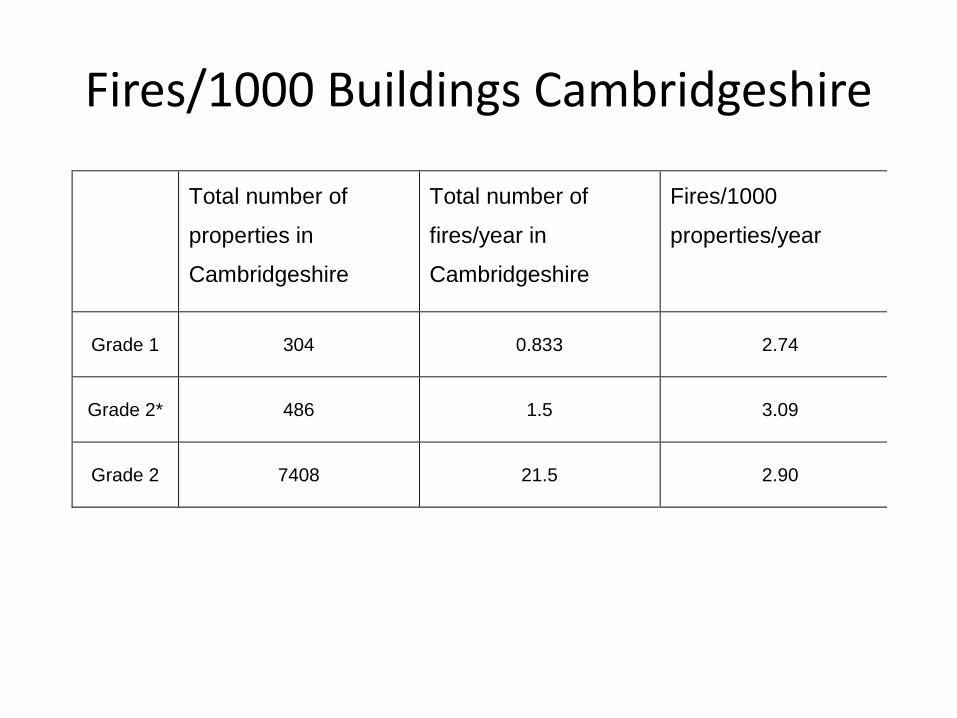
Fires/1000 Buildings Cambridgeshire
Total number of
properties in
Cambridgeshire
Total number of
fires/year in
Cambridgeshire
Fires/1000
properties/year
Grade 1 304 0.833 2.74
Grade 2* 486 1.5 3.09
Grade 2 7408 21.5 2.90
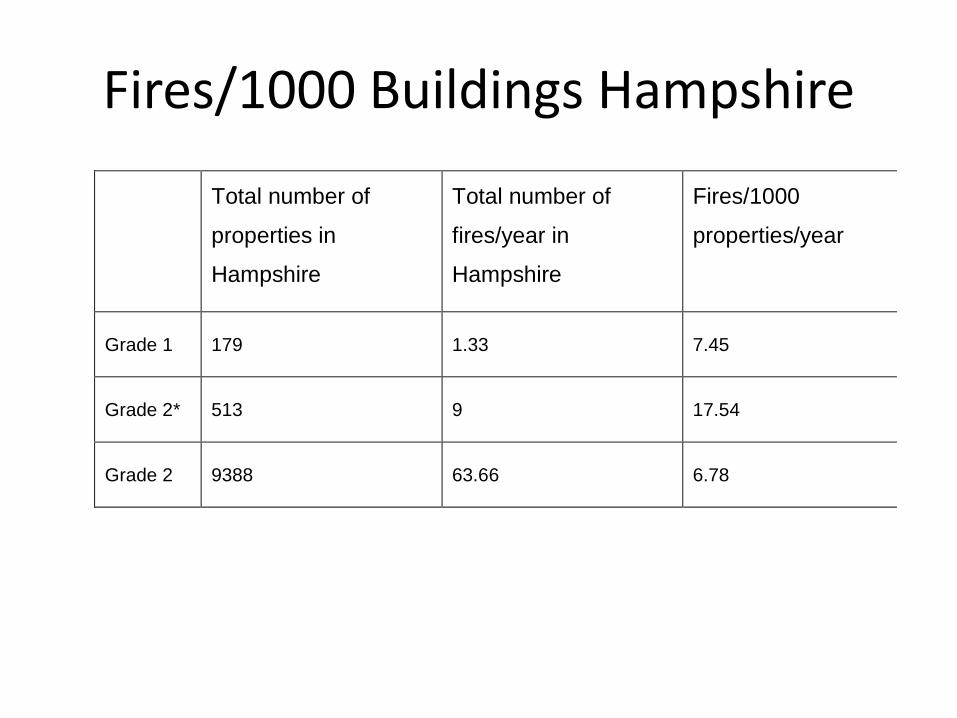
Fires/1000 Buildings Hampshire
Total number of
properties in
Hampshire
Total number of
fires/year in
Hampshire
Fires/1000
properties/year
Grade 1 179 1.33 7.45
Grade 2* 513 9 17.54
Grade 2 9388 63.66 6.78
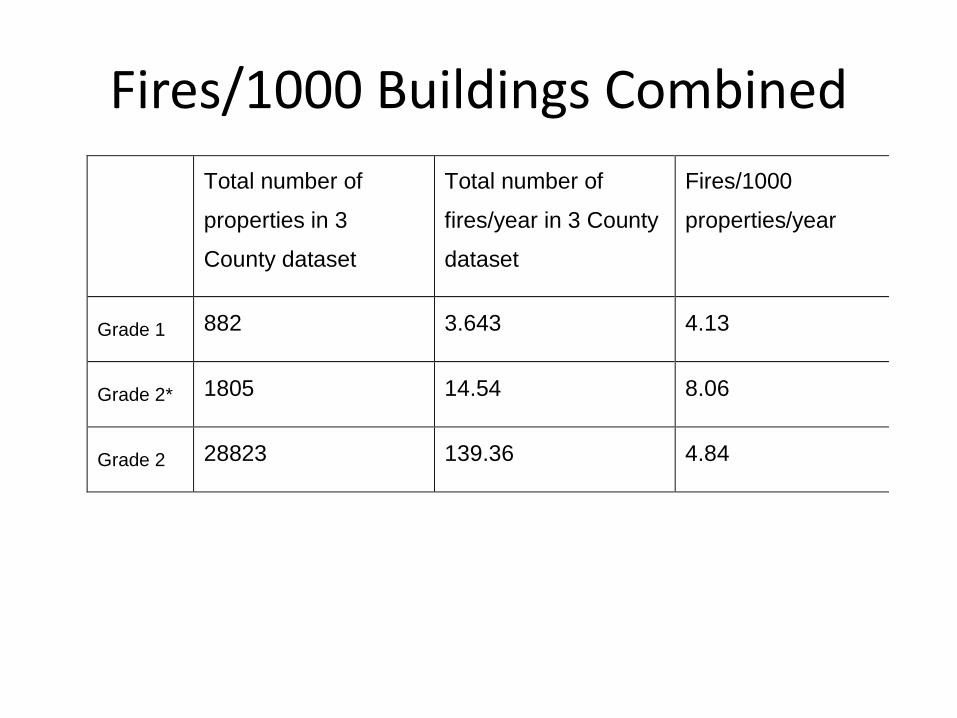
Fires/1000 Buildings Combined
Total number of
properties in 3
County dataset
Total number of
fires/year in 3 County
dataset
Fires/1000
properties/year
Grade 1 882 3.643 4.13
Grade 2* 1805 14.54 8.06
Grade 2 28823 139.36 4.84
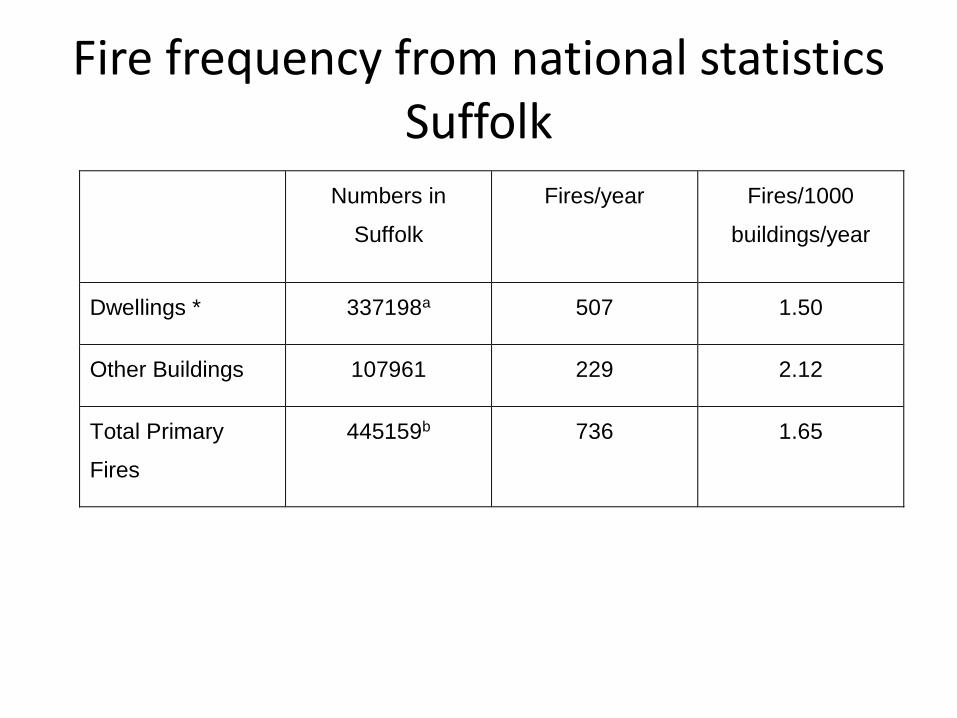
Fire frequency from national statistics Suffolk
Numbers in
Suffolk
Fires/year
Fires/1000
buildings/year
Dwellings * 337198a 507 1.50
Other Buildings 107961 229 2.12
Total Primary
Fires
445159b 736 1.65
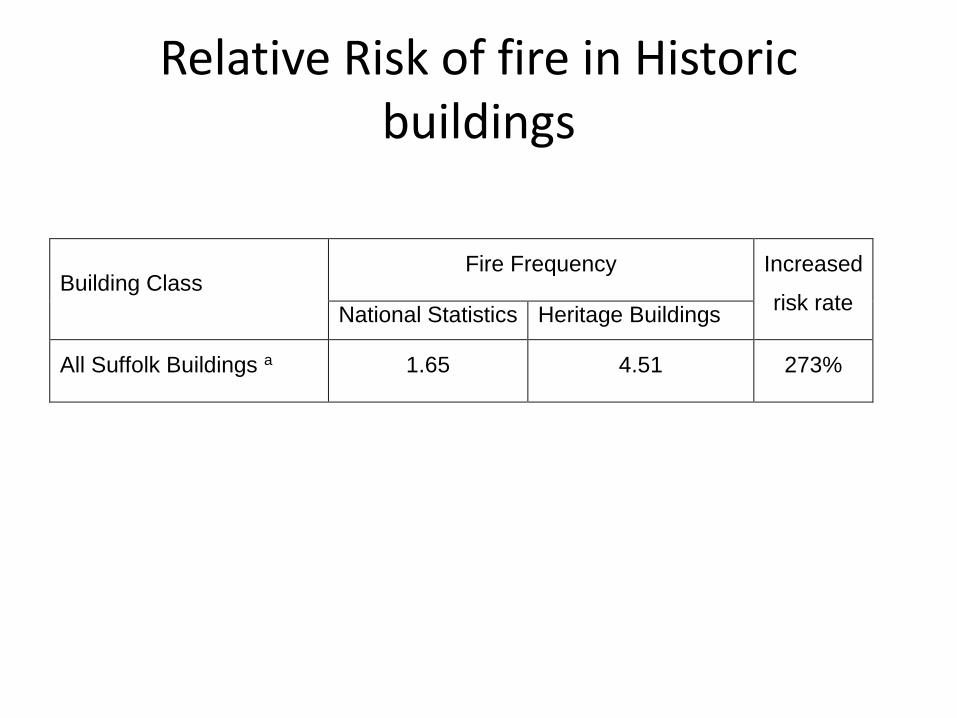
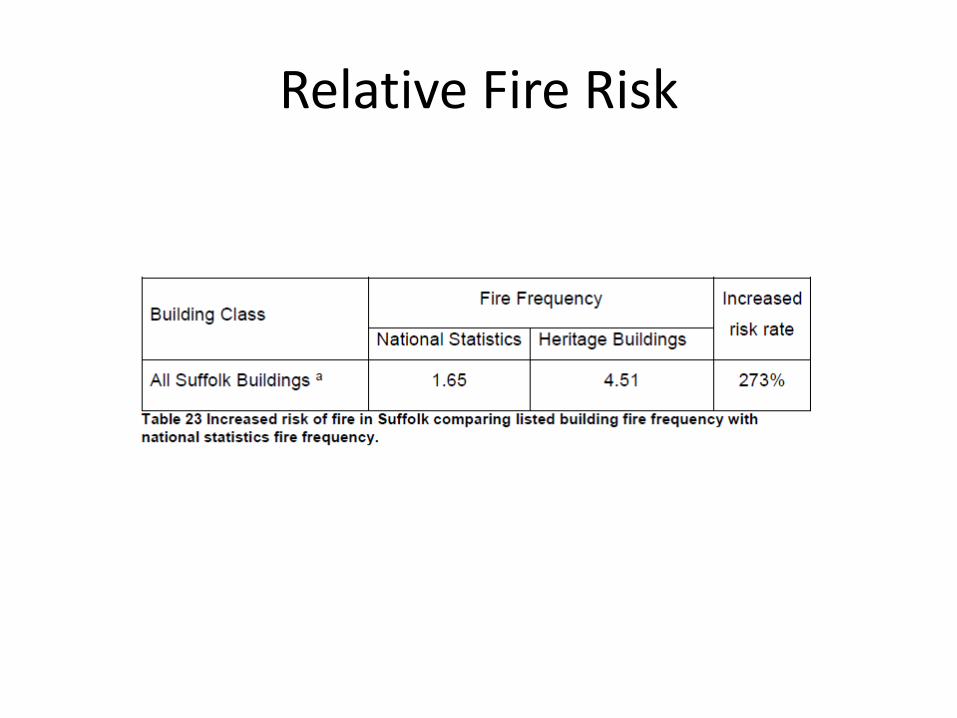
Relative Risk of fire in Historic buildings
Building Class Fire Frequency Increased
risk rate National Statistics Heritage Buildings
All Suffolk Buildings a 1.65 4.51 273%
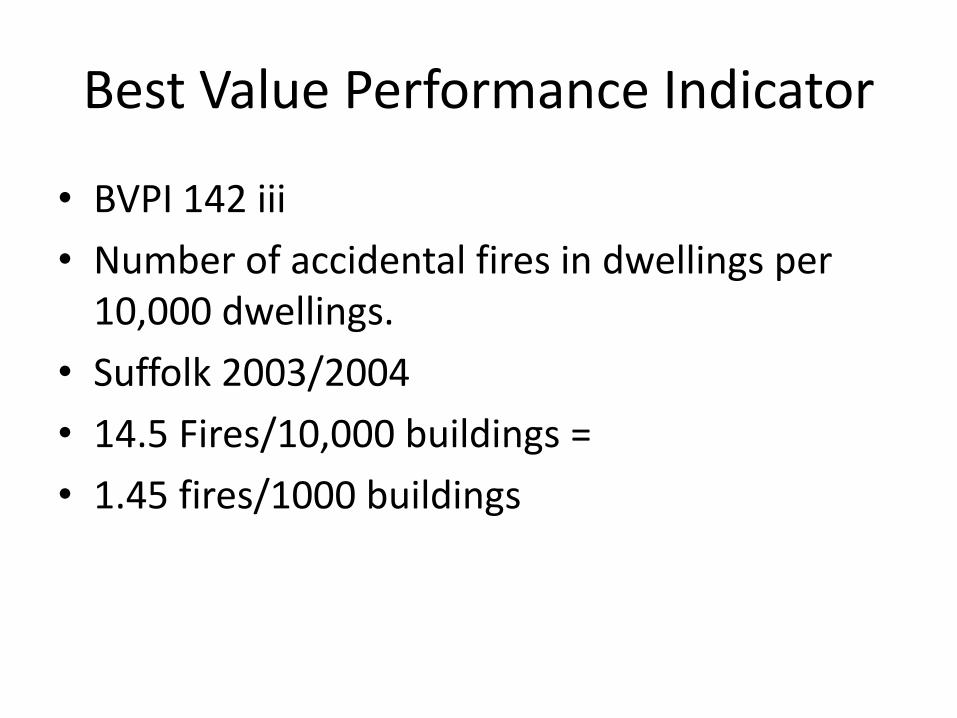
Best Value Performance Indicator
• BVPI 142 iii
• Number of accidental fires in dwellings per 10,000 dwellings.
• Suffolk 2003/2004
• 14.5 Fires/10,000 buildings =
• 1.45 fires/1000 buildings
Causes of Fire – Suffolk
Data Analysis
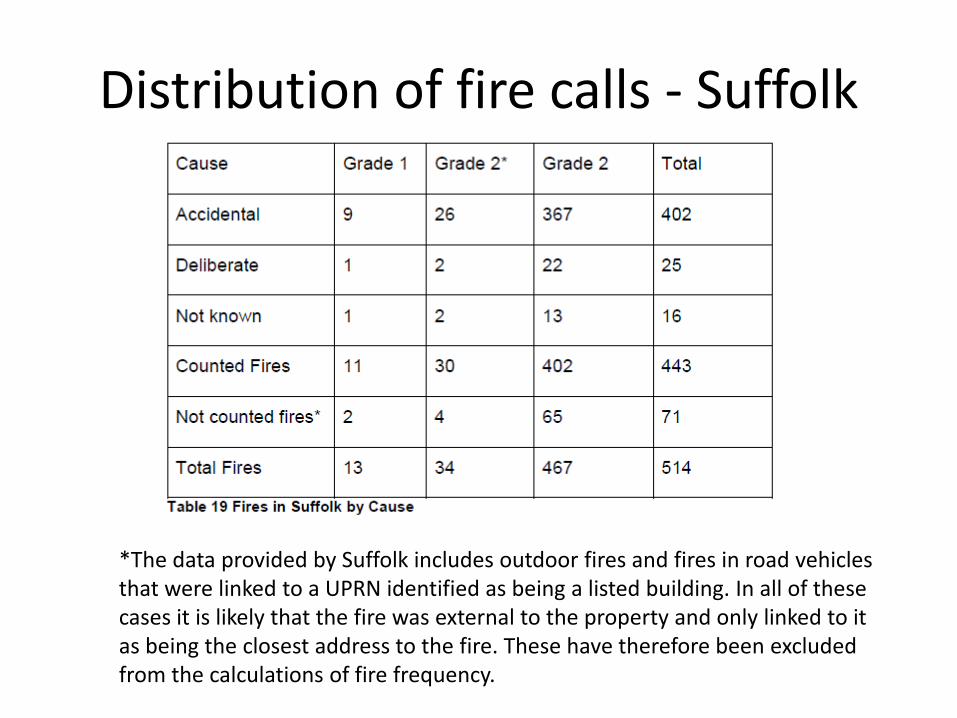
Distribution of fire calls - Suffolk
*The data provided by Suffolk includes outdoor fires and fires in road vehicles that were linked to a UPRN identified as being a listed building. In all of these cases it is likely that the fire was external to the property and only linked to it as being the closest address to the fire. These have therefore been excluded from the calculations of fire frequency.
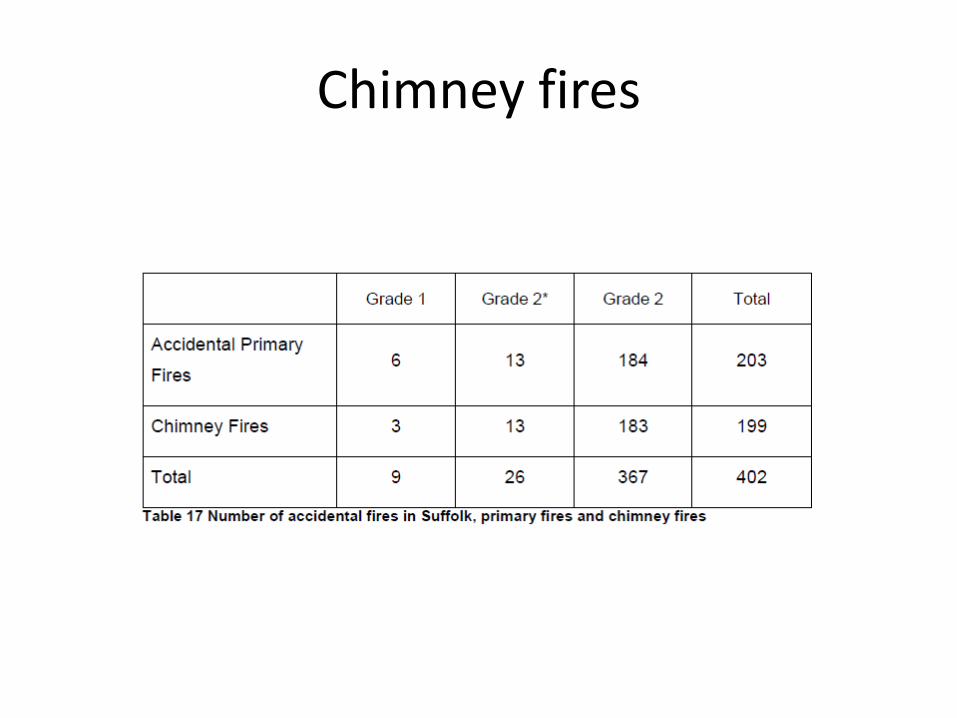
Chimney fires
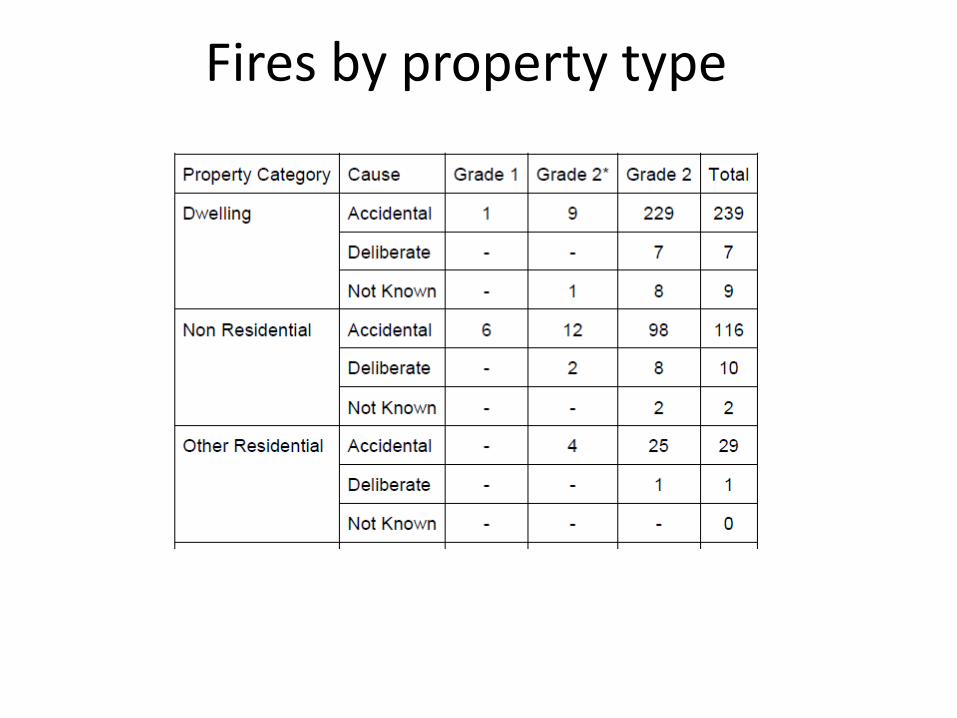
Fires by property type
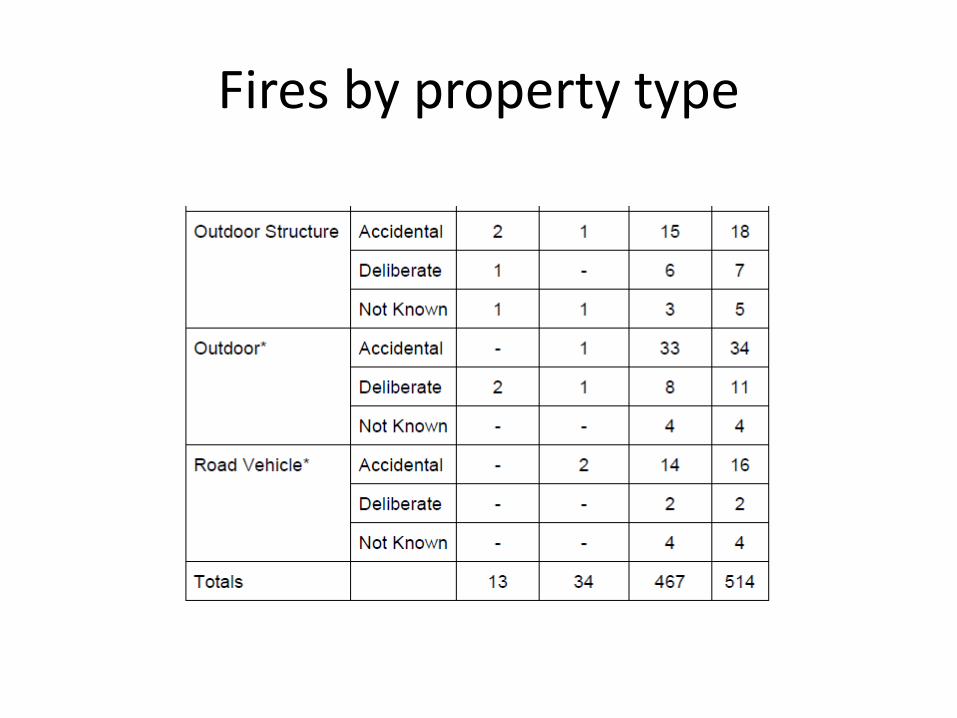
Fires by property type
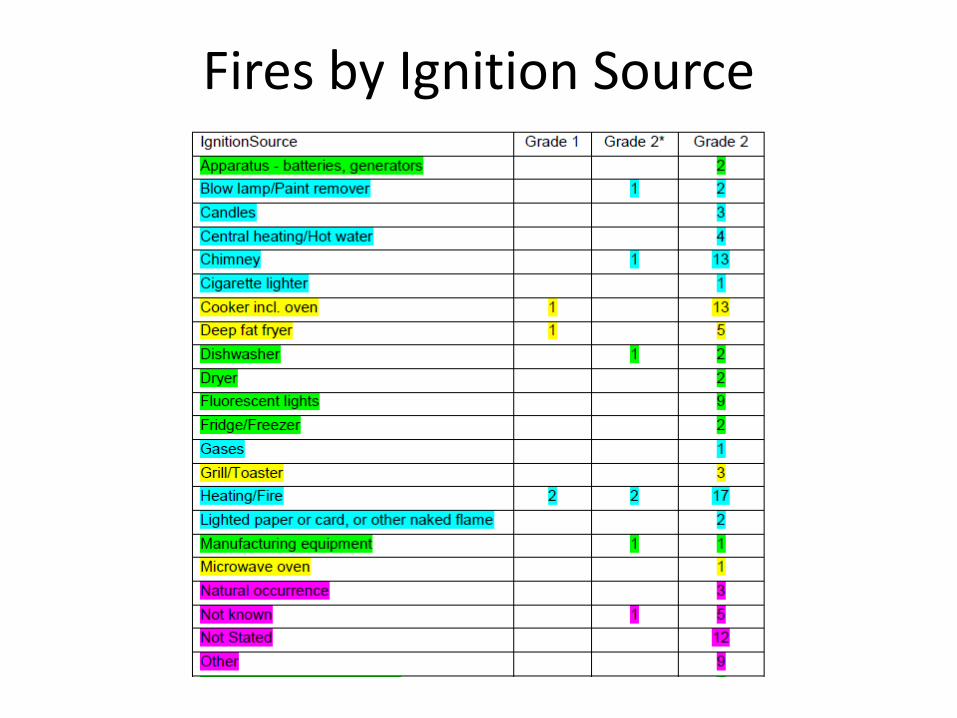
Fires by Ignition Source
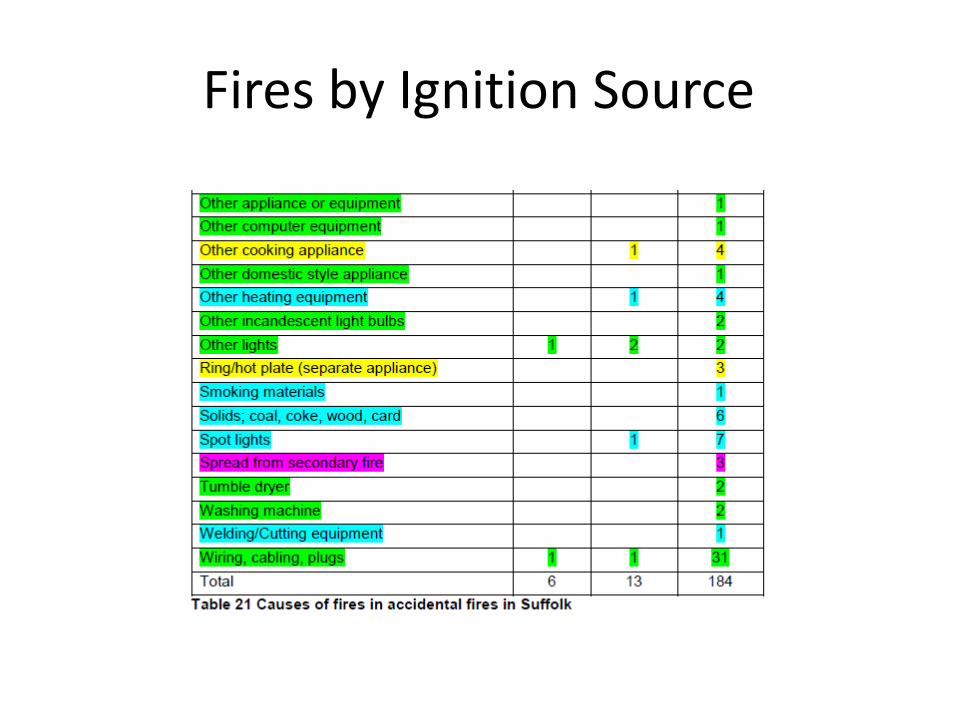
Fires by Ignition Source
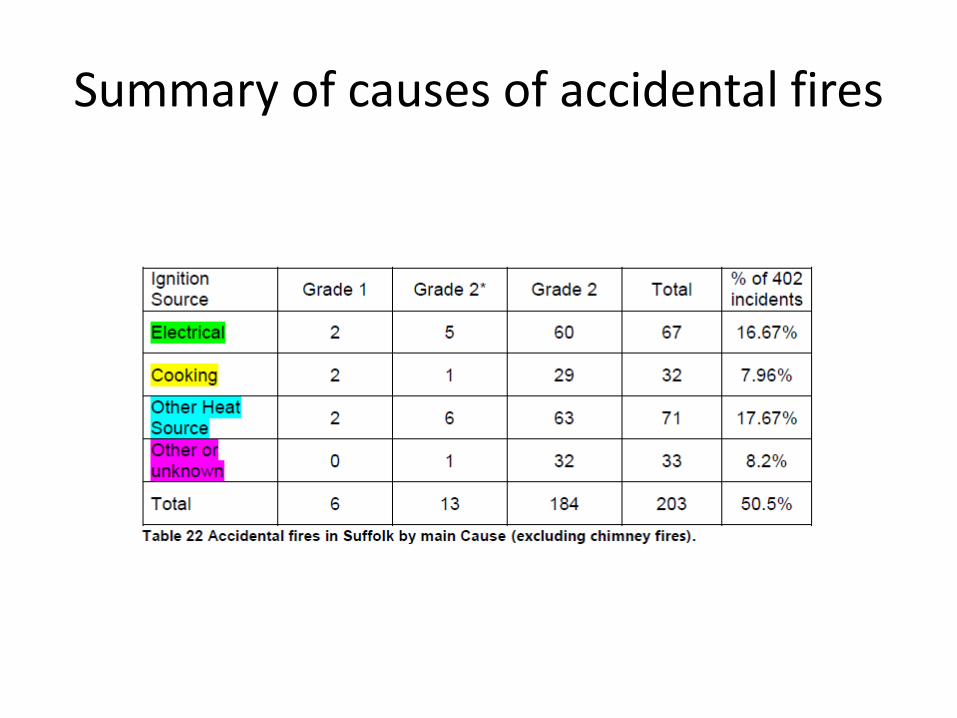
Summary of causes of accidental fires
Discussion of Relative Risk
Relative Fire Risk
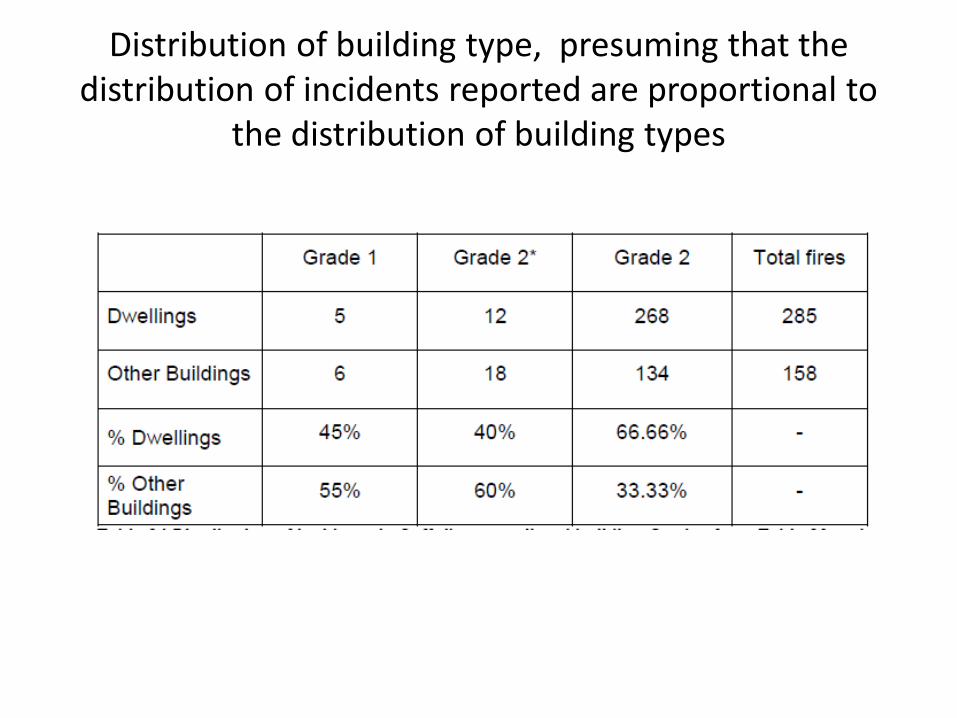
Distribution of building type, presuming that the distribution of incidents reported are proportional to
the distribution of building types
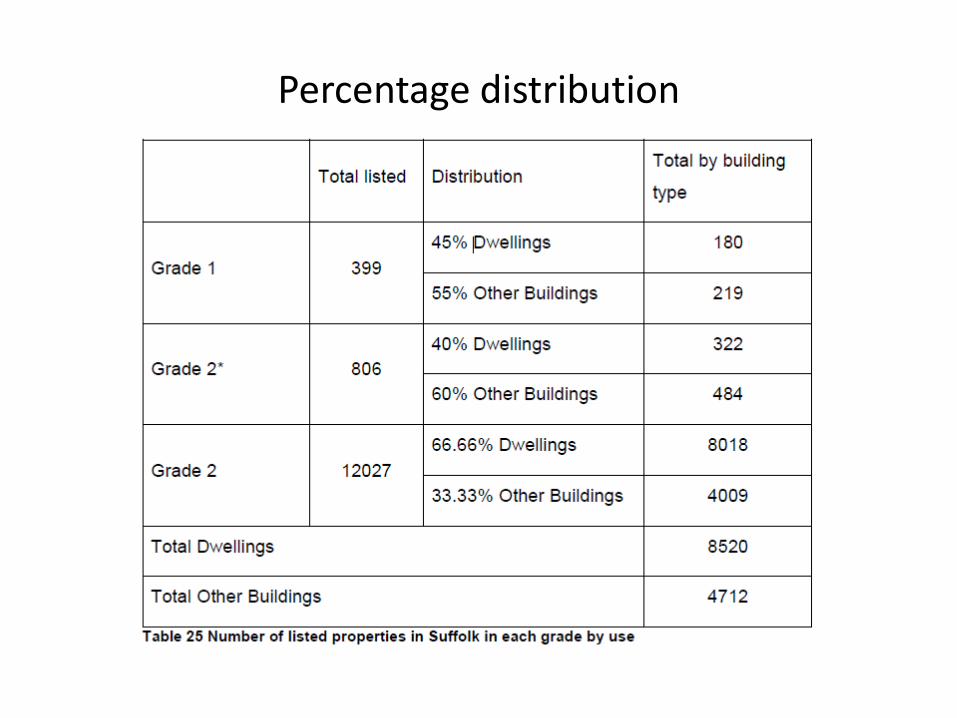
Percentage distribution
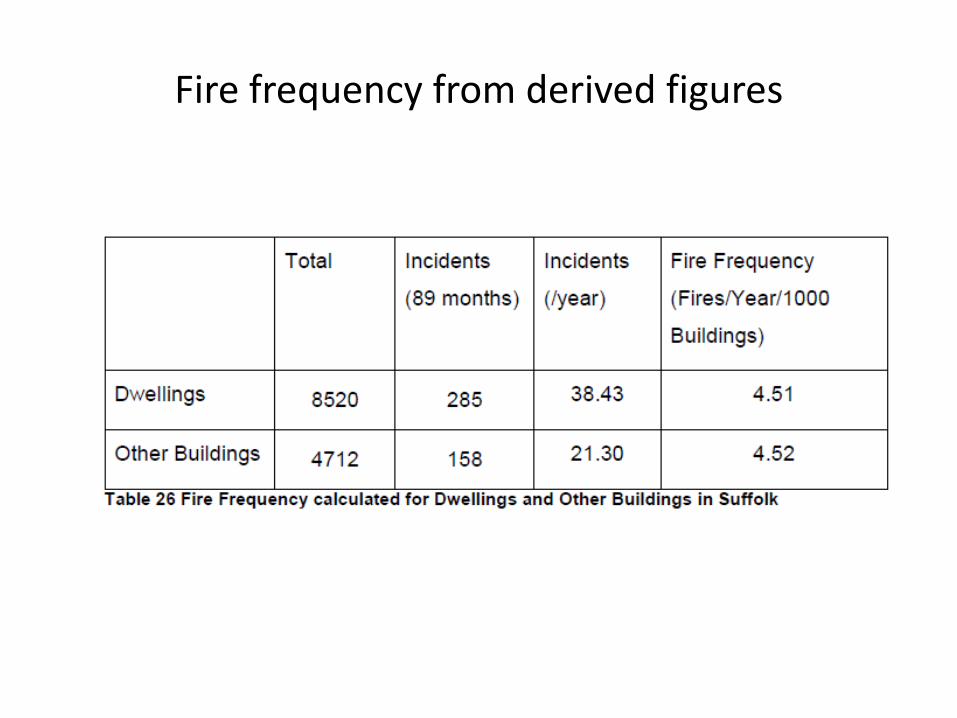
Fire frequency from derived figures
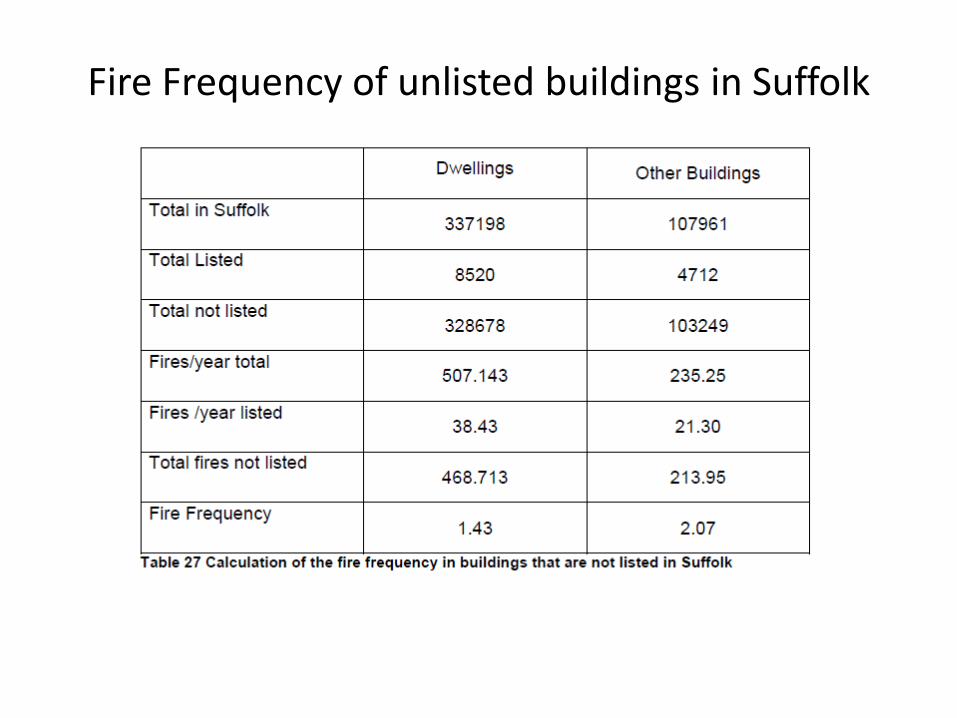
Fire Frequency of unlisted buildings in Suffolk
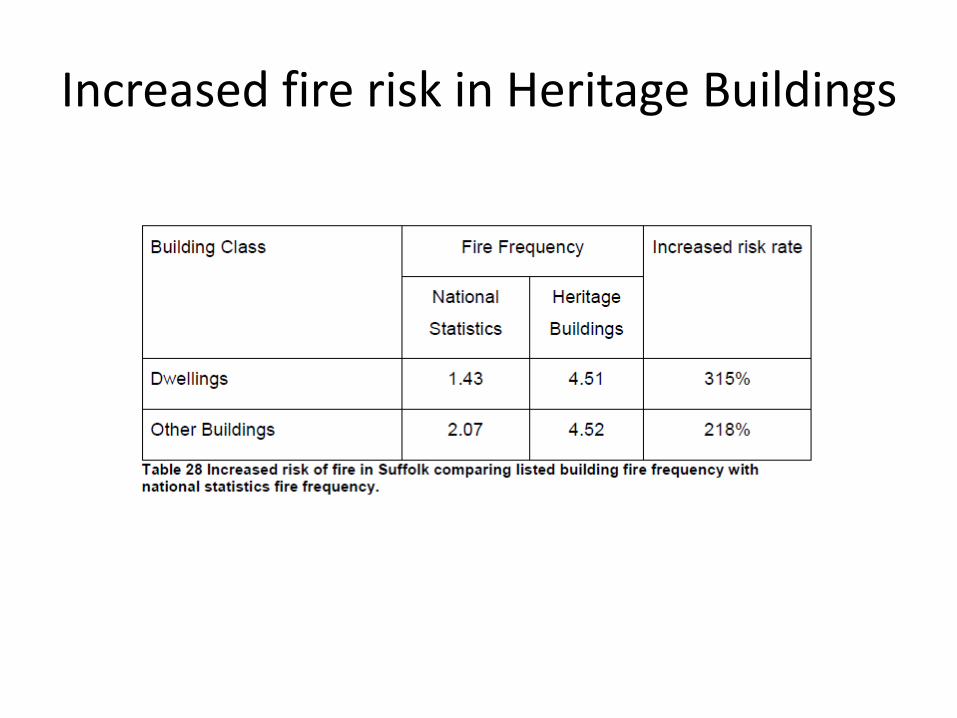
Increased fire risk in Heritage Buildings

CONCLUSIONS AND RECOMMENDATIONS
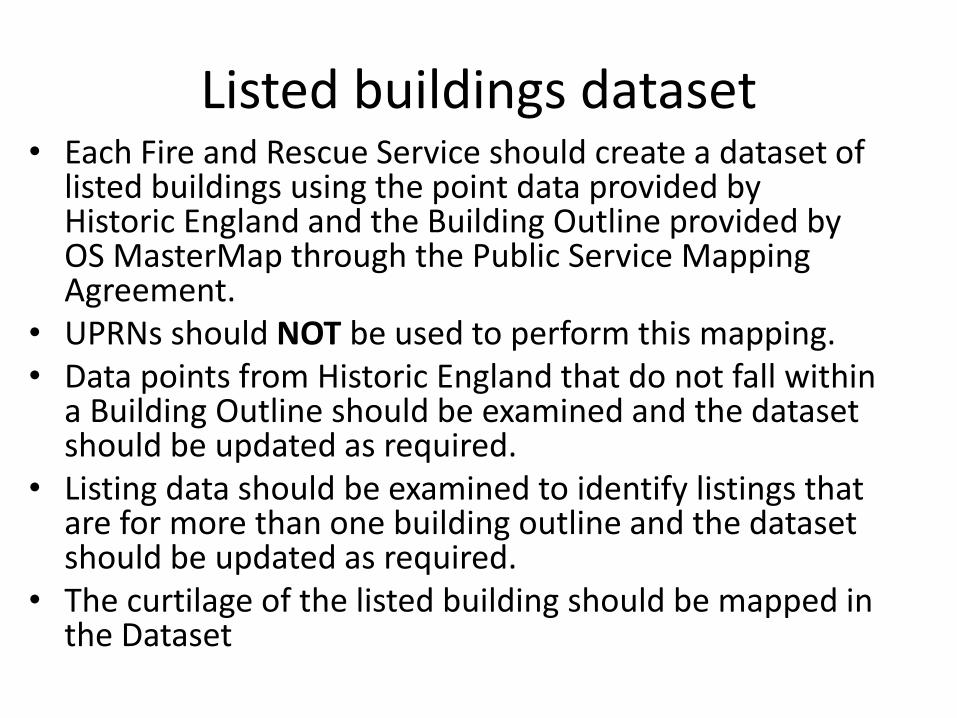
Listed buildings dataset• Each Fire and Rescue Service should create a dataset of
listed buildings using the point data provided by Historic England and the Building Outline provided by OS MasterMap through the Public Service Mapping Agreement.
• UPRNs should NOT be used to perform this mapping.• Data points from Historic England that do not fall within
a Building Outline should be examined and the dataset should be updated as required.
• Listing data should be examined to identify listings that are for more than one building outline and the dataset should be updated as required.
• The curtilage of the listed building should be mapped in the Dataset
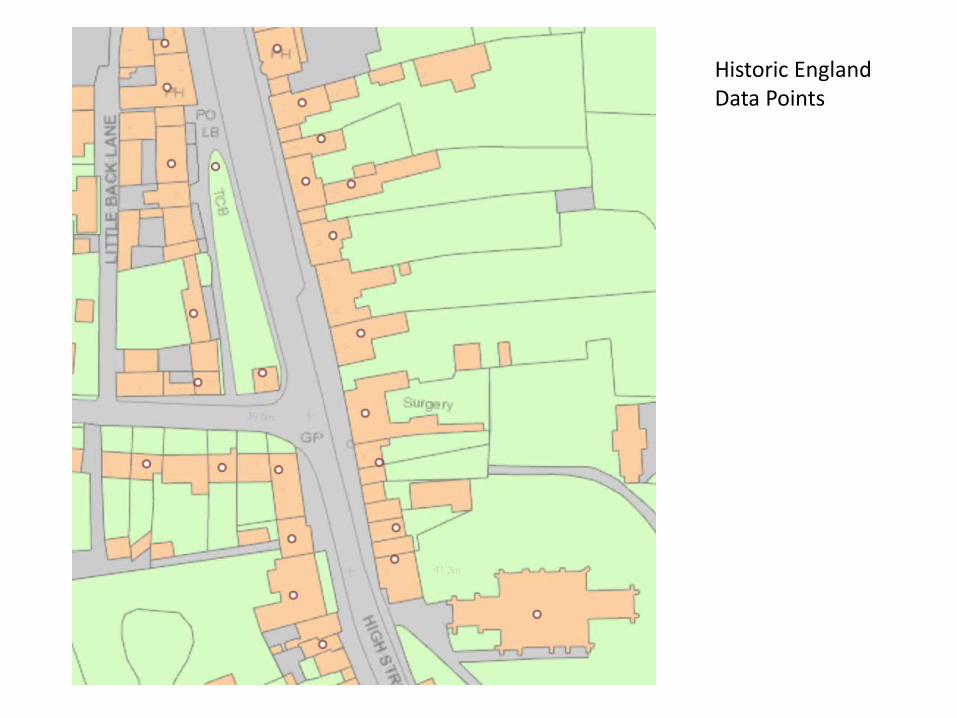
Historic England Data Points
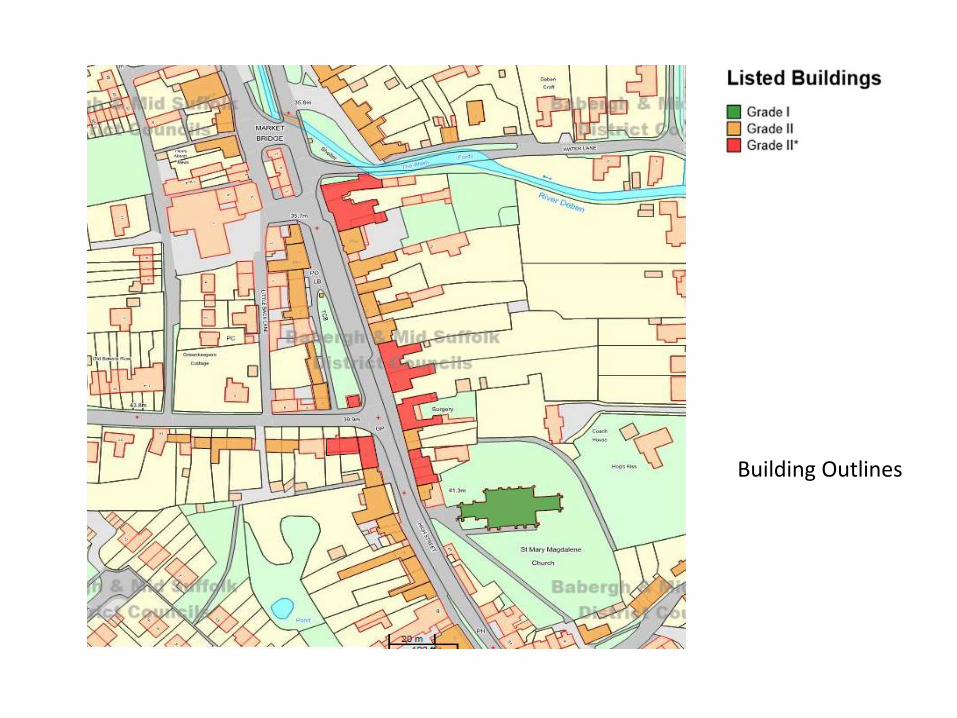
Building Outlines
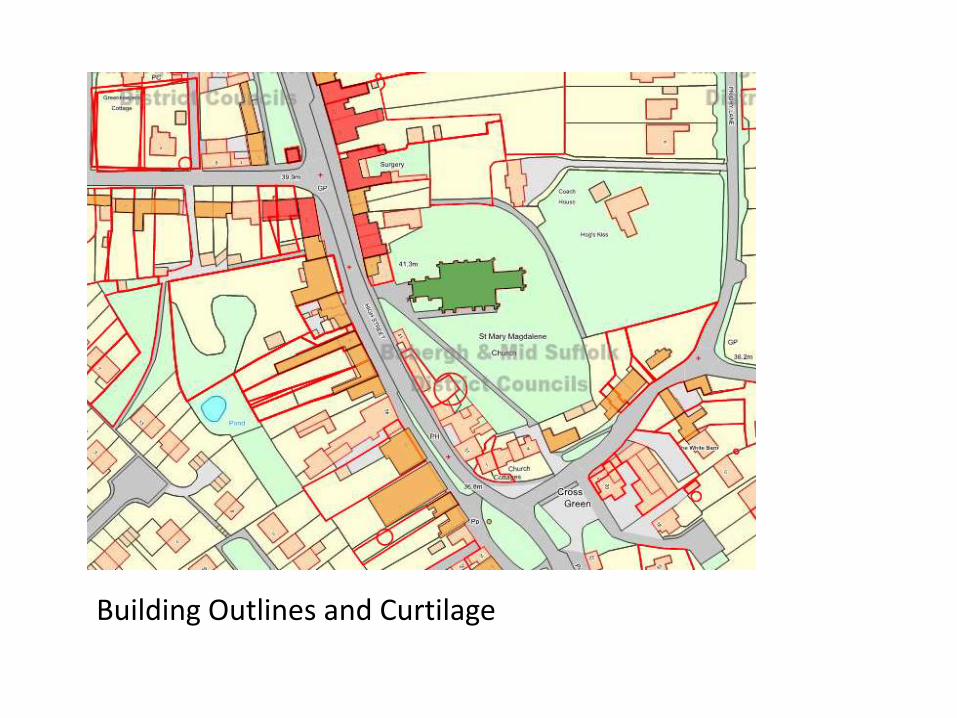
Building Outlines and Curtilage
Mapping incidents in listed buildings
• Incidents should be geocoded on the FRS GIS system at high resolution to ensure the accurate placement of the incident.
• Easting and Northings should be used to determine the location of the incident when combining it with the Listed Building Dataset.
• FRS should differentiate between incidents within the listed building and within the curtilage of a listed building.
• The use of the building should be recorded to differentiate between Dwellings and Other Buildings.
• In Other Buildings, the FSEC group should be recorded as this will allow Protection Departments to plan their Risk Based Inspection Program.
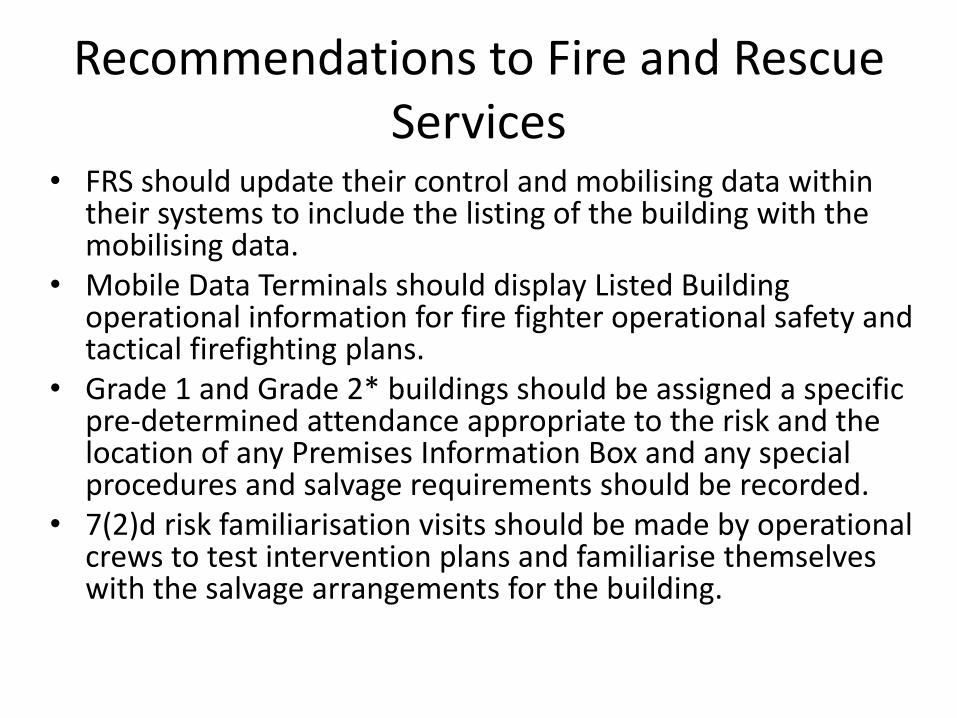
Recommendations to Fire and Rescue Services
• FRS should update their control and mobilising data within their systems to include the listing of the building with the mobilising data.
• Mobile Data Terminals should display Listed Building operational information for fire fighter operational safety and tactical firefighting plans.
• Grade 1 and Grade 2* buildings should be assigned a specific pre-determined attendance appropriate to the risk and the location of any Premises Information Box and any special procedures and salvage requirements should be recorded.
• 7(2)d risk familiarisation visits should be made by operational crews to test intervention plans and familiarise themselves with the salvage arrangements for the building.
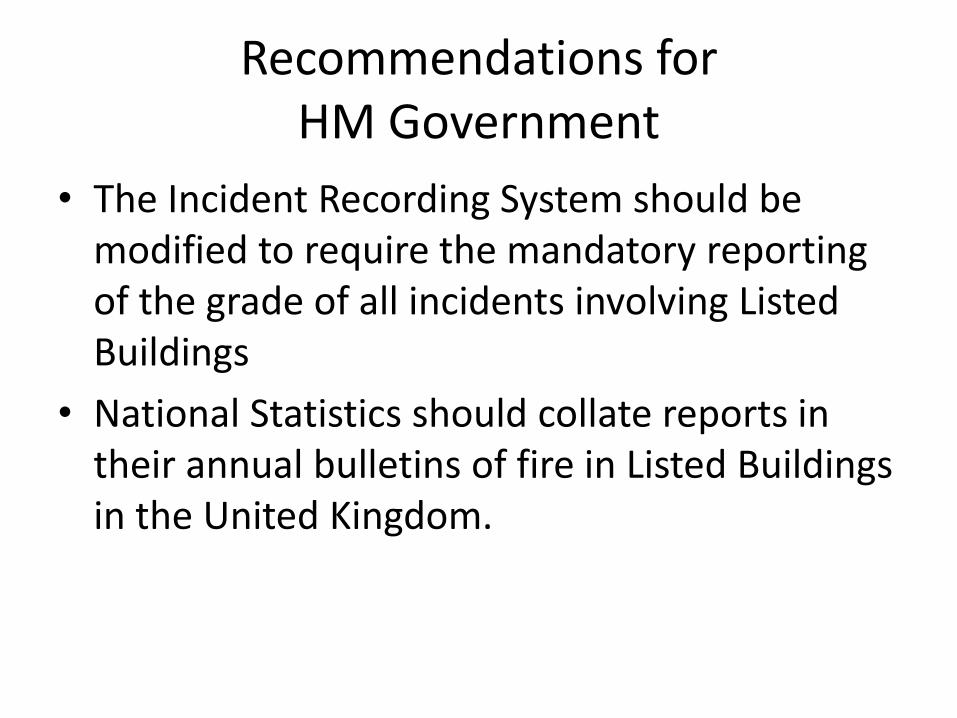
Recommendations for HM Government
• The Incident Recording System should be modified to require the mandatory reporting of the grade of all incidents involving Listed Buildings
• National Statistics should collate reports in their annual bulletins of fire in Listed Buildings in the United Kingdom.
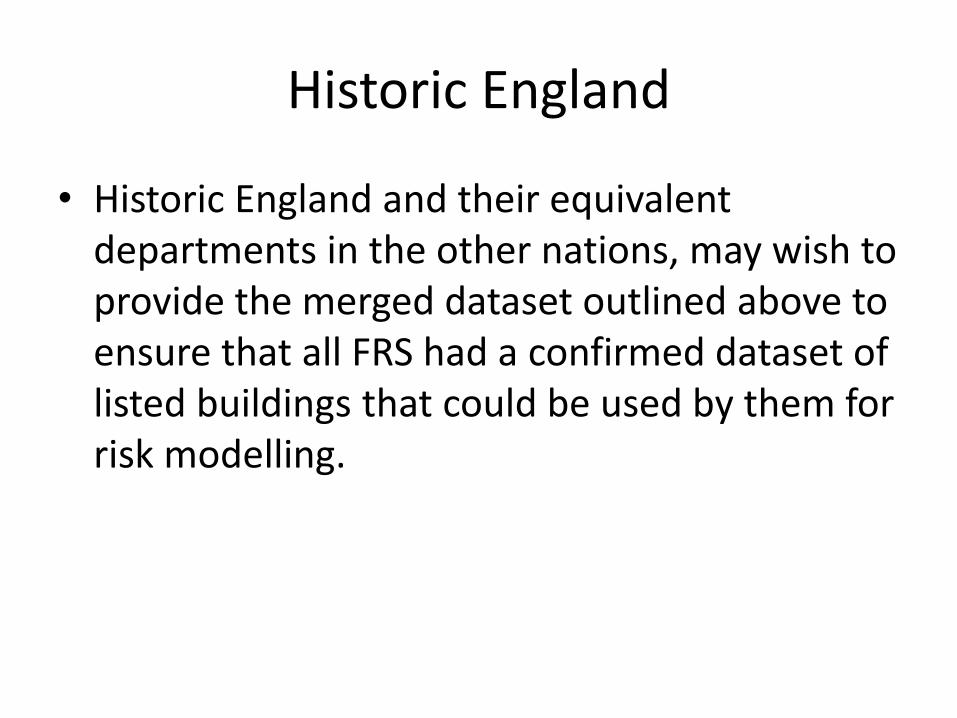
Historic England
• Historic England and their equivalent departments in the other nations, may wish to provide the merged dataset outlined above to ensure that all FRS had a confirmed dataset of listed buildings that could be used by them for risk modelling.

Any Questions?