INCENTIVES FOR MANAGERS AND INEQUALITY …else.econ.ucl.ac.uk/papers/uploaded/208.pdf · INCENTIVES...
45
INCENTIVES FOR MANAGERS AND INEQUALITY AMONG WORKERS: EVIDENCE FROM A FIRM-LEVEL EXPERIMENT* ORIANA BANDIERA IWAN BARANKAY IMRAN RASUL We present evidence from a firm level experiment in which we engineered an exogenous change in managerial compensation from fixed wages to performance pay based on the average productivity of lower-tier workers. Theory suggests that managerial incentives affect both the mean and dispersion of workers’ productiv- ity through two channels. First, managers respond to incentives by targeting their efforts towards more able workers, implying that both the mean and the disper- sion increase. Second, managers select out the least able workers, implying that the mean increases but the dispersion may decrease. In our field experiment we find that the introduction of managerial performance pay raises both the mean and dispersion of worker productivity. Analysis of individual level productivity data shows that managers target their effort towards high ability workers, and the least able workers are less likely to be selected into employment. These results highlight the interplay between the provision of managerial incentives and earn- ings inequality among lower-tier workers. I. INTRODUCTION The last two decades have seen a surge in the popularity of performance pay for individuals in executive and managerial positions, from CEOs down to middle and lower management [Hall and Liebman 1998; Hall and Murphy 2003; Oyer and Schaefer 2004]. The literature, however, does not provide much evidence on how managerial performance pay affects firms’ pro- ductivity and the performance of individual workers in lower tiers of the firms’ hierarchy. We present evidence from a firm level experiment explicitly designed to shed light on these issues. In the experiment we engineered an exogenous change in manage- * We thank the editor, Lawrence Katz, and two anonymous referees for useful comments. We have also benefited from discussions with James Banks, Timothy Besley, Nicholas Bloom, Richard Blundell, Kong-Pin Chen, Andrew Chesher, David De Meza, Wouter Dessein, Rachel Griffith, Andrea Ichino, Edward Lazear, Gilat Levy, Harry Paarsch, Canice Prendergast, Christopher Udry, and seminar participants at Bocconi, Boston College, Bristol, CEMMAP, Chicago GSB, Colum- bia, Essex, EUI, Frankfurt, Haas, LSE, MIT/Harvard, Royal Holloway, UCL, Warwick, Yalo, and the LEaF 2005 Conference in London. Financial support from the ESRC is gratefully acknowledged. Brandon R. Halcott provided excellent research assistance. We thank all those involved in providing the data. This paper has been screened to ensure no confidential information is revealed. All errors are our own. © 2007 by the President and Fellows of Harvard College and the Massachusetts Institute of Technology. The Quarterly Journal of Economics, May 2007 729
Transcript of INCENTIVES FOR MANAGERS AND INEQUALITY …else.econ.ucl.ac.uk/papers/uploaded/208.pdf · INCENTIVES...
INCENTIVES FOR MANAGERS AND INEQUALITYAMONG WORKERS: EVIDENCE FROM A
FIRM-LEVEL EXPERIMENT*
ORIANA BANDIERA
IWAN BARANKAY
IMRAN RASUL
We present evidence from a firm level experiment in which we engineered anexogenous change in managerial compensation from fixed wages to performancepay based on the average productivity of lower-tier workers. Theory suggests thatmanagerial incentives affect both the mean and dispersion of workers’ productiv-ity through two channels. First, managers respond to incentives by targeting theirefforts towards more able workers, implying that both the mean and the disper-sion increase. Second, managers select out the least able workers, implying thatthe mean increases but the dispersion may decrease. In our field experiment wefind that the introduction of managerial performance pay raises both the meanand dispersion of worker productivity. Analysis of individual level productivitydata shows that managers target their effort towards high ability workers, andthe least able workers are less likely to be selected into employment. These resultshighlight the interplay between the provision of managerial incentives and earn-ings inequality among lower-tier workers.
I. INTRODUCTION
The last two decades have seen a surge in the popularity ofperformance pay for individuals in executive and managerialpositions, from CEOs down to middle and lower management[Hall and Liebman 1998; Hall and Murphy 2003; Oyer andSchaefer 2004]. The literature, however, does not provide muchevidence on how managerial performance pay affects firms’ pro-ductivity and the performance of individual workers in lower tiersof the firms’ hierarchy. We present evidence from a firm levelexperiment explicitly designed to shed light on these issues. Inthe experiment we engineered an exogenous change in manage-
* We thank the editor, Lawrence Katz, and two anonymous referees for usefulcomments. We have also benefited from discussions with James Banks, TimothyBesley, Nicholas Bloom, Richard Blundell, Kong-Pin Chen, Andrew Chesher,David De Meza, Wouter Dessein, Rachel Griffith, Andrea Ichino, Edward Lazear,Gilat Levy, Harry Paarsch, Canice Prendergast, Christopher Udry, and seminarparticipants at Bocconi, Boston College, Bristol, CEMMAP, Chicago GSB, Colum-bia, Essex, EUI, Frankfurt, Haas, LSE, MIT/Harvard, Royal Holloway, UCL,Warwick, Yalo, and the LEaF 2005 Conference in London. Financial support fromthe ESRC is gratefully acknowledged. Brandon R. Halcott provided excellentresearch assistance. We thank all those involved in providing the data. This paperhas been screened to ensure no confidential information is revealed. All errors areour own.
© 2007 by the President and Fellows of Harvard College and the Massachusetts Institute ofTechnology.The Quarterly Journal of Economics, May 2007
729
rial incentives by augmenting managers’ fixed wages with a per-formance bonus based on the average productivity of workersmanaged. Importantly, bottom-tier workers were rewarded ac-cording to the same compensation scheme throughout.
In our context, as in most firms, managers can affect averageworkers productivity through two channels—(i) they can takeactions that affect the productivity of existing workers, and (ii)they can affect the identity of the workers selected into employ-ment. A simple theoretical framework indicates that when work-ers are of heterogeneous ability and managers’ and workers’efforts are complements the introduction of managerial perfor-mance pay makes managers target their effort towards the mostable workers. We label this a “targeting effect” of managerialincentives. In addition, the introduction of managerial perfor-mance pay makes managers select the most able workers intoemployment. We label this a “selection effect” of managerialincentives.
Such targeting and selection effects influence both the meanand the dispersion of workers’ productivity. Mean productivityunambiguously rises as managers target the most able workersand fire the least able. The effect on the dispersion, however, isambiguous. On the one hand, targeting the most able workersexacerbates the natural differences in ability and leads to anincrease in dispersion. On the other hand, if only more able and,hence, more similar workers are selected into employment in thefirst place, the dispersion of productivity may fall, depending onthe underlying distribution of ability across workers.
Our research design combined with data from personnelrecords on the daily productivity of individual workers allows usto provide evidence on how the provision of incentives to manag-ers affects manager’s behavior and therefore filters through to theperformance of individual workers at lower tiers of the firmhierarchy. We identify the effect of managerial performance payon average worker productivity, on the dispersion of workers’productivity, and use individual productivity data to separate thetargeting and selection effects.
The firm we study is a leading UK producer of soft fruit.Managerial staff belongs to two classes. The first class consists ofa single general manager, the second comprises ten field manag-ers. Throughout we refer to the general manager as the chiefoperating officer (COO), to distinguish him from the field manag-ers. The bottom tier of the firm hierarchy consists of workers.
730 QUARTERLY JOURNAL OF ECONOMICS
The task of the bottom tier workers is to pick fruit. This is aphysically strenuous task, for which workers are of heterogenousability. Managers are responsible for field logistics, most impor-tantly to assign workers to rows of fruit within the field and tomonitor workers. In this context, managerial effort can be tar-geted to individual workers and is complementary to worker’seffort. The COO’s task is to decide which workers are selected topick fruit each day and which are assigned to nonpicking tasks.The COO also decides the allocation of workers and managers tofields. Managers and workers do not decide where they work orwith whom they work.
The design of the experiment is as follows. We divided thepeak picking season into two periods of two months each. In thefirst period the COO and managers were paid a fixed wage. In thesecond period, we added a daily performance bonus to the samelevel of fixed wages. The performance bonus is an increasingfunction of the average productivity of workers in the field on thatday, conditional on average productivity being above an exog-enously set threshold.
The data has three key features that allow us to identify theconsequences of managerial performance bonus on the mean anddispersion of productivity among bottom tier workers and theheterogeneous effects across individual workers. First, thechange in managerial incentives is orthogonal to other determi-nants of the firm’s productivity—we had full control over thetiming of the change, the structure of managerial compensation,and the information provided to managers. Second, we observethe same workers and managers under both managerial incentiveschemes and therefore control for time invariant sources of het-erogeneity across workers, such as their ability, and across man-agers, such as their management style.1 Third, we have dailyinformation on the pool of workers available to pick fruit on thatday which allows us to precisely identify the effect of managerialincentives on the selection of workers. We observe the entire poolof workers because individuals are hired seasonally from EasternEurope, and they live on the farm for the duration of their stay.Importantly, there is typically an excess supply of bottom-tier
1. Our empirical strategy is informed by the evidence that individual “styles”of managers affect firm performance over and above firm level characteristicsthemselves [Bertrand and Schoar 2003; Malmendier and Tate 2005].
731INCENTIVES FOR MANAGERS AND INEQUALITY AMONG WORKERS
workers, and work is offered on a causal basis with no dailyguarantee of employment.
Our key findings are as follows. First, the introduction ofmanagerial performance pay increases both the average produc-tivity and the dispersion of productivity among lower-tier work-ers. The average productivity increases by 21 percent, and thecoefficient of variation increases by 38 percent.
Second, the increase in the mean and dispersion of produc-tivity is due to both targeting and selection effects. The analysisof individual productivity data reveals that the most able workersexperience a significant increase in productivity while the pro-ductivity of other workers is not affected or even decreases. Thissuggests that the targeting effect is at play—after the introduc-tion of performance pay, managers target their effort towardsmore able workers.
The individual data also provides evidence of a selectioneffect. More able workers, namely those who had the highestproductivity when managers were paid fixed wages, are morelikely to be selected into the workforce when managers are paidperformance bonuses. Least able workers are employed less often,and workers at the bottom of the productivity distribution arefixed.
Third, the selection and targeting effect reinforce each other,as workers who experience the highest increase in productivityare also more likely to be selected into employment. The intro-duction of managerial performance pay thus exacerbates earn-ings inequality due to underlying differences in ability both be-cause the most able workers experience a larger increase inproductivity and because they are selected into employment moreoften.
Finally, we evaluate the relative importance of the targetingand selection effects through a series of thought experiments. Wefind that at least half of the 21 percent increase in averageproductivity is driven by the selection of more productive work-ers. In contrast, we find that the change in dispersion is nearlyentirely due to managers targeting the most able workers afterthe introduction of performance pay. Namely, the dispersion ofproductivity would have increased by almost the same amounthad the selection of workers remained unchanged. The reason isthat the distribution of ability across workers is such that evenwhen the least able workers are fired, the marginal worker se-lected to pick is still of relatively low ability. Hence, there re-
732 QUARTERLY JOURNAL OF ECONOMICS
mains considerable heterogeneity in productivity among selectedworkers.
We contribute to the empirical literature on the effects ofincentive pay on performance. Our analysis complements recentevidence on the effects of incentives to bottom-tier workers ontheir own or aggregate firm performance [Jones and Kato 1995;Lazear 2000; Paarsch and Shearer 2000] and on the effect ofincentive pay for CEOs and managers on aggregate firm perfor-mance [Groves et al. 1994; Chevalier and Ellison 1997; Oyer1998].
Our paper combines both themes as we analyze the effect ofmanagerial incentives on the productivity of individual workersin lower tiers of the firm’s hierarchy. Using individual level per-sonnel data at various layers of the firm’s hierarchy, we open theblack box of behavior within the firm and explore the efficiencyand distributional consequences of the introduction of managerialincentives. Our findings draw attention to the interplay betweenthe provision of managerial incentives and earnings inequalityamong workers. On the methodological front, our experimentalresearch design allows us to address a key empirical challenge inidentifying the causal effects of incentives on firm or individualperformance, namely that observed incentive contracts might beendogenous to firm’s performance [Prendergast 1999; Chiapporiand Salanie 2003].
The paper is organized as follows. Section II describes ourcontext, develops a theoretical framework to analyze the effects ofmanagerial performance pay, and discusses how our experimentis designed to identify such effects. Section III describes the dataand descriptive evidence. Section IV presents evidence on theeffect of managerial incentives on the average and dispersion ofworkers’ productivity. Section V uses worker level data to identifythe heterogenous effects across workers. Section VI presents ev-idence on the selection effects of managerial incentives. SectionVII concludes.
II. CONTEXT, THEORY, AND THE EXPERIMENT
II.A. Context
The firm we study is a leading UK producer of soft fruit.Managerial staff belongs to two classes. The first class consists ofa single general manager, the second comprises ten field managers.
733INCENTIVES FOR MANAGERS AND INEQUALITY AMONG WORKERS
Throughout we refer to the general manager as the chief operatingofficer (COO), to distinguish him from the field managers. Thebottom tier of the firm hierarchy consists of workers.
The main task of the bottom-tier workers is to pick fruit. Onaverage, workers pick on two different fields per day. Within afield-day, each worker is allocated their own row of fruit to pick.A worker’s productivity depends on field conditions, on her effort,and on the managerial effort targeted towards her. The amount offruit to be picked and, hence, the number of workers on a fieldvaries both across fields on any given day because fields vary intheir size, and within a field over time because plants reachmaturity at different times. There are no complementaritiesamong workers in picking—each worker’s productivity is inde-pendent of the efforts of other bottom-tier workers. The onlychoice variable of workers is how much effort to exert into pick-ing. Workers do not choose how many hours to work—all workersare present on the field-day for the number of hours it takes topick all the available fruit.
Workers are organized and supervised by managers, witheach manager being responsible for around twenty workers. Man-agers on the same field focus on their assigned group of workersand work independently of each other. Managers are responsiblefor field logistics. In particular, they are responsible for allocatingworkers to rows at the start of the day and for reallocatingworkers to new rows once they have finished picking the row theywere originally assigned to. If several workers finish at the sametime, the manager has to decide whom to reallocate first. Workersplace the fruit they have picked into crates. Managers have toensure that full crates of fruit are removed from the rows and thatnew empty crates are provided to workers. If several workerssimultaneously fill their crates, the manager chooses whom tohelp first. Managers themselves never pick fruit.
The key choice variable of each manager is how to allocateher effort among her different workers. Managerial effort is com-plementary to worker’s effort, namely, for a given effort level ofthe worker, her productivity is higher the more effort the man-ager targets towards her. For example, by assigning her to moreplentiful rows and removing her full crates quickly, her produc-tivity increases.
The effect of managerial effort on worker productivity can besubstantial. Assuming that workers pick at a constant speed, ifthe manager slacks for five minutes every hour and a worker is
734 QUARTERLY JOURNAL OF ECONOMICS
left to wait for a new crate for the same time, his productivitywould be 5/60 � 8 percent lower. The effort costs to the managerare considerable because the workers she is responsible for aredispersed over a large area. The median field size in our sampleis three hectares. Given that on the median field-day there arethree managers, each manager has to cover an area of one hect-are. To make sure she is aware of which workers need to bereallocated to new rows and which need crates to be replaced, themanager needs to continuously walk around the field.
Workers and managers are hired seasonally from EasternEurope and live on the farm.2 Their work permit allows them towork on other UK farms subject to the approval of the permitagency. Their outside option to employment at the farm is there-fore to return home or to move to another farm during the season.Individuals are typically not observed moving from picking tasksto managerial tasks or vice versa. Finally, work is offered on acausal basis with no daily guarantee of employment. In practice,managers manage each day, and workers are typically engaged inpicking tasks every other day. On other days workers are asked toperform nonpicking tasks such as planting or weeding, or may beleft unemployed for the day. Therefore on any given day, there isan excess supply of workers available for picking.
The COO is a permanent employee of the farm. His maintask is to decide which of the workers present on the farm areselected to pick fruit each day, assigned to nonpicking tasks, orleft unemployed for the day. If two fields are operated simulta-neously, the COO allocates workers and managers to fields. Man-agers and workers do not choose which field to work on, nor whomthey work with. The fruit is planted some years in advance, so thesequence in which fields are picked over time is determined at thestart of the season and is not decided by the COO.
Workers are paid piece rates. The piece rate is the same forall workers on a given field-day and is set to minimize the firm’swage bill each field-day subject to a minimum wage constraint.3
2. In order to be recruited, individuals must be full-time university studentsand must return to the same university in the fall. Workers are not typically hiredfrom the local labor market because of the seasonality of the work. Very fewworkers are hired for two consecutive seasons.
3. This is consistent with profit maximization. Given a competitive marketfor soft fruit and that the total quantity of fruit available is fixed some years inadvance when fruit is actually planted, the firm faces little uncertainty over itstotal revenue. In contrast, given workers are paid piece rates, the firm’s total wagebill is uncertain.
735INCENTIVES FOR MANAGERS AND INEQUALITY AMONG WORKERS

The piece rate is set so the average worker obtains an hourly wageof w� , where w� is above the legally prescribed minimum wage, ischosen by the owner of the firm at the beginning of the season,and does not change over the season.
In practice, the COO has some discretion to make smalladjustments to the piece rate across field-days, as field conditionsvary. Let �ft be the piece rate on field f and day t. This is setaccording to the following rule:
(1) �ft �w�
E� yft�,
where E( yft) is the expected productivity of the average workeron the field-day.4 Hence, the piece rate is lower whenever produc-tivity is expected to be higher.5
The focus of our experiment is the compensation schemes ofmanagers and the COO. Halfway through the peak picking sea-son we exogenously change the compensation scheme by adding afield-day performance bonus to the existing level of managers’wages. The purpose of the experiment is twofold. First, we aim toidentify the causal effect of managerial incentives on the meanand dispersion of worker’s productivity. Second, we aim to decom-pose these aggregate effects into those that are attributable to thedifferential targeting of managerial effort across workers andthose that are attributable to the differential selection of workersinto picking by the COO.
4. At the start of the day the COO inspects each field to be picked. He thenforms an expectation of worker productivity that field-day and sets the piece rateso that a worker with average productivity expects to obtain an hourly equivalentof w� . This piece rate is announced to workers before they start picking, and cannotbe revised ex post. If a worker’s productivity is so low that they earn an hourlyequivalent less than the legally prescribed minimum wage, they are paid a one-offsupplement to ensure they reach the minimum wage. When they first arrive onthe farm, workers are informed that they will be sent home if they consistentlyneed to be paid this supplement. We observe less than 1 percent of worker–field-day observations where workers are paid the supplement.
5. This raises concerns of a ratchet effect, whereby workers deliberatelyunderperform to keep the piece rate high. In Bandiera et al. [2005] we provideevidence that in this setting, workers are unable to collude in this way. This ispartly driven by the uncertainty they have over where they will work in thefuture, with whom they will work, and their inability to monitor workers in otherfields. Moreover, given the stochastic nature of agricultural production, it isdifficult for workers to disentangle changes in the piece rate due to changingconditions and those due to management learning about workers’ true ability[Ickes and Samuelson 1987]. Such ratchet concerns have been documented infirms where productivity shocks are less common such as shoemaking [Freemanand Kleiner 2005] and bricklaying [Roy 1952].
736 QUARTERLY JOURNAL OF ECONOMICS
II.B. Theoretical Framework
We develop a stylized model of the firm to analyze the effectof the introduction of managerial performance pay on the equi-librium mean and dispersion of workers’ productivity. The modelis tailored to fit our context and experimental design. The firm’shierarchy has three layers—a COO, managers, and workers. Forparsimony and without loss of generality, we assume there is onemanager and three workers. Since in our context there is anexcess supply of workers available for picking tasks, we assumeproduction requires only two workers and one manager in anygiven field. The division of tasks is as follows—workers pick fruit,the manager organizes logistics for each worker, and the COOdecides which of the workers pick fruit and which are leftunemployed.
The output of worker i is given by yi � (1 � kmi)ei, where eiis her effort, mi is the managerial effort targeted towards her, andk � 0 is a measure of the strength of the complementaritybetween the manager’s and worker’s efforts.6 The productivity ofworker i, measured as the kilograms of fruit picked per hour, isdefined as yi/h, where h is the number of hours worked on thefield. This is the same for all workers in the field, and so we makethe simplifying assumption that h � 1. This implies that in ourframework output and productivity coincide.
The timing of actions is as follows. In the first stage, the COOchooses which two out of the three workers are selected intopicking tasks. In the second stage, the manager and workerssimultaneously choose their efforts. We determine the effects onthe mean and dispersion of workers’ productivity of changing themanager and COO’s compensation from fixed wages to perfor-mance pay related to workers’ average productivity. In whatfollows we present the key results and the intuition behind them.We refer the reader to the working paper version for details of thederivation and all proofs.7
Workers. Workers are paid piece rates, where the piece rateis � per kilogram fruit picked and is taken as given by workers.The total pay of worker i is therefore �yi. Worker i has a disutilityof effort of 1⁄2 �iei
2, where �i captures the heterogeneity across
6. There may also be a pure public good component to managerial effortwhich affects all workers. The key comparisons between the managerial incentiveschemes remain qualitatively unchanged in that case.
7. This is available at http://econ.lse.ac.uk/staff/bandiera/research.htm.
737INCENTIVES FOR MANAGERS AND INEQUALITY AMONG WORKERS
workers and is interpreted as the inverse of the worker’s innateability. The utility of a worker is assumed to be linear andadditively separable between pay, �yi, and effort, �1⁄2 �iei
2. Work-ers choose their effort, taking as given the managerial efforttargeted towards them. Worker i’s optimal effort is thus equal toe*i � �(1 � kmi)/�i.
The Manager. The manager’s compensation schedule is w �bY� , where w is a fixed wage and Y� � 1⁄2 (yi � yj) is the averageproductivity of the two workers i and j. The parameter b capturesthe strength of managerial incentives, namely the variable compo-nent of managerial pay which is linearly related to the averageproductivity of workers. We assume the manager’s effort choice caneither be 0 (low) or 1 (high). The manager chooses high or low effort,and how to allocate her effort between workers i and j. Effort entailsdisutility cm, where m � mi � mj, for the manager.
The manager chooses her effort taking as given the effortchoices of the workers. The manager’s maximization problem is
(2) maxmi,mj
w �12 b�1 � kmi�ei � �1 � kmj�ej � cm,
where m � {0,1}. Note that the benefit of choosing high effort islinearly increasing in b and the disutility of high effort is con-stant. Thus, if incentives are sufficiently strong (b is high), themanager exerts high effort. In addition, since the manager’s payis a linear combination of the output produced by the two work-ers, when the ability differential between the two workers issufficiently large the manager maximizes her payoff by targetingthe high ability worker.8
It follows that changing the manager’s compensation schemefrom fixed wages (b � 0) to sufficiently high powered performancepay increases average worker productivity both because managerialeffort enters the production function directly and because the work-er’s best response is nondecreasing in managerial effort.
In addition, managerial incentive pay increases the disper-
8. Workers’ effort depends on their ability and the managerial effort targetedtowards them. If the difference in ability is sufficiently large, the more able workeralways exerts more effort, regardless of the level of managerial effort. Therefore,if workers are sufficiently heterogeneous, the unique equilibrium outcome iswhere the manager targets the most able worker. In a more general setting witha production function that is concave in manager and worker efforts, the sameresult holds as long as the strength of the complementarity between manager andworker efforts is not decreasing in the worker’s effort.
738 QUARTERLY JOURNAL OF ECONOMICS
sion of productivity because the manager targets the more ableworker to maximize the marginal return to her effort. This in-creases the more able worker’s productivity while leaving theproductivity of the other worker unchanged. Thus, when themanager is given performance pay, the differences in productivitybetween workers that arise naturally because workers are ofheterogeneous ability, are exacerbated by the differential target-ing of managerial effort across workers.
The COO. The COO’s compensation schedule is W � BY� ,where W is a fixed wage and Y� is the average workers’ produc-tivity. The parameter B captures the strength of incentives,namely the variable component of COO pay, which is linearlyrelated to the average productivity of workers.
The COO selects two of the three available workers intoemployment. We label workers as 1, 2, 3 and assume �1 � �2 � �3,so worker 1 is the most able and worker 3 the least able. We makethe simplifying assumption that the COO does not know theworkers’ ability ex ante, but can exert one unit of effort to learneach worker’s ability. In our context, the COO may learn workers’ability by analyzing personnel files on workers’ performance forexample. We denote the COO’s effort choice as s � {0,1} and histotal effort cost as Cs. Hence, if the COO chooses to learn eachworker’s ability, he is able to creamskim the two most able work-ers into employment. Otherwise he chooses each possible pair ofworkers with equal probability.
To focus on the effect of the COO’s incentives, we assume themanager is paid a fixed wage and thus chooses the low-effortlevel. The COO then chooses s, taking into account that themanager’s and the workers’ effort to maximize W � BE(Y� (s)) �Cs, where E(Y� (s)) is expected average productivity of the se-lected workers and depends on the COO’s effort choice.
When incentives are sufficiently strong so B is large enough,the benefit of exerting high effort is larger than the cost C, andthe COO exerts high effort. This increases average productivitybecause the COO finds out the identity of the weakest worker anddrops him from the workforce. Note that the selection effectidentified here is different from the sorting effect of incentive payidentified by Lazear [2000, 2005]. Here the introduction of man-agerial incentives affects the demand for lower-tier workers.Lazear [2000, 2005] makes the related point that incentive payaffects the supply of workers, namely when workers or managers
739INCENTIVES FOR MANAGERS AND INEQUALITY AMONG WORKERS
are offered incentive pay, they self-select into jobs where theyexpect their compensation to be higher.
The effect on the dispersion of productivity depends on thedistribution of ability among workers. Intuitively, when the COOincentives are high powered, the dispersion depends only on thedifference in ability between workers 1 and 2, given that worker3 is never selected. In contrast, when the COO is paid a fixedwage the dispersion depends on the pairwise differences betweenthe three possible combination of workers, since all are selectedwith equal probability. The comparison of dispersion in the twocases then depends on the distribution of ability across workers.If the least able worker is sufficiently less able than the other two,creamskimming by the COO results in a pairing of the mostsimilar workers and thus reduces dispersion.
The Combined Effect of COO’s and Manager’s PerformancePay. In our experiment we changed the compensation scheme ofboth the manager and the COO by adding a performance bonus totheir existing fixed wage. Namely in the first part of the experi-ment b � B � 0; in the second part B � 0, and b � 0.
The effects on the mean and dispersion of productivity thusdepend on the balance of effects stemming from changes in behaviorof the manager and the COO. The effect on average productivity isunambiguously positive: the COO increases productivity by select-ing more able workers, and the manager increases productivity byexerting more effort and targeting the more able workers.
The effect on the dispersion of productivity depends on thenet effect of targeting by the manager, which is non-negative, andthe effect of the selection by the COO, which is ambiguous. As themanager targets the most able worker, dispersion increases. Ifselection by the COO reduces dispersion, the net effect dependson the balance between the two factors. The positive targetingeffect prevails when the complementarity between the managerand worker’s effort is sufficiently strong. We later present evi-dence from our setting on which of the targeting and selectioneffects prevails overall, the relative importance of each, and theheterogeneous effects across workers.
II.C. The Design of the Experiment
The design of our experiment is as follows. At the start of the2003 season, workers were paid piece rates, and the COO andmanagers were paid a fixed wage. Midway through the 2003
740 QUARTERLY JOURNAL OF ECONOMICS

season we exogenously changed the compensation schemes of theCOO and managers, adding a performance bonus to their samelevel of fixed wages. The experiment left the structure of thecompensation scheme of bottom-tier workers unchanged—theywere paid piece rates throughout the season.
The COO and managers did not know that they were takingpart in an experiment and that the data would be used forscientific research. As such, our experiment is a natural fieldexperiment according to the taxonomy developed by Harrison andList [2004]. The COO and managers were aware that productivitydata were recorded and kept by the owner and that the datawould be analyzed to improve the firms’ efficiency.
The bonus payment was awarded on field f and day t if theaverage productivity of the bottom-tier workers on the field-day,Y� ft, exceeded an exogenously fixed threshold, Y*.9 Conditional onreaching the threshold, the total monetary value of the bonuspayment available to the managers on field-day ft, B(Y� ft) in-creases at an increasing rate in the average field-day productivityto reflect the increasing marginal cost of supplying managerialeffort.10 Each manager obtains an equal share of the bonus pay-ment generated on the field-day. If there are Mft managerspresent, then each obtains a payment of (1/Mft) B(Y� ft). In prac-tice, each manager shares the bonus payment with at most threeother managers on the field-day, implying her effort has a largeeffect on the probability she obtains the bonus.
Each manager’s bonus payment depends only on the fieldsthat she has worked on that day. In contrast, the COO effectivelyworks on every field each day. The daily bonus payment that
9. To avoid multitasking concerns [Holmstrom and Milgrom 1991], the per-formance bonus was not awarded if the quality of fruit picking declined. Qualityis measured in two ways. First is simply the quantity of damaged fruit. Second,fruit has to be classified as either suitable for market or supermarket. Thisclassification is largely based on the size of each fruit. If the percentage ofdamaged or misclassified fruit rose by more than 2% of a pre-established norm,then the performance bonus was not awarded that field-day.
10. The bonus payment schedule is piecewise linear:
B�Y� ft� � �0 if Y* � Y� ft
a1 � b1Y� ft if Y* � c1 � Y� ft � Y*a2 � b2Y� ft if Y* � c2 � Y� ft � Y* � c1
a3 � b3Y� ft if Y� ft � Y* � c2
,
where the parameters ai,bi, and ci are set such that B(Y� ft) is a continuous andconvex function. The actual values of ai,bi,ci, and Y* cannot be provided becauseof confidentiality reasons.
741INCENTIVES FOR MANAGERS AND INEQUALITY AMONG WORKERS

accrues to the COO for any given field is 1.5 times that whichaccrues to a manager on the field. The COO’s daily bonus pay-ment is the sum of these payments across all fields operated thatday and is therefore equal to 1.5 ¥f (1/Mft) B(Y� ft).
The fraction of field-days on which the bonus was earnedvaries from 20 to 50 percent across managers. The ex post mon-etary value of the performance bonus to managers is substantial.Averaged across all field-days actually worked under the bonus,managerial hourly earnings increased by 7 percent. Conditionalon obtaining the bonus, managerial hourly earnings increased by25 percent. The true expected hourly earnings increase to man-agers because the performance bonus scheme is likely to liebetween these bounds.11
Our experimental design allows us to address two key con-cerns. First, in our context managers live and work on the farm,and, therefore, each manager is aware of the compensationscheme offered to other managers. This raises the possibility ofcontamination effects if different managers were contemporane-ously paid according to different compensation schemes. For ex-ample, those managers paid fixed wages throughout may becomede-motivated, leading us to overestimate the causal effect of man-agerial performance pay on workers’ productivity. To preventsuch contamination effects arising, we offer all managers thesame pay scheme at any given point in time.
Second, in our context there are a small number of managersand their behavior is analyzed only for one season. Hence, unob-servable heterogeneity among managers is a more importantdeterminant of productivity than unobservable time varying fac-tors. Our design allows us to compare the same manager underthe two schemes and we are thus able to control for time invariantsources of unobserved heterogeneity across managers such astheir management style or motivational skills.
11. Given that managers are from Eastern Europe, their base pay is 20percent higher than the UK minimum wage. Given that most individuals saveearnings to spend later in their home country, these increases in hourly earningstranslate into large increases in real income. As of January 2003, gross monthlyearnings at the UK minimum wage (€1105) are five times as high as at theminimum wage in Poland (€201), where 40 percent of managers come from, andalmost 20 times higher than in Bulgaria (€56), where 29 percent of managers comefrom.
742 QUARTERLY JOURNAL OF ECONOMICS
III. DATA AND DESCRIPTIVE EVIDENCE
III.A. The Data
We exploit the firm’s personnel records, which contain infor-mation on each worker’s productivity for each field-day they pickfruit. Productivity is defined as kilograms of fruit picked per hourand is electronically recorded with little measurement error. Per-sonnel records also allow us to identify all the workers andmanagers present each field-day.
Throughout, we analyze data on the main fruit type grownon the farm and focus on the main site on the farm during thepeak picking season from May 1st until August 31st. To com-pare the effects of managerial incentives on the same pool ofworkers, we restrict the sample to workers that were availablefor work at least three weeks either side of the change inmanagerial incentives. To compare the effects of managerialincentives within the same set of fields, we restrict the sampleto fields that were operated for at least one week either side ofthe change in managerial incentives. The final sample contains247 field-days and 9897 worker–field-day observations. Thiscovers 13 fields, one COO, 10 managers, 197 workers, and 95days. As part of our experimental design, the change in man-agerial incentives occurs midway through the peak season sothat there are 44 days in the pre-bonus period and 51 days inthe post-bonus period.
III.B. Data Description
The top panel of Figure I shows the time series for workerproductivity, averaged over all workers each day, for the 2003picking season. Average productivity was somewhat declining inthe pre-bonus period, rose after the introduction of performancebonuses, and remained at this higher level throughout the re-mainder of the season.
Identification of any causal effect of the change in managerialincentives on productivity is confounded if there is any naturaltime trend in productivity. To begin to address such concerns, thelower panel of Figure I shows the comparable time series for the2004 season, when managers and the COO were paid the samelevel of fixed wages throughout and no performance bonus
743INCENTIVES FOR MANAGERS AND INEQUALITY AMONG WORKERS
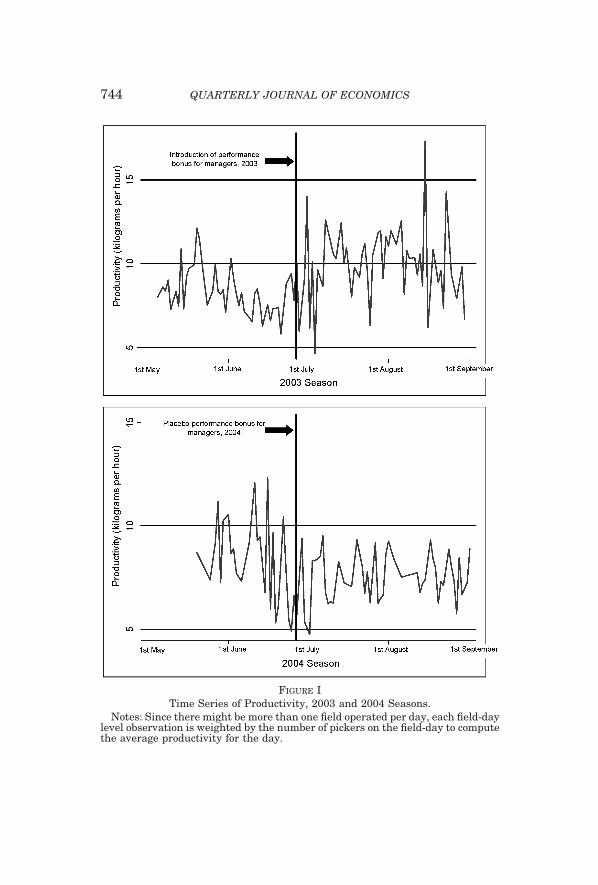
FIGURE ITime Series of Productivity, 2003 and 2004 Seasons.
Notes: Since there might be more than one field operated per day, each field-daylevel observation is weighted by the number of pickers on the field-day to computethe average productivity for the day.
744 QUARTERLY JOURNAL OF ECONOMICS
scheme was in place.12 In 2004 aggregate productivity againdeclines in the first half of the season and then remains at thesame level throughout the second half of the season.13
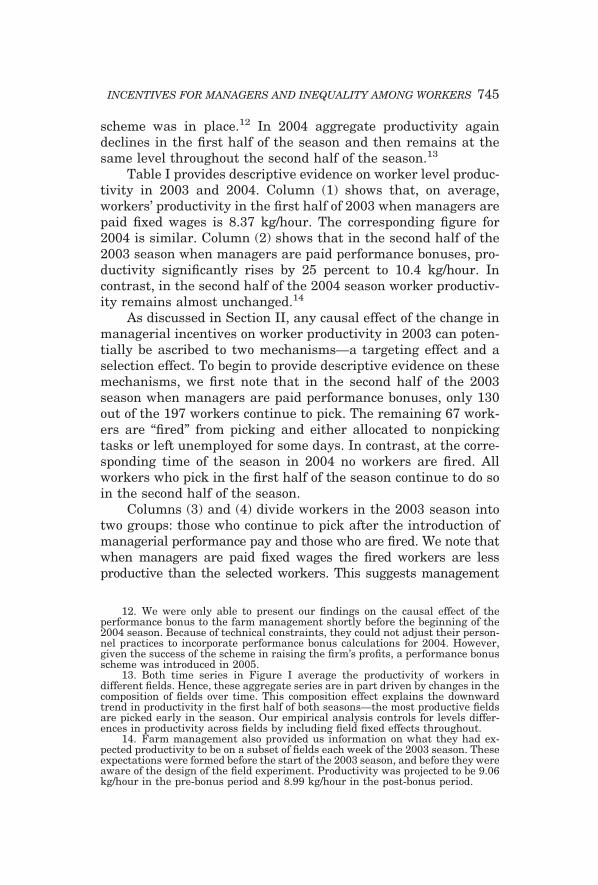
Table I provides descriptive evidence on worker level produc-tivity in 2003 and 2004. Column (1) shows that, on average,workers’ productivity in the first half of 2003 when managers arepaid fixed wages is 8.37 kg/hour. The corresponding figure for2004 is similar. Column (2) shows that in the second half of the2003 season when managers are paid performance bonuses, pro-ductivity significantly rises by 25 percent to 10.4 kg/hour. Incontrast, in the second half of the 2004 season worker productiv-ity remains almost unchanged.14
As discussed in Section II, any causal effect of the change inmanagerial incentives on worker productivity in 2003 can poten-tially be ascribed to two mechanisms—a targeting effect and aselection effect. To begin to provide descriptive evidence on thesemechanisms, we first note that in the second half of the 2003season when managers are paid performance bonuses, only 130out of the 197 workers continue to pick. The remaining 67 work-ers are “fired” from picking and either allocated to nonpickingtasks or left unemployed for some days. In contrast, at the corre-sponding time of the season in 2004 no workers are fired. Allworkers who pick in the first half of the season continue to do soin the second half of the season.
Columns (3) and (4) divide workers in the 2003 season intotwo groups: those who continue to pick after the introduction ofmanagerial performance pay and those who are fired. We note thatwhen managers are paid fixed wages the fired workers are lessproductive than the selected workers. This suggests management
12. We were only able to present our findings on the causal effect of theperformance bonus to the farm management shortly before the beginning of the2004 season. Because of technical constraints, they could not adjust their person-nel practices to incorporate performance bonus calculations for 2004. However,given the success of the scheme in raising the firm’s profits, a performance bonusscheme was introduced in 2005.
13. Both time series in Figure I average the productivity of workers indifferent fields. Hence, these aggregate series are in part driven by changes in thecomposition of fields over time. This composition effect explains the downwardtrend in productivity in the first half of both seasons—the most productive fieldsare picked early in the season. Our empirical analysis controls for levels differ-ences in productivity across fields by including field fixed effects throughout.
14. Farm management also provided us information on what they had ex-pected productivity to be on a subset of fields each week of the 2003 season. Theseexpectations were formed before the start of the 2003 season, and before they wereaware of the design of the field experiment. Productivity was projected to be 9.06kg/hour in the pre-bonus period and 8.99 kg/hour in the post-bonus period.
745INCENTIVES FOR MANAGERS AND INEQUALITY AMONG WORKERS
TA
BL
EI
DE
SC
RIP
TIV
ES
OF
WO
RK
ER
PR
OD
UC
TIV
ITY
BY
MA
NA
GE
RIA
LIN
CE
NT
IVE
SC
HE
ME
Man
ager
ial
Ince
nti
veS
chem
e,20
03S
easo
n
Fix
edw
ages
Per
form
ance
bon
us
Fix
edw
ages
Per
form
ance
bon
us
(May
1st–
Jun
e26
th)
(Ju
ne
27th
–Au
gust
31st
)(M
ay1s
t–Ju
ne
26th
)(J
un
e27
th–A
ugu
st31
st)
(1)
(2)
(3)
(4)
(5)
All
wor
kers
All
wor
kers
Sel
ecte
dw
orke
rsF
ired
wor
kers
Sel
ecte
dw
orke
rs
Wor
ker’
spr
odu
ctiv
ity
(kg/
hr)
Mea
n8.
3710
.48.
527.
6910
.4S
d,ov
eral
l4.
295.
994.
453.
445.
99S
d,be
twee
n2.
433.
352.
492.
113.
35S
d,w
ith
in3.
484.
643.
582.
984.
64N
um
ber
ofw
orke
rs19
713
013
067
130
Man
ager
ial
Ince
nti
veS
chem
e,20
04S
easo
nA
llw
orke
rsA
llw
orke
rs
Wor
ker’
spr
odu
ctiv
ity
(kg/
hr)
Mea
n7.
867.
85S
d,ov
eral
l5.
243.
51S
d,be
twee
n3.
082.
20S
d,w
ith
in4.
212.
87N
um
ber
ofw
orke
rs13
613
6
Not
es:T
hes
efi
gure
sar
eba
sed
onal
lw
orke
rsth
atar
eav
aila
ble
for
wor
kth
ree
wee
ksei
ther
side
ofth
ech
ange
inm
anag
eria
lin
cen
tive
sch
emes
.Sel
ecte
dw
orke
rsar
ede
fin
edto
beth
ose
that
pick
atle
ast
one
fiel
d-da
yu
nde
rbo
thm
anag
eria
lin
cen
tive
sch
emes
.Fir
edw
orke
rsar
eon
lyse
lect
edto
pick
wh
enm
anag
ers
are
paid
fixe
dw
ages
.(A
llob
serv
atio
ns
are
atth
ew
orke
r–fi
eld-
day
leve
l.)
746 QUARTERLY JOURNAL OF ECONOMICS
can identify the most productive workers, and it is these individ-uals that are selected to pick when managerial performance bo-nuses are introduced. Finally, comparing columns (3) and (5) wesee that among the selected workers, productivity increases by 22percent from 8.52 kg/hour to 10.4 kg/hour when managerial per-formance bonuses are introduced. This suggests the increase inoverall productivity shown in columns (1) and (2) is not onlydriven by the selection of better workers but also because themanagerial effort towards those selected workers changes whenperformance bonuses are introduced.
To shed light on whether managers target their effort differ-entially across selected workers, Table I then provides evidenceon the between and within worker variation in productivity. In2003, the variation in productivity both between and withinworkers significantly increases when performance bonuses areintroduced.
In contrast, the variation in productivity declines over timein 2004. The variation between workers declines presumablybecause differences in picking experience become less relevant fordifferences in productivity later in the season. The variation inproductivity within a worker might also decline because the pro-ductivity of a worker with more experience is less sensitive todaily shocks in field conditions.
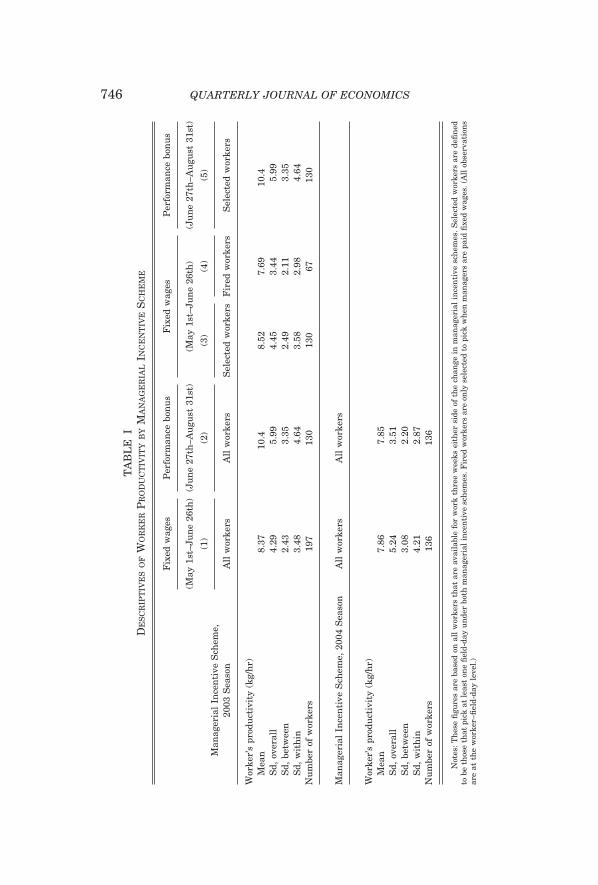
To illustrate the effect of managerial incentives on the dis-tribution of worker’s productivity, Figure IIa shows the kerneldensity estimate of worker productivity by managerial incentivescheme. This is calculated for those workers who are selected topick under both managerial incentive schemes and is thereforepurged of any selection effect. The figure shows both the meanand dispersion of workers’ productivity are higher when theirmanagers are paid performance bonuses.
To highlight the effect of managerial incentives on the pro-ductivity of each worker, Figure IIb plots each worker’s averageproductivity when managers are paid fixed wages against aver-age productivity when managers are paid performance bonuses.Each observation is weighted by the number of times the workeris selected to pick under the performance bonus and a largerbubble identifies a worker who is selected more often.
Figure IIb shows that the effect across workers is heteroge-neous and that those workers who experience an increase in theirproductivity are those workers who pick more frequently underthe performance bonus.
747INCENTIVES FOR MANAGERS AND INEQUALITY AMONG WORKERS
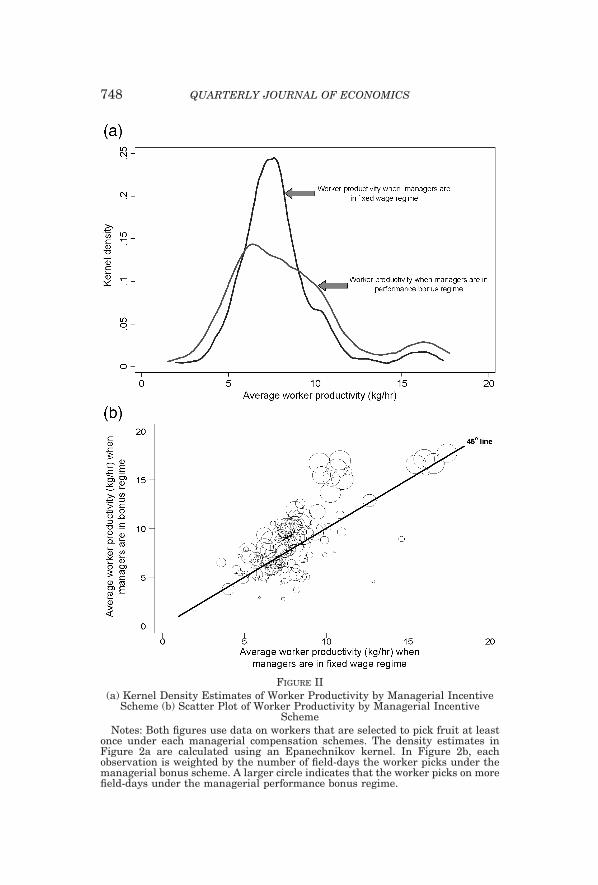
FIGURE II(a) Kernel Density Estimates of Worker Productivity by Managerial Incentive
Scheme (b) Scatter Plot of Worker Productivity by Managerial IncentiveScheme
Notes: Both figures use data on workers that are selected to pick fruit at leastonce under each managerial compensation schemes. The density estimates inFigure 2a are calculated using an Epanechnikov kernel. In Figure 2b, eachobservation is weighted by the number of field-days the worker picks under themanagerial bonus scheme. A larger circle indicates that the worker picks on morefield-days under the managerial performance bonus regime.
748 QUARTERLY JOURNAL OF ECONOMICS
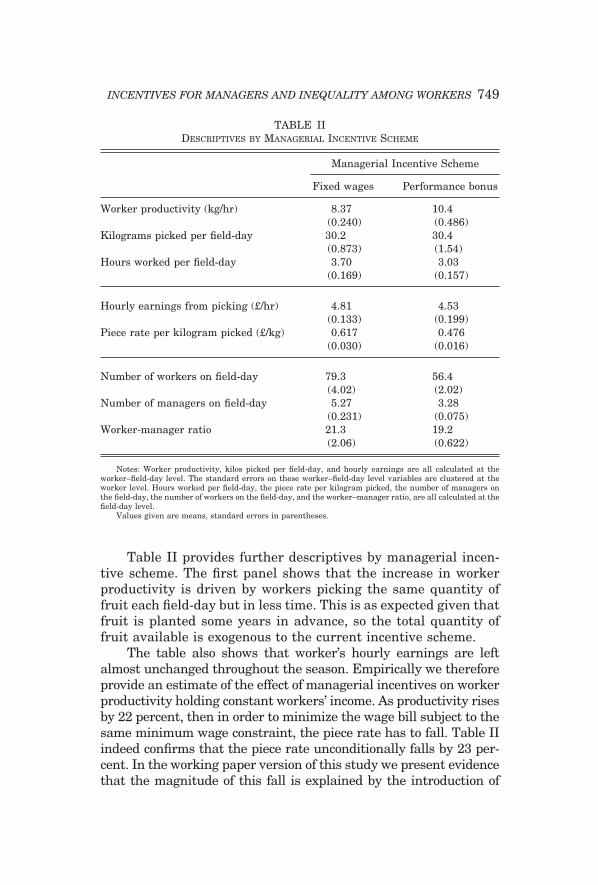
Table II provides further descriptives by managerial incen-tive scheme. The first panel shows that the increase in workerproductivity is driven by workers picking the same quantity offruit each field-day but in less time. This is as expected given thatfruit is planted some years in advance, so the total quantity offruit available is exogenous to the current incentive scheme.
The table also shows that worker’s hourly earnings are leftalmost unchanged throughout the season. Empirically we thereforeprovide an estimate of the effect of managerial incentives on workerproductivity holding constant workers’ income. As productivity risesby 22 percent, then in order to minimize the wage bill subject to thesame minimum wage constraint, the piece rate has to fall. Table IIindeed confirms that the piece rate unconditionally falls by 23 per-cent. In the working paper version of this study we present evidencethat the magnitude of this fall is explained by the introduction of
TABLE IIDESCRIPTIVES BY MANAGERIAL INCENTIVE SCHEME
Managerial Incentive Scheme
Fixed wages Performance bonus
Worker productivity (kg/hr) 8.37 10.4(0.240) (0.486)
Kilograms picked per field-day 30.2 30.4(0.873) (1.54)
Hours worked per field-day 3.70 3.03(0.169) (0.157)
Hourly earnings from picking (£/hr) 4.81 4.53(0.133) (0.199)
Piece rate per kilogram picked (£/kg) 0.617 0.476(0.030) (0.016)
Number of workers on field-day 79.3 56.4(4.02) (2.02)
Number of managers on field-day 5.27 3.28(0.231) (0.075)
Worker-manager ratio 21.3 19.2(2.06) (0.622)
Notes: Worker productivity, kilos picked per field-day, and hourly earnings are all calculated at theworker–field-day level. The standard errors on these worker–field-day level variables are clustered at theworker level. Hours worked per field-day, the piece rate per kilogram picked, the number of managers onthe field-day, the number of workers on the field-day, and the worker–manager ratio, are all calculated at thefield-day level.
Values given are means, standard errors in parentheses.
749INCENTIVES FOR MANAGERS AND INEQUALITY AMONG WORKERS
performance bonuses. Following the introduction of the bonus, theCOO, over nine days, revises his expectation of worker productivityand sets a lower piece rate thereafter. This provides evidence thatthe COO does not attempt to game the bonus scheme by increasingthe piece rate above the level that minimizes the wage bill to in-crease workers’ productivity and, hence, his expected bonus pay-ment. This is as expected, given that the wage bill is easily observ-able by the owner of the firm.
It is important to stress that the increase in worker produc-tivity is not due to an increase in the piece rate, as piece rates areactually lower after the introduction of the bonus. In the absenceof large income effects, we therefore expect workers to exert lesseffort in the second half of the season, all else equal [Paarsch andShearer 1999; Lazear 2000].
The final panel of Table II provides information on the numberof workers and managers per field-day, and the ratio of the two. Thenumber of workers declines by 29 percent after the introduction ofperformance incentives. As each worker’s productivity has risen andthe quantity of fruit available to pick is unchanged, fewer workersare needed to perform the same task. The number of managers onthe field-day declines in proportion to the number of workers so theratio of the two is unchanged. Therefore each manager’s span ofcontrol remains at close to 20 workers, so that managers have toallocate their effort across the same number of workers within afield-day throughout the season.
IV. AGGREGATE EFFECTS ON WORKERS’ PERFORMANCE
IV.A. Average Productivity
To begin with, we investigate the effect of the change inmanagerial incentives on average field-day productivity, as this isthe measure on which performance bonus payments are based.We estimate the following panel data specification:
(3) yft � � f � Bt � �Zft � �s�Mft
�sSsft � �ft,
where yft is the log of average productivity of workers on field f onday t, Bt is a dummy equal to one after the performance bonus isintroduced, and zero otherwise. The �f are field fixed effects whichcapture permanent differences in the level of productivity acrossfields. The Zft are time-varying field characteristics measured in
750 QUARTERLY JOURNAL OF ECONOMICS
logs. These include the average picking experience of workers andthe field’s life cycle, defined as the nth day the field is pickeddivided by the total number of days the field is picked over theseason. This captures the natural within-field trend in productiv-ity as fields deplete over time. We also include a time trend tocapture learning by farm management and aggregate trends inproductivity.15 Ssft is a dummy equal to one if manager s workson field f on day t, and zero otherwise, and Mft is the set ofmanagers that work on the field-day. We allow the error terms �ftto follow an AR(1) process, and given that the dependent variableis a mean, all observations are weighted by the number of work-ers on the field-day.16
The parameter of interest is the coefficient on the perfor-mance bonus dummy, . This captures in reduced form the effectof the change in managerial incentives on average worker pro-ductivity at the field-day level. More precisely, this measures acombination of two effects—(i) the change in managerial efforttargeted towards selected workers and (ii) the effect of the COOselecting different workers into the workforce. We expect botheffects to work in the same direction of increasing average pro-ductivity on the field-day.
The first two columns of Table III report OLS estimates of (3).Column (1) only controls for the bonus dummy. Productivity issignificantly higher after performance bonuses are introduced.Column (2) shows this result is robust to conditioning on fieldfixed effects, workers’ picking experience, the field life cycle, anda time trend.17 The signs of the coefficients on these controlsmake intuitive sense. There are positive returns to picking expe-rience, and productivity naturally declines later in a field’s lifecycle. There is no aggregate trend in productivity at the farmlevel, which is consistent with the farm’s practice to stagger fieldsto ensure a constant yield throughout the peak season.
15. As fields are operated on at different parts of the season and not allworkers pick each day, the effects of the field life cycle and workers’ pickingexperience can be separately identified from the effect of the time trend.
16. Therefore �ft � ��ft�1 � uft, where uft is a classical disturbance term.We control for autocorrelation by estimating a Prais-Winsten regression. Thisestimator is consistent and performs well in short time series and trended datarelative to other estimators [Doran and Griffiths 1983].
17. To the extent that the COO selects more experienced workers after theintroduction of the bonus, this effect is captured by the experience variable ratherthan the bonus dummy. In practice, by the time performance bonuses have beenintroduced, the marginal return to experience is low for most workers. Thus, theestimated effect of the bonus is quantitatively similar regardless of whether wecontrol for average workers’ experience.
751INCENTIVES FOR MANAGERS AND INEQUALITY AMONG WORKERS
TA
BL
EII
IT
HE
EF
FE
CT
OF
TH
EM
AN
AG
ER
IAL
INC
EN
TIV
ES
ON
AV
ER
AG
EW
OR
KE
RP
RO
DU
CT
IVIT
Y,
FIE
LD
-DA
YL
EV
EL
(Dep
ende
nt
Var
iabl
e�
Log
ofav
erag
epr
odu
ctiv
ity
(kil
ogra
mpi
cked
per
hou
ron
fiel
d-da
y))
(1)
OL
S(2
)C
ontr
ols
(3)
Fie
ldsp
ecifi
cA
R(1
)
(4)
Man
ager
fixe
def
fect
s
(5)
Sh
orte
rw
indo
w(6
)T
enu
re
Man
ager
ial
perf
orm
ance
bon
us
dum
my
.225
***
.203
***
.196
***
.194
***
.195
***
.190
**(.
044)
(.07
4)(.
069)
(.08
2)(.
095)
(.08
2)F
ield
life
cycl
e�
1.35
***
�1.
42**
*�
1.31
***
�1.
38**
�1.
29**
*(.
167)
(.19
4)(.
177)
(.25
1)(.
174)
Ave
rage
pick
ing
expe
rien
ceof
wor
kers
.284
***
.276
***
.313
***
.352
***
.335
***
(.05
0)(.
065)
(.06
2)(.
094)
(.09
3)T
ime
tren
d�
.003
�.0
02�
.001
�.0
02�
.003
(.00
2)(.
002)
(.00
2)(.
007)
(.00
6)T
enu
reu
nde
rpe
rfor
man
cebo
nu
ssc
hem
e.0
02(.
005)
Fie
ldfi
xed
effe
cts
No
Yes
Yes
Yes
Yes
Yes
Man
ager
fixe
def
fect
sN
oN
oN
oY
esY
esY
esR
-squ
ared
.098
6.3
873
.826
4.8
746
.882
9.8
759
Nu
mbe
rof
fiel
d-da
yob
serv
atio
ns
247
247
247
247
171
247
Not
es:*
**de
not
essi
gnifi
can
ceat
1pe
rcen
t,**
at5
perc
ent,
and
*at
10pe
rcen
t.A
llco
nti
nu
ous
vari
able
sar
ein
loga
rith
ms.
OL
Sre
gres
sion
esti
mat
esar
ere
port
edin
colu
mn
s(1
)an
d(2
).R
obu
stst
anda
rder
rors
are
calc
ula
ted.
Inth
ere
mai
nin
gco
lum
ns
AR
(1)
regr
essi
ones
tim
ates
are
repo
rted
.P
anel
corr
ecte
dst
anda
rder
rors
are
calc
ula
ted
usi
ng
aP
rais
-Win
sten
regr
essi
on.T
his
allo
ws
the
erro
rte
rms
tobe
fiel
dsp
ecifi
ch
eter
oske
dast
ic,a
nd
con
tem
pora
neo
usl
yco
rrel
ated
acro
ssfi
elds
.Th
eau
toco
rrel
atio
npr
oces
sis
assu
med
tobe
spec
ific
toea
chfi
eld.
Eac
hfi
eld-
day
obse
rvat
ion
isw
eigh
ted
byth
elo
gof
the
nu
mbe
rof
wor
kers
pres
ent.
Th
em
anag
eria
lpe
rfor
man
cebo
nu
sdu
mm
y�
1w
hen
the
man
ager
ial
perf
orm
ance
bon
us
sch
eme
isin
plac
e,an
d0
oth
erw
ise.
Th
efi
eld
life
cycl
eis
defi
ned
asth
en
thda
yth
efi
eld
ispi
cked
divi
ded
byth
eto
tal
nu
mbe
rof
days
the
fiel
dis
pick
edov
erth
ese
ason
.Ten
ure
un
der
the
perf
orm
ance
bon
us
sch
eme
isde
fin
edas
the
nu
mbe
rof
fiel
d-da
ysth
epe
rfor
man
cebo
nu
sh
asbe
enin
plac
efo
r.T
he
spec
ifica
tion
inco
lum
n(5
)res
tric
tsth
esa
mpl
eto
days
up
toan
din
clu
din
gth
efi
rst
9da
ysin
the
post
bon
us
peri
od.T
hes
ear
eth
eda
tes
over
wh
ich
the
piec
era
teh
asn
otad
just
edto
the
hig
her
prod
uct
ivit
yof
wor
kers
.
752 QUARTERLY JOURNAL OF ECONOMICS

The estimates indicate that average productivity increasesby 21 percent after the bonus is introduced. In comparison, a onestandard deviation increase in a field’s life cycle decreases pro-ductivity by 22 percent, and a one standard deviation increase inthe average picking experience of workers increases productivityby 18 percent. This suggests the introduction of performancebonuses has an economically as well as statistically significanteffect on average productivity.
Column (3) shows that the coefficients are very similar whenthe same specification is estimated allowing for field-specific AR(1)error terms. The specification in column (4) controls for managerfixed effects. These can be separately identified from the field fixedeffects because a given manager does not always work on the samefield and capture all time invariant sources of heterogeneity acrossmanagers. We find that the magnitude and significance of the pre-vious controls remain similar to those in column (3). Moreover, themanager fixed effects are jointly significant at the 1 percent signif-icance level suggesting that, as expected, the middle-tier of manag-ers have significant effects on workers’ productivity.
A possible concern is that the increase in average productivity isdue solely to workers changing their behavior rather than managersreacting to the change in incentives. For example this may be thecase if workers have an income target and work harder because,following the introduction of the performance bonus, the piece ratefalls. To address this concern we exploit the fact that for the firstnine days in the post-bonus period, which corresponds to twenty-nine field-days, the piece rate was not significantly different fromthat under the fixed wage regime. If our findings were due to incometargeting, we should find no effect of the introduction of the bonusfor the first nine days when the piece rate remains at its pre-bonuslevel. In contrast, column (5) shows that when keeping the piece rateconstant, the effect of the performance bonus on average productiv-ity is still positive, significant, and of similar magnitude to theestimated effect in the whole sample.18
The final specification explores whether the baseline resultsare robust to controlling for the number of days the bonus has been
18. Given workers cannot choose the hours they pick for, they do not face astandard trade-off between leisure and income and so income targeting is unlikelyto explain their behavior. Other analyses of income targeting in different settingsreach mixed conclusions. Camerer et al. [1997] find that New York cab driverswork fewer hours when the observed daily wage is higher and interpret this asevidence in favor of income targeting. However, Farber [2005] presents evidenceagainst income targeting by cab drivers.
753INCENTIVES FOR MANAGERS AND INEQUALITY AMONG WORKERS
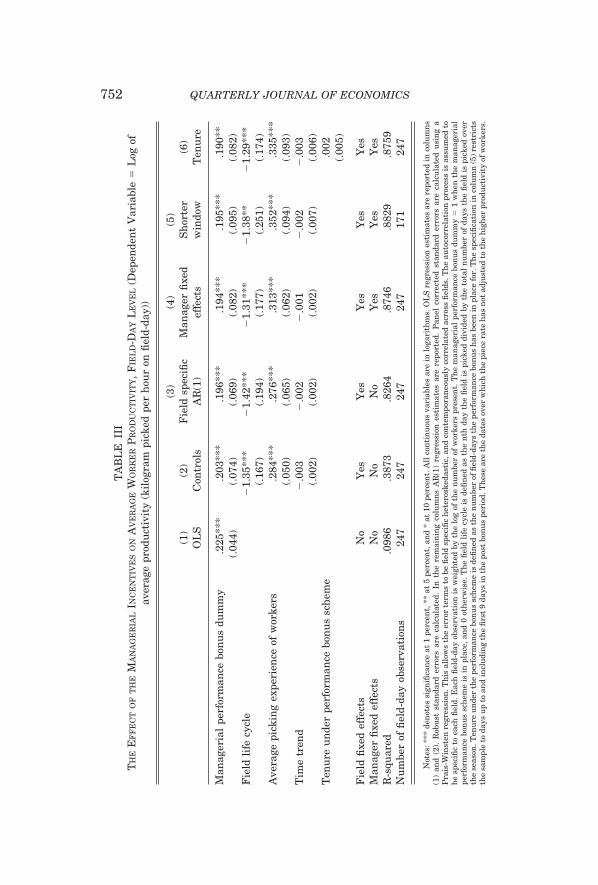
in place for, or equivalently, allowing the bonus dummy to be inter-acted with the time trend. The result in column (6) shows the timetrend does not vary over the two halves of the season. This indicatesthe effect of the bonus is long lasting, namely the bonus dummyis not just picking up a short run change in behavior.19
IV.B. The Dispersion of Productivity
We now analyze the effect of the introduction of managerialperformance bonuses on the dispersion of workers’ productivitywithin a field-day. We estimate
(4) cvft � �f � Bt � �Zft � �s�Mft
�sSsft � uift,
where cvft is the log of the coefficient of variation of productivityof workers on field f on day t. To account for the fact that workersaccumulate experience at different rates, we control for the log ofthe coefficient of variation of worker’s picking experience on thefield-day. Similarly, the variation in fruit available between rowswithin a field may increase over time so we control for the log ofthe field life cycle. Table IV presents estimates of (4) following asimilar set of specifications as in Table III.
The parameter of interest is the coefficient on the perfor-mance bonus dummy, . The baseline result is that the introduc-tion of performance bonuses increased the dispersion of produc-tivity on the field-day by 38 percent other things equal (column(4)).20 We note that in column (4) the manager fixed effects arejointly significant at the 1 percent significance level suggestingthat, as expected, the middle tier of managers have significanteffects on the dispersion of productivity.
These results have important implications for the inequality
19. We also performed a series of further robustness checks. First, the base-line results in column (4) are also robust to alternative functional forms such asallowing the controls to enter in levels rather than logs, and allowing for anonlinear effect of the field life cycle. Second, the baseline results are robust tocontrolling for other time varying variables such as meteorological conditions andthe average experience of managers on the field-day. Third, the results are robustto controlling for changes in the composition of nonpicking tasks over time byrestricting the sample to workers who are exclusively assigned to picking tasks ona given day.
20. This result is robust to (i) controlling for the coefficient of variation ofexperience of managers on the field-day; (ii) controlling for other time varyingvariables such as meteorological conditions; (iii) alternative functional forms thatallow the controls to enter in levels and allow for a nonlinear effect of the field lifecycle; (iv) restricting the sample to workers who are exclusively assigned topicking tasks on a given day.
754 QUARTERLY JOURNAL OF ECONOMICS
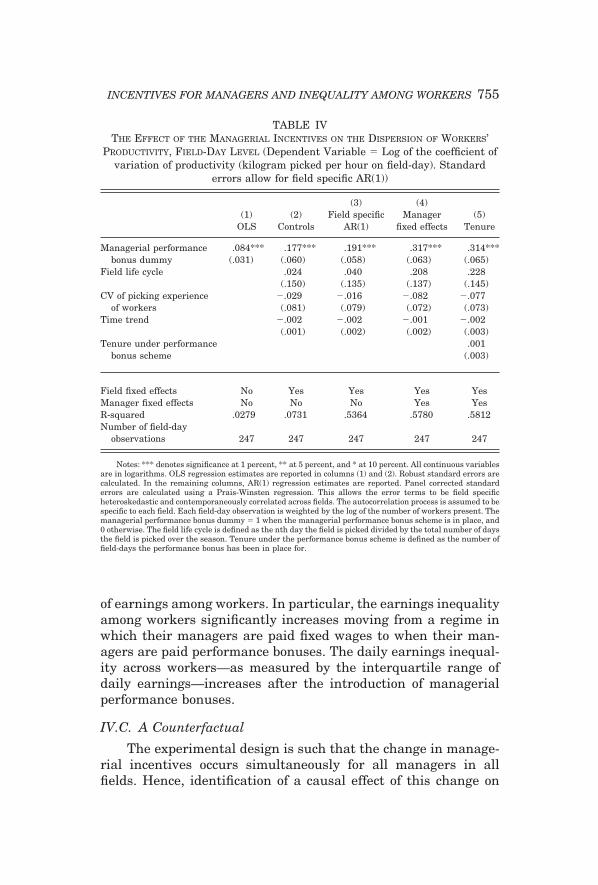
of earnings among workers. In particular, the earnings inequalityamong workers significantly increases moving from a regime inwhich their managers are paid fixed wages to when their man-agers are paid performance bonuses. The daily earnings inequal-ity across workers—as measured by the interquartile range ofdaily earnings—increases after the introduction of managerialperformance bonuses.
IV.C. A Counterfactual
The experimental design is such that the change in manage-rial incentives occurs simultaneously for all managers in allfields. Hence, identification of a causal effect of this change on
TABLE IVTHE EFFECT OF THE MANAGERIAL INCENTIVES ON THE DISPERSION OF WORKERS’
PRODUCTIVITY, FIELD-DAY LEVEL (Dependent Variable � Log of the coefficient ofvariation of productivity (kilogram picked per hour on field-day). Standard
errors allow for field specific AR(1))
(1)OLS
(2)Controls
(3)Field specific
AR(1)
(4)Manager
fixed effects(5)
Tenure
Managerial performancebonus dummy
.084*** .177*** .191*** .317*** .314***(.031) (.060) (.058) (.063) (.065)
Field life cycle .024 .040 .208 .228(.150) (.135) (.137) (.145)
CV of picking experienceof workers
�.029 �.016 �.082 �.077(.081) (.079) (.072) (.073)
Time trend �.002 �.002 �.001 �.002(.001) (.002) (.002) (.003)
Tenure under performancebonus scheme
.001(.003)
Field fixed effects No Yes Yes Yes YesManager fixed effects No No No Yes YesR-squared .0279 .0731 .5364 .5780 .5812Number of field-day
observations 247 247 247 247 247
Notes: *** denotes significance at 1 percent, ** at 5 percent, and * at 10 percent. All continuous variablesare in logarithms. OLS regression estimates are reported in columns (1) and (2). Robust standard errors arecalculated. In the remaining columns, AR(1) regression estimates are reported. Panel corrected standarderrors are calculated using a Prais-Winsten regression. This allows the error terms to be field specificheteroskedastic and contemporaneously correlated across fields. The autocorrelation process is assumed to bespecific to each field. Each field-day observation is weighted by the log of the number of workers present. Themanagerial performance bonus dummy � 1 when the managerial performance bonus scheme is in place, and0 otherwise. The field life cycle is defined as the nth day the field is picked divided by the total number of daysthe field is picked over the season. Tenure under the performance bonus scheme is defined as the number offield-days the performance bonus has been in place for.
755INCENTIVES FOR MANAGERS AND INEQUALITY AMONG WORKERS
productivity arises from a comparison within a field over time.The estimated effect is then biased upward to the extent that itcaptures factors that cause productivity to rise through the sea-son regardless of the change in incentive schemes and that arenot captured by the observable time varying controls such as thefarm level trend, workers’ experience, or the field life cycle. Weaddress this concern by exploiting data from the same farm in2004 when managers were paid the same level of fixed wagesthroughout.
This counterfactual allows us to identify the causal effect ofmanagerial incentives on the mean and dispersion of productivityunder the assumption that productivity would have been thesame in 2003 and 2004, had managerial incentives remainedunchanged in 2003. We define a placebo bonus dummy for the2004 season. This is equal to one after June 27th 2004, that is thedate when performance bonuses were introduced in 2003, andzero otherwise.
We then stack the data and estimate the effect of the bonusas a difference-in-difference between the two seasons. These dif-ference-in-difference estimates indicate that—(i) the placebo bo-nus dummy for the 2004 season has no effect on average produc-tivity; (ii) the dispersion of productivity in 2004 is actually lowerin the second half of the season.
These results add weight to a causal interpretation of theeffect of managerial performance bonuses on workers’ productiv-ity. If the performance bonus dummy were spuriously capturingother time varying factors, the effect of the placebo bonus dummyshould be similar in the 2004 season.
V. TARGETING EFFECTS
We now use individual level data to break down the aggre-gate effects of managerial performance bonuses into those arisingthrough two separate channels—(i) a targeting effect that stemsfrom managers having incentives to allocate their effort acrossworkers differently; (ii) a selection effect that stems from theCOO selecting different workers into employment. In this sectionwe provide evidence on the targeting effect. Section VI investi-gates the selection effect.
The targeting effect is identified from a comparison of thesame worker’s productivity under both managerial incentiveschemes. We therefore restrict attention to those workers that
756 QUARTERLY JOURNAL OF ECONOMICS
pick when managers are paid a fixed wage and continue to beselected to pick under the managerial performance regime. Wefirst estimate a quantile regression to identify the heterogeneouseffects of managerial performance bonuses across workers. Wethen estimate a fixed effects regression to identify the effects ofperformance bonuses on the same worker and to shed light onwhich observable worker characteristics explain the increase be-tween worker variation in productivity under managerial perfor-mance bonuses.
V.A. Quantile Regression Estimates
Theory suggests managers have greater incentives to targettheir effort towards high ability workers when they are paidperformance bonuses tied to the average productivity of the work-ers they manage, than when they are paid a fixed wage. Hencethe effect of managerial performance bonuses on worker’s produc-tivity will differ at different points of the distribution of workers’productivity conditional on observables. We use quantile regres-sion to estimate the following conditional distribution of the log ofproductivity of worker i on field f on day t, yift, at each quantile� � [0,1]:
(5) Quant�(yift��) � � Bt � ��f�f � �� Xift � �� Zft � �s�Mft
��sSsft,
where Bt is a dummy equal to one after the performance bonus isintroduced, and zero otherwise; �f is a dummy equal to one forfield f, and zero otherwise; Xift is the log of worker i’s pickingexperience; and Zft includes the log of the field life cycle and afarm level time trend, and Ssft is a fixed effect for manager s. Theerror terms are clustered by field-day because workers on thesame field-day face similar field conditions and, hence, are likelyto be subject to common productivity shocks. Bootstrapped stan-dard errors based on 1,000 replications are calculatedthroughout.
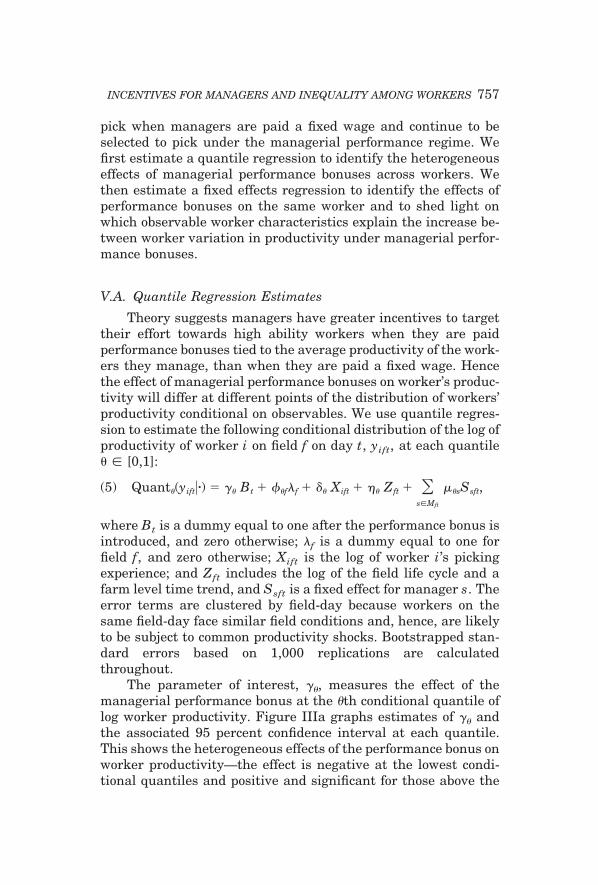
The parameter of interest, �, measures the effect of themanagerial performance bonus at the �th conditional quantile oflog worker productivity. Figure IIIa graphs estimates of � andthe associated 95 percent confidence interval at each quantile.This shows the heterogeneous effects of the performance bonus onworker productivity—the effect is negative at the lowest condi-tional quantiles and positive and significant for those above the
757INCENTIVES FOR MANAGERS AND INEQUALITY AMONG WORKERS
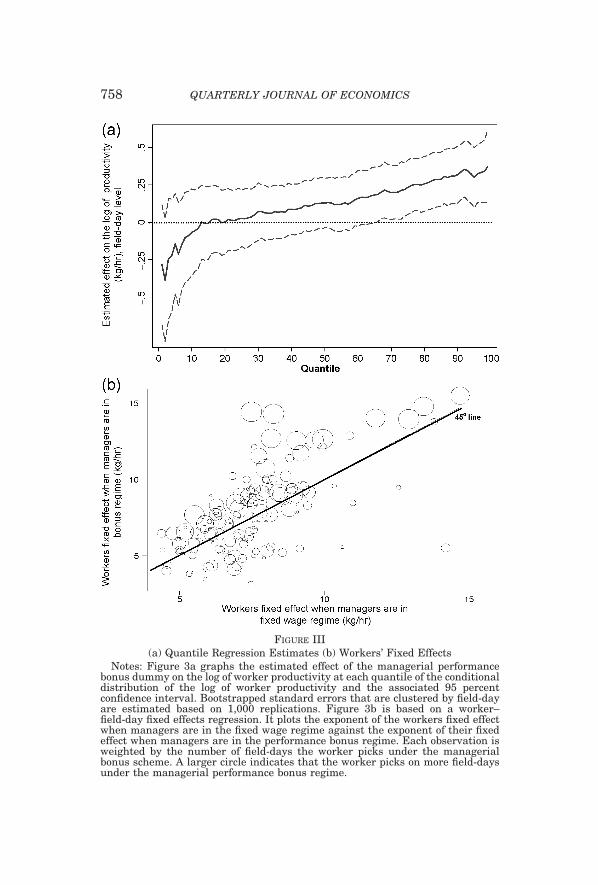
FIGURE III(a) Quantile Regression Estimates (b) Workers’ Fixed Effects
Notes: Figure 3a graphs the estimated effect of the managerial performancebonus dummy on the log of worker productivity at each quantile of the conditionaldistribution of the log of worker productivity and the associated 95 percentconfidence interval. Bootstrapped standard errors that are clustered by field-dayare estimated based on 1,000 replications. Figure 3b is based on a worker–field-day fixed effects regression. It plots the exponent of the workers fixed effectwhen managers are in the fixed wage regime against the exponent of their fixedeffect when managers are in the performance bonus regime. Each observation isweighted by the number of field-days the worker picks under the managerialbonus scheme. A larger circle indicates that the worker picks on more field-daysunder the managerial performance bonus regime.
758 QUARTERLY JOURNAL OF ECONOMICS
60th conditional quantile. In line with the descriptive evidence onthe unconditional distribution of workers’ productivity in FigureIIa, the QR estimates suggest the conditional distribution ofproductivity becomes more dispersed under managerial perfor-mance bonuses.
One possible concern with this interpretation is that theconditional distribution of productivity may naturally becomemore dispersed over time. For instance, this may be because somepickers quickly move up the learning curve and others becomebored. The evidence from the control season in 2004, however,suggests the opposite. The descriptive evidence in Table I showsthat in 2004 the dispersion of worker productivity is lower in thesecond half of the season. In addition, estimating the quantileregression specification (5) in this control season, we find theeffect of the placebo bonus dummy to be positive and significantfor all quantiles below the 40th, zero for intermediate quantiles,and negative and significant for the very highest quantiles. Thisfinding implies that in the absence of a change in managerialincentives, the conditional distribution of productivity naturallybecomes less dispersed over time.
V.B. Fixed Effect Estimates
While the QR results provide evidence of the heterogenouseffects of managerial performance bonuses on worker productiv-ity, they do not pin down whether a given worker’s productivity issystematically higher or lower when their manager is paid aperformance bonus relative to when she is paid a fixed wage. Toprovide such evidence on the effects of managerial incentives onthe productivity of the same worker, we present fixed effectsestimates. We first estimate the following worker–field-day spec-ification for the 130 selected workers that pick under both man-agerial incentive schemes:
(6) yift � �i�1
130
��i � �iBt� Di � �f � �Xift � �Zft � �s�Mft
�sSsft � uift,
where yift is the log of productivity of worker i on field f on day t,Di is a dummy equal to one for worker i, and zero otherwise, andthe other variables are as previously defined. We estimate (6)using OLS, where disturbance terms are clustered by field-day
759INCENTIVES FOR MANAGERS AND INEQUALITY AMONG WORKERS
because workers on the same field-day are likely to face commonproductivity shocks.21
�̂i is an estimate of worker i’s expected productivity when hermanagers are paid a fixed wage, and (�̂i � �̂i) is her expectedproductivity when her managers are paid performance bonuses.To rescale these estimates in terms of kilograms per hour, FigureIIIb then plots the exponent of �̂i against the exponent of (�̂i � �̂i)for each selected worker. Each worker’s observation is weightedby the number of field-days that she is selected to pick under theperformance bonus scheme. The figure thus provides evidence onthe effect on the same worker of the change in a managerialincentive scheme, conditional on observable determinants ofproductivity.
Figure IIIb reiterates the message of the earlier descriptiveevidence on unconditional worker productivity by managerialincentive scheme (Figure IIb). In particular we see that condi-tional on observable determinants of worker productivity: (i)there are heterogeneous effects of managerial incentives acrossworkers—some workers have systematically higher productivitywith the change in managerial incentives while others have sys-tematically lower productivity; (ii) the more productive workersunder the fixed wage regime always have higher productivityunder the performance bonus scheme; (iii) those workers thatexperience an increase in their productivity are selected to pickmost frequently under the performance bonus.22
VI. SELECTION EFFECTS
VI.A. Evidence
Theory predicts that changing the COO’s compensationscheme from fixed wages to sufficiently high powered perfor-mance pay will make him change his selection strategy in favor ofthe most able workers as this increases average productivity. Thedescriptive evidence in Table I and the estimated effects on the
21. Clustering at the worker or worker–managerial incentive scheme levelyields considerably smaller standard errors. The fixed effects alone explainaround 38 percent of the variation in productivity, suggesting there is consider-able heterogeneity in the underlying ability of workers.
22. Using �̂i as a measure of a worker’s ability, we find that groups of workerson the field-day were equally heterogeneous before and after the change inmanagerial incentives. Hence, there is no evidence the COO sorts workers differ-ently by ability into fields post-bonus. This is as expected given the considerablevariation in the quantity of fruit available across rows within a field.
760 QUARTERLY JOURNAL OF ECONOMICS
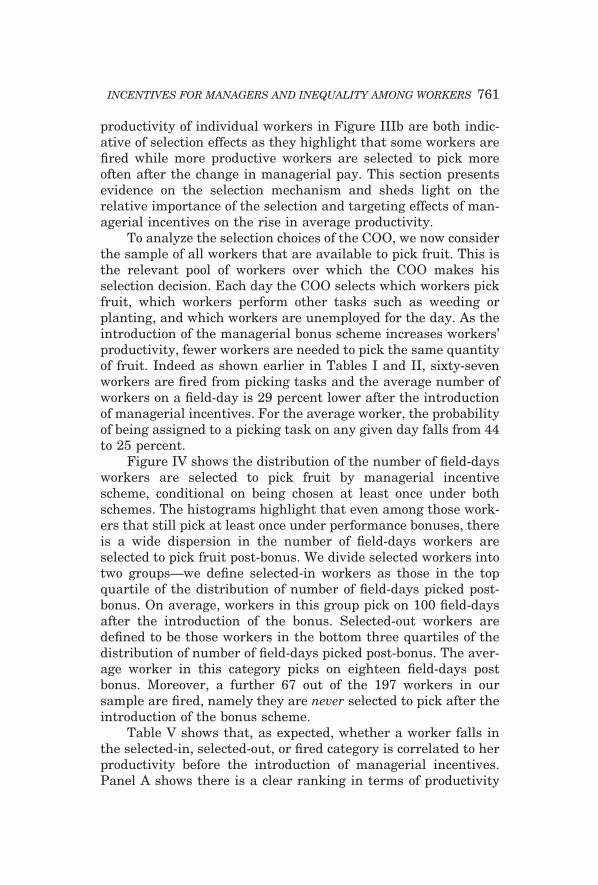
productivity of individual workers in Figure IIIb are both indic-ative of selection effects as they highlight that some workers arefired while more productive workers are selected to pick moreoften after the change in managerial pay. This section presentsevidence on the selection mechanism and sheds light on therelative importance of the selection and targeting effects of man-agerial incentives on the rise in average productivity.
To analyze the selection choices of the COO, we now considerthe sample of all workers that are available to pick fruit. This isthe relevant pool of workers over which the COO makes hisselection decision. Each day the COO selects which workers pickfruit, which workers perform other tasks such as weeding orplanting, and which workers are unemployed for the day. As theintroduction of the managerial bonus scheme increases workers’productivity, fewer workers are needed to pick the same quantityof fruit. Indeed as shown earlier in Tables I and II, sixty-sevenworkers are fired from picking tasks and the average number ofworkers on a field-day is 29 percent lower after the introductionof managerial incentives. For the average worker, the probabilityof being assigned to a picking task on any given day falls from 44to 25 percent.
Figure IV shows the distribution of the number of field-daysworkers are selected to pick fruit by managerial incentivescheme, conditional on being chosen at least once under bothschemes. The histograms highlight that even among those work-ers that still pick at least once under performance bonuses, thereis a wide dispersion in the number of field-days workers areselected to pick fruit post-bonus. We divide selected workers intotwo groups—we define selected-in workers as those in the topquartile of the distribution of number of field-days picked post-bonus. On average, workers in this group pick on 100 field-daysafter the introduction of the bonus. Selected-out workers aredefined to be those workers in the bottom three quartiles of thedistribution of number of field-days picked post-bonus. The aver-age worker in this category picks on eighteen field-days postbonus. Moreover, a further 67 out of the 197 workers in oursample are fired, namely they are never selected to pick after theintroduction of the bonus scheme.
Table V shows that, as expected, whether a worker falls inthe selected-in, selected-out, or fired category is correlated to herproductivity before the introduction of managerial incentives.Panel A shows there is a clear ranking in terms of productivity
761INCENTIVES FOR MANAGERS AND INEQUALITY AMONG WORKERS
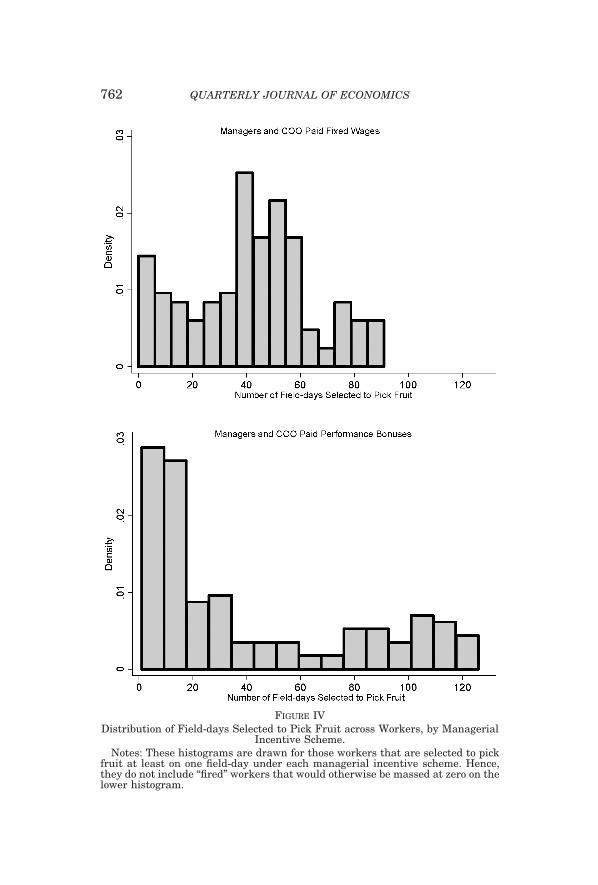
FIGURE IVDistribution of Field-days Selected to Pick Fruit across Workers, by Managerial
Incentive Scheme.Notes: These histograms are drawn for those workers that are selected to pick
fruit at least on one field-day under each managerial incentive scheme. Hence,they do not include “fired” workers that would otherwise be massed at zero on thelower histogram.
762 QUARTERLY JOURNAL OF ECONOMICS

across different groups of workers—those who were most produc-tive when managers were paid fixed wages are selected to pickmore frequently when managers are paid performance bonuses.Workers with intermediate productivity levels are only selectedto pick occasionally post-bonus, and those workers with the low-est productivity pre-bonus are fired from picking tasks altogether.
Panel B of Table V shows unemployment rates by workertype and managerial incentive scheme. Under fixed wages, thereis a clear ranking of unemployment rates across the three types ofworker. When performance bonuses are introduced, unemploy-ment rates rise for all workers, but the increase is higher forworkers who are fired and those who are selected out, indicatingthat these workers are not simply reallocated to other nonpickingtasks. In contrast, no workers are fired in the 2004 picking sea-son. This is as expected given there is no rise in productivity overthe two halves of the season in 2004.
An important consequence of these changes in the selectionof workers into work and unemployment is that the differentialrise in unemployment increases the earnings inequality across
TABLE VSELECTION INTO THE WORKFORCE
Selected-inworkers
Selected-outworkers
Fixedworkers
A: Productivitya
Fixed wages 9.03 7.45 6.79(3.03) (2.09) (2.15)
Performance bonus 11.11 7.35(3.66) (2.50)
B: Unemployment rateb
Fixed wages .037 .089 .187(.052) (.122) (.186)
Performance bonus .059 .146 .340(.060) (.180) (.372)
Notes: These figures are based on the sample of all 197 workers available to pick fruit. Selected-inworkers are defined to be those that are in the top quartile of the distribution of number of field-days pickedpost-bonus. This corresponds to 77 or more field-day observations on which the worker picks post-bonus.Selected-out workers are defined to be those workers in the bottom three quartiles of the distribution ofnumber of field-days picked post-bonus. Fired workers are those who never pick after the introduction of theperformance bonus. There are 67 fired workers. The unemployment rate for a worker is the share of days inwhich the worker is present on the farm but is not assigned to any task.
a. Average productivity of workers (kg/hr) by worker type and managerial incentive scheme. Standarddeviation in parentheses.
b. Average unemployment rate of workers by worker type and managerial incentive scheme. Standarddeviation in parentheses.
763INCENTIVES FOR MANAGERS AND INEQUALITY AMONG WORKERS
workers over the season. This selection effect exacerbates theincrease in earnings inequality documented earlier that arisesbecause the effects of managerial incentives on individual workerproductivity are very heterogeneous to begin with.
In our working paper we shed light on the effect of manage-rial performance pay on the selection of workers into employmentwhile controlling for farm level variables that affect the probabil-ity of being hired independently of the incentive scheme in place.Importantly, we are able to disentangle the effect of managerialperformance pay from changes in the supply and demand of labor.The findings indicate that, other things equal, the average workeris less likely to be selected into picking and more likely to be leftunemployed following the introduction of the managerial bonusscheme.
Section V showed that, conditional on being selected to pick,the productivity of some workers raises while the productivity ofothers falls after the introduction of the managerial bonusscheme. Next, we analyze whether these two effects reinforceeach other, namely whether workers who experience the largestincrease in productivity are also more likely to be selected intopicking.
To do so we use a linear probability model and estimate thefollowing specification:
(7) pit � �i�1
130
��i � �iBt� Di � �XtD � � Xt
S � uit,
where pit, XtD, and Xt
S are as defined before, and Di is a dummyequal to one for worker i, and zero otherwise.23 �̂i is an estimateof worker i’s probability to be selected to pick when her managersare paid a fixed wage, and (�̂i � �̂i) is her probability to beselected when her managers are paid performance bonuses.
Figure Va then plots �̂i—the change in probability of workeri to be selected into picking with the introduction of performancebonuses for managers against �̂i from the fixed effects regressionof worker’s productivity (6)—worker i’s change in log productivitywhen performance bonuses are introduced. The line of best fitslopes upward, indicating that workers who experience the larg-est increase in productivity also have the greatest increase in the
23. The mean of the dependent variable is close to one half, and so the LPMdoes not predict any probabilities outside the [0,1] interval.
764 QUARTERLY JOURNAL OF ECONOMICS
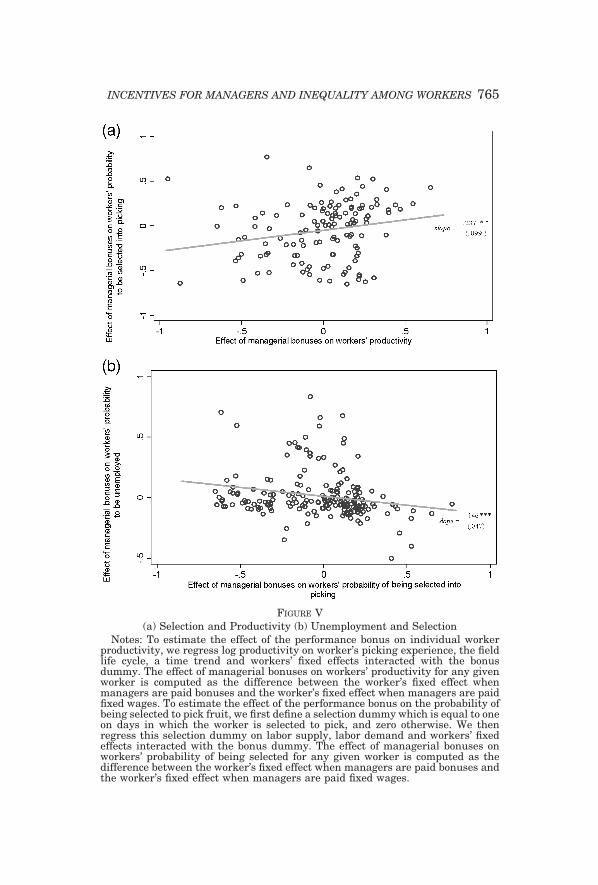
FIGURE V(a) Selection and Productivity (b) Unemployment and Selection
Notes: To estimate the effect of the performance bonus on individual workerproductivity, we regress log productivity on worker’s picking experience, the fieldlife cycle, a time trend and workers’ fixed effects interacted with the bonusdummy. The effect of managerial bonuses on workers’ productivity for any givenworker is computed as the difference between the worker’s fixed effect whenmanagers are paid bonuses and the worker’s fixed effect when managers are paidfixed wages. To estimate the effect of the performance bonus on the probability ofbeing selected to pick fruit, we first define a selection dummy which is equal to oneon days in which the worker is selected to pick, and zero otherwise. We thenregress this selection dummy on labor supply, labor demand and workers’ fixedeffects interacted with the bonus dummy. The effect of managerial bonuses onworkers’ probability of being selected for any given worker is computed as thedifference between the worker’s fixed effect when managers are paid bonuses andthe worker’s fixed effect when managers are paid fixed wages.
765INCENTIVES FOR MANAGERS AND INEQUALITY AMONG WORKERS
likelihood to be selected into employment, conditional on all otherdeterminants of productivity and selection.
To assess whether workers who are less likely to be selectedinto picking are reallocated to other tasks or left unemployed,Figure Vb presents evidence on the relationship between thechange in the probability of being unemployment and the changein the probability of being selected into picking. We estimate alinear probability model analogous to (7) where pit is redefined tobe equal to one if worker i is unemployed on day t and zero ifworker i is assigned to a nonpicking task. Figure Vb plots thechange in the probability of worker i being unemployed againstthe change in the probability of worker i being selected intopicking, moving from fixed wages to managerial performancebonuses. The relationship is negative, suggesting workers whoare less likely to be selected to pick after the introduction of thebonus scheme are also more likely to be left unemployed.
VI.B. The Relative Importance of the Targeting and SelectionEffects
In our setting, the introduction of managerial performancepay increases productivity both because the productivity of themost able workers increases and because the most able workerscontribute to the average more often. These two effects reinforceeach other, as the workers who experience the highest rise inproductivity are also more likely to be selected in.
To understand the relative importance of the selection andtargeting effects on average productivity, we conduct two thoughtexperiments. In each case we compute the increase in productiv-ity had the selection process remained unchanged over the sea-son. Namely, the increase in productivity had each worker beenchosen with the same probability after the bonus as she wasbefore the bonus. In both cases we assume the productivity ofselected-in and selected-out workers would be the same as actu-ally observed, as given in Table V.
For the first thought experiment we assume the productivity offired workers would have remained unchanged after the introduc-tion of the bonus scheme. Under this assumption, average produc-tivity would have increased by 7.5 percent in the post-bonus period.
For the second thought experiment we assume the produc-tivity of all fired workers would have increased in the sameproportion as the average of the selected-in workers. Under this
766 QUARTERLY JOURNAL OF ECONOMICS

assumption, average productivity would have increased by 11.1percent in the post-bonus period.
Given the unconditional increase in productivity is 25 percent,these thought experiments suggest that the observed increase inproductivity is driven at least as much by the selection of moreproductive workers—that is, largely attributable to the behavior ofthe COO, as it is driven by increases in the productivity of the sameworkers—something that is largely attributable to the behavior ofmanagers. This is consistent with a “magnification effect” [Rosen1982], so that the actions of individuals higher up in the firmhierarchy have a greater impact on firm performance than do theactions of individuals at lower tiers of the hierarchy.24
We perform similar thought experiments to assess the rela-tive importance of targeting and selection effects in explainingthe observed change in the dispersion of workers’ productivity.These reveal that the change in dispersion is nearly entirely dueto the fact that managers target the most able workers after theintroduction of performance pay. In other words, the coefficient ofvariation would have increased by the same amount had theselection remained unchanged. The reason is that, as shown inTable V, the productivity of the marginal worker who is stillemployed after the bonus is more similar to the fired workersthan to the most able workers. Namely, the distribution of abilityacross workers is such that even when the least able workers arefired, the marginal worker selected to pick is still of relatively lowability and so there remains considerable heterogeneity in pro-ductivity across selected workers.
VI.C. Potentially Reinforcing Mechanisms
We have so far emphasized that the change in managerialincentives affects worker productivity through both a targeting andselection effect and provided evidence on the relative importance ofboth. In our setting there are, however, two additional mechanismsthrough which the effects on productivity may be reinforced.
The first possibility is that some of the rise in productivitycan be attributed to the fact that tighter selection creates a rat
24. The theoretical literature has traditionally focused on determining theoptimal number of layers in a hierarchy, the span of control at each layer, and thedistribution of wages within the firm [Williamson 1967; Calvo and Wellisz 1979;Qian 1994]. We have taken the first two factors as given throughout—workers arealways managed in the firm we study, and as detailed in Section III, managers’span of control remains constant throughout the season.
767INCENTIVES FOR MANAGERS AND INEQUALITY AMONG WORKERS
race or rank order tournament among workers [Akerlof 1976;Lazear and Rosen 1981]. Indeed, by exerting effort workers notonly increase their earnings today because they are paid a piecerate, but also increase the probability of being retained for futureemployment. In our setting, however, the most able workersexperience an increase in productivity whereas the least able donot. This pattern would be consistent with a rat race only if itwere too costly for the low ability workers to engage in the ratrace so that only the high ability workers would be motivated byit. This seems unlikely in light of the fact that the marginalworker selected into employment has low ability, which impliesthat the high ability workers are unlikely to be left unemployed.In general, any rat race effect would reinforce the large andheterogeneous effects that managerial effort has on workers.Disentangling the effects of managerial effort from those of a ratrace would at least require more precise information on manage-rial actions on each field-day, such as the allocation of workers torows, which is unavailable.
Peer effects are a second mechanism through which the in-crease in average productivity could be reinforced. We haveshown that following the introduction of managerial performancepay, the lowest ability workers are fired and this may affect theproductivity of the remaining selected workers. In particular, ifworkers work harder when they are surrounded by more produc-tive colleagues, firing the least able workers might increase theproductivity of the remaining workers. In our context, however,the fact that the most able workers experience the highest in-crease in productivity while the least able selected workers arenot affected (Figure IIIa) suggests there would have to be a veryparticular pattern of peer effects for this hypothesis to explain thedata. Namely, peer effects should be such that the individualswho are most dissimilar to the fired workers are affected the mostwhile the individuals who are most similar are affected the least.In other words, the highest ability workers should be most af-fected by the removal of the least able workers while the lowestability workers still selected in, should be unaffected by theremoval of similarly low ability workers.
VII. DISCUSSION
This paper presents evidence from a firm level experimentdesigned to identify the effects of managerial performance pay on
768 QUARTERLY JOURNAL OF ECONOMICS
the mean and the dispersion of productivity of lower tier workers.We find that the introduction of managerial performance payraises both the mean and the dispersion of productivity. Theanalysis of individual productivity data from personnel records,shows that the results are due to two underlying changes inmanagerial behavior. There is a targeting effect so that managersallocate more of their effort towards high ability workers, andthere is a selection effect so that the least able workers areemployed less often and, in some cases, fired.
The purely exogenous variation in managerial incentivescreated by our natural field experiment in combination withdetailed personnel records and a fixed pool of individuals in theworkforce allows us to precisely identify the causal effect ofhigh powered managerial incentives on the firm’s productivitythrough both targeting and selection of lower tier workers. Pre-cision, however, inevitably entails some loss of generality becausethe firm we study, as any other, has unique features that influ-ence the effect of managerial incentives on productivity.
Two features of our firm are particularly relevant for theexternal validity of this study. First, the employment situation israther special as the pool of managers and workers available foremployment is fixed and observable, at least in the short run. Ina more general setting, a number of other factors would need to betaken into account.
Notably, when new workers and managers can join the firm,we expect high powered managerial incentives to attract moreable managers and COO to the firm [Lazear 2005]. In addition, ifthe COO can hire from a larger pool of workers, he might want toattract more productive workers when he is paid a performancebonus. To the extent that more productive workers have a higheroutside option, however, the COO might need to increase workers’pay to attract them.
Overall, when the pool of managers and the pool of individ-uals available for employment is not fixed, the introduction ofhigh powered managerial incentives might attract more produc-tive workers and managers to the firm, thus reinforcing theproductivity enhancing effect we find here. However, this mightcome at the cost of a higher wage bill.
Second, in our setting workers operate independently of oneanother, and the manager can target their effort to individualworkers. While this is true in many other settings, such as forsalespeople, it is not the case in all settings. When workers
769INCENTIVES FOR MANAGERS AND INEQUALITY AMONG WORKERS
operate in teams or, more generally, when managerial efforttargeted to one worker has spillovers on others, the incentives formanagers to target workers would differ, as would the effect oftargeting on both the average and dispersion of productivity.
While our experimental research design is tailored to providecredible evidence on the effects of managerial incentives in thisparticular context, our results have broad implications for under-standing behavior within firms more generally.25
Our findings shed some light on why firms provide perfor-mance related pay to managers in the first place. While suchincentive schemes are obviously designed to increase unobserv-able managerial effort, our results also suggest another moresubtle reason for their use. This stems from the general observa-tion that firms are typically constrained to offer bottom-tier work-ers the same compensation scheme. This may be because of legal,technological, or informational constraints [Lazear 1989; Enci-nosa et al. 1997; Bewley 1999; Fehr et al. 2004].
To the extent that bottom-tier workers are of heterogeneousability, however, offering the same compensation scheme to all ofthem will, in general, not be optimal for the firm. When manag-ers’ pay is linked to firm’s performance, their interests becomemore aligned with those of the firm, and they have greater incen-tives to target their effort to specific workers in order to offset theinefficiency that arises because of the common compensationscheme. From the worker’s point of view, it is then as if they facean individual specific incentive scheme.
This opens a broad empirical research agenda to examinewhether firms are indeed more likely to offer managers perfor-
25. The analysis also has wider implications for environments outside of theworkplace. For example, the provision of teacher incentives based on the averageperformance of students may have important consequences for the distribution oftest scores among students, and the composition of students, and possibly teach-ers admitted into schools. Existing evidence indicates that school accountabilityprograms, whereby schools are rewarded or sanctioned based on average testscores or on the pass rate, generate both selection and targeting effects, as weakerstudents are prevented to sit the test and teachers target resources to the mar-ginal students at the expense of the others. For instance, Burgess et al. [2005] findthat the introduction of school accountability based on test pass rates improvedthe performance of students in the middle of the ability distribution, at theexpense of both high achieving and low achieving students. Similarly, Hanushekand Raymond [2004] and Reback [2006] provide evidence on the distributionalconsequences on student achievement under the No Child Left Behind policy.Finally, Jacob [2002] and Figlio and Getzer [2002] provide evidence on the selec-tion effect. They show that the introduction of accountability schemes lead to anincrease in grade retention and special educational placement in Chicago andFlorida public schools, respectively.
770 QUARTERLY JOURNAL OF ECONOMICS
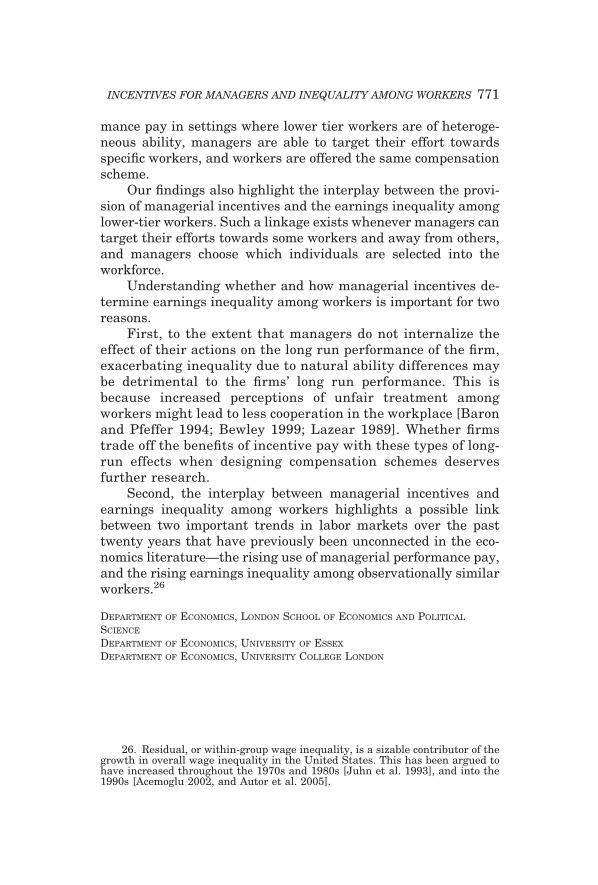
mance pay in settings where lower tier workers are of heteroge-neous ability, managers are able to target their effort towardsspecific workers, and workers are offered the same compensationscheme.
Our findings also highlight the interplay between the provi-sion of managerial incentives and the earnings inequality amonglower-tier workers. Such a linkage exists whenever managers cantarget their efforts towards some workers and away from others,and managers choose which individuals are selected into theworkforce.
Understanding whether and how managerial incentives de-termine earnings inequality among workers is important for tworeasons.
First, to the extent that managers do not internalize theeffect of their actions on the long run performance of the firm,exacerbating inequality due to natural ability differences maybe detrimental to the firms’ long run performance. This isbecause increased perceptions of unfair treatment amongworkers might lead to less cooperation in the workplace [Baronand Pfeffer 1994; Bewley 1999; Lazear 1989]. Whether firmstrade off the benefits of incentive pay with these types of long-run effects when designing compensation schemes deservesfurther research.
Second, the interplay between managerial incentives andearnings inequality among workers highlights a possible linkbetween two important trends in labor markets over the pasttwenty years that have previously been unconnected in the eco-nomics literature—the rising use of managerial performance pay,and the rising earnings inequality among observationally similarworkers.26
DEPARTMENT OF ECONOMICS, LONDON SCHOOL OF ECONOMICS AND POLITICAL
SCIENCE
DEPARTMENT OF ECONOMICS, UNIVERSITY OF ESSEX
DEPARTMENT OF ECONOMICS, UNIVERSITY COLLEGE LONDON
26. Residual, or within-group wage inequality, is a sizable contributor of thegrowth in overall wage inequality in the United States. This has been argued tohave increased throughout the 1970s and 1980s [Juhn et al. 1993], and into the1990s [Acemoglu 2002, and Autor et al. 2005].
771INCENTIVES FOR MANAGERS AND INEQUALITY AMONG WORKERS
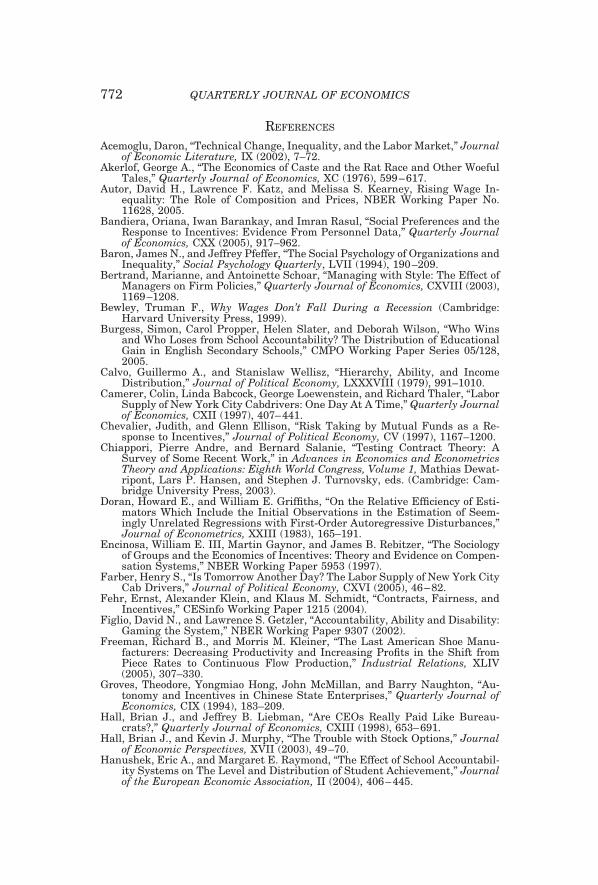
REFERENCES
Acemoglu, Daron, “Technical Change, Inequality, and the Labor Market,” Journalof Economic Literature, IX (2002), 7–72.
Akerlof, George A., “The Economics of Caste and the Rat Race and Other WoefulTales,” Quarterly Journal of Economics, XC (1976), 599–617.
Autor, David H., Lawrence F. Katz, and Melissa S. Kearney, Rising Wage In-equality: The Role of Composition and Prices, NBER Working Paper No.11628, 2005.
Bandiera, Oriana, Iwan Barankay, and Imran Rasul, “Social Preferences and theResponse to Incentives: Evidence From Personnel Data,” Quarterly Journalof Economics, CXX (2005), 917–962.
Baron, James N., and Jeffrey Pfeffer, “The Social Psychology of Organizations andInequality,” Social Psychology Quarterly, LVII (1994), 190–209.
Bertrand, Marianne, and Antoinette Schoar, “Managing with Style: The Effect ofManagers on Firm Policies,” Quarterly Journal of Economics, CXVIII (2003),1169–1208.
Bewley, Truman F., Why Wages Don’t Fall During a Recession (Cambridge:Harvard University Press, 1999).
Burgess, Simon, Carol Propper, Helen Slater, and Deborah Wilson, “Who Winsand Who Loses from School Accountability? The Distribution of EducationalGain in English Secondary Schools,” CMPO Working Paper Series 05/128,2005.
Calvo, Guillermo A., and Stanislaw Wellisz, “Hierarchy, Ability, and IncomeDistribution,” Journal of Political Economy, LXXXVIII (1979), 991–1010.
Camerer, Colin, Linda Babcock, George Loewenstein, and Richard Thaler, “LaborSupply of New York City Cabdrivers: One Day At A Time,” Quarterly Journalof Economics, CXII (1997), 407–441.
Chevalier, Judith, and Glenn Ellison, “Risk Taking by Mutual Funds as a Re-sponse to Incentives,” Journal of Political Economy, CV (1997), 1167–1200.
Chiappori, Pierre Andre, and Bernard Salanie, “Testing Contract Theory: ASurvey of Some Recent Work,” in Advances in Economics and EconometricsTheory and Applications: Eighth World Congress, Volume 1, Mathias Dewat-ripont, Lars P. Hansen, and Stephen J. Turnovsky, eds. (Cambridge: Cam-bridge University Press, 2003).
Doran, Howard E., and William E. Griffiths, “On the Relative Efficiency of Esti-mators Which Include the Initial Observations in the Estimation of Seem-ingly Unrelated Regressions with First-Order Autoregressive Disturbances,”Journal of Econometrics, XXIII (1983), 165–191.
Encinosa, William E. III, Martin Gaynor, and James B. Rebitzer, “The Sociologyof Groups and the Economics of Incentives: Theory and Evidence on Compen-sation Systems,” NBER Working Paper 5953 (1997).
Farber, Henry S., “Is Tomorrow Another Day? The Labor Supply of New York CityCab Drivers,” Journal of Political Economy, CXVI (2005), 46–82.
Fehr, Ernst, Alexander Klein, and Klaus M. Schmidt, “Contracts, Fairness, andIncentives,” CESinfo Working Paper 1215 (2004).
Figlio, David N., and Lawrence S. Getzler, “Accountability, Ability and Disability:Gaming the System,” NBER Working Paper 9307 (2002).
Freeman, Richard B., and Morris M. Kleiner, “The Last American Shoe Manu-facturers: Decreasing Productivity and Increasing Profits in the Shift fromPiece Rates to Continuous Flow Production,” Industrial Relations, XLIV(2005), 307–330.
Groves, Theodore, Yongmiao Hong, John McMillan, and Barry Naughton, “Au-tonomy and Incentives in Chinese State Enterprises,” Quarterly Journal ofEconomics, CIX (1994), 183–209.
Hall, Brian J., and Jeffrey B. Liebman, “Are CEOs Really Paid Like Bureau-crats?,” Quarterly Journal of Economics, CXIII (1998), 653–691.
Hall, Brian J., and Kevin J. Murphy, “The Trouble with Stock Options,” Journalof Economic Perspectives, XVII (2003), 49–70.
Hanushek, Eric A., and Margaret E. Raymond, “The Effect of School Accountabil-ity Systems on The Level and Distribution of Student Achievement,” Journalof the European Economic Association, II (2004), 406–445.
772 QUARTERLY JOURNAL OF ECONOMICS
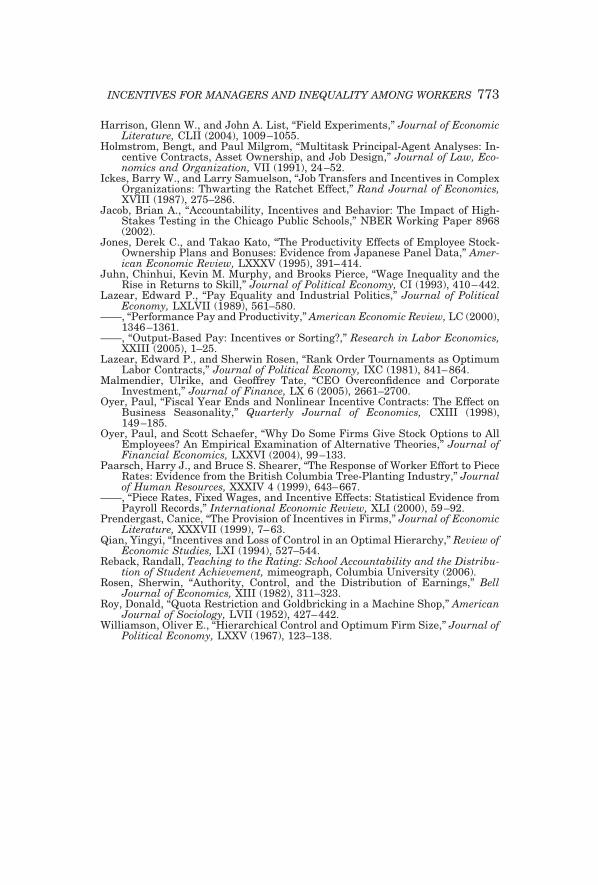
Harrison, Glenn W., and John A. List, “Field Experiments,” Journal of EconomicLiterature, CLII (2004), 1009–1055.
Holmstrom, Bengt, and Paul Milgrom, “Multitask Principal-Agent Analyses: In-centive Contracts, Asset Ownership, and Job Design,” Journal of Law, Eco-nomics and Organization, VII (1991), 24–52.
Ickes, Barry W., and Larry Samuelson, “Job Transfers and Incentives in ComplexOrganizations: Thwarting the Ratchet Effect,” Rand Journal of Economics,XVIII (1987), 275–286.
Jacob, Brian A., “Accountability, Incentives and Behavior: The Impact of High-Stakes Testing in the Chicago Public Schools,” NBER Working Paper 8968(2002).
Jones, Derek C., and Takao Kato, “The Productivity Effects of Employee Stock-Ownership Plans and Bonuses: Evidence from Japanese Panel Data,” Amer-ican Economic Review, LXXXV (1995), 391–414.
Juhn, Chinhui, Kevin M. Murphy, and Brooks Pierce, “Wage Inequality and theRise in Returns to Skill,” Journal of Political Economy, CI (1993), 410–442.
Lazear, Edward P., “Pay Equality and Industrial Politics,” Journal of PoliticalEconomy, LXLVII (1989), 561–580.
——, “Performance Pay and Productivity,” American Economic Review, LC (2000),1346–1361.
——, “Output-Based Pay: Incentives or Sorting?,” Research in Labor Economics,XXIII (2005), 1–25.
Lazear, Edward P., and Sherwin Rosen, “Rank Order Tournaments as OptimumLabor Contracts,” Journal of Political Economy, IXC (1981), 841–864.
Malmendier, Ulrike, and Geoffrey Tate, “CEO Overconfidence and CorporateInvestment,” Journal of Finance, LX 6 (2005), 2661–2700.
Oyer, Paul, “Fiscal Year Ends and Nonlinear Incentive Contracts: The Effect onBusiness Seasonality,” Quarterly Journal of Economics, CXIII (1998),149–185.
Oyer, Paul, and Scott Schaefer, “Why Do Some Firms Give Stock Options to AllEmployees? An Empirical Examination of Alternative Theories,” Journal ofFinancial Economics, LXXVI (2004), 99–133.
Paarsch, Harry J., and Bruce S. Shearer, “The Response of Worker Effort to PieceRates: Evidence from the British Columbia Tree-Planting Industry,” Journalof Human Resources, XXXIV 4 (1999), 643–667.
——, “Piece Rates, Fixed Wages, and Incentive Effects: Statistical Evidence fromPayroll Records,” International Economic Review, XLI (2000), 59–92.
Prendergast, Canice, “The Provision of Incentives in Firms,” Journal of EconomicLiterature, XXXVII (1999), 7–63.
Qian, Yingyi, “Incentives and Loss of Control in an Optimal Hierarchy,” Review ofEconomic Studies, LXI (1994), 527–544.
Reback, Randall, Teaching to the Rating: School Accountability and the Distribu-tion of Student Achievement, mimeograph, Columbia University (2006).
Rosen, Sherwin, “Authority, Control, and the Distribution of Earnings,” BellJournal of Economics, XIII (1982), 311–323.
Roy, Donald, “Quota Restriction and Goldbricking in a Machine Shop,” AmericanJournal of Sociology, LVII (1952), 427–442.
Williamson, Oliver E., “Hierarchical Control and Optimum Firm Size,” Journal ofPolitical Economy, LXXV (1967), 123–138.
773INCENTIVES FOR MANAGERS AND INEQUALITY AMONG WORKERS