
In Vivo Topoisomerase I Inhibition Attenuates the ... · INTRODUCTION Understanding the molecular...
12
INTRODUCTION Understanding the molecular mecha- nisms of anticancer agents is crucial for personalized treatment and for develop- ing more rational drug combinations. However, most mechanistic studies of anticancer agents have been carried out in vitro with isolated tumor cells under conditions that may neither be represen- tative of the tumor environment nor of the actual drug exposure. For example, homogeneous cancer cell lines ignore the clonal heterogeneity of tumors. The in- teraction of tumor cells with the mi- croenvironment is also absent in cell cul- ture, which precludes a complete analysis of the impact of chemotherapeu- tic agents such as the influence on tumor angiogenesis. Hypoxia is rarely consid- ered in vitro, nor are the drug-exposure conditions, which usually are much more dynamic in vivo than in vitro. Considering these caveats, the current study aims to characterize the in vivo tumor response to an anticancer agent by using xenografts of patient-derived tu- mors. Although orthotropic xenografts models are considered mandatory to evaluate invasion and metastasis in re- sponse to therapy, they are challenging to establish, especially from patient-de- rived tumors. Subcutaneous xenografts of human tumors offer a valuable model to study the mechanisms underlying the effect of experimental therapies in an in vivo context without the bias of using cell lines selected by in vitro culture. In a pre- vious study (1), we showed that xenografting of human tumors alters nei- ther the genetic nor the histological pro- MOL MED 18:83-94, 2012 | GUÉRIN ET AL. | 83 In Vivo Topoisomerase I Inhibition Attenuates the Expression of Hypoxia-Inducible Factor 1α Target Genes and Decreases Tumor Angiogenesis Eric Guérin, 1,2 Wolfgang Raffelsberger, 3 Erwan Pencreach, 1,2 Armin Maier, 4 Agnès Neuville, 5 Anne Schneider, 1,2 Philippe Bachellier, 6 Serge Rohr, 7 Amélie Petitprez, 8,9,10 Olivier Poch, 3 Dino Moras, 3 Pierre Oudet, 2 Annette K Larsen, 8,9,10 Marie-Pierre Gaub, 1,2 and Dominique Guenot 1 1 EA 4438 Physiopathologie et Médecine Translationnelle, Université de Strasbourg (UdS), Strasbourg, France; 2 Laboratoire de Biochimie et Biologie Moléculaire, Hôpitaux Universitaires de Strasbourg, Hôpital de Hautepierre, Strasbourg, France; 3 Département de Bioinformatique Intégrative et Génomique, Institut de Génétique et de Biologie Moléculaire et Cellulaire, Illkirch, France; 4 Oncotest, Freiburg, Germany; 5 Département de Pathologie, Hôpitaux Universitaires de Strasbourg, Hôpital de Hautepierre, Strasbourg, France; 6 Service de Chirurgie Générale, Hépatique et Endocrinienne, Hôpitaux Universitaires de Strasbourg, Hôpital de Hautepierre, Strasbourg, France; 7 Service de Chirurgie Générale et Digestive, Hôpitaux Universitaires de Strasbourg, Hôpital de Hautepierre, Strasbourg, France; 8 Laboratory of Cancer Biology and Therapeutics, Centre de Recherche Saint-Antoine, Paris, France; 9 Institut National de la Santé et de la Recherche Médicale U938, Paris, France; and 10 Université Pierre et Marie Curie (Université Paris 6), Paris, France Topoisomerase I is a privileged target for widely used anticancer agents such as irinotecan. Although these drugs are classically considered to be DNA-damaging agents, increasing evidence suggests that they might also influence the tumor environment. This study evaluates in vivo cellular and molecular modifications induced by irinotecan, a topoisomerase I–directed agent, in patient- derived colon tumors subcutaneously implanted in athymic nude mice. Irinotecan was given intraperitoneally at 40 mg/kg five times every 5 d, and expression profiles were evaluated at d 25 in tumors from treated and untreated animals. Unexpectedly, the in vivo antitumor activity of irinotecan was closely linked to a downregulation of hypoxia-inducible factor-1α (HIF1A) target genes along with an inhibition of HIF1A protein accumulation. The consequence was a decrease in tumor angiogenesis leading to tumor size stabilization. These results highlight the molecular basis for the antitumor activity of a widely used anticancer agent, and the method used opens the way for mechanistic studies of the in vivo activity of other anticancer therapies. Online address: http://www.molmed.org doi: 10.2119/molmed.2011.00120 Address correspondence to Dominique Guenot, EA 4438, 3 Avenue Molière, 67098 Stras- bourg Cedex, France. Phone: 33-388-27-53-62; Fax: 33-388-26-35-38; E-mail; [email protected]. Submitted March 31, 2011; Accepted for publication October 10, 2011; Epub (www.molmed.org) ahead of print October 19, 2011.
Transcript of In Vivo Topoisomerase I Inhibition Attenuates the ... · INTRODUCTION Understanding the molecular...

INTRODUCTIONUnderstanding the molecular mecha-
nisms of anticancer agents is crucial forpersonalized treatment and for develop-ing more rational drug combinations.However, most mechanistic studies ofanticancer agents have been carried outin vitro with isolated tumor cells underconditions that may neither be represen-tative of the tumor environment nor of
the actual drug exposure. For example,homogeneous cancer cell lines ignore theclonal heterogeneity of tumors. The in-teraction of tumor cells with the mi-croenvironment is also absent in cell cul-ture, which precludes a completeanalysis of the impact of chemotherapeu-tic agents such as the influence on tumorangiogenesis. Hypoxia is rarely consid-ered in vitro, nor are the drug-exposure
conditions, which usually are much moredynamic in vivo than in vitro.
Considering these caveats, the currentstudy aims to characterize the in vivotumor response to an anticancer agent byusing xenografts of patient-derived tu-mors. Although orthotropic xenograftsmodels are considered mandatory toevaluate invasion and metastasis in re-sponse to therapy, they are challengingto establish, especially from patient-de-rived tumors. Subcutaneous xenograftsof human tumors offer a valuable modelto study the mechanisms underlying theeffect of experimental therapies in an invivo context without the bias of using celllines selected by in vitro culture. In a pre-vious study (1), we showed thatxenografting of human tumors alters nei-ther the genetic nor the histological pro-
M O L M E D 1 8 : 8 3 - 9 4 , 2 0 1 2 | G U É R I N E T A L . | 8 3
In Vivo Topoisomerase I Inhibition Attenuates the Expressionof Hypoxia-Inducible Factor 1α Target Genes and DecreasesTumor Angiogenesis
Eric Guérin,1,2 Wolfgang Raffelsberger,3 Erwan Pencreach,1,2 Armin Maier,4 Agnès Neuville,5
Anne Schneider,1,2 Philippe Bachellier,6 Serge Rohr,7 Amélie Petitprez,8,9,10 Olivier Poch,3 Dino Moras,3
Pierre Oudet,2 Annette K Larsen,8,9,10 Marie-Pierre Gaub,1,2 and Dominique Guenot1
1EA 4438 Physiopathologie et Médecine Translationnelle, Université de Strasbourg (UdS), Strasbourg, France; 2Laboratoire deBiochimie et Biologie Moléculaire, Hôpitaux Universitaires de Strasbourg, Hôpital de Hautepierre, Strasbourg, France; 3Départementde Bioinformatique Intégrative et Génomique, Institut de Génétique et de Biologie Moléculaire et Cellulaire, Illkirch, France;4Oncotest, Freiburg, Germany; 5Département de Pathologie, Hôpitaux Universitaires de Strasbourg, Hôpital de Hautepierre,Strasbourg, France; 6Service de Chirurgie Générale, Hépatique et Endocrinienne, Hôpitaux Universitaires de Strasbourg, Hôpital deHautepierre, Strasbourg, France; 7Service de Chirurgie Générale et Digestive, Hôpitaux Universitaires de Strasbourg, Hôpital deHautepierre, Strasbourg, France; 8Laboratory of Cancer Biology and Therapeutics, Centre de Recherche Saint-Antoine, Paris, France;9Institut National de la Santé et de la Recherche Médicale U938, Paris, France; and 10Université Pierre et Marie Curie (Université Paris6), Paris, France
Topoisomerase I is a privileged target for widely used anticancer agents such as irinotecan. Although these drugs are classicallyconsidered to be DNA-damaging agents, increasing evidence suggests that they might also influence the tumor environment. Thisstudy evaluates in vivo cellular and molecular modifications induced by irinotecan, a topoisomerase I–directed agent, in patient-derived colon tumors subcutaneously implanted in athymic nude mice. Irinotecan was given intraperitoneally at 40 mg/kg fivetimes every 5 d, and expression profiles were evaluated at d 25 in tumors from treated and untreated animals. Unexpectedly, thein vivo antitumor activity of irinotecan was closely linked to a downregulation of hypoxia-inducible factor-1α (HIF1A) target genesalong with an inhibition of HIF1A protein accumulation. The consequence was a decrease in tumor angiogenesis leading to tumorsize stabilization. These results highlight the molecular basis for the antitumor activity of a widely used anticancer agent, and themethod used opens the way for mechanistic studies of the in vivo activity of other anticancer therapies.Online address: http://www.molmed.orgdoi: 10.2119/molmed.2011.00120
Address correspondence to Dominique Guenot, EA 4438, 3 Avenue Molière, 67098 Stras-
bourg Cedex, France. Phone: 33-388-27-53-62; Fax: 33-388-26-35-38; E-mail;
Submitted March 31, 2011; Accepted for publication October 10, 2011; Epub
(www.molmed.org) ahead of print October 19, 2011.

files of the original tumors, even aftermultiple passages, suggesting that clonalselection does not occur in nude mice.Interestingly, as normal cells of humanorigin do not survive in the xenograft,the tumor compartment is exclusively ofhuman origin, whereas the stromal com-partment is principally composed ofmurine cells, thereby providing a meanto discriminate between the two cellpopulations.
As a model, we have chosen to studythe influence of irinotecan in patient- derived colon cancers. Irinotecan is atopoisomerase I inhibitor widely used forthe treatment of colorectal cancer in bothfirst- and second-line treatments (2–6).Clinically used topoisomerase I inhibitorstarget a covalent DNA–topoisomerase Ireaction intermediary (called cleavablecomplexes), thereby preventing the rean-nealing of the nicked DNA (7). Thecleavable complexes are believed to se-lectively induce S-phase cytotoxicitywhen they collide with advancing repli-cation forks (8). If not repaired, the DNAlesions can induce cell-cycle arrestand/or apoptosis, depending on the cel-lular levels of cleavable complexes andthe genetic context of the cells (9,10). Al-though this process has been clearly de-scribed, the subsequent mechanisms un-derlying the in vivo antitumor effects ofirinotecan are less clear.
We define here the molecular signatureelicited by irinotecan in human cancercells as well as in the correspondingmurine stromal cells. To the best of ourknowledge, this is the first cancer studyto apply transcriptome-based masks (11)to distinguish between transcriptomes ofhuman and murine origin. By testinghuman colon cancer xenografts onhuman and mouse oligonucleotide mi-croarrays, we were able to identify an invivo mode of action for irinotecan involv-ing the inhibition of hypoxia-induciblefactor-1α (HIF1A) protein expressionwith a subsequent reduction in the ex-pression levels of HIF1A target genes andinhibition of tumor angiogenesis. Theseresults illustrate how particular cytotoxicantitumor drugs such as topoisomerase I
inhibitors can affect in vivo tumor angio-genesis and how the method used canopen the way for mechanistic studies ofthe in vivo activity of anticancer agents.
MATERIALS AND METHODS
Human Tumor Xenografts andTreatment with Irinotecan
Male athymic nude mice (nu/nu), 6–8wks old (Charles River, L’Arbresle,France), were maintained under specificpathogen-free conditions. Human tumortissue fragments were obtained aftergaining informed consent from patientsundergoing colectomy and/or synchro-nous liver metastasis resection. Cancertissues were minced on ice and injectedsubcutaneously into the right and leftflanks of nude mice as previously de-scribed (1). Xenografts were furtherpropagated by serial transplantation. Fortreatment, mice were observed daily fortumor appearance, and irinotecan treat-ment was initiated when the tumorsreached a mean volume of 150–300 mm3.Irinotecan (Campto®, irinotecan chlorhy-drate) was given intraperitoneally at40 mg/kg five times every 5 d (q5dx5).Each group consisted of four to fivetumor-bearing mice, corresponding toeight to ten individual tumors. Tumorvolume (V) was evaluated once weeklyand was calculated as V = (a2 × b)/2,where a is the width of the tumor in mil-limeters and b is the length. The individ-ual relative tumor volume (RTV) was de-fined as Vx/V0, where Vx is the volumein mm3 at a given time and V0 is the vol-ume at the start of treatment. Mean RTVand standard error of the mean (SEM)were calculated for each group. Drug efficacy at the end of treatment (d 25)was expressed as the percentage oftumor growth inhibition, which was cal-culated using the formula 100 – (meanRTVtreated/mean RTVcontrol) × 100. For theanalyses, control samples (C) correspondto xenografts of untreated animals,treated samples (T) correspond to xeno -grafts from mice treated with 40 mg/kgirinotecan q5dx5 and collected at the endof treatment period, and regrowth sam-
ples (R) correspond to xenografts thathave started to grow again after the endof the treatment period.
Tumor Clonogenic Assay UsingHuman Tumor Xenografts
Freshly xenografted tumors wereplaced in Liforlab® solution (OncoscienceAG, Wedel, Germany) until preparationof single-cell suspensions for the clono-genic assay. Tumor clonogenic assay wasperformed as previously described (12).Half-maximal inhibitory concentration(IC50) values were determined using con-centrations of SN-38 (Abatra, Xi’an,China), the active metabolite of irinote-can, ranging from 0.001 to 20 μg/mL.
RNA Isolation from Human TumorXenografts and Gene ExpressionProfiling
Xenografted tumors were snap frozenin liquid nitrogen immediately after re-section and stored at –80°C. Total RNAwas prepared using Trizol (Invitrogen,Cergy Pontoise, France) according to themanufacturer’s instructions. RNA wasfurther purified using spin columnsfrom the RNeasy Mini Kit (Qiagen,Courtaboeuf, France). RNA integrity wasanalyzed on the Agilent 2100 bioana-lyzer. Samples were transcribed in vitro,biotinylated and hybridized to bothAffymetrix Human Genome U133 Plus2.0 GeneChip® arrays and Mouse Ge-nome 430 2.0 GeneChip arrays(Affymetrix, Santa Clara, CA, USA).
Transcriptome Data AnalysisAn initial quality control of the raw
data from the Affymetrix microarray wasperformed using RReportGenerator (13),and all arrays fulfilled our quality crite-ria. Raw data from the Affymetrix ex-pression results were analyzed using amethod described by Naef and Huelsken(11) to distinguish mouse and humanspecific probes within each probe set.Briefly, for transcriptional data analysisof the human tumor component, theprobe masks defined by Naef andHuelsken (11), which allow for the re-moval of individual probes from the
8 4 | G U É R I N E T A L . | M O L M E D 1 8 : 8 3 - 9 4 , 2 0 1 2
I R I N O T E C A N I N H I B I T S H I F 1 A A C C U M U L A T I O N I N V I V O

U133 Plus 2.0 GeneChip array that maycross-hybridize with mouse mRNA,were applied to the dataset. Settings thatallowed a maximum of three mismatcheswere selected, in agreement with Naefand Huelsken (11), and 16.9% of the indi-vidual probes were masked. This choicerepresents a good compromise betweenspecificity and sensitivity (only 6.3% ofthe probe sets were discarded because ofthe lack of sufficient remaining probes),since more stringent conditions, withfewer mismatches tolerated, would sig-nificantly reduce the final number of ex-ploitable probe sets.
The newly defined probe sets werethen summarized with Robust Multi-array Average (RMA) (14,15), using im-plementation in Bioconductor (16) underR (www.r-project.org). The summarizedand normalized data were then filtered toremove all probe sets that were not ex-pressed in all samples tested (that is,probe sets with log2 expression values of<4.9 for all arrays). Statistical testing wasperformed based on a two-factor modelthat allows for separation of (a) tumorspecimen origin (that is, patient) and (b)sample treatment type (that is, control,irinotecan-treated or regrowth sampletype). The corresponding analysis of vari-ance P values for both factors and foreach probe set were then transformedinto local fdr (false discovery rate) values(17,18) and were compared against eachother. A total of 130 human probe sets,which fulfilled the criteria of fdr-treat-ment type <0.02 and fdr- treatment type<10,000 × fdr–tumor-specimen origin,were retained for further analysis. The re-tained probe sets were analyzed for en-richment of Gene Ontology (GO) ontologies using DAVID (Database forAnnotation, Visualization, and IntegratedDiscovery) (19) and for enrichment ofpathway interaction maps using the Inge-nuity Pathway Analysis tool (www.inge-nuity.com, data not shown). In addition,hierarchical clustering was used to fur-ther organize the resulting list of 130probe sets. Approximate unbiased boot-strap P values were obtained using the Rpackage “pvclust” (20).
To further select human genes to bevalidated by real-time quantitative re-verse transcriptase–polymerase chain re-action (RT-PCR), values for the meanfold-change were calculated using un-treated control xenografts as a reference.A 2.0-fold difference was used as a cutoffvalue. The significance of the changes ingene expression levels was assessed bytwo-sided Wilcoxon signed-rank tests.
Real-Time Relative Quantitative RT-PCR
mRNA expression of selected humangenes was evaluated by real-time relativequantitative RT-PCR using the LightCy-cler® 480 System (Roche Applied Science,Meylan, France) and SYBR Green I tech-nology. Reverse transcription of 2 μgRNA was performed using AMV reversetranscriptase (Finnzymes, Ozyme, SaintQuentin, France) and oligo(dT) primers.Validated QuantiTect® Primer Assays(Qiagen, Courtaboeuf, France) were usedfor amplification as previously described(21). All quantifications were performedin duplicate and normalized to two inde-pendent endogenous reference genes, hy-droxymethylbilane synthase (HMBS) andkeratin 19 (KRT19). Target cDNA expres-sion was quantified using the compara-tive Ct method and expressed as thefold-change versus control untreatedsamples. Two-sided Wilcoxon signedrank tests were used to assess the signifi-cance of the fold-change values inirinotecan-treated samples.
Histology and ImmunohistochemistryResected xenografts were fixed in for-
malin, embedded in paraffin andprocessed for histology by hematoxylinand eosin (H&E) and Masson trichromestains. For Masson trichrome, sectionswere sequentially stained with Weigertiron hematoxylin and Biebrich Scarletacid fuchsin solutions. After treatmentwith phosphotungstic and phospho-molybdic acids, collagen was stained inblue with aniline blue. Ki-67 immunohis-tochemical staining (rabbit anti-humanKi-67 monoclonal antibody, clone SP6,dilution 1:200; Microm Microtech,
Francheville, France) was performedusing the Ventana automated system(Benchmark®, Ventana Medical Systems,Illkirch, France). For anti-CD31(anti–platelet endothelial cell adhesionmolecule [PECAM-1]) immunohistochem-istry, frozen sections were incubated withfluorescein isothiocyanate (FITC)- conjugated rat anti-mouse CD31 mono-clonal antibody (BD Biosciences, LePont-De-Claix, France) and then withhorseradish peroxidase–conjugated anti-fluorescein Fab fragments (Roche Molec-ular Biochemicals, Meylan, France) aspreviously described (22). Immunostain-ing was developed with the liquid DABsubstrate kit (Roche Molecular Biochemi-cals, Meylan, France), and the tissue sec-tions were counterstained with hema-toxylin. Ki-67–positive cells werequantified in clusters of tumor cells bycalculating the ratio of Ki-67–positivecells over total cells in four distinct areasof 0.2 mm2 each, at 400× magnification.
Detection of Tissue Hypoxia byImmunostaining for PimonidazoleAdducts
Pimonidazole (Hypoxyprobe-1™ PlusKit; Chemicon Upstate, Millipore, Mol-sheim, France) was administered intra -peritoneally at a dose of 100 mg/kg inphosphate-buffered saline for 60 min be-fore euthanizing the mice. Resectedxenografts were fixed in formalin, em-bedded in paraffin and then processedfor immunochemistry using the FITC-conjugated hypoxyprobe-1 monoclonalantibody and the horseradish peroxidase–conjugated anti-FITC second-ary monoclonal antibody from the Hypoxyprobe-1 Plus Kit following themanufacturer’s instructions.
ImmunoblottingTumor tissues were crushed on ice in
lysis buffer (10 mmol/L Tris, 5 mmol/LMgCl2, 10 mmol/L NaCl, 0.5% NP-40,protease and phosphatase inhibitors)and briefly sonicated. Aliquots (20 μg) oftotal protein were resolved on 10%sodium dodecyl sulfate–polyacrylamidegel electrophoresis gels, transferred onto
R E S E A R C H A R T I C L E
M O L M E D 1 8 : 8 3 - 9 4 , 2 0 1 2 | G U É R I N E T A L . | 8 5

a nitrocellulose membrane and incu-bated with primary antibodies: mouseanti–human-HIF-1α monoclonal anti-body (BD Biosciences, Le Pont-De-Claix,France) that does not cross-react withmouse HIF-1α protein and rabbit poly-clonal anti-α/β-tubulin (Cell Signaling,Ozyme, Saint Quentin, France). Proteinexpression was detected using horserad-ish peroxidase–conjugated goat anti-mouse or anti-rabbit secondary antibod-ies with enhanced chemiluminescencereagents (Amersham, GE Healthcare,Saclay, France).
RESULTS
Comparison of the In Vitro and In VivoEfficacy of Irinotecan
Patient-derived colon tumors and theircorresponding liver metastases (Table 1)were used for xenografting to identify amolecular signature associated with theresponse to irinotecan. First, the in vitrosensitivity to SN-38 (the active metabo-lite of irinotecan) was determined byclonogenic assays with cells directly dis-sociated from the tumor xenografts. Thetumors showed a wide range of sensitivi-ties with three resistant tumors (xeno -grafts 17, 22 and 36M1) having IC50 val-ues (dose inhibiting 50% tumor cellgrowth compared with untreated con-trols) between 17.0 and 25.2 μg/mL and
four sensitive tumors with IC50 valuesbetween 0.001 and 0.06 μg/mL (Table 2).Next, the in vivo response of the samexenografts was evaluated after irinotecanadministration (40 mg/kg intraperi-toneally q5dx5). At this dose, irinotecaninhibited tumor growth or inducedtumor shrinkage in all xenografts (Fig-
ure 1 for two representative examples),including the three xenografts showing invitro resistance, suggesting that irinotecanmay exert additional effects in vivo thatare not detectable under in vitro condi-tions. This observation prompted us tostudy the in vivo impact of irinotecan atthe transcriptome level, with the aim of
8 6 | G U É R I N E T A L . | M O L M E D 1 8 : 8 3 - 9 4 , 2 0 1 2
I R I N O T E C A N I N H I B I T S H I F 1 A A C C U M U L A T I O N I N V I V O
Table 1. Clinical and pathological data of patient-derived xenografts.
36 T, 36 M1,Xenografts 2 17 21 22 and 36 M3
TNM pT2N0M0 pT3N1M0 pT2N1M0 pT2N2M1 pT3N2M1Stage I III III IV IVTumor localization Right colon Right colon Left colon Right colon Left colonMetastasis localization NA NA NA Liver and lung Synchronous liver
metastasesSex M M F M MAge (years) 72 77 57 63 74Treatment after surgery 0 0 FUFOL FOLFIRI FOLFOXEvolution
NA, nonapplicable.
Table 2. In vitro and in vivo treatment efficacy of SN38 and irinotecan.
In vitroTCA SN38 IC50 In vivo Mean relative TV ± SEM TGI
Xenografts (μg/mL) treatment (d 25 versus d 0) (%) P
2 0.06Control 13.1 ± 3.4 —
0.0095Irinotecan 1.1 ± 0.1 92
17 21.2Control 5.6 ± 0.3 —
0.028Irinotecan 1.3 ± 0.1 77
21 0.001Control 3.8 ± 0.5 —
0.028Irinotecan 1.3 ± 0.1 66
22 25.2Control 6.0 ± 1.9 —
0.028Irinotecan 1.1 ± 0.1 82
36 T 0.008Control 13.7 ± 1.8 —
0.0015Irinotecan 0.20 ± 0.02 98
36 M1 17.0Control 19.2 ± 7.4 —
0.0060Irinotecan 1.4 ± 0.7 93
36 M3 0.035Control 10.6 ± 1.5 —
0.0025Irinotecan 0.4 ± 0.1 96
The efficacy of SN38 in vitro is reported as the IC50 value observed in tumor clonogenicassays (TCAs). For the evaluation of irinotecan efficacy in vivo, xenografted mice wheretreated with irinotecan 40 mg/kg q5dx5. Mean relative tumor volume (TV) ± SEM (n = 8–10tumors) calculated at d 25 versus d 0 are indicated with the corresponding tumor growthinhibition (TGI) value and statistical P value (Mann-Whitney test).
No recurrence. Death from hepato-cellular carcinoma.
No recurrence. Death from cholan -giocarcinoma.
Lung metastasisand lateroaorticadenopathy 2 yearsafter surgery.
Still alive 6 yearsafter surgery
Disease progressionafter 10 months.
Death related tocancer 2 yearsafter surgery.
Disease progressionafter 4 months.
Death related tocancer 2 yearsafter surgery.

deciphering novel cellular and molecularmechanisms that could be responsible forthe in vivo antitumor effects of irinotecan.
Transcriptional Profile of the HumanTumor Component in Irinotecan-Treated Xenografts
For each of the seven xenografts, threesamples were selected for transcriptomeanalysis using Affymetrix Human Ge-nome U133 Plus 2.0 GeneChip arrays. Asillustrated in Figure 1, the three samplescorrespond to control samples (C) fromxenografts of untreated animals, treatedsamples (T) corresponding to xenograftsfrom mice treated with 40 mg/kg q5dx5irinotecan and regrowth samples (R) cor-responding to xenografts that havestarted to grow again after the end of thetreatment period and that were collectedwhen the relative tumor volumes werecomparable with the tumor volumes ofthe C samples. The R control was in-cluded to allow us to identify potentialdrug-modulated genes that were not asso-ciated with the tumor-growth inhibitoryactivity.
Xenografted human tumors contain animportant stromal component of murine
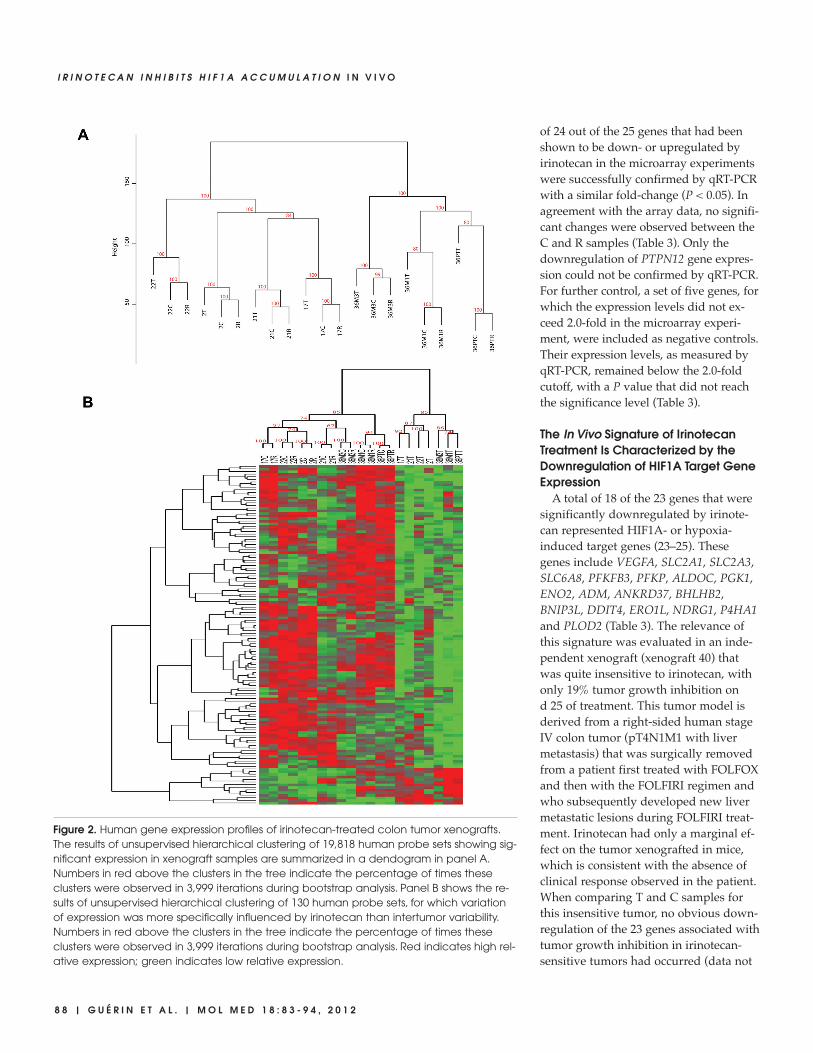
cells. To specifically identify the molecu-lar signature elicited by irinotecan treat-ment in the human cancer cells, raw datafrom Affymetrix expression results wereanalyzed using a species-selective ap-proach that removes measurements fromoligonucleotides that may cross- hybridizewith both human and mouse transcripts(11). After filtering probe sets with mar-ginal expression levels, the remaining19,818 human probe sets were further an-alyzed using unsupervised hierarchicalclustering on the basis of Euclidean dis-tance and complete linkage. Cluster anal-ysis revealed that C, T and R samplesfrom a given xenograft are more similarto each other than the different C, T orR samples are to each other (Figure 2A).This shows that the tumor-specific com-ponent is a major factor directing the out-come of the cluster analysis. Accordingly,all xenografts derived from the same pa-tient clustered together in a separate arm.A second finding was that T sampleswere always separated from the corre-sponding C and R samples, indicatingthat irinotecan treatment elicits a specificsignature that is readily discernible inspite of the tumor heterogeneity.
To evaluate the transcriptional effectsthat were specific to irinotecan, a two-fac-tor model was applied to separate the im-pact of irinotecan treatment from thedominant tumor-specific influence ongene expression. Evaluation of local falsediscovery rate values defined a highlystringent signature of 130 human probesets (list available upon request) with aprofile that was primarily influenced byirinotecan treatment. Subsequent unsu-pervised hierarchical clustering of the 130probe sets (Euclidean distance and com-plete linkage) showed that the profiles ofthe irinotecan-treated xenografts can beclearly separated from their correspon-ding C and R counterparts (Figure 2B).The transcriptome profiles of the T sam-ples revealed most downregulated genes(116 downregulated probe sets out of130). Functional analysis of the identifiedgenes on the basis of gene ontology clas-sification highlighted genes involved inglucose metabolic processes, such as glu-cose transporters or glycolytic enzymes(data not shown). In contrast, the analysisdid not reveal any modulation of genesclassically associated with cell cycle ar-rest, apoptosis or senescence.
Validation of Microarray Data byQuantitative RT-PCR
To focus on the most prominent tran-scriptional changes induced by the invivo irinotecan exposure, 37 probe sets,with a mean fold-change of at least 2.0between T and C samples (P < 0.05),were selected, with 34 downregulatedand 3 upregulated probe sets that corre-sponded to 27 downregulated and 3 up-regulated genes (Table 3). Five of thegenes were poorly documented in the lit-erature and were therefore excludedfrom further analysis. Real-time quantita-tive RT-PCR (qRT-PCR) was used to vali-date the remaining 24 downregulatedand 1 upregulated genes.
The expression levels of these 25 geneswere measured by qRT-PCR in the samexenograft samples as those that wereoriginally used for the microarray experi-ments and were normalized to two differ-ent housekeeping genes (Table 3). A total
R E S E A R C H A R T I C L E
M O L M E D 1 8 : 8 3 - 9 4 , 2 0 1 2 | G U É R I N E T A L . | 8 7
Figure 1. Growth inhibition of human colon tumor xenografts by irinotecan. Subcutaneousxenograft-bearing mice were treated with irinotecan intraperitoneally at 40 mg/kg q5dx5on the days indicated by arrows. Tumor growth was evaluated by plotting the mean rela-tive tumor volume ± SEM (n = 8–10) over time. Two representative examples of xenograftsthat exhibited different levels of in vitro sensitivity to SN-38 (the active metabolite ofirinotecan) are shown (see Table 2). The control (C), treated (T) and regrowth (R) samplesused for transcriptome analysis are indicated in the corresponding curves. Four to fivemice, each bearing two individual tumor xenografts, were included in each group. Resultswere confirmed in two independent experiments.
of 24 out of the 25 genes that had beenshown to be down- or upregulated byirinotecan in the microarray experimentswere successfully confirmed by qRT-PCRwith a similar fold-change (P < 0.05). Inagreement with the array data, no signifi-cant changes were observed between theC and R samples (Table 3). Only thedownregulation of PTPN12 gene expres-sion could not be confirmed by qRT-PCR.For further control, a set of five genes, forwhich the expression levels did not ex-ceed 2.0-fold in the microarray experi-ment, were included as negative controls.Their expression levels, as measured byqRT-PCR, remained below the 2.0-foldcutoff, with a P value that did not reachthe significance level (Table 3).
The In Vivo Signature of IrinotecanTreatment Is Characterized by theDownregulation of HIF1A Target GeneExpression
A total of 18 of the 23 genes that weresignificantly downregulated by irinote-can represented HIF1A- or hypoxia- induced target genes (23–25). Thesegenes include VEGFA, SLC2A1, SLC2A3,SLC6A8, PFKFB3, PFKP, ALDOC, PGK1,ENO2, ADM, ANKRD37, BHLHB2,BNIP3L, DDIT4, ERO1L, NDRG1, P4HA1and PLOD2 (Table 3). The relevance ofthis signature was evaluated in an inde-pendent xenograft (xenograft 40) thatwas quite insensitive to irinotecan, withonly 19% tumor growth inhibition ond 25 of treatment. This tumor model isderived from a right-sided human stageIV colon tumor (pT4N1M1 with livermetastasis) that was surgically removedfrom a patient first treated with FOLFOXand then with the FOLFIRI regimen andwho subsequently developed new livermetastatic lesions during FOLFIRI treat-ment. Irinotecan had only a marginal ef-fect on the tumor xenografted in mice,which is consistent with the absence ofclinical response observed in the patient.When comparing T and C samples forthis insensitive tumor, no obvious down-regulation of the 23 genes associated withtumor growth inhibition in irinotecan-sensitive tumors had occurred (data not
8 8 | G U É R I N E T A L . | M O L M E D 1 8 : 8 3 - 9 4 , 2 0 1 2
I R I N O T E C A N I N H I B I T S H I F 1 A A C C U M U L A T I O N I N V I V O
Figure 2. Human gene expression profiles of irinotecan-treated colon tumor xenografts.The results of unsupervised hierarchical clustering of 19,818 human probe sets showing sig-nificant expression in xenograft samples are summarized in a dendogram in panel A.Numbers in red above the clusters in the tree indicate the percentage of times theseclusters were observed in 3,999 iterations during bootstrap analysis. Panel B shows the re-sults of unsupervised hierarchical clustering of 130 human probe sets, for which variationof expression was more specifically influenced by irinotecan than intertumor variability.Numbers in red above the clusters in the tree indicate the percentage of times theseclusters were observed in 3,999 iterations during bootstrap analysis. Red indicates high rel-ative expression; green indicates low relative expression.

R E S E A R C H A R T I C L E
M O L M E D 1 8 : 8 3 - 9 4 , 2 0 1 2 | G U É R I N E T A L . | 8 9
Tab
le 3
.Hu
ma
n g
en
e e
xpre
ssio
n d
ata
by
Affy
me
trix
mic
roa
rray
an
d q
RT-
PC
R.
Affy
me
trix
mic
roa
rray
qR
T-P
CR
Me
an
M
ea
nM
ea
nM
ea
nfo
ld-
fold
-P
fold
-fo
ld-
Pc
ha
ng
e,
ch
an
ge
,(T
c
ha
ng
e,
ch
an
ge
,(T
G
en
e
T ve
rsus
,R
vers
usve
rsus
Refe
ren
ce
T ve
rsus
R
vers
us
vers
usP
rob
e s
et
IDsy
mb
ol
Ge
ne
na
me
CC
C)
ge
ne
CC
C)
Do
wn
reg
ula
ted
(>
2.0-
fold
)
2273
37_a
t*
AN
KRD
37A
nky
rin re
pe
at
do
ma
in 3
7–4
.81.
20.
018
HM
BS–3
.41.
40.
018
KRT1
9–3
.41.
30.
018
2220
88_s
_at
* SL
C2A
3So
lute
ca
rrie
r fa
mily
2 (
fac
ilita
ted
glu
co
se t
ran
spo
rte
r), m
em
be
r 3–3
.71.
30.
018
HM
BS–2
.81.
20.
043
KRT1
9–2
.81.
20.
043
2028
87_s
_at
* D
DIT
4D
NA
-da
ma
ge
-ind
uc
ible
tra
nsc
ript
4–3
.61.
00.
018
HM
BS–2
.81.
30.
018
KRT1
9–2
.71.
20.
018
2011
69_s
_at
* BH
LHB2
Basic
he
lix-lo
op
-he
lix d
om
ain
co
nta
inin
g, c
lass
B, 2
–3.3
1.2
0.01
8H
MBS
–2.3
1.1
0.01
8 20
1170
_s_a
t–2
.51.
00.
018
KRT1
9–2
.21.
20.
018
2013
13_a
t*
ENO
2En
ola
se 2
(g
am
ma
, ne
uro
na
l)–3
.11.
00.
018
HM
BS–2
.81.
30.
018
KRT1
9–2
.71.
20.
018
2075
43_s
_at
* P4
HA
1Pr
oc
olla
ge
n-p
rolin
e, 2
-oxo
glu
tara
te 4
-dio
xyg
en
ase
(p
rolin
e–2
.91.
00.
018
HM
BS–2
.41.
20.
018
4-hy
dro
xyla
se), α
po
lyp
ep
tide
IKR
T19
–2.3
1.2
0.01
8
2026
20_s
_at
* PL
OD
2Pr
oc
olla
ge
n-ly
sine
, 2-o
xog
luta
rate
5-d
ioxy
ge
na
se 2
–2.8
1.1
0.01
8H
MBS
–2.2
1.1
0.01
8KR
T19
–2.1
1.2
0.01
8
2020
22_a
t*
ALD
OC
Ald
ola
se C
, fru
cto
se-b
isph
osp
ha
te–2
.81.
10.
018
HM
BS–3
.31.
10.
018
KRT1
9–3
.11.
10.
018
2409
91_a
t*
ND
RG
1N
-myc
do
wn
stre
am
reg
ula
ted
ge
ne
1–2
.71.
10.
018
HM
BS–4
.61.
30.
018
2006
32_s
_at
–2.5
1.1
0.01
8KR
T19
–4.4
1.3
0.01
821
1527
_x_a
t*
VEG
FAVa
scu
lar e
nd
oth
elia
l gro
wth
fac
tor A
–2.4
1.3
0.01
8H
MBS
–2.0
1.1
0.01
821
2171
_x_a
t–2
.01.
10.
018
KRT1
9–1
.91.
10.
018
2214
79_s
_at
* BN
IP3L
BCL2
/ad
en
ovi
rus
E1B
19kD
a in
tera
ctin
g p
rote
in 3
-like
–2.4
1.1
0.01
8H
MBS
–1.9
1.4
0.01
822
1478
_at
–2.3
1.1
0.01
8KR
T19
–1.9
1.4
0.01
820
1250
_s_a
t*
SLC
2A1
Solu
te c
arr
ier f
am
ily 2
(fa
cili
tate
d g
luc
ose
tra
nsp
ort
er)
, me
mb
er 1
–2.4
1.1
0.01
8H
MBS
–2.2
1.2
0.01
820
1249
_at
–2.0
1.1
0.01
8KR
T19
–2.1
1.2
0.01
820
2973
_x_a
tFA
M13
A1
Fam
ily w
ith s
eq
ue
nc
e s
imila
rity
13, m
em
be
r A1
–2.4
1.7
0.01
8H
MBS
—N
AN
A21
7047
_s_a
t–2
.21.
60.
018
KRT1
9
2263
90_a
tST
AR
D4
StA
R-r
ela
ted
lip
id t
ran
sfe
r (ST
AR
T) d
om
ain
co
nta
inin
g 4
8–2
.41.
00.
018
HM
BS–2
.41.
20.
018
KRT1
9–2
.31.
20.
027
2022
19_a
t*
SLC
6A8
Solu
te c
arri
er f
am
ily 6
(ne
uro
trans
mitt
er t
rans
po
rter, c
rea
tinin
e),
me
mb
er 8
–2.3
1.1
0.01
8H
MBS
–2.7
1.1
0.02
8KR
T19
–2.7
1.2
0.02
8
2024
64_s
_at
* PF
KFB3
6-Ph
osp
ho
fru
cto
-2-k
ina
se/f
ruc
tose
-2,6
-bip
ho
sph
ata
se 3
–2.3
1.0
0.01
8H
MBS
–2.2
1.1
0.01
8KR
T19
–2.0
1.2
0.01
8
2029
12_a
t*
AD
MA
dre
no
me
du
llin
–2.3
1.3
0.01
8H
MBS
–2.2
1.6
0.01
8KR
T19
–2.2
1.6
0.02
721
8498
_s_a
t*
ERO
1LER
O1-
like
(S.
ce
revi
siae
)–2
.31.
10.
018
HM
BS–2
.21.
40.
018
2226
46_s
_at
–2.1
1.1
0.01
8KR
T19
–2.0
1.3
0.01
8
Con
tinur
ed

9 0 | G U É R I N E T A L . | M O L M E D 1 8 : 8 3 - 9 4 , 2 0 1 2
I R I N O T E C A N I N H I B I T S H I F 1 A A C C U M U L A T I O N I N V I V O
Tab
le 3
.Con
tinue
d.
2135
62_s
_at
SQLE
Squ
ale
ne
ep
oxi
da
se–2
.31.
10.
018
HM
BS–1
.61.
40.
043
KRT1
9–1
.51.
30.
043
2307
10_a
t—
cD
NA
FLJ
4148
9 fis
, clo
ne B
RTH
A20
0458
2–2
.31.
20.
018
HM
BS—
NA
NA
KRT1
9
2166
07_s
_at
CYP
51A
1C
yto
ch
rom
e P
450,
fam
ily 5
1, s
ub
fam
ily A
, po
lyp
ep
tide
1–2
.21.
00.
018
HM
BS–2
.21.
30.
018
KRT1
9–2
.11.
30.
018
2385
51_a
tFU
T11
Fuc
osy
ltra
nsf
era
se 1
1 [α
(1,3
) fu
co
syltr
an
sfe
rase
]–2
.21.
00.
018
HM
BS–1
.81.
10.
018
KRT1
9–1
.71.
00.
026
2169
15_s
_at
PTPN
12Pr
ote
in t
yro
sine
ph
osp
ha
tase
, no
n-r
ec
ep
tor t
ype
12
–2.2
1.3
0.01
8H
MBS
1.0
1.1
0.61
2KR
T19
1.0
1.2
0.39
8
2133
49_a
tTM
CC
1Tr
an
sme
mb
ran
e a
nd
co
iled
-co
il d
om
ain
fam
ily 1
–2.2
1.1
0.01
8H
MBS
—N
AN
AKR
T19
2435
43_a
tSC
4MO
LSt
ero
l-C4-
me
thyl
oxi
da
se-li
ke–2
.11.
00.
018
HM
BS–2
.11.
10.
018
KRT1
9–2
.01.
10.
018
2010
37_a
t*
PFKP
Pho
sph
ofr
uc
toki
na
se, p
late
let
–2.0
1.1
0.01
8H
MBS
–1.9
1.2
0.02
8KR
T19
–1.9
1.2
0.02
8
2007
38_s
_at
* PG
K1Ph
osp
ho
gly
ce
rate
kin
ase
1–2
.01.
00.
018
HM
BS–1
.71.
10.
018
KRT1
9–1
.51.
10.
043
Up
reg
ula
ted
(>
2-fo
ld)
1552
411_
at
DEF
B106
A/B
De
fen
sin, β
106A
/de
fen
sin, β
106B
2.8
–1.3
0.01
8H
MBS
—N
AN
AKR
T19
2165
00_a
t—
—2.
31.
10.
018
HM
BS—
NA
NA
KRT1
9
2185
43_s
_at
PAR
P12
Poly
(A
DP-
ribo
se)
po
lym
era
se fa
mily
, me
mb
er 1
22.
21.
10.
018
HM
BS2.
01.
20.
028
KRT1
92.
11.
20.
028
Do
wn
reg
ula
ted
(<
2.0-
fold
)
2246
57_a
t*
ERR
FI1
ERBB
rec
ep
tor f
ee
db
ac
k in
hib
itor 1
–1.8
1.2
0.01
8H
MBS
–1.4
1.4
0.09
1KR
T19
–1.2
1.5
0.15
021
8507
_at
* H
IG2
Hyp
oxi
a-in
du
cib
le p
rote
in 2
–1.8
1.1
0.01
8H
MBS
–1.3
1.6
0.04
315
5445
2_a
_at
–1.8
1.2
0.01
8KR
T19
–1.2
1.4
0.23
6
1569
020_
at
* N
EDD
9N
eu
ral p
rec
urs
or c
ell
exp
ress
ed
, de
velo
pm
en
tally
do
wn
reg
ula
ted
9–1
.81.
10.
018
HM
BS–1
.61.
30.
063
KRT1
9–1
.51.
40.
034
2253
66_a
tPG
M2
Pho
sph
og
luc
om
uta
se 2
–1.5
1.1
0.01
8H
MBS
1.0
1.1
0.60
0KR
T19
1.0
1.1
0.34
0U
pre
gu
late
d
(<2.
0-fo
ld)
2319
74_a
tM
LL2
Mye
loid
/lym
ph
oid
or m
ixe
d-li
ne
ag
e le
uke
mia
21.
7–1
.10.
018
HM
BS1.
31.
00.
499
KRT1
91.
41.
10.
596
No
ch
an
ge
2009
89_a
tH
IF1A
Hyp
oxi
a-in
du
cib
le fa
cto
r 1, α
sub
un
it (b
asic
he
lix-lo
op
-he
lix
–1.1
–1.1
0.17
6H
MBS
1.0
1.2
1.00
0tr
an
scrip
tion
fac
tor)
KRT1
91.
21.
20.
446
Ast
eris
ks (
*) in
dic
ate
hyp
oxi
a-in
du
ce
d o
r HIF
1A t
arg
et
ge
ne
s. H
MBS
an
d K
RT1
9g
en
es
we
re u
sed
as
en
do
ge
no
us
refe
ren
ce
s fo
r qR
T-P
CR
. P
valu
es
we
re c
alc
ula
ted
usin
g W
ilco
xon
sig
ne
d-r
an
k te
sts.
NA
, no
t a
pp
lica
ble
.

shown). These results strongly suggestthat downregulation of HIF1A targetgenes are specifically associated with thein vivo response of irinotecan-sensitivehuman tumor xenografts.
Irinotecan Inhibits HIF1A ProteinAccumulation and Angiogenesis inHuman Colon Tumor Xenografts
To characterize the molecular mecha-nisms underlying the irinotecan-induceddownregulation of HIF1A target genes,the expression of HIF1A mRNA was eval-uated. Microarray and qRT-PCR analysesrevealed that RNA transcript levels forHIF1A did not change in response toirinotecan (Table 3). In contrast, a com-plete inhibition of human HIF1A proteinaccumulation was observed, which waspartially reversed in R samples aftertreatment arrest (Figure 3A). Interestingly,the inhibition of HIF1A protein accumu-lation occurred independently of signifi-cant changes in intratumoral hypoxia(Figure 3B). In addition, tumor sectionsfrom T samples showed a decrease in thenumber of tumor cells, as evaluated byH&E staining, and an increase in extra-cellular matrix deposition, as evaluatedby trichrome staining, in comparisonwith C samples (Figure 3C). These alter-ations were completely reversed in Rsamples. Within clusters of tumor cells,the number of proliferating cells, as de-tected by Ki-67 staining, is identical in C(93% of positive cells), T (90% of positivecells) and R (94% of positive cells) tumors(Figures 3C,D). After irinotecan treat-ment, all tumors showed a dramatic dis-organization of their vascular networkand exhibited only isolated CD31- positive endothelial cells (Figure 3C). Al-together, these observations indicate thatirinotecan inhibits HIF1A protein accu-mulation and angiogenesis in humancolon cancer xenografts in vivo.
DISCUSSIONWe used human tumor xenografts to
identify a molecular signature for tumorgrowth inhibition by irinotecan, a topoi-somerase I inhibitor, which principallyrelies on the inhibition of HIF1A protein
R E S E A R C H A R T I C L E
M O L M E D 1 8 : 8 3 - 9 4 , 2 0 1 2 | G U É R I N E T A L . | 9 1
Figure 3. Irinotecan inhibits HIF1A protein accumulation and angiogenesis in colon tumorxenografts. Western blot analysis of HIF1A protein accumulation in human colon tumorxenografts is shown in panel A. Tumors from mice treated with irinotecan (T) show a com-plete inhibition of HIF1A protein accumulation compared with control tumors from un-treated mice (C). The inhibition of HIF1A protein accumulation is reversed in xenografts thathave started to grow again (R) after the end of the treatment period. Results were con-firmed in two independent experiments. Panel B shows the detection of intratumor hypoxiain human colon tumor xenografts of mice treated with irinotecan. Mice were injected in-traperitoneally with 100 mg/kg pimonidazole 1 h before euthanasia. Pimonidazoleadducts in hypoxic areas of the tumors were identified using hypoxyprobe monoclonal antibodies on paraffin-embedded sections. Bars represent 250 μm. Results were confirmedin two independent experiments. Panel C shows histological examinations of human colontumor xenografts in mice treated with irinotecan. H&E and trichrome staining show a de-crease in tumor cellularity and an increase in extracellular matrix deposition, respectively, intumors from irinotecan-treated mice (bars represent 2.5 mm). Cellular proliferation was eval-uated with Ki-67 labeling within clusters of tumor cells (bars represent 500 μm). CD31 stain-ing shows well-formed vessels (arrows) in the control tumors of untreated mice, whereas thevascular network is completely disorganized in the tumors of irinotecan-treated mice. Thiseffect is reversed in tumors that have started to grow again after the end of the treatmentperiod (bars represent 1 mm). Results were confirmed in two independent experiments.Panel D shows the quantification of the impact of irinotecan treatment on cell proliferationas assessed by Ki-67 staining. The mean values for the average percentage of Ki-67–positivecells were calculated along with SEM. No significant difference was observed in tumor cellsfrom control (C), irinotecan-treated (T) and regrowth (R) samples.

accumulation accompanied by transcrip-tional downregulation of HIF1A targetgenes.
HIF1A is a key transcriptional activa-tor of genes needed for crucial aspects ofcancer biology, including angiogenesis,glycolytic metabolism, cell survival andinvasion (24–28). In nondiseased tissue,HIF1A is generally expressed at very lowlevels. However, in cancer tissue, andcolon cancers in particular, HIF1A is fre-quently upregulated (29–31; GeneAtlasand NCI-60 transcription profiles,http://biogps.gnf.org), in agreementwith the results for our untreated controlxenografts. Several of the HIF1A targetgenes, which became downregulatedafter irinotecan treatment, are crucial forovercoming the hypoxic status of tumorsand may thereby interfere with the ca-pacity of tumor cells to adapt to a hy-poxic environment. In particular, irinote-can reduced the expression of severalgenes encoding glucose transporters(SLC2A1, SLC2A3) as well as glycolyticenzymes (PFKFB3, PFKP, ALDOC, PGK1,ENO2). Reduced expression of thesegenes may result in decreased ATP pro-duction by the glycolytic pathway, whichis needed for tumor growth during hy-poxia (32,33). This in vivo signature is inagreement with our previous observa-tions showing that downregulation ofHIF1A by siRNA in colon cancer cells in-duces antiproliferative effects in hypoxiaconditions, validating HIF1A as a func-tionally important target (21).
A notable feature of irinotecan-treatedxenografts was the inhibition of tumorangiogenesis that correlated well withthe observed tumor size stabilization, in-dicating that in vivo irinotecan had a cy-tostatic rather than cytotoxic effect. Thisactivity may result from the downregu-lation of genes encoding VEGFA andADM, both of which are potent angio-genic factors, and of ERO1L, an endo-plasmic reticulum oxidoreductase thatactivates VEGF secretion under hypoxicconditions (34,35). Irinotecan treatmentwas also accompanied by intense reac-tive fibrosis within the tumor microenvi-ronment. Mouse tissue-specific analysis
of the same initial RNA samples re-vealed a broad profile of differentialgene expression, although the inductionof some mouse extracellular matrix com-ponents such as lumican or laminin α2and the downregulation of angiogenesis-related genes such as endothelialcell–specific molecule 1 or placentalgrowth factor were still evident (datanot shown). The expression of the mousehif1a gene was not modulated by irinote-can. Altered expression of genes linkedto protein kinases was also observed,suggesting that their involvement in theregulation of the stromal compartmentduring irinotecan treatment might impli-cate protein networks.
Whereas irinotecan downregulated alarge number of genes in the humantumor cells in vivo, only a few geneswere upregulated. The only upregulatedhuman gene that could be robustly con-firmed by qRT-PCR was poly (ADP- ribose) polymerase family, member 12(PARP12), a member of the PARP super-family belonging to the subgroup ofCCCH-type zinc-finger PARPs (36). Likeother recently discovered PARP proteins,the structure of PARP12 is characterizedby a PARP catalytic domain that lacksthe critical glutamic acid residue impor-tant for poly-ADP-ribosylation. This re-sult suggests that this enzyme, of yet un-known function, may act as amono-ADP-ribosyltransferase, althoughthe physiological role of this modifica-tion remains to be elucidated (37).
Importantly, our in vivo study did notidentify genes associated with cell cycleregulation or apoptosis, in clear contrastto previous cDNA microarray studiesthat were performed on colon or othercancer cell lines in vitro under normoxicconditions (38–43). The discrepancies inexpression profiles underline the impor-tant influence of the microenvironmentand/or pharmacological parameters onthe in vivo tumor response. This resultsupports the view that definitively invivo mechanisms have to be analyzed toaddress the whole complexity of differ-ent pathways involved in response tochemotherapeutic agents.
In agreement with previous data sug-gesting that irinotecan and other topoiso-merase inhibitors may inhibit angiogene-sis (44–51), our findings obtained inpatient-derived colon tumors illustratethe mechanistic basis for this activity,which is linked to decreased accumula-tion of HIF1A protein. These results areconsistent with the downregulation ofthe HIF1A protein induced by the poly-ethylene glycol (PEG) conjugate of SN-38in neuroblastoma and glioblastomaxenograft tumors (50,51). Also interest-ingly, a systematic in vitro screen of 2,000chemically diverse compounds for spe-cific inhibitors of the transcriptional ac-tivity of HIF1A under hypoxic conditionsin a glioblastoma cell line tumor modelidentified four compounds, amongwhich three were topoisomerase I in-hibitors (52,53). Therefore, the link be-tween HIF1A and topoisomerase I in-hibitors has now been identified both invitro and in vivo and by several differentapproaches. The molecular mechanismsthat link TOP1 inhibition to the attenua-tion of HIF1A protein levels remain to beidentified, but are not on the basis oftranscriptional downregulation of theHIF1A gene. Similar observations disso-ciating the inhibition of HIF1A proteinaccumulation from mRNA modulationhave been recently published for PEGy-lated SN-38 and irinotecan in glioblas-toma xenografts (51). These results arealso consistent with those reported fortopotecan, another topoisomerase I in-hibitor that did not affect HIF1A mRNAaccumulation or protein half-life, butrather acted on the translational level(54). In addition, we have recently shownthat inhibition of HIF1A protein accumu-lation by irinotecan does not rely on inhi-bition of the mammalian target of ra-pamycin (mTOR) pathway (21).
CONCLUSIONIn conclusion, this study reveals the
activity of a cytotoxic antitumor drug ontumor angiogenesis and highlights itsmechanistic basis. Use of transcriptome-based masks for separate analysis of thetumor and the stromal component of
9 2 | G U É R I N E T A L . | M O L M E D 1 8 : 8 3 - 9 4 , 2 0 1 2
I R I N O T E C A N I N H I B I T S H I F 1 A A C C U M U L A T I O N I N V I V O

xenograft models opens the way for in-novative mechanistic studies of the invivo activity of anticancer agents. Suchstudies are crucial for the developmentof more rational drug combinations, asexemplified by our recent work demon-strating a cooperative inhibition of themTOR/HIF1A axis by the combined useof irinotecan and rapamycine, a novel as-sociation that was designed on the basisof the results of the present study (21).
ACKNOWLEDGMENTSThe authors wish to acknowledge the
biocomputing, bioinformatics and mi-croarray facilities at the Institut de Géné-tique et de Biologie Moléculaire et Cellu-laire. They also gratefully acknowledgeChristiane Arnold, Mathilde Arrivé,Nathalie Hamelin and Laetitia Ruck forexcellent technical assistance.
This work was supported by the LigueRégionale contre le Cancer (Haut-Rhin,Bas-Rhin), the Institut National du Can-cer (CETIRICOL, PL06.008), the InstitutNational de la Santé et de la RechercheMédicale, the Centre National de laRecherche Scientifique, the Université deStrasbourg and the Hôpitaux Universi-taires de Strasbourg.
DISCLOSUREThe authors declare that they have no
competing interests as defined by Molecu-lar Medicine, or other interests that mightbe perceived to influence the results anddiscussion reported in this paper.
REFERENCES1. Guenot D, et al. (2006) Primary tumour genetic
alterations and intra-tumoral heterogeneity aremaintained in xenografts of human colon can-cers showing chromosome instability. J. Pathol.208:643–52.
2. Saltz LB, et al. (2000) Irinotecan plus fluorouraciland leucovorin for metastatic colorectal cancer:Irinotecan study group. N. Engl. J. Med. 343:905–14.
3. Douillard JY, et al. (2000) Irinotecan combinedwith fluorouracil compared with fluorouracilalone as first-line treatment for metastatic colo-rectal cancer: a multicentre randomised trial.Lancet. 355:1041–7.
4. Cunningham D, et al. (2004) Cetuximab monother-apy and cetuximab plus irinotecan in irinotecan-refractory metastatic colorectal cancer. N. Engl. J.Med. 351:337–45.
5. Hurwitz H, et al. (2004) Bevacizumab plusirinotecan, fluorouracil, and leucovorin formetastatic colorectal cancer. N. Engl. J. Med.350:2335–42.
6. Van Cutsem E, et al. (2009) Cetuximab and chem-otherapy as initial treatment for metastatic colo-rectal cancer. N. Engl. J. Med. 360:1408–17.
7. Champoux JJ. (2001) DNA topoisomerases:structure, function, and mechanism. Annu. Rev.Biochem. 70:369–413.
8. Liu LF, et al. (2000) Mechanism of action of camp-tothecin. Ann. N. Y. Acad. Sci. 922:1–10.
9. Bhonde MR, et al. (2006) Equivalent effect ofDNA damage-induced apoptotic cell death orlong-term cell cycle arrest on colon carcinomacell proliferation and tumour growth. Oncogene.25:165–75.
10. Pommier Y. (2006) Topoisomerase I inhibitors:camptothecins and beyond. Nat. Rev. Cancer.6:789–802.
11. Naef F, Huelsken J. (2005) Cell-type-specific tran-scriptomics in chimeric models using transcrip-tome-based masks. Nucleic Acids Res. 33:e111.
12. Fiebig HH, Maier A, Burger AM. (2004) Clono-genic assay with established human tumourxenografts: correlation of in vitro to in vivo activ-ity as a basis for anticancer drug discovery. Eur. J.Cancer. 40:802–20.
13. Raffelsberger W, et al. (2008) RReportGenerator:automatic reports from routine statistical analysisusing R. Bioinformatics. 24:276–8.
14. Bolstad BM, Irizarry RA, Astrand M, Speed TP.(2003) A comparison of normalization methodsfor high density oligonucleotide array data basedon variance and bias. Bioinformatics. 19:185–93.
15. Irizarry RA, et al. (2003) Summaries of AffymetrixGeneChip probe level data. Nucleic Acids Res.31:e15.
16. Gentleman RC, et al. (2004) Bioconductor: opensoftware development for computational biologyand bioinformatics. Genome Biol. 5:R80.
17. Reiner A, Yekutieli D, Benjamini Y. (2003) Identi-fying differentially expressed genes using falsediscovery rate controlling procedures. Bioinfor-matics. 19:368–75.
18. Strimmer K. (2008) fdrtool: a versatile R packagefor estimating local and tail area-based false dis-covery rates. Bioinformatics. 24:1461–2.
19. Dennis G, et al. (2003) DAVID: Database for An-notation, Visualization, and Integrated Discov-ery. Genome Biol. 4:P3.
20. Suzuki R, Shimodaira H. (2006) Pvclust: an Rpackage for assessing the uncertainty in hierar-chical clustering. Bioinformatics. 22:1540–2.
21. Pencreach E, et al. (2009) Marked activity ofirinotecan and rapamycin combination towardcolon cancer cells in vivo and in vitro is mediatedthrough cooperative modulation of the mam-malian target of rapamycin/hypoxia-induciblefactor-1alpha axis. Clin. Cancer Res. 15:1297–307.
22. Prewett MC, et al. (2002) Enhanced antitumor ac-tivity of anti-epidermal growth factor receptormonoclonal antibody IMC-C225 in combination
with irinotecan (CPT-11) against human colorec-tal tumor xenografts. Clin. Cancer Res. 8:994–1003.
23. Denko NC, et al. (2003) Investigating hypoxictumor physiology through gene expression pat-terns. Oncogene. 22:5907–14.
24. Semenza GL. (2003) Targeting HIF-1 for cancertherapy. Nat. Rev. Cancer. 3:721–32.
25. Semenza GL. (2010) Defining the role of hypoxia-inducible factor 1 in cancer biology and thera-peutics. Oncogene. 29:625–34.
26. Pouysségur J, Dayan F, Mazure NM. (2006) Hy-poxia signalling in cancer and approaches to en-force tumour regression. Nature. 441:437–43.
27. Gordan JD, Simon MC. (2007) Hypoxia-induciblefactors: central regulators of the tumor pheno-type. Curr. Opin. Genet. Dev. 17:71–7.
28. Rankin EB, Giaccia AJ. (2008) The role of hypoxia-inducible factors in tumorigenesis. Cell Death Dif-fer. 15:678–85.
29. Zhong H, et al. (1999) Overexpression of hypoxia-inducible factor 1 alpha in common human can-cers and their metastases. Cancer Res. 59:5830–5.
30. Su AI, et al. (2004) A gene atlas of the mouse andhuman protein-encoding transcriptomes. Proc.Natl. Acad. Sci. U. S. A. 101:6062–7.
31. Simiantonaki N, Taxeidis M, Jayasinghe C,Kurzik-Dumke U, Kirkpatrick CJ. (2008) Hypoxia-inducible factor 1 alpha expression increases dur-ing colorectal carcinogenesis and tumor progres-sion. BMC Cancer. 8:320.
32. DeBerardinis RJ, Lum JJ, Hatzivassiliou G,Thompson CB. (2008) The biology of cancer:metabolic reprogramming fuels cell growth andproliferation. Cell Metab. 7:11–20.
33. Semenza GL. (2009) Regulation of cancer cell me-tabolism by hypoxia-inducible factor 1. Semin.Cancer Biol. 19:12–6.
34. May D, et al. (2005) Ero1-L alpha plays a key rolein a HIF-1-mediated pathway to improve disulfidebond formation and VEGF secretion under hy-poxia: implication for cancer. Oncogene. 24:1011–20.
35. Nikitenko LL, Fox SB, Kehoe S, Rees MC, Bick-nell R. (2006) Adrenomedullin and tumour an-giogenesis. Br. J. Cancer. 94:1–7.
36. Schreiber V, Dantzer F, Ame JC, de Murcia G.(2006) Poly(ADP-ribose): novel functions for anold molecule. Nat. Rev. Mol. Cell. Biol. 7:517–28.
37. Kleine H, et al. (2008) Substrate-assisted catalysisby PARP10 limits its activity to mono-ADP-ribo-sylation. Mol. Cell. 32:57–69.
38. Zhou Y, et al. (2002) Transcriptional regulation ofmitotic genes by camptothecin-induced DNAdamage: microarray analysis of dose- and time-dependent effects. Cancer Res. 62:1688–95.
39. Daoud SS, et al. (2003) Impact of p53 knockoutand topotecan treatment on gene expression pro-files in human colon carcinoma cells: a pharma-cogenomic study. Cancer Res. 63:2782–93.
40. Minderman H, et al. (2005) In vitro and in vivoirinotecan-induced changes in expression profilesof cell cycle and apoptosis-associated genes inacute myeloid leukemia cells. Mol. Cancer Ther.4:885–900.
R E S E A R C H A R T I C L E
M O L M E D 1 8 : 8 3 - 9 4 , 2 0 1 2 | G U É R I N E T A L . | 9 3

41. Souza V, Dong YB, Zhou HS, Zacharias W, Mc-Masters KM. (2005) SW-620 cells treated withtopoisomerase I inhibitor SN-38: gene expressionprofiling. J. Transl. Med. 3:44.
42. Bhonde MR, et al. (2006). DNA damage-inducedexpression of p53 suppresses mitotic checkpointkinase hMps1: the lack of this suppression inp53MUT cells contributes to apoptosis. J. Biol.Chem. 281:8675–85.
43. Guo X, et al. (2006) Analysis of common gene ex-pression patterns in four human tumor cell linesexposed to camptothecin using cDNA microar-ray: identification of topoisomerase-mediatedDNA damage response pathways. Front. Biosci.11:1924–31.
44. Nakashio A, Fujita N, Tsuruo T. (2002) Topotecaninhibits VEGF- and bFGF-induced vascular en-dothelial cell migration via downregulation of thePI3K-Akt signaling pathway. Int. J. Cancer. 98:36–41.
45. Petrangolini G, et al. (2003) Antiangiogenic ef-fects of the novel camptothecin ST1481 (gimate-can) in human tumor xenografts. Mol. Cancer Res.1:863–70.
46. Kamiyama H, Takano S, Tsuboi K, Matsumura A.(2005) Anti-angiogenic effects of SN38 (activemetabolite of irinotecan): inhibition of hypoxia-inducible factor 1 alpha (HIF-1alpha)/vascularendothelial growth factor (VEGF) expression ofglioma and growth of endothelial cells. J. CancerRes. Clin. Oncol. 131:205–13.
47. Ji Y, et al. (2007) The camptothecin derivativeCPT-11 inhibits angiogenesis in a dual-color im-ageable orthotopic metastatic nude mouse modelof human colon cancer. Anticancer Res. 27:713–8.
48. Bocci G, et al. (2008) Antiangiogenic and anticol-orectal cancer effects of metronomic irinotecanchemotherapy alone and in combination with se-maxinib. Br. J. Cancer. 98:1619–29.
49. Takano S, et al. (2010) Metronomic treatment ofmalignant glioma xenografts with irinotecan(CPT-11) inhibits angiogenesis and tumorgrowth. J. Neurooncol. 99:177–85.
50. Pastorino F, et al. (2010) Tumor regression andcurability of preclinical neuroblastoma modelsby PEGylated SN38 (EZN-2208), a novel topoiso-merase I inhibitor. Clin. Cancer Res. 16:4809–21.
51. Sapra P, et al. (2011) Potent and sustained inhibi-tion of HIF-1α and downstream genes by a poly-ethyleneglycol-SN38 conjugate, EZN-2208, re-sults in anti-angiogenic effects. Angiogenesis.14:245–53.
52. Rapisarda A, et al. (2002) Identification of smallmolecule inhibitors of hypoxia-inducible factor 1transcriptional activation pathway. Cancer Res.62:4316–24.
53. Rapisarda A, et al. (2004) Schedule-dependent in-hibition of hypoxia-inducible factor-1alpha pro-tein accumulation, angiogenesis, and tumorgrowth by topotecan in U251-HRE glioblastomaxenografts. Cancer Res. 64:6845–8.
54. Rapisarda A, et al. (2004) Topoisomerase I-medi-ated inhibition of hypoxia-inducible factor 1:mechanism and therapeutic implications. CancerRes. 64:1475–82.
9 4 | G U É R I N E T A L . | M O L M E D 1 8 : 8 3 - 9 4 , 2 0 1 2
I R I N O T E C A N I N H I B I T S H I F 1 A A C C U M U L A T I O N I N V I V O


![Cell-type specific light-mediated transcript regulation in the ......unicellular Chlamydomonas [3,10,12-14], little is known about the molecular background of light reception mecha-nisms](https://static.fdocuments.us/doc/165x107/60f7823bde6f2b209b6a0aad/cell-type-specific-light-mediated-transcript-regulation-in-the-unicellular.jpg)
