In Vitro Module: Data Management and Statistical Analysis ... · In Vitro Module Data Management...
12
In Vitro Module: Data Management and Statistical Analysis Plan (DMSAP) Version 1.1 WWARN Data Management and Statistical Analysis Plan (DMSAP) In Vitro Module WorldWide Antimalarial Resistance Network (WWARN)
Transcript of In Vitro Module: Data Management and Statistical Analysis ... · In Vitro Module Data Management...
In Vitro Module: Data Management and Statistical Analysis Plan(DMSAP)Version 1.1
WWARN Data Management and Statistical Analysis Plan(DMSAP)
In Vitro ModuleWorldWide Antimalarial Resistance Network (WWARN)

In Vitro Module Data Management and Statistical Analysis Plan v1.1 Page 2/12
Suggested citation: In Vitro Module, WWARN, 2013. Data Management and Statistical AnalysisPlan.
Version HistoryVersion number Revision(s) & reason for amendment Release datev1.0
V1.1 Separation of core criteria and range warnings so thatrange warning does not lead to removal from core
Modification of range warnings to produce Range Lowand Range High warnings
Changes in the Data set submission process and Datacleaning process to include the use of IVART Online bythe investigator
08/03/2013
For more information, contact:[email protected]
WorldWide Antimalarial Resistance Network (WWARN)www.wwarn.org
In Vitro Module Data Management and Statistical Analysis Plan v1.1 Page 3/12
Contents
1. Scope.......................................................................................................................................42. Introduction ............................................................................................................................4
2.1 Generating evidence of antimalarial drug efficacy ...................................................... 42.2 WWARN In Vitro Data Processing ................................................................................ 4
3. Dataset submission process....................................................................................................53.1 Data submission steps.................................................................................................. 53.2 Study files ..................................................................................................................... 63.3 Sample data files .......................................................................................................... 63.4 Primary (raw) data files ................................................................................................ 63.5 Criteria for acceptance................................................................................................. 73.6 Storage ......................................................................................................................... 7
4. Data Curation ..........................................................................................................................74.1 Curation by WWARN.................................................................................................... 74.2 Curation by the investigator......................................................................................... 7
5. Analysis via the In Vitro Analysis and Reporting Tool (IVART) ................................................75.1 Sigmoid Emax model ...................................................................................................... 85.2 Normalisation............................................................................................................... 85.3 Non-linear regression................................................................................................... 95.4 Core Criteria for summary analyses ............................................................................. 95.5 Range warnings .......................................................................................................... 10
6. Reporting...............................................................................................................................106.1 Study report ............................................................................................................... 106.2 Microsoft Excel™ files................................................................................................. 116.3 Review by curator and contributor ............................................................................ 11
7. WWARN Explorer..................................................................................................................118. Concluding remarks ..............................................................................................................119. References ............................................................................................................................12

In Vitro Module Data Management and Statistical Analysis Plan v1.1 Page 4/12
1. Scope
A key aim of the Worldwide Antimalarial Resistance Network (WWARN) is to monitorgeospatial and temporal trends in antimalarial drug resistance. The purpose of the In VitroData Management and Statistical Analytical Plan (DMSAP) is to provide a clear andtransparent description of the methodology by which WWARN handles and analyses in vitrodata. In vitro susceptibility data need to be collated at an individual assay level so thatstandardized methodologies and definitions can be applied. Documenting the entire process bywhich data are uploaded, transformed, analysed and presented ensures reproducibility. It alsoprovides a framework for discussing and developing such methodologies.
2. Introduction
In vitro drug susceptibility remains a central pillar of antimalarial efficacy surveillance. Theassessment of antimalarial drug susceptibility in parasites straight from patients (ex vivoparasites that are not culture-adapted) is largely independent of clinical factors and henceprovides information that complements clinical assessment of drug efficacy. The WWARN InVitro Module aims to enhance the amount of in vitro data available, increase scientific capacityin endemic countries and provide intelligence on resistance or susceptibility to variousantimalarials.
The In Vitro Module is working towards these goals in the following ways: Facilitating the inclusion in a Data Repository of results from in vitro susceptibility studies
contributed by research groups, Non-Governmental Organisations (NGOs) or NationalMalaria Control Programmes (NMCPs) from around the world.
Developing high-throughput data management tools to facilitate standardised analysis oflarge datasets.
Promoting the use of validated antimalarials and reference strains to enhancecomparability of results between heterogeneous studies.
2.1 Generating evidence of antimalarial drug efficacy
Determination of the in vitro susceptibility of field P. falciparum isolates to antimalarial drugs isundertaken via a variety of measurement systems and analytical approaches. These, as well asvariation in culture methods, have developed according to specific research questions,characteristics of the study site or simple logistical constraints. Such variations in design,methodology, analysis and presentation of in vitro studies constitute a challenge for thecollation of data from different centres. WWARN’s approach to this issue, across all modules, isto work with complete sets of primary (raw) data, allowing the characteristics of themethodology to be understood, and analyses to be undertaken via a standardised approach.For in vitro studies, the primary data are the raw output from ex vivo assessment of drugeffects on an individual isolate for a single drug. In almost all cases, the dataset for an isolatecomprises many such individual assessments for each of several different drugs.
2.2 WWARN In Vitro Data Processing
A series of steps will be followed for each dataset submitted to WWARN:
I. Submission of primary experimental and sample data from an in vitro study

In Vitro Module Data Management and Statistical Analysis Plan v1.1 Page 5/12
II. Transformation and Data analysis applying the In Vitro Analysis and Reporting Tool
(IVART), uniform analytical methodology to provide reproducible estimates of drug
susceptibility
III. Reporting of results to the contributor
IV. Agreement of the contributor that the contributed data can be included in pooled
analyses and/or presented on the WWARN Explorer
V. Display of results on the WWARN Explorer, an interactive, online tool which allows
users to perform custom queries of data from multiple studies and modules and
visualise the results using dynamic mapping
WWARN notes that individual researchers may take different approaches to data managementand analysis. It is inevitable that WWARN-derived drug susceptibility results will vary to someextent compared to analyses performed by the data contributor. Any differences do not reflecta value judgment as to which analytical approach is correct. A uniform approach is taken onlyto apply standardised methodologies and minimise bias on geospatial and temporal trendsderived from the many studies compiled in the Data Repository.The purpose of this document is to describe the key processes of data management andanalysis that will be undertaken on individual in vitro datasets by WWARN.
3. Dataset submission process
Datasets can be submitted to WWARN in two different ways:1. Using the WWARN online submission system in which a WWARN curator will clean and
analyse the data using IVART.2. Investigator can do the data curation and analysis themselves and submit the data set
to WWARN using the IVART Online web-application.
Data contributors must accept the Terms of Submission [available athttp://www.wwarn.org/data/usage] during the submission process.
3.1 Data submission steps
The data submission steps are:I. Study Registration: contributors enter their study title and each study is assigned a
unique WWARN identifier. Contributors can also tick one or more boxes to indicate the
type of data submitted (clinical, molecular, in vitro and/or pharmacology).
II. Permissions: each study may have any number of administrators, assigned by the data
contributor who created the study title and accepted the Terms of Submission. An
administrator can access the study, upload files and edit supplied information.
III. Files: contributors are asked to submit data files and supporting documentation
including a data dictionary, protocols and publications.
IV. Publications: contributors can provide the Pub Med ID, citation or DOI for publications
relating to the submitted data.
V. Acknowledgements: the names of acknowledged individuals and institutions will
appear in the study details displayed in WWARN Explorer.
VI. Study information: data contributors are asked to provide information on the study
site, laboratory conditions and drug sources in the study site questionnaire. They may

In Vitro Module Data Management and Statistical Analysis Plan v1.1 Page 6/12
enter this information themselves or provide relevant protocols and publications which
will be used by WWARN Data Managers to extract relevant data. If such information is
common to all files uploaded by one group, the information can be saved as a unique
protocol, and referred to in subsequent submissions.
3.2 Study files
WWARN recognises that contributors organize their data in a variety of different ways andtherefore accepts most types and numbers of data file. Preferably, a contributor may upload adata file listing information about each sample and a primary data file containing the outputfrom individual in vitro assays in the 96-plate format. If using IVART Online, data must beuploaded in the 96-plate format.
3.3 Sample data files
These typically contain one set of data for each isolate:
Unique identifiers for the sample
Whether the sample is a clinical isolate (ex vivo) or a laboratory reference strain
Patient variables, if available: age, sex, haematocrit/haemoglobin level, white cell
count, parasitaemia (per 200 WBC, 1000 RBC or microlitre)
Date and time the parasite sample was taken
Time when culture commenced (allows calculation of delay)
Location where sample taken (or where malaria acquired in travellers)
Assay method used
Duration of assay
3.4 Primary (raw) data files
These files contain primary experimental data values from ex vivo assays, along with identifyinginformation to allow linking to the sample file. Complete primary datasets, including data fromapparently ‘failed’ assays, should be submitted so that the most accurate picture of a study canbe developed. If 96-well plate data are provided, the contributor should provide a descriptionof the plate layout in terms of drug and concentration. Having provided this once, furtherdatasets using the same layout can be transformed using the same template.
An example of the information anticipated is shown in Figure 1.
Figure 1: Example of primary (raw) data
In Vitro Module Data Management and Statistical Analysis Plan v1.1 Page 7/12
3.5 Criteria for acceptance
It will not be possible to process data sets without the primary output data, unique identifiers,geographical sample/acquisition location, dates of sample collection and drug-free controlwells. For each drug, assay data from a minimum of ten individual isolates should be submitted.
3.6 Storage
The new dataset will be recorded as having been received for curation and further progressthrough the curation and analysis process will be communicated to the contributor. Data willbe stored on the WWARN server ensuring a high level of security. Individual data files will beaccessible only to the original contributors, colleagues that they authorize and selectedWWARN staff.
In order to ensure compliance with its legal and ethical obligations, WWARN requires that alldata has been anonymised prior to submission.
4. Data Curation
Curation of submitted data involves transformation of drug, concentration and readout values,along with relevant sample data, into a standardised format, allowing single study analysis, thegeneration of a study report and, with permission, visualisation of summary study informationon WWARN Explorer. The curated data is stored in a Data Repository for future pooling withother datasets and meta-analyses.
4.1 Curation by WWARN
If raw data is submitted to WWARN through the online submission system, a WWARN curatorwill interact with the contributor so the data is clearly understood and correctly transformedand analysed. It is critical that there is a clear understanding in terms of drug names andconcentrations (nM concentrations are standard), unique identifiers (matched between sampleand primary data files) and place names and locations.
4.2 Curation by the investigator
To use IVART Online, data in the 96-well format needs to go through the process of “tagging”by the investigator, for the data to be annotated and recognised by IVART. After upload, thetagged data file goes through an automatic checking function in IVART Online, reportingduplicates, missing data, date errors and other inconsistencies that need to be resolved prior todata analysis. Details about using IVART Online can be found in the Step by Step User Guide.
5. Analysis via the In Vitro Analysis and Reporting Tool (IVART)
Concentration-effect data will be analysed by non-linear regression. Several non-linearregression models are broadly appropriate for this purpose and have been used in publishedwork to calculate IC50 values and other variables from in vitro data. Results in the WWARN In

In Vitro Module Data Management and Statistical Analysis Plan v1.1 Page 8/12
Vitro Study Report are derived from analysis based on a 4-parameter sigmoid Emax model, withfixed upper and lower constraints according to control values (i.e. a 2-parameter model).
5.1 Sigmoid Emax model
A symmetrical sigmoidal curve is produced with an upper and a lower constraint.
The upper constraint is defined by the value E (C0), defined as the mean effect across
all wells on a plate which contain no drug.
The lower constraint is defined by the value Emin, defined as the average effect over the
two concentrations with the lowest mean effect for a particular drug.
An example of data with these two constraints is shown in Figure 2.
Figure 2: Example of primary (raw) data, indicating E(C0) and Emin.The y-axis shows hypoxanthine incorporation expressed as counts per minute (cpm). For display purposes, effect atzero drug is shown (at a concentration two logs below minimum concentration used). In this case ECmax (growth atthe highest concentration) is higher than Emin indicating an apparent rise in growth at very high concentration.
5.2 Normalisation
Experimental data are normalized to a percentage scale based on the constraints E(C0) and Emin
(Figure 4).
Figure 3: Normalisation of primary (raw) data to percentage scale based on E(C0) and Emin.For display purposes, effect at zero drug is shown (at a concentration two logs below minimum concentration used).

In Vitro Module Data Management and Statistical Analysis Plan v1.1 Page 9/12
5.3 Non-linear regression
Non-linear regression using a sigmoid, 2-parameter, concentration-inhibition model is appliedto the data based on established approaches (Le Nagard et al 2010), with the upper constraintset at 100% and the lower at 0% i.e. E(C0) and Emin (Figure 5). This final step yields two keyresults for each curve, the IC50 and gamma (an expression of the slope of the curve at the IC50),each with 95% confidence intervals.
Figure 4: Non-linear regression, constrained to 100% and 0%, based on E(C0) and Emin respectively.The data are shown on both linear (left) and log (right) x-axis scales. For display purposes, the effect at zero drug isshown (at a concentration two logs below the minimum concentration used).
5.4 Core Criteria for summary analyses
Confidence in the IC50 value and slope resulting from linear regression will be used to define asubset of results with a tight confidence interval suitable for core analyses and reportsaccording to the following core criteria:
If gamma is not 10, ratio of upper : lower 95% confidence intervals for IC50 must be lessthan 3 (and both confidence intervals positive)
If gamma is 10 (indicating a fixed, steep slope), ratio of E(C0) : Emin must be greater than2 indicating acceptable growth (Basco 2007)
Note: On some occasions, non-linear regression fails to converge or produce an acceptablecurve, due to either a very steep slope or noisy data. Under such circumstances, the non-linearregression algorithm repeats the process with a fixed gamma of 10. If this second iteration issuccessful, this renders the process a 1-parameter model. Such curves are consequently heavilyconstrained (at top, bottom and slope) so that the confidence intervals for IC50 (the lastvariable parameter) may be insensitive measures of true confidence. For this reason theadditional criterion based on signal and noise is applied in such cases.
Available evidence indicates that these criteria are appropriate for many datasets, particularlythose involving ELISA and SYBR green readouts. However additional parameters may behelpful for analysis of specific datasets. For this reason IVART also includes in the spreadsheetoutput the root mean square deviation (quantifying overall goodness of fit), a measure that
In Vitro Module Data Management and Statistical Analysis Plan v1.1 Page 10/12
could potentially be applied in a systematic way by investigators under particularcircumstances.
5.5 Range warnings
With some datasets there is evidence that the range of drugs used to determine IC50 is toohigh or too low, and Range warnings are accordingly triggered. Range warnings are appliedindependently of core criteria so assays that meet core criteria, but trigger a range warning, areretained in core analyses.
The ‘Range high’ warning is triggered when IC50 < lowest drug concentration.The drug range is so high that even the lowest drug concentration already inhibits growth bymore than 50%.
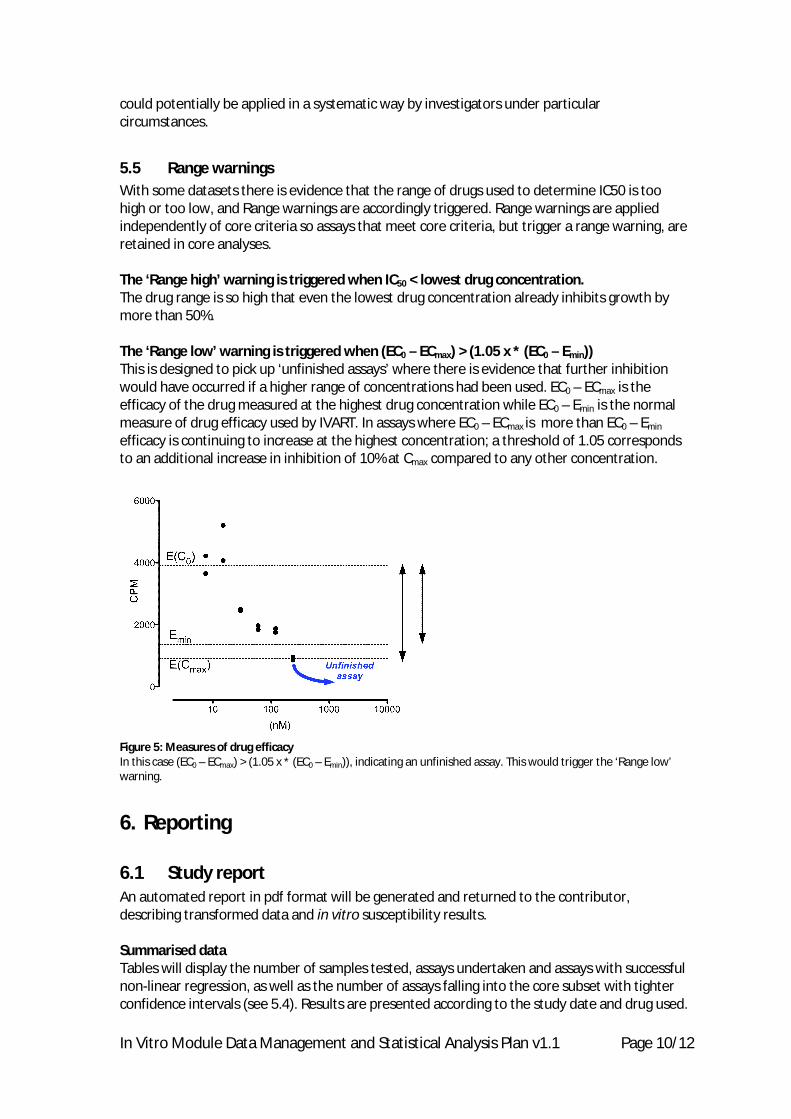
The ‘Range low’ warning is triggered when (EC0 – ECmax) > (1.05 x * (EC0 – Emin))This is designed to pick up ‘unfinished assays’ where there is evidence that further inhibitionwould have occurred if a higher range of concentrations had been used. EC0 – ECmax is theefficacy of the drug measured at the highest drug concentration while EC0 – Emin is the normalmeasure of drug efficacy used by IVART. In assays where EC0 – ECmax is more than EC0 – Emin
efficacy is continuing to increase at the highest concentration; a threshold of 1.05 correspondsto an additional increase in inhibition of 10% at Cmax compared to any other concentration.
Figure 5: Measures of drug efficacyIn this case (EC0 – ECmax) > (1.05 x * (EC0 – Emin)), indicating an unfinished assay. This would trigger the ‘Range low’warning.
6. Reporting
6.1 Study reportAn automated report in pdf format will be generated and returned to the contributor,describing transformed data and in vitro susceptibility results.
Summarised dataTables will display the number of samples tested, assays undertaken and assays with successfulnon-linear regression, as well as the number of assays falling into the core subset with tighterconfidence intervals (see 5.4). Results are presented according to the study date and drug used.

In Vitro Module Data Management and Statistical Analysis Plan v1.1 Page 11/12
Box plots show median, quartiles and range for IC50 values for each drug and year (Figure 7).Only data where there are at least 10 results per drug per year will be plotted in this way.
Figure 7: Box plot showing median, quartiles and range for IC50 values for chloroquine in 2009.Points more than one quartile width away from the main quartile are shown as outlying values.
Individual assay dataEach assay curve with individual normalized primary output data will be shown in the report tothe contributor. For each sample, the IC50 estimate for each drug assay curve with its upper andlower 95% CI, the upper and lower constraints used, and gamma will be tabulated. Lists ofassays where no regression analysis could be obtained, assays with no sample data andsamples with no assay data will be provided.
6.2 Microsoft Excel™ filesData contributors will receive spreadsheet files containing the output from IVART, including asingle table summarising key parameters for all individual assays. It will integrate the originalsample data supplied by the contributor allowing a variety of further analyses e.g. by location,drug, year etc..
6.3 Review by curator and contributorThe automated report is reviewed by the curator and then sent, as a draft, to the contributorfor review and approval before locking as the final report.
7. WWARN Explorer
The WWARN Explorer is an online, open-access tool which allows users to perform customqueries of multiple studies and visualise the results using dynamic interactive maps. Followingapproval from the contributor, elements of the study report and box plots – shown by drug andyear – will be displayed on WWARN Explorer.
8. Concluding remarks
This is the first version of the WWARN In Vitro DMSAP. Future versions will incorporate userfeedback and knowledge gained as additional datasets are submitted to WWARN. A centralgoal of WWARN’s In Vitro module is to link patient isolate data with results for validated
In Vitro Module Data Management and Statistical Analysis Plan v1.1 Page 12/12
reference strain 3D7 obtained in the same laboratory. Such analyses will be incorporated intofuture versions of the In Vitro DMSAP.
9. References
Le Nagard H, Vincent C, Mentre F, Le Bras J. Online analysis of in vitro resistance to antimalarialdrugs through nonlinear regression. Comput. Methods Programs Biomed. 2010 Sept 7.
Basco LK. Field application of in vitro assays for the sensitivity of human malaria parasites toantimalarial drugs. World Health Organization 2007.