
In vitro confocal micro-PIV measurements of blood flow in a square microchannel: The effect of the...
6
Journal of Biomechanics 40 (2007) 2752–2757 In vitro confocal micro-PIV measurements of blood flow in a square microchannel: The effect of the haematocrit on instantaneous velocity profiles Rui Lima a,b, , Shigeo Wada c , Motohiro Takeda a,d , Ken-ichi Tsubota a , Takami Yamaguchi a a Department of Bioengineering and Robotics, Graduate School of Engineering, Tohoku University, 6-6-01 Aoba, 980-8579 Sendai, Japan b Department of Mechanical Technology, ESTiG, Braganc - a Polytechnic Institute, Campus Sta. Apolo´nia, 5301-857 Braganc - a, Portugal c Department of Mechanical Science and Bioengineering, Graduate School of Engineering Science, Osaka University, Toyonaka, 560-8531 Osaka, Japan d Division of Surgical Oncology, Graduate School of Medicine, Tohoku University, 2-1 Seiryo-machi, Aoba-ku, 980-8575 Sendai, Japan Accepted 16 January 2007 Abstract A confocal microparticle image velocimetry (micro-PIV) system was used to obtain detailed information on the velocity profiles for the flow of pure water (PW) and in vitro blood (haematocrit up to 17%) in a 100-mm-square microchannel. All the measurements were made in the middle plane of the microchannel at a constant flow rate and low Reynolds number (Re ¼ 0.025). The averaged ensemble velocity profiles were found to be markedly parabolic for all the working fluids studied. When comparing the instantaneous velocity profiles of the three fluids, our results indicated that the profile shape depended on the haematocrit. Our confocal micro-PIV measurements demonstrate that the root mean square (RMS) values increase with the haematocrit implying that it is important to consider the information provided by the instantaneous velocity fields, even at low Re. The present study also examines the potential effect of the RBCs on the accuracy of the instantaneous velocity measurements. r 2007 Elsevier Ltd. All rights reserved. Keywords: Microcirculation; Confocal micro-PIV; Instantaneous velocity profiles; Haematocrit; Red blood cells 1. Introduction The velocity profiles of blood flow in vivo and in vitro have been measured using several techniques, including double-slit photometry (Gaehtgens et al., 1970; Baker and Wayland, 1974), video microscopy and image analysis (Bugliarello and Hayden, 1963; Tangelder et al., 1986; Parthasarathi et al., 1999), laser-Doppler anemometry (Einav et al., 1975; Born et al., 1978; Cochrane et al., 1981; Uijttewaal et al., 1994, Golster et al., 1999), and particle-measuring methods (Sugii et al., 2002, 2005; Nakano et al., 2003, 2005; Jeong et al., 2007). Nevertheless, no general consensus yet exists concerning the actual velocity profile in microvessels. While some studies have reported parabolic profiles (Baker and Wayland, 1974; Golster et al., 1999; Sugii et al., 2005), others have suggested blunt profiles (Bugliarello and Hayden, 1963; Tangelder et al., 1986; Nakano et al., 2003); still others have reported blunt profiles at extremely low velocities and diameters and parabolic profiles at diameters exceeding 100 mm(Gaehtgens et al., 1970; Cochrane et al., 1981). Thus, further research is needed on the influence of flow parameters on the blood flow velocity profiles in micro- vessels. Due to its outstanding spatial filtering technique and multiple point light illumination system, confocal micro- particle image velocimetry (micro-PIV) (Tanaani et al., 2002; Park et al., 2004; Kinoshita et al., 2005; Park and Kihm, 2006; Lima et al., 2006a) has become accepted as a reliable method for measuring velocity profiles with high spatial resolution. Very recently, we demonstrated the ability of confocal micro-PIV to measure both homoge- neous and nonhomogeneous fluids (Lima et al., 2006a). ARTICLE IN PRESS www.elsevier.com/locate/jbiomech www.JBiomech.com 0021-9290/$ - see front matter r 2007 Elsevier Ltd. All rights reserved. doi:10.1016/j.jbiomech.2007.01.012 Corresponding author. Tel.: +81 22 7956958; fax: +81 22 7956959. E-mail address: [email protected] (R. Lima).
Transcript of In vitro confocal micro-PIV measurements of blood flow in a square microchannel: The effect of the...

ARTICLE IN PRESS
0021-9290/$ - se
doi:10.1016/j.jb
�CorrespondE-mail addr
Journal of Biomechanics 40 (2007) 2752–2757
www.elsevier.com/locate/jbiomech
www.JBiomech.com
In vitro confocal micro-PIV measurements of blood flowin a square microchannel: The effect of the haematocrit
on instantaneous velocity profiles
Rui Limaa,b,�, Shigeo Wadac, Motohiro Takedaa,d, Ken-ichi Tsubotaa, Takami Yamaguchia
aDepartment of Bioengineering and Robotics, Graduate School of Engineering, Tohoku University, 6-6-01 Aoba, 980-8579 Sendai, JapanbDepartment of Mechanical Technology, ESTiG, Braganc-a Polytechnic Institute, Campus Sta. Apolonia, 5301-857 Braganc-a, Portugal
cDepartment of Mechanical Science and Bioengineering, Graduate School of Engineering Science, Osaka University, Toyonaka, 560-8531 Osaka, JapandDivision of Surgical Oncology, Graduate School of Medicine, Tohoku University, 2-1 Seiryo-machi, Aoba-ku, 980-8575 Sendai, Japan
Accepted 16 January 2007
Abstract
A confocal microparticle image velocimetry (micro-PIV) system was used to obtain detailed information on the velocity profiles for the
flow of pure water (PW) and in vitro blood (haematocrit up to 17%) in a 100-mm-square microchannel. All the measurements were made
in the middle plane of the microchannel at a constant flow rate and low Reynolds number (Re ¼ 0.025). The averaged ensemble velocity
profiles were found to be markedly parabolic for all the working fluids studied. When comparing the instantaneous velocity profiles of
the three fluids, our results indicated that the profile shape depended on the haematocrit. Our confocal micro-PIV measurements
demonstrate that the root mean square (RMS) values increase with the haematocrit implying that it is important to consider the
information provided by the instantaneous velocity fields, even at low Re. The present study also examines the potential effect of the
RBCs on the accuracy of the instantaneous velocity measurements.
r 2007 Elsevier Ltd. All rights reserved.
Keywords: Microcirculation; Confocal micro-PIV; Instantaneous velocity profiles; Haematocrit; Red blood cells
1. Introduction
The velocity profiles of blood flow in vivo and in vitrohave been measured using several techniques, includingdouble-slit photometry (Gaehtgens et al., 1970; Baker andWayland, 1974), video microscopy and image analysis(Bugliarello and Hayden, 1963; Tangelder et al., 1986;Parthasarathi et al., 1999), laser-Doppler anemometry(Einav et al., 1975; Born et al., 1978; Cochrane et al.,1981; Uijttewaal et al., 1994, Golster et al., 1999), andparticle-measuring methods (Sugii et al., 2002, 2005;Nakano et al., 2003, 2005; Jeong et al., 2007). Nevertheless,no general consensus yet exists concerning the actualvelocity profile in microvessels. While some studies havereported parabolic profiles (Baker and Wayland, 1974;
e front matter r 2007 Elsevier Ltd. All rights reserved.
iomech.2007.01.012
ing author. Tel.: +8122 7956958; fax: +81 22 7956959.
ess: [email protected] (R. Lima).
Golster et al., 1999; Sugii et al., 2005), others havesuggested blunt profiles (Bugliarello and Hayden, 1963;Tangelder et al., 1986; Nakano et al., 2003); still othershave reported blunt profiles at extremely low velocities anddiameters and parabolic profiles at diameters exceeding100 mm (Gaehtgens et al., 1970; Cochrane et al., 1981).Thus, further research is needed on the influence of flowparameters on the blood flow velocity profiles in micro-vessels.Due to its outstanding spatial filtering technique and
multiple point light illumination system, confocal micro-particle image velocimetry (micro-PIV) (Tanaani et al.,2002; Park et al., 2004; Kinoshita et al., 2005; Park andKihm, 2006; Lima et al., 2006a) has become accepted as areliable method for measuring velocity profiles with highspatial resolution. Very recently, we demonstrated theability of confocal micro-PIV to measure both homoge-neous and nonhomogeneous fluids (Lima et al., 2006a).

ARTICLE IN PRESSR. Lima et al. / Journal of Biomechanics 40 (2007) 2752–2757 2753
The present study compared the instantaneous andensemble velocities profiles of pure water and blood flowin vitro. The velocity profiles of both pure water and invitro blood with two different haematocrits (9 and17%Hct) were acquired in the centre plane of a 100-mmsquare microchannel.
2. Materials and methods
2.1. Working fluids and microchannel
This study examined three working fluids: pure water (PW) and physio-
logical saline (PS) containing 9% (9Hct) or 17% (17Hct) human red blood
cells (RBCs). All the fluids were seeded with 0.15% (by volume) 1-mm-
diameter red fluorescent solid polymer microspheres (R0100; Duke Scientific,
Palo Alto, CA, USA). The blood used was collected from a healthy adult
volunteer, and ethylenediaminetetraacetic acid (EDTA) was added to prevent
coagulation. The RBCs were separated from the bulk blood by centrifugation
(1500 rpm for 20min) and the plasma and buffy coat were removed by
aspiration. The washing and centrifuging with PS was repeated twice. The
remaining RBCs were then resuspended in PS to make up the required RBC
concentration by volume. The haematocrit of the two RBC suspensions used
in this study was about 9% (9Hct) and 17% (17Hct), respectively. All the
blood samples were stored hermetically at 4 1C until the experiment was
performed at room temperature (25–27 1C).
In this study, we used a 100-mm-square borosilicate glass microchannel
fabricated by Vitrocom (Mountain Lakes, NJ, USA), which was mounted
on a glass slide immersed in glycerol that had the same refractive index. A
square microchannel was selected to minimise possible refraction of the
laser beam at the walls of the microchannel. Using a glass tube, the
refraction arising from the curved walls would be more pronounced and
might degrade the measured velocity fields.
2.2. Experimental setup
The confocal micro-PIV system we used consisted of an inverted
microscope (IX71; Olympus, Tokyo, Japan) combined with a confocal
scanning unit (CSU22; Yokogawa Corporation, Tokyo, Japan) and a
diode-pumped solid-state (DPSS) continuous wave (CW) laser (Laser
Quantum, Stockport, UK) with an excitation wavelength of 532 nm. A
high-speed camera (Phantom v7.1; Vision Research, Wayne, NJ, USA)
was connected to the outlet port of the CSU22. The microchannel was
placed on the stage of an inverted microscope and the flow rate (Q) of the
working fluids was kept constant at 0.15ml/min using a syringe pump (KD
Scientific, Holliston, MA, USA), corresponding to a Reynolds number
(Re) of 0.025.
The laser beam was illuminated from below the microscope stage
through a 20� objective dry lens with a numerical aperture (NA) equal to
0.75. Satisfactory illumination was achieved by seeding 1-mm-diameter
fluorescent particles that absorb green light (absorbance peak 542nm) and
emit red light (emission peak 612 nm). The light emitted from the
fluorescent flowing particles passes through a colour filter into the CSU22
scanning unit, where it is reflected onto a high-speed camera using a
dichromatic mirror to record the PIV images.
In order to obtain adequate quality images for processing with the PIV
software (PivView; PivTec GmbH, Gottingen, Germany), we captured
images with a resolution of 640� 480 pixels and 12-bit greyscale, at a rate
of 200 frames/s, with an exposure time of 4995ms, and a time interval (Dt)
of 5 and 10ms between two images. All the PIV measurements were
performed for a period of approximately 0.5 s in order to obtain both
instantaneous and ensemble averaged velocities. After recording the
images, they were digitised and transferred to a computer for evaluation
using Phantom camera control software (PH607). The PIV images of the
flowing particles were processed and the flow velocity was determined
using PivView version 2.3 (Raffel et al., 1998). The images were evaluated
using a cross-correlation method in which the time between two images
was set to 5 and 10ms for all working fluids. Using a multiple-pass
interrogation algorithm with a 24� 16 pixel interrogation window (50%
overlap), which corresponds to a spatial resolution of 28.24� 18.83mm, it
was possible to obtain the corresponding instantaneous and ensemble
velocity fields. A full description and evaluation of the confocal micro-PIV
system used in this study can be found in Lima et al. (2006a).
3. Results and discussion
3.1. Ensemble velocity profiles
Most previous studies have determined the velocityprofiles of flowing blood by measuring the time-averagedvelocity field. Fig. 1(a) and (b) shows the averaged velocityof 100 (Dt ¼ 5ms) and 50 (Dt ¼ 10ms) ensemble PIVimages, respectively. These images were recorded at thesame time period of approximately 0.5 s. Fig. 1 alsocompares the PIV measurements with an analyticalsolution for steady flow through a long, straight, rigidsquare microchannel (see Lima et al., 2006a for moredetails).Comparing the ensemble velocity profiles of all fluids
(see Fig. 1), we observed small deviations (o5%) for bothDt ¼ 5 and 10ms, especially in the central region of thevelocity profile. Using the t-test analysis we found nosignificant difference between the working fluids and theanalytical solution at 98% confidence interval. Hence,these results imply that the ensemble-averaged velocityprofiles of in vitro blood with haematocrits up to 17%flowing within a 100-mm square microchannel do notchange significantly from a parabolic shape. These resultsagree with Baker and Wayland (1974) and Sugii et al.(2005). Furthermore, from the ensemble-averaged velocityprofiles for both Dt ¼ 5 and 10ms the average deviationwas estimated to be 2% for PW and 17%Hct and 5% for9%Hct. On comparing the results from both Dt we foundno significant difference between Dt ¼ 5 and 10ms at 98%confidence interval. These results suggest that for bothcases it is possible to obtain reliable ensemble-averagedvelocity profiles for all the working fluids used in this study.
3.2. Instantaneous velocity profiles and root mean square
(RMS)
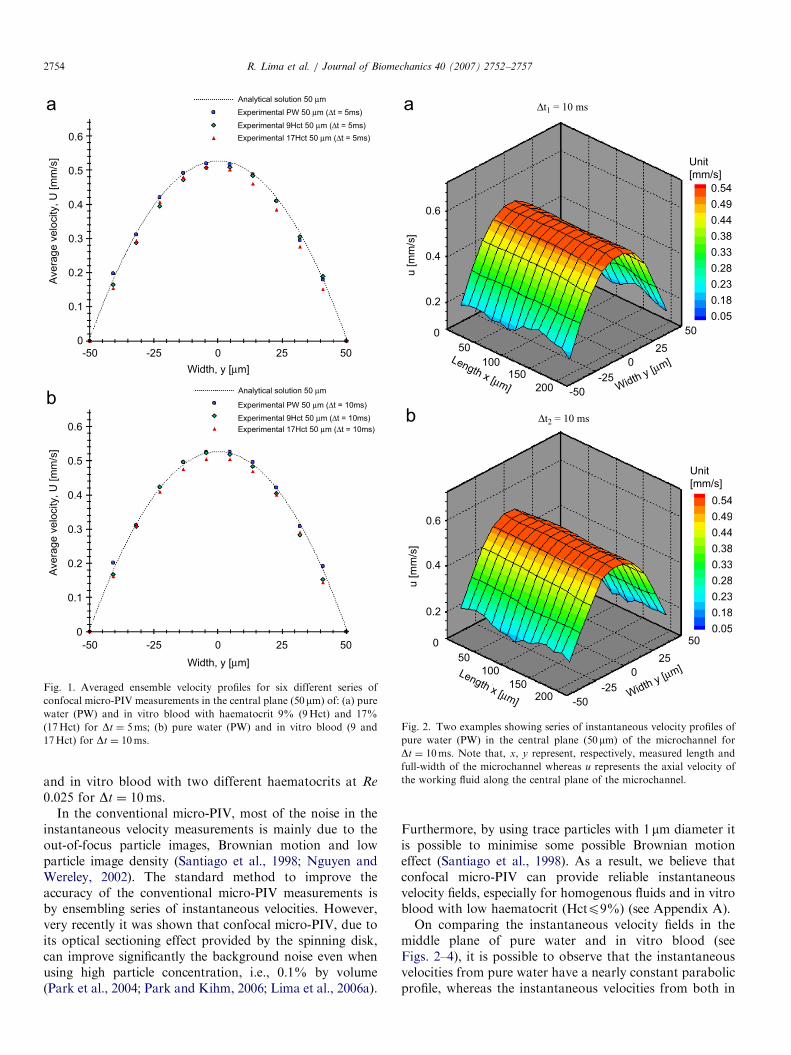
A remarkable advantage of the PIV measuring techniqueover conventional methods, such as double-slit photometryor laser–Doppler anemometry, is its ability to obtaindetailed information on the fluid flow behaviour from theevaluation of the instantaneous velocity fields. Althoughthese velocity fields are extremely important for flows withhigh Re in which turbulent flow fields are likely to occur(Meinhart et al., 2000a; Bates et al., 2001; Heise et al.,2004), we believe that instantaneous velocities are alsocrucial for evaluating several phenomena in steady flows,especially for complex fluids containing suspended bloodcells in plasma. In this way, Figs. 2–4 show the first timeseries of the instantaneous velocity profiles of pure water
ARTICLE IN PRESS
Δt1 = 10 ms
0.6
0.4
0.2
0
u [m
m/s
]
50
100150
200
Length x [μm] -50
-25
0
25
50
Width y [μm]
Unit
[mm/s]
0.54
0.49
0.44
0.38
0.33
0.28
0.23
0.18
0.05
0.6
0.4
0.2
0
u [m
m/s
]
50
100
150200
Length x [μm] -50
-25
0
25
50
Width y [μm]
Unit
[mm/s]
0.54
0.49
0.44
0.38
0.33
0.28
0.23
0.18
0.05
Δt2 = 10 ms
a
b
Fig. 2. Two examples showing series of instantaneous velocity profiles of
pure water (PW) in the central plane (50mm) of the microchannel for
Dt ¼ 10ms. Note that, x, y represent, respectively, measured length and
full-width of the microchannel whereas u represents the axial velocity of
the working fluid along the central plane of the microchannel.
0.6
0.5
0.4
0.3
0.2
0.1
0
Ave
rag
e v
elo
city,
U [
mm
/s]
0.6
0.5
0.4
0.3
0.2
0.1
0
Ave
rag
e v
elo
city,
U [
mm
/s]
-50 -25 0 25 50
Width, y [μm]
-50 -25 0 25 50
Width, y [μm]
Analytical solution 50 μm
Experimental PW 50 μm (Δt = 5ms)
Experimental 9Hct 50 μm (Δt = 5ms)
Experimental 17Hct 50 μm (Δt = 5ms)
Analytical solution 50 μm
Experimental PW 50 μm (Δt = 10ms)
Experimental 9Hct 50 μm (Δt = 10ms)
Experimental 17Hct 50 μm (Δt = 10ms)
a
b
Fig. 1. Averaged ensemble velocity profiles for six different series of
confocal micro-PIV measurements in the central plane (50mm) of: (a) pure
water (PW) and in vitro blood with haematocrit 9% (9Hct) and 17%
(17Hct) for Dt ¼ 5ms; (b) pure water (PW) and in vitro blood (9 and
17Hct) for Dt ¼ 10ms.
R. Lima et al. / Journal of Biomechanics 40 (2007) 2752–27572754
and in vitro blood with two different haematocrits at Re
0.025 for Dt ¼ 10ms.In the conventional micro-PIV, most of the noise in the
instantaneous velocity measurements is mainly due to theout-of-focus particle images, Brownian motion and lowparticle image density (Santiago et al., 1998; Nguyen andWereley, 2002). The standard method to improve theaccuracy of the conventional micro-PIV measurements isby ensembling series of instantaneous velocities. However,very recently it was shown that confocal micro-PIV, due toits optical sectioning effect provided by the spinning disk,can improve significantly the background noise even whenusing high particle concentration, i.e., 0.1% by volume(Park et al., 2004; Park and Kihm, 2006; Lima et al., 2006a).
Furthermore, by using trace particles with 1mm diameter itis possible to minimise some possible Brownian motioneffect (Santiago et al., 1998). As a result, we believe thatconfocal micro-PIV can provide reliable instantaneousvelocity fields, especially for homogenous fluids and in vitroblood with low haematocrit (Hctp9%) (see Appendix A).On comparing the instantaneous velocity fields in the
middle plane of pure water and in vitro blood (seeFigs. 2–4), it is possible to observe that the instantaneousvelocities from pure water have a nearly constant parabolicprofile, whereas the instantaneous velocities from both in

ARTICLE IN PRESS
Δt1 = 10 ms
0.6
0.4
0.2
0
u [m
m/s
]
50
100150
200
Length x [μm] -50
-25
0
25
50
Width y [μm]
Unit
[mm/s]
0.54
0.49
0.44
0.38
0.33
0.28
0.23
0.18
0.05
0.6
0.4
0.2
0
u [m
m/s
]
50
100
150200
Length x [μm] -50
-25
0
25
50
Width y [μm]
Unit
[mm/s]
0.54
0.49
0.44
0.38
0.33
0.28
0.23
0.18
0.05
Δt2 = 10 ms
a
b
Fig. 3. Two examples showing series of instantaneous velocity profiles of
in vitro blood with a 9% (9Hct) haematocrit in the central plane of the
microchannel for Dt ¼ 10ms.
Δt1 = 10 ms
0.6
0.4
0.2
0
u [
mm
/s]
50
100150
200
Length x [μm] -50
-25
0
25
50
Width y [μm]
Unit
[mm/s]
0.54
0.49
0.44
0.38
0.33
0.28
0.23
0.18
0.05
0.6
0.4
0.2
0
u [
mm
/s]
50100
150200
Length x [μm] -50
-25
0
25
50
Width y [μm]
Unit
[mm/s]
0.54
0.49
0.44
0.38
0.33
0.28
0.23
0.18
0.05
Δt2 = 10 ms
a
b
Fig. 4. Two examples showing series of instantaneous velocity profiles of
in vitro blood with a 17% (17Hct) haematocrit in the central plane of the
microchannel for Dt ¼ 10ms.
R. Lima et al. / Journal of Biomechanics 40 (2007) 2752–2757 2755
vitro blood show some irregularities on the velocityprofiles. However, these instantaneous velocity profilesare only qualitative observations which needed to bequantified in order to understand the possible causes of thefluctuations encountered on the in vitro blood instanta-neous velocity profiles (see Figs. 3 and 4).
In an attempt to elucidate the possible causes of thesefindings we have calculated the RMS which can bedetermined from the ensemble averaging of the instanta-neous velocity measurements. To calculate the RMS wefirst need to determine the standard deviation of both u andv components of the velocity at each grid point for a seriesof N frames using the following equations:
mean velocity components:
u ¼1
N
XN
i¼1
ui, (1)
v ¼1
N
XN
i¼1
vi, (2)
standard deviation of u and v components:
su ¼
ffiffiffiffiffiffiffiffiffiffiffiffiffiffiffiffiffiffiffiffiffiffiffiffiffiffiffiffiffiffiffiffiffiffiffiffiffiffiffiXN
i¼1
ðui � uÞ2=N � 1
vuut , (3)

ARTICLE IN PRESSR. Lima et al. / Journal of Biomechanics 40 (2007) 2752–27572756
sv ¼
ffiffiffiffiffiffiffiffiffiffiffiffiffiffiffiffiffiffiffiffiffiffiffiffiffiffiffiffiffiffiffiffiffiffiffiffiffiffiffiXN
i¼1
ðvi � vÞ2=N � 1
vuut . (4)
After calculating both su and sv, RMS can be estimatedby
RMS ¼ffiffiffiffiffiffiffiffiffiffiffiffiffiffiffiffis2u þ s2v
q. (5)
In Fig. 5 the averaged RMS values for the three workingfluids at two different Dt are plotted as a function of themicrochannel width.
On comparing the RMS values with different Dt it ispossible to observe that by increasing the time intervalbetween two images the RMS decreases about 50% for PW
RMS PW 50μm (Δt = 5ms)
RMS 9Hct 50μm (Δt = 5ms)
RMS 17Hct 50μm (Δt = 5ms)
0.12
0.11
0.1
0.09
0.08
0.07
0.06
0.05
0.04
0.03
0.02
0.01
RM
S [
mm
/s]
-50 -25 0 25 50
Width, y [μm]
RMS PW 50μm (Δt = 10ms)
RMS 9Hct 50μm (Δt = 10ms)
RMS 17Hct 50μm (Δt = 10ms)
0.12
0.11
0.1
0.09
0.08
0.07
0.06
0.05
0.04
0.03
0.02
0.01
RM
S [
mm
/s]
-50 -25 0 25 50
Width, y [μm]
a
b
Fig. 5. Comparison of the RMS values for pure water (PW) and in vitro
blood with haematocrits of 9% (9Hct) and 17% (17Hct) with (a)
Dt ¼ 5ms, (b) Dt ¼ 10ms.
and 9%Hct and 25% for 17%Hct. Therefore, usingDt ¼ 10ms the accuracy of the instantaneous velocitymeasurements are improved implying that the correspon-dent RMS values may represent a more reliable qualitativeinformation about the time-dependent behaviour of theflow. Moreover, on comparing the RMS values from all theworking fluids we have found that there is a significantdifference between PW, 9 and 17%Hct at 90% confidenceinterval, except for some values near the wall (see Fig. 5).Despite the inclusion of some bias errors in the RMSvalues (see Appendix A), these results show clearly that theRMS increases with the haematocrit. We believe that theRMS values are strongly related to the fluctuationsencountered in the instantaneous velocity profiles shownin Figs. 3 and 4. The reasons for these small fluctuationsare still not completely clear, however, from the visualisa-tion of the RBCs motion through the microchannel, bothrotational and tumbling motion and also the interactionbetween the neighbouring RBCs seem to be importantfactors to take into account. An ongoing study to clarifythe effect of the RBCs on the plasma flow is currentlyunder way.It should be noted that for haematocrits of about 17%
we have observed some small random ‘‘plasma pockets’’without particles in the PIV images which have createdvelocity vectors with small magnitudes mainly due tothe light scattered and absorbed from the high concen-tration of RBCs within the plasma flow. Therefore, theRMS values for Hct ¼ 17% contains quantitative informa-tion about not only the effect of the RBCs on theplasma flow but also some bias errors (see Appendix A).One way to overcome this limitation is by increasing theparticles concentration within the plasma or by using arectangular microchannel with low aspect ratio whichcreates an uniform distribution of RBCs (Lima et al.,2006b).
4. Conclusions
In this study, we determined both ensemble andinstantaneous velocity profiles for in vitro blood (haema-tocrit up to 17%) flowing through a 100-mm-squaremicrochannel. Although the ensemble velocity profileswere markedly parabolic, some fluctuations in the instan-taneous velocity profiles were found to be closely related tothe increase in the haematocrit. The present study showsclearly that the RMS values increase with the haematocritimplying that the presence of RBCs within the plasma flowstrongly influences the measurements of the instantaneousvelocity fields. The possible reasons for the RMS increaseare the motion and interaction of RBCs and the lightscattered and absorbed from the RBCs. This latter causeseems to be more predominant at Hct ¼ 17%. As a result,for 17%Hct improvements on the signal-to-noise ratio arerequired to further enhance the measurement performanceof the instantaneous velocities.

ARTICLE IN PRESSR. Lima et al. / Journal of Biomechanics 40 (2007) 2752–2757 2757
Acknowledgements
This study was supported in part by the following grants:International Doctoral Program in Engineering from theMinistry of Education, Culture, Sports, Science andTechnology of Japan (MEXT), ‘‘Revolutionary SimulationSoftware (RSS21)’’ next-generation IT program of MEXT;Grants-in-Aid for Scientific Research from MEXT andJSPS Scientific Research in Priority Areas (768) ‘‘Biome-chanics at Micro- and Nanoscale Levels,’’ ScientificResearch (A) no. 16200031 ‘‘Mechanism of the formation,destruction, and movement of thrombi responsible forischemia of vital organs’’. The authors would like to thankDr. Takuji Ishikawa for his valuable suggestions anddiscussion.
Appendix A. Supplementary data
Supplementary data associated with this article can befound, in the online version; at doi:10.1016/j.jbiomech.2007.01.012.
References
Bates, C., O’Doherty, D., Williams, D., 2001. Flow instabilities in a graft
anstomosis: a study of instantaneous velocity fields. Proceedings of the
Institution of Mechanical Engineers Part H 215, 579–587.
Baker, M., Wayland, H., 1974. On-line volume flow rate and velocity
profile measurement for blood in microvessels. Microvascular Re-
search 7, 131–143.
Born, G., Melling, A., Whitelaw, J., 1978. Laser Doppler microscope for
blood velocity measurement. Biorheology 15, 163–172.
Bugliarello, G., Hayden, J., 1963. Detailed characteristics of the flow of
blood in vitro. Transactions of The Society Rheology 7, 209–230.
Cochrane, T., Earnshaw, J., Love, A., 1981. Laser Doppler measurement
of blood velocity in microvessels. Medical and Biological Engineering
and Computing 19, 589–596.
Einav, S., Berman, R., Fuhro, P., DiGiovanni, P., Fine, S., Fridman, J.,
1975. Measurement of velocity profiles of red blood cells in the
microcirculation by laser Doppler anemometry (LDA). Biorheology
12, 207–210.
Gaehtgens, P., Meiselman, H., Wayland, H., 1970. Velocity profiles of
human blood at normal and reduced hematocrit in glass tubes up to
130m diameter. Microvascular Research 2, 13–23.
Golster, H., Linden, M., Bertuglia, S., Colantuoni, A., Nilsson, G.,
Sjoberg, F., 1999. Red blood cell velocity and volumetric flow
assessment by enhanced high-resolution laser Doppler imaging in
separate vessels of hamster cheek pouch microcirculation. Micro-
vascular research 58, 62–73.
Heise, M., Schmidt, S., Kruger, U., Ruckert, R., Rosler, S., Neuhaus, P.,
Settmacher, U., 2004. Flow pattern and shear stress distribution of
distal end-to-side anastomoses. A comparison of instantaneous
velocity fields obtained by particle image velocimetry. Journal of
Biomechanics 37, 1043–1051.
Jeong, J.H., Sugii, Y., Minamiyama, M., Takeuchi, H., Okamoto, K.,
2007. Interaction between liposomes and RBC in microvessels in vivo.
Microvascular Research 73, 39–47.
Kinoshita, H., Oshima, M., Kaneda, S., Fujii, T., 2005. Confocal micro-
PIV measurement of internal flow in a moving droplet. In: Proceedings
of the Ninth International Conference on Miniaturized Systems for
Chemistry and Life Sciences. Boston, MA, USA.
Lima, R., Wada, S., Tsubota, K., Yamaguchi, T., 2006a. Confocal micro-
PIV measurements of three dimensional profiles of cell suspension flow
in a square microchannel. Measurement Science and Technology 17,
797–808.
Lima, R., Wada, S.,Tanaka, S., Takeda, M., Tsubota, K., Ishikawa T.,
Yamaguchi, T., 2006b. Velocity measurements of blood flow in a
rectangular PDMS microchannel assessed by confocal micro-PIV
system. In: Proceedings of the World Congress on Medical Physics and
Biomedical Engineering. Seoul, pp. 278–281.
Meinhart, C., Wereley, S., Santiago, J., 2000. A PIV algorithm for
estimating time-averaged velocity fields. Journal of Fluids Engineering
122, 285–289.
Nakano, A., Sugii, Y., Minamiyama, M., Niimi, H., 2003. Measure-
ment of red cell velocity in microvessels using particle image
velocimetry (PIV). Clinical Hemorheology and Microcirculation 29,
445–455.
Nakano, A., Sugii, Y., Minamiyama, M., Seki, J., Niimi, H., 2005.
Velocity profiles of pulsatile blood flow in arterioles with bifurcation
and confluence in rat mesnetery measured by particle image
velocimetry. JSME International Journal C 48 (4), 444–452.
Nguyen, N., Wereley, S., 2002. Fundamentals and Applications of
Microfluidics. Artech House Inc., Norwood, MA, USA.
Park, J., Choi, C., Kihm, K., 2004. Optically sliced micro-PIV using
confocal laser scanning microscopy (CLSM). Experiments in Fluids
37, 105–119.
Park, J., Kihm, K., 2006. Use of confocal laser scanning microscopy
(CLSM) for depthwise resolved microscale-particle image velocimetry
(m-PIV). Optics and Lasers in Engineering 44, 208–223.
Parthasarathi, A., Japee, S., Pittman, R., 1999. Determination of red
blood cell velocity by video shuttering and image analysis. Annals of
Biomedical Engineering 27, 313–325.
Raffel, M., Willert, C., Kompenhans, J., 1998. Particle Image Veloci-
metry: A Practical Guide. Springer, Germany.
Santiago, J., Wereley, S., Meinhart, C., Beebe, D., Adrian, R., 1998. A
particle image velocimetry system for microfluidics. Experiments in
Fluids 25, 316–319.
Sugii, Y., Nishio, S., Okamoto, K., 2002. In vivo PIV measurement of red
blood cell velocity field in microvessels considering mesentery motion.
Physiological Measurement 23, 403–416.
Sugii, Y., Okuda, R., Okamoto, K., Madarame, H., 2005. Velocity
measurement of both red blood cells and plasma of in vitro blood flow
using high-speed micro PIV technique. Measurement Science and
Technology 16, 1126–1130.
Tangelder, G., Slaaf, D., Muijtjens, M., Arts, T., Egbrink, M., Reneman,
R., 1986. Velocity profiles of blood platelets and red blood cells
flowing in arteriols of rabbit mesentery. Circulation Research 59,
505–514.
Tanaani, T., Otsuki, S., Tomosada, N., Kosugi, Y., Shimizu, M., Ishida,
H., 2002. High-speed 1-frame/ms scanning confocal microscope with a
microlens and Nipkow disks. Applied Optics 41 (22), 4704–4708.
Uijttewaal, W., Nijhof, E., Heethaar, R., 1994. Lateral migration of blood
cells and microspheres in two-dimensional Poiseuille flow: a laser
Doppler study. Journal of Biomechanics 27, 35–42.