In Vaccines we Trust? The E ects of Anti-vaccine ...Stegmann/MS_Vaccines.pdf · Propaganda on...
44
In Vaccines we Trust? The Effects of Anti-vaccine Propaganda on Immunization: Evidence from Pakistan * Monica Martinez-Bravo CEMFI Andreas Stegmann CEMFI September 12, 2017 The most updated version of the paper can be found here Abstract In July 2011, the Pakistani public unexpectedly learnt that the CIA had conducted a fake vaccination campaign as part of the operations to capture Osama Bin Laden. This episode was extensively used by Taliban groups to discredit the health system and vaccination campaigns. We implement a Difference-in-Differences strategy to document the effect of the disclosure of this information on demand for health services. We use survey data to compare vaccination rates before and after the disclosure of this information, across regions with different levels of electoral support for Islamist groups. Our results suggest that the disclosure of information on the fake vaccination campaign had a substantial negative effect on immunization rates: a one standard deviation increase in support for Islamist groups lead to a 9 to 13% decline in immunization rates over the sample mean. Our results are consistent with the hypothesis that the disclosure of the vaccination ruse eroded the degree of trust in medical services, and consequently, lead parents to actively refuse the use of formal medicine and vaccines, in particular. * We would like to thank Manuel Arellano, Diego Puga, Nancy Qian, Pascaline Dupas, Nathan Nunn, Guillermo Caruana, Jishnu Das, Michael Callen, and, Pamela Campa for valuable suggestions. We also thank seminar participants at NEUDC- 2016, CEMFI PhD workshop, Oxford University, Political Economy of Development Workshop at Warwick University. The present draft is a revised version of the Master’s Thesis presented by Andreas Stegmann in partial fulfillment of the 2013-2015 Master in Economics and Finance at CEMFI. Monica gratefully acknowledges financial support from Ram´on y Cajal Grant (RYC-2013-14307). Monica Martinez-Bravo; email: mmb@cemfi.es. Andreas Stegmann; email: stegmann@cemfi.edu.es. 1
Transcript of In Vaccines we Trust? The E ects of Anti-vaccine ...Stegmann/MS_Vaccines.pdf · Propaganda on...

In Vaccines we Trust? The Effects of Anti-vaccine
Propaganda on Immunization: Evidence from Pakistan∗
Monica Martinez-Bravo
CEMFI
Andreas Stegmann
CEMFI
September 12, 2017
The most updated version of the paper can be found here
Abstract
In July 2011, the Pakistani public unexpectedly learnt that the CIA had conducted
a fake vaccination campaign as part of the operations to capture Osama Bin Laden.
This episode was extensively used by Taliban groups to discredit the health system and
vaccination campaigns. We implement a Difference-in-Differences strategy to document
the effect of the disclosure of this information on demand for health services. We
use survey data to compare vaccination rates before and after the disclosure of this
information, across regions with different levels of electoral support for Islamist groups.
Our results suggest that the disclosure of information on the fake vaccination campaign
had a substantial negative effect on immunization rates: a one standard deviation
increase in support for Islamist groups lead to a 9 to 13% decline in immunization
rates over the sample mean. Our results are consistent with the hypothesis that the
disclosure of the vaccination ruse eroded the degree of trust in medical services, and
consequently, lead parents to actively refuse the use of formal medicine and vaccines,
in particular.
∗We would like to thank Manuel Arellano, Diego Puga, Nancy Qian, Pascaline Dupas, Nathan Nunn, Guillermo Caruana,Jishnu Das, Michael Callen, and, Pamela Campa for valuable suggestions. We also thank seminar participants at NEUDC-2016, CEMFI PhD workshop, Oxford University, Political Economy of Development Workshop at Warwick University. Thepresent draft is a revised version of the Master’s Thesis presented by Andreas Stegmann in partial fulfillment of the 2013-2015Master in Economics and Finance at CEMFI. Monica gratefully acknowledges financial support from Ramon y Cajal Grant(RYC-2013-14307). Monica Martinez-Bravo; email: [email protected]. Andreas Stegmann; email: [email protected].
1

1 Introduction
Trust in the medical sector and on medical products is a key determinant of the demand
for health care. This is specially relevant for the use of vaccines. Because of herd immunity,
it is difficult - if not impossible - to learn about the effectiveness of vaccines based on own
experience. Hence, events that discredit the effectiveness of vaccines or the reputation of
the medical sector, can have dramatic consequences on immunization rates. A well known
example was the publication of an article in 1998 in the medical journal The Lancet linking
autism to the MMR (measles, mumps, and rubella) vaccine. Media reports have associated
this publication with the emergence of the anti-vaccines movement and the recent rise in the
number of unvaccinated children in several countries. As a result, infectious diseases that
were previously eradicated have reemerged in countries like the UK and the US.1
These issues are even more relevant in developing countries, where citizens have lower
levels of education and the low quality of remedial medicine can exacerbate the negative
consequences of infections. In spite of the importance of these issues, we have very limited
empirical evidence on the causal effect of the disclosure of information that damages the
reputation of vaccines on immunization rates and on health outcomes.
In this paper, we exploit a sequence of events that took place in the recent history of
Pakistan and that severely affected the degree to which citizens trusted formal medicine and
vaccines, in particular. As part of the operations to capture Osama Bin Laden in 2011,
the CIA launched a fake vaccination campaign in the city of Abbottabad, Pakistan. The
objective of this operation was to obtain DNA samples of children living in a compound
of Abbottabad where Bin Laden was suspected to hide. This would have allowed the CIA
to obtain definite proof that Bin Laden was hiding there. In July 2011, two months after
the actual capture of Osama Bin Laden, the British newspaper The Guardian published an
article reporting on the vaccine ruse and describing the collaboration of a Pakistani doctor
with the CIA.2
The disclosure of this information caused uproar in Pakistan. The Pakistani Taliban
used this information to intensify their discrediting campaign against formal medicine and
the polio vaccine, in particular. They issued a number of fatwas - religious edicts - in which
they accused health workers of regularly conducting espionage activities for the US3 and
relating polio vaccination campaigns to attempts to sterilize the Muslim population4. While
the Taliban’s campaign to discredit vaccinations can be traced back to the early 2000s,
1See Alazraki (2011).2See Shah (2011).3See Walsh (2012).4See Roul (2014).
2

the disclosure of the vaccination ruse and the actual involvements of Pakistani doctors in
espionage activities lent credibility to the Talibans’ arguments.
We empirically evaluate the effects of the disclosure of the vaccination ruse on immuniza-
tion rates. We use household-level data from several waves of the Pakistani Social Living
Standards Measurement (PSLM) survey. We implement a Difference-in-Differences strat-
egy (DID, henceforth) where we compare immunization rates of children born before and
after the vaccine ruse was disclosed and, across districts with different levels of support for
Islamist political groups. Our underlying assumption is that, on average, parents in districts
with higher support for political Islamist groups will be more likely to change their believes
about vaccines according to the messages spread by the Taliban. As a measure of support
for Islamist groups we use district-level measures of electoral support for Muttahida Majlis-
e-Amal (MMA), which is a coalition of Islamist parties that ran under a single banner in
the 2008 general election.5
Our estimates suggest that the disclosure of the vaccine ruse had substantial effects on
vaccination rates: a one standard deviation increase in the support for Islamist groups leads
to a 9 to 13% larger decline in the likelihood that children have received the first dose of a
number of different vaccines.6
These results are consistent with the hypothesis that the disclosure of the vaccine ruse
damaged the reputation of vaccines, and possibly of the Pakistani formal health system,
more generally. As a result, a larger fraction of parents were hesitant about vaccinations
or decided to refuse to vaccinate their children. Consequently, immunization rates declined.
These effects are stronger in regions where political Islamist groups had higher rates of
support. This is consistent with the idea that individuals ideologically close to the Taliban
were more likely to receive their messages discrediting vaccines and changed their beliefs
accordingly.
There are a number of alternative channels that could also provide an explanation for
these results. For instance, the supply of medical services, such as vaccination drives, may
have endogenously reacted to the disclosure of the vaccine ruse. Starting in mid-2012 the
Taliban carried out attacks and intimidation of health workers.7 While this is a plausible
channel, we believe it cannot account for the entire magnitude of our effects. The intimidation
of health workers only took place about a year after the disclosure of the vaccine ruse, while
we observe a decline in vaccination rates immediately after the disclosure.
We also provide additional evidence that demand of other health services declined after
5The parties that form the MMA coalition have strong ideological and financial connections to the Pak-istani Taliban. See section 2 for further details.
6In particular the effect is 10.6% for polio vaccine, 9.4% for DPT vaccine, and 12.5% for measles vaccine.7See The Express Tribune (2012).
3

the disclosure of the vaccination ruse. We implement a similar DID strategy to show that
parents are less likely to consult health workers when their children get sick.
Our results are highly robust to alternative specifications. In our baseline estimates
on vaccination rates, we include controls for district and month-of-birth fixed effects. The
estimates are robust to controlling for age of the children at time of the survey, month when
the survey was conducted, and a dummy for whether the child lives in a rural area of the
district. We also show that the results are robust to flexibly controlling for baseline level of
health and education conditions in the district interacted with cohort fixed effects.
This paper is related to a number of different literatures. First, the paper relates to the
recent literature on the demand for health care in developing countries. See Dupas (2011) as
well as Banerjee and Duflo (2012) for two literature reviews. These studies document that
the poor tend to exhibit low levels of demand for highly effective preventive care, such as
vaccines. While the reasons are varied, in some cases the poor seem to have incorrect believes
about the effectiveness of preventive treatments. Misconceptions about the effectiveness of
vaccines and the concerns over potential side effects are also prevalent in developed countries.
However, the problem is exacerbated in developing countries that do not have well-established
organizations that certify treatments and that enjoy a good reputation, such as the Food
and Drugs Administration in the US or the European Medicines Agency.
In spite of the importance of the role of trust on demand for health services, the empirical
evidence documenting the causal effect of events that damage the reputation of the heath
care system are scarce. Das and Das (2003) examine the determinants of the demand for
vaccination in a case study from one Indian village. In this village, vaccination rates sharply
declined after two mothers died while in labor. The authors argue that the deaths of these
two mothers lead to a decrease in the level of trust in the local midwife. Since the local
midwife is also in charge of delivering vaccines, the authors argue that it is likely that
parents started distrusting the midwife’s recommendation to vaccinate their children, after
the two mothers passed away.
Our study also relates to the recent paper on the effects of the disclosure of the Tuskegee
experiment (Alsan and Wanamaker, 2016). For forty years a number of black males in
Tuskegee, Alabama were purposely untreated from syphilis with the objective of studying
the long-term effects of the disease. The paper documents that the disclosure of the Tuskegee
study in 1972 was associated with a decline in medical utilization and with negative health
outcomes for black males living in states close to Tuskegee. The authors argue that the
effects are driven by the fact that black males identified more closely with the subjects of
the Tuskegee experiment and, consequently, developed lower levels of trust in healthcare
institutions.
4

Our paper complements this work and also differs from it in a number of ways. First,
our evidence exploits a recent event that damaged the reputation of the healthcare sector
in a very different context: contemporaneous Pakistan. Hence, it highlights that the role
of trust in the effectiveness of the delivery of health services is a current and pressing issue
for developing countries. Second, we focus on the effects on vaccination rates. Given the
inherent difficulties in inferring the effectiveness of vaccines based on own-experience, shocks
to the reputation of vaccines can be specially damaging. Third, instead of distance to the
onset of the event, or demographic characteristics, we exploit ideological proximity to the
Taliban. The Taliban had an on-going defamation campaign against vaccination efforts.
Hence, it is likely that the cross sectional variation that we exploit is closely connected
to exposure to information discrediting vaccination campaigns and to the likelihood that
individuals updated their beliefs based on the new information.
This paper is also related to the literature that examines the effect of persuasive commu-
nication on behavior. See Della Vigna and Gentzkow (2010) for a literature review. While a
large literature has documented the effect of advertising campaigns and media exposure on
consumer and voting behavior, to the best of our knowledge, no study has documented the
effects of propaganda campaigns against vaccines on immunization rates.
Finally, the paper also relates to the delivery of health services in Pakistan and the
determinants of attitudes of Anti-Americanism (Bursztyn et al. 2016; Andreoni et al. 2016)
The remainder of the paper is organized as follows. Section 2 provides background
information on the context of political and health system of Pakistan. Section 3 presents
the data used in the analysis. Sections 4 presents the empirical strategy. Section 5 discusses
the main results. Section 6 discusses evidence on the mechanism. Section 7 concludes.
2 Background
2.1 The Vaccine Ruse
In the summer of 2010, the CIA obtained information that Bin Laden could be hiding in a
compound located in the city of Abbottabad, Pakistan. During the following months, the
CIA surveilled the compound in a number of different ways, such as via satellite images
and from a nearby safe house. Before launching an operation that would entail invading the
territory of Pakistan, a critical ally of the US in the region, the CIA wanted to obtain definite
proof that Bin Laden was hiding in the compound. For this purpose the CIA organized a
fake vaccination campaign. The main objective of the vaccination ruse was to obtain DNA
samples of children living in the compound and compare them to the DNA of Bin Laden’s
5

sister, who died in Boston in 2010. Obtaining a proof that the children were related to Bin
Laden would have been telling evidence that Bin Laden was hiding in the compound (Shah,
2011).
To conduct the fake vaccination campaign, the CIA recruited a senior Pakistani doctor,
Dr. Shakil Afridi. The doctor, in turn, hired low-ranked health workers, who were unaware
of the CIA involvement in the operation. Bypassing the official Abottabad health services, in
March 2011, Dr. Afridi began a vaccination campaign for hepatitis B in a poor neighborhood
of the city. In April 2011, the team moved to Bilal Town, a rich suburb of the city, where
the suspected compound was located. Allegedly, one of the nurses gained access to the
compound. However, whether the operation succeeded in obtaining DNA samples of children
in the compound is still unclear.
On the 2nd of May 2011, U.S. special forces carried out a targeted attack on the compound
resulting in the killing of Osama Bin Laden.
A few months later, on July 11th of 2011, the British newspaper The Guardian published
an article describing the vaccine ruse.8 The article described the collaboration of Dr. Afridi
with the CIA and the attempts of health workers to obtain DNA samples from children
living in the suspected compound during the vaccine ruse.9
The involvement of health personnel in the operations to capture Osama Bin Laden
was intensely criticized, both in the US as well as in other countries.10 In January 2013,
the deans of twelve leading public health schools sent an open letter to President Obama
protesting against the use of vaccination programs in espionage activities (Johns Hopkins
Bloomberg School of Public Health News, 2013). In response to these critiques, on May 2014,
the White House announced that the CIA had pledged not to use vaccination programs to
gather intelligence or genetic material.
8See Shah (2011).9In January 2012, the U.S. Defense Secretary at that time, Leon E. Panetta, publicly confirmed that the
Pakistani doctor Shakil Afridi had collaborated with the CIA to gather intelligence in the city of Abbottabad(Mazetti, 2012). Shakil Afridi was arrested shortly after the operation to kill Bin Laden had been concluded.He was accused of conspiracy against the state and sentenced to serve 33 years in jail on the 23rd of May2012 (Boone, 2012)
10Some of these reactions were described in an article published in 2013 in the Scientific American Maga-zine. For instance, Leslie F. Roberts, Professor of Columbia University’s Mailman School of Public Healthargued “Forevermore, people would say this disease, this crippled child is because the U.S. was so crazy toget Osama bin Laden.” (Scientific American, 2013).
6

2.2 Pakistan Political Context and Reaction to the Vaccination
Ruse
Pakistan is divided into four provinces, three territories, and the capital city of Islamabad.
Our study focuses on the four provinces of Balochistan, Khyber Pakhtunkhwa, Punjab, and
Sindh.11 Provinces are divided in districts. In the year 2013, the four provinces of Pakistan
had 114 districts in total. Districts are themselves subdivided into tehsils.
Pakistan is a federal parliamentary democracy which had held regular election since the
end of the Musharraf regime in 2008. Legislative elections take place every five years. Since
2008, two main political forces have been alternating in power: first, the Pakistan Peoples
Party (PPP) a center-left political party founded by Zufilkar Ali Bhutto and currently led by
Yousaf Gillani; second, the Pakistan Muslim League (N) (PML (N)) a right-wing nationalistic
party led by Nawaz Sharif, the current prime minister of Pakistan.
A number of smaller political parties have also contested elections in Pakistan. Fore-
most among them is an alliance of six Islamist parties known as Muttahida Majlis-e-Amal
(MMA).12 This alliance was established in 2002 in direct opposition to Pakistan’s support
to the US-led invasion of Afghanistan. All of the parties organized within the MMA are Is-
lamist in nature. The three largest and most influential parties13 strongly emphasize Islamist
moral and principles in every day life. They preach a hard-line and traditional Islamic way
of thinking that is shared by the Pashtuns living along the Pakistani-Afghan border. These
political groups all have historical and ethnic links with the Afghan Taliban, as they are all
Pashtun, which is Afghanistan’s largest and Pakistan’s second largest ethnic group.14
Several authors have documented the close connections between some of the parties that
form MMA and the Pakistani-Taliban. Norell (2007) documents a vast amount of political,
financial and ideological connections between members of the individual parties contained in
the MMA and the Afghan Taliban and other militant groups operating in the FATA where
the Pakistani Taliban were founded.
11We exclude from the study the Federally Administered Tribal Areas, also known as FATA. This regionis semi-autonomous and has never been under the full control of the Pakistani government. We also ex-clude from the sample the semi-autonomous territories of Gilgit-Baltistan and Azad Kashmir because theyexperience the long-standing conflict with India for the overall Kashmir region. No data on vaccinations areavailable for these regions. Finally we exclude the capital city of Islamabad because it constitutes a large cityand operates very differently from the rest of the country. The four provinces in our sample cover 96.47%of the current undisputed territory of Pakistan and contain 97.35% of its population. See section 9 in theOnline Appendix for further details on the Data.
12In particular, the Jamiat Ulema-e-Pakistan (JUP), the Jamiat Ulema-e-Islam-Fazl (JUI-F), the JamiatUlema-e-Islam (JUI-S), Jamiat-e-Ahle Hadith, Pakistan Isami Tehrik (ITP) (formerly Tehriq-e-Jafaria (TeJ))and the Jamaat-e-Islami (JI).
13JUI-F, the JUI-S and the JI.14See Norell (2007).
7

Islamist extremists groups have tried to discredit formal medicine and vaccines on mul-
tiple occasions. In Pakistan, the Taliban groups have actively engaged in propaganda cam-
paigns, which questioned the effectiveness and safety of vaccines since the early 2000s. Start-
ing in 2006 the Taliban leader Maulana Fazlullah criticized Western lifestyles and polio vac-
cination drives during illegal radio shows and Friday prayers in local mosques. He claimed
that the polio eradication campaign was part of a “conspiracy of Jews and Christians to
make Muslims impotent and stunt the growth of Muslims”. Even before the disclosure of
the vaccine ruse, the Taliban accused polio-vaccination campaigns of being part of Western
espionage against the Muslim community (Roul, 2014). The Taliban have also argued that
vaccines should be avoided because they were imported and because it is un-Islamic to “take
a medicine before the disease [is contracted.]”15
It is likely that the disclosure of the fake vaccination campaign conducted by the CIA
during the operations to capture Bin Laden lent credibility to the Taliban’s arguments against
vaccines. The Taliban took advantage of this by intensifying their propaganda campaign
against vaccines after the disclosure. They issued a number of religious edicts (fatwas),
directly linking the on-going vaccination campaigns to espionage activities. For instance,
they claimed that “polio agents could also be spies as we have found in the case of Dr.
Shakil Afridi has surfaced. Keeping these things in mind we announce to stop the polio
dosage.”16
The Taliban have also exerted violence against vaccination workers. The first attack
happened in July 2012 in the city of Karachi, the capital of Sindh province. In December
2012, coordinated attacks took place in several districts during a national vaccination drive.
Between 2012 and 2014, 56 individuals, mostly female health workers were killed while
collaborating in vaccination drives (Roul, 2014).
2.3 Immunization in Pakistan
Children in Pakistan typically receive three main vaccines at young age through routine im-
munization activities: vaccine against poliomyelitis (or polio vaccine), DPT (vaccine against
diphtheria, pertussis, and tetanus); and measles vaccine. Pakistan follows the recommended
vaccination calendar of the World Health Organization and the first dose of most of these
vaccines is supposed to be administered shortly after birth. See Appendix Table 1 for details
on the immunization calendar.17
15See Nishtar (2009).16See Roul (2014).17The official immunization schedule of Pakistan is published by the Expanded Program on Immunization
(EPI), Pakistan. See Expanded Program on Immunization (EPI), Pakistan (2017)
8

The health workers responsible for immunization of children are Lady Health Workers.
These workers are assigned to a local health facility and each of them is responsible for,
approximately, 1,000 people or 150 homes. They regularly visit households to provide infor-
mation on family planning and to immunize children according to the vaccination schedule.18
The Expanded Program on Immunization of Pakistan (EPI, henceforth) coordinates the
procurement and supply of vaccines, syringes, safety boxes and other logistical needs by
the provinces and other areas to vaccinate the target populations. These EPI activities
are financed by the federal government of Pakistan. Nevertheless, the provinces through
respective EPI programme units are themselves responsible to manage the operational cost
of the immunization activities at the provincial and district levels.
The supply of polio vaccine plays a special role in the EPI activities. Pakistan is one
of the only two countries in the world in which the poliomyelitis virus is still endemic. Im-
munization against polio is supported by the Global Polio Eradication Initiative (GPEI,
henceforth). In conjunction with staff from the WHO, EPI coordinates national as well
as subnational immunization days during which vaccinators (typically lady health workers
joined by other volunteers recruited from different branches of local government, e.g. the
education department) provide the polio vaccine at households’ doorstep. These immuniza-
tion campaigns typically last for 3 days and target all children up to age 5 in the respective
district.
3 Data
Our main data source is the Pakistan Social and Living Standards Measurement (PSLM)
provided by Pakistan’s Bureau of Statistics. These data contain household-level data on
vaccination status of each child living in the household. For our main results we focus on
waves 2010/11 and 2012/13, which cover the events of interest. In some of the robustness
checks we also use the 2008/9 wave.
Our main outcomes correspond to whether a child has received the first dose of the polio,
DPT, or measles vaccine. Focusing on the first dosages provides a tighter prediction of
how the events described in this paper should have affected children of different cohorts.
However, we also present results for full immunization rates — i.e., receiving all dosages
of each vaccine. We record a successful vaccination if the immunization was recorded in
the vaccine card. In order to minimize the scope for misreporting we do not rely on recall
18The Lady Health Worker program was established in 1994 by the federal government. Since 2010, theprovision of health public goods is a provincial responsibility. In 2014, there were, approximately, 110,000lady health workers in Pakistan.
9
measures of vaccinations.19
Our baseline sample records the vaccination status of 22,346 children born between 2010
and 2012 that were up to 24 months old at the time of the interview. These children are
distributed through the 114 districts that conform the four provinces that are part of our
study. See Appendix Table 2 for descriptive statistics of the main sample.
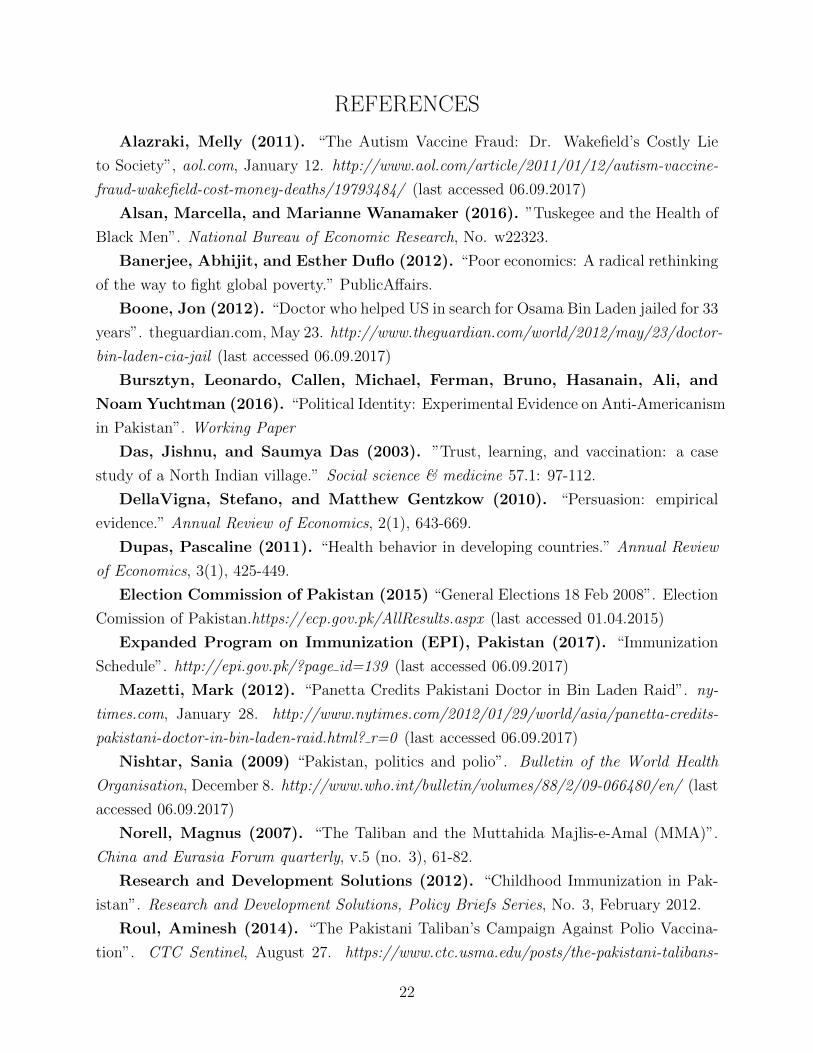
As a measure of support for political Islamist groups, we collect electoral data from the
legislative elections of 2008 provided by the Election Commission of Pakistan. In particular,
we obtain constituency-level electoral results for the provincial assembly. Electoral con-
stituencies are smaller than districts. Hence, we aggregate the results at the district level.
Our main measure of support for Islamists groups is the population-weighted share of votes
obtained by an alliance of Islamist parties, the Muttahida Majlis-e-Amal (MMA), across all
constituencies within a given district. See the Data Appendix in Section 9 for further details.
Figure 1 represents the geographic distribution of support for MMA.
We also use some additional data sources that we describe as they become relevant. For
an exhaustive description of the data used in this paper see section 9 of the Online Appendix.
4 Empirical Strategy and Basic Results
Our objective is to evaluate the effect of the disclosure of information about the vaccine ruse
and the subsequent anti-vaccine propaganda campaign on immunization rates. Our main
outcomes of interest are dummies that take value 1 if a particular child has received the first
dose of polio, DPT, or measles vaccine. The date of birth and the district of residence jointly
set an individual child’s exposure to the shock induced by the disclosure of the vaccine ruse.
Children born after July 2011 were fully exposed to the disclosure of the vaccine ruse, since
their entire childhood took place after the information had been disclosed. Children born
much earlier were not exposed to the disclosure of information, since they reached older ages
before the information about the vaccine ruse was disclosed. Children born shortly before
July 2011, were partially exposed, since part of their early months of life took place under
the new information scenario.
In order to identify the partially exposed children and the non-exposed children, we em-
pirically examine the age profiles of the three vaccines. The official immunization schedule—
presented in Appendix Table 1—is not perfectly enforced. Hence, it is important to document
how the likelihood of obtaining each vaccine changes as children get older.
19Vaccination status based on recall has been shown to be subject to a large extent of measurement error(Research and Development Solutions (2012); Sheikh et al (2011)). See section 9 of the Appendix for furtherdetails on the construction of our main outcome variables.
10

Figure 2 presents the monthly age profiles of the main vaccines. We restrict the sample
to the pre-treatment period, so that the age profiles are not confounded with the disclosure
of information on the vaccine ruse.20 As we can see, the likelihood of obtaining the first dose
of the polio and DPT vaccines increases during the first three months of life and remains
constant thereafter. This is consistent with the first dose of these vaccines being received
during regular visits of Lady Health Workers or during vaccination drives in the first months
of life. This evidence also illustrates the imperfect compliance with the official calendar: the
first dose of polio is supposed to be received at birth and the first dose of DPT in the 6th
week of life. The last panel of the figure shows the age profile of the measles vaccine, which
is supposed to be administered in the 9th month of life. As we can see, the probability of
receiving the first dose of polio rapidly increases after the 9th month of life and reaches a
plateau after the first year of life.
When considering immunization status of polio and DPT, we will consider children born
in the three months prior to July 2011 as partially treated: the information on the vaccine
ruse is disclosed at a time when their likelihood of receiving the vaccine was rapidly increas-
ing. Similarly, when considering the measles vaccine, we will consider children born in the
year prior to July 2011 as partially treated.
Note that the probability of receiving the first dose of these vaccines tends to increase
during the first months of life. However, in each of the three cases, it reaches a plateau
suggesting that a substantial fraction of children remains unvaccinated. This is consistent
with certain families being isolated from vaccination (either because of lack of demand or
lack of supply) and inconsistent with erratic or irregular supply of vaccines. In the latter
case, we would expect a continuous increase in the probability of the receiving the vaccines
as children get older.
Our main empirical strategy consists of comparing vaccination rates across cohorts of
children with different levels of exposure to information on the vaccine ruse, and across
regions that have different levels of support for Islamist parties. The underlying assumption
is that parents in districts, in which higher support for political Islamist groups prevails,
were more likely to change their believes about vaccines according to the messages spread
by the Taliban.
In order to provide a visual representation of the variation used in this empirical design,
Figure 3 presents the age profiles of children observed before and after the disclosure of
information and across regions with different levels of support for Islamist parties. The
20In particular, we restrict the sample to PSLM waves 2008/9 and 2010/11. The latter wave was fieldedbefore June 2011. We consider the vaccination status and the age of the child at the time they are surveyed.Hence, the vaccination status of all children is observed before the disclosure of the vaccine ruse.
11

figures on the left panel restrict the sample to districts in the first quartile of the distribution
of support for Islamist parties. The figures on the right show the age profiles for districts in
the top quartile of the distribution of support for Islamist parties.
The figures show that, in regions with low support for Islamist parties, the immunization
age profiles are similar before and after the disclosure of information on the vaccine ruse.
In contrast, the right figures show that, in regions with high support for Islamist groups,
vaccination rates experienced a substantial decline after the disclosure of information on the
vaccination ruse. This result is consistent with the hypothesis that, in regions with high
levels of support for Islamist groups, a larger proportion of parents were influenced by the
anti-vaccine propaganda spread by the Taliban, became more skeptical about vaccination,
and actively decided not to vaccinate their children.21
In Appendix Figures 1 and 2, we examine the age profiles for complete immunization.
The PSLM survey only records the first three doses of polio and DPT, as well as the first
dose of measles. Hence, we consider a child completely immunized against each disease if
she received all dosages recorded in the survey. Similarly, we consider children “completely
immunized” once they have received all dosages of all vaccines documented in the survey.
See section 9 in the Appendix for further details.
Appendix Figure 1 shows the age profiles for full immunization of polio and DPT. Note
that since we only have data on one dose of the measles vaccine, the corresponding figure
would be equivalent to the one presented in Figure 2. The third panel of Appendix Figure 1
shows the age profile of full immunization for the three vaccines. The figures show a steady
increase in the likelihood that children are fully immunized during the first 14 months of life.
Hence, when the outcome is full immunization, we will consider children born between May
2010 and July 2011 as partially treated.
Appendix Figure 2 presents the age profiles for full immunization, before and after the
disclosure of information and across regions with different levels of support for Islamist par-
ties. The results are similar to the ones documented for the first doses of each vaccine. In
regions with low support for Islamist groups there are no differences in the age profiles. How-
ever, regions with high support for Islamist parties experience a decline of full immunization
rates after the information on the vaccine ruse was disclosed.
21Note that the decline in vaccination rates seems to be higher for children older than six months. However,it is important to keep in mind that differences across cohorts and differences on the intensity of the treatmentover time could generate a differential impact on children observed with different ages. We provide a moredetailed examination of the dynamic effects across cohorts in the econometric analysis.
12

Regression Framework
Despite the fact that the previous results provide suggestive evidence on the effects, we
were not controlling by cohort or district fixed effects. Next, we estimate the following
econometric model to allow for the inclusion of controls.
Yikaj = γ0 + γk + γj + γa +∑k
βkDkIj + δci + εikaj (1)
where Yikaj is a dummy that captures the vaccination status of child i, born in month-year
k, interviewed at age a, and living in district j. Dk is a dummy indicating whether the child
belongs to month-year cohort k. Ij is the district-specific measure of treatment intensity,
i.e. our proxy for support for Islamists parties. We define this measure in terms of standard
deviations of the electoral support for Islamist parties, in order to facilitate the interpretation
of the magnitudes. γ0 is a constant. γk are monthly cohort fixed effects. γj are district fixed
effect. γa are monthly age-at-interview fixed effects. ci represents individual-level controls
(in particular, month-of-interview fixed effects to control for seasonality and a dummy that
takes value 1 for rural regions in the district).22 The sample includes children born between
2010 and 2012. The omitted category corresponds to the cohort born in January 2010 and
standard errors are clustered at the parent district level.23
This specification allows a fully flexible pattern of treatment effect estimates per cohort.
We expect βk to take negative values for the fully exposed cohorts—born after July 2011—
and possibly for the partially treated cohorts—born in the months leading to July 2011. Co-
hort fixed effects control for all factors that are common across cohorts, such as nation-wide
economic growth or improvements in health and nutrition over cohorts. District fixed effects
control for all time (or cohort) invariant factors such as geography, climate, or religiosity.
Hence, the coefficients βk are identified out of within cohort variation across districts with
different levels of support for Islamist groups.
Figure 4 plots the βk estimates and 90% confidence intervals for different monthly cohorts.
Consistent with what we expected, the estimates corresponding to cohorts fully exposed to
the disclosure of the vaccination ruse—i.e. those born after July 2011— are negative. This
is specially the case for those born in the year after the disclosure of the information. Hence,
the results are consistent with a drop in the demand of vaccines, possibly generated by an
22The figures are very similar when including only cohort and district fixed effects as controls. They arepresented in Figure 4 of the Online Appendix.
23During the sample period some districts experienced divisions. We cluster the standard error at thelevel of districts in existence in 2008. Our measure of support for Islamist parties and district fixed effectsare defined according to their boundaries in 2012. See Appendix section 9 for details on the construction ofthe data.
13

increase in distrust in formal medicine and vaccines in particular.
In contrast, the estimates for cohorts born much earlier than July 2011 fluctuate around
0 and are not statistically significant. This is consistent with the lack of differences in the
evolution of vaccination rates across cohorts between districts with different levels of support
for Islamist parties. In other words, it supports the lack of pre-trends and, hence, our main
identification assumption.
Consistent with the evidence on the age profiles, we also observe declines in vaccination
rates for cohorts partially affected by the disclosure of the vaccination ruse. Children born 3
to 4 months prior to July 2011 experience drops in the likelihood of having received the polio
or the DPT vaccines, whereas those born 8 months prior to July 2011 experience declines in
the likelihood of the vaccination of measles.24 The fact that the pattern of vaccination rates
of partially treated children is consistent with the evidence obtained from the age profile
of the different vaccines is reassuring and consistent with the notion that the information
disclosed in July 2011 affected the administration of these vaccines.
Appendix Figure 3 shows similar estimates for complete immunization of polio, DPT,
and the three vaccines. We observe significant drops in immunization rates for fully exposed
cohorts. Consistent with the age profiles of full immunization, we observe steady declines
in immunization rates for those cohorts that were partially affected by the disclosure of
information on the vaccine ruse.
In Appendix Figure 5, we incorporate data from an earlier wave of the PSLM survey to
show a longer sequence of pre-treatment coefficients. We report this results for our main
outcomes: receiving the first dose of each vaccine. The results on full immunization are
similar and available upon request. While the pre-treatment coefficients are more noisily
estimated, they fluctuate around zero and confirm the absence of pre-trends.25
5 Main Regression Estimates
In this section, we present the main regression estimates to assess the magnitude and sig-
nificance of the decline in vaccination rates. To provide a stark comparison, we compare
vaccination rates between cohorts fully exposed to cohorts not-exposed to the new infor-
24The age profiles of the polio and DPT suggest that the likelihood of receiving the first dose of thesevaccines reaches a plateau in the third month of life. However, we also observe declines in the fourth monthprior to the treatment. This is likely to be driven by measurement errors on the date of birth, with somechildren partially affected reporting dates of birth in the prior month.
25Appendix Figure 5 includes children born between 2007 and 2012. The omitted category corresponds tochildren born in 2007.
14

mation environment. Hence, we exclude from the sample the partially treated cohorts.26
We then investigate how this difference varies across regions with different levels of Islamist
groups. In other words, we implement the following Difference-in-Differences (DID, hence-
forth) empirical strategy:
Yikaj = γ0 + γk + γj + γa + βPostkIj + δci + εikaj (2)
where Postk takes value 1 for cohorts of children fully exposed to the disclosure of the vaccine
ruse—that is, children born after July 2011—, and takes value 0 for not-exposed cohorts.
The other variables are defined as in equation (1). Standard errors are clustered at the
parent district level.
Panel A of Table 1 presents the main DID estimates, β, for indicators of having received
the first dose of different vaccines. As we can see, all the estimates are negative and sta-
tistically significant: a one standard deviation increase in the support for Islamist groups
is associated with declines of 4.5, 4.3, and 2.9 percentage points in the vaccination rates of
polio, DPT, and measles, after the disclosure of information on the vaccine ruse.27 These
declines in vaccination rates represent a 9 - 13% decline in vaccination rates over the sample
mean. Note that, if one were to take into account the externalities that vaccinations gen-
erate, the decline on herd immunity of these declines in immunization rates will be much
larger.
Panel B of Table 1 presents the results on receiving all dosages of each vaccine. In
column 4, we present the results on complete immunization defined by receiving all dosages
of the three vaccines. The effects are similar in magnitude to those for the first dosage. For
instance, one standard deviation increase in support for Islamist groups is associated to a
11% decline in full immunization rates. Since the results are similar, in the rest of the paper
we focus on the results on obtaining the first dosage of each vaccines.
These effects are consistent with the hypothesis that the disclosure of information on the
vaccine ruse generated an increase in distrust towards formal medicine, which made parents
become more hesitant about vaccines, and lead some of them to actively refuse vaccines. It is
likely that this increase in distrust was larger in regions with high support for Islamist groups,
either because these regions were more exposed to the anti-vaccine propaganda campaigns
by the Taliban, or because a larger fraction of the population was prone to trust the anti-
vaccine messages spread by the Taliban. In section 6 we provide further discussion on the
potential mechanisms behind this results and provide additional supporting evidence for a
26See Table notes for details on the excluded cohorts.27The results are similar if we only include cohort and district fixed effects, as in the most basic DID
model. These results are presented in Appendix Table 3.
15

potential distrust channel.
Heterogeneous Effects
Next, we explore whether the effects are heterogenous depending on the gender of the
child. Islamist extremists have recurrently claimed that polio vaccinations are a complot to
sterilize Muslim children, girls in particular.28 If the disclosure of the vaccination ruse lent
higher credibility to this rumor, we would expect the results to be larger when the child is
a female.
In Table 2, we present results that include a triple interaction with a dummy that takes
value 1 if the child is a female. The triple interaction is negative and statistically significant
for polio and DPT, suggesting that girls were differentially less likely to be vaccinated after
the vaccine ruse was disclosed. These results are consistent with parents becoming even
more skeptical of vaccinations when they had to vaccinate a girl. Hence, this is consistent
with parents lending higher credibility to defamation messages of the Taliban groups. Note
that the interaction of a post dummy variable and support for Islamist groups is negative
for the three vaccines. This suggests that the effect of the disclosure of the vaccine on boys
was also negative, but lower in magnitude than the effect on girls.
Robustness Checks
The main identifying assumption behind our empirical strategy is that, in the absence of
the disclosure of information on the vaccine ruse, the across-cohorts evolution of vaccination
rates would have been similar in districts with different levels of support for Islamist groups.
Note that the results presented in Figure 4 document the lack of differential trends across
districts prior to the disclosure of the vaccine ruse. The point estimates fluctuate around
zero and do not follow any specific pattern. The p-values of joint-significance of the pre-
treatment coefficients are 0.69, 0.21, and 0.19 for the polio, DPT, and measles, respectively.
Appendix Figure 5 shows the same figures with a longer pre-trend. While the point estimates
in the pre-period are more noisy, they fluctuate around zero and do not show any systematic
pattern, consistent with the absence of pre-trends.
In order to address remaining concerns, Table 3 presents a number of additional robust-
ness checks. Column 1 reproduces our main results for comparison. Column 2 incorporates
as controls pre-treatment measures of access to health services interacted with yearly-cohort
fixed effects. In particular, we control for the share of women that had received tetanus
28See Scientific American (2013)
16

immunization, pre-natal care, and post-natal care during pregnancy. We measure these con-
trols in the 2008/09 wave of the PSLM survey. In column 3 we include as controls the share
of mothers with no formal schooling interacted with cohort fixed effects. The estimates are
highly robust to the addition of these controls. These results mitigate the concern that the
results could be driven by more underdeveloped districts experiencing a differential evolution
of vaccination rates over time (or over cohorts).
Column 4 adds flexible controls for natural disasters. In 2010, a number of districts in
Pakistan were affected by severe monsoon floods. To control for their effect we incorporate
as controls an indicator for flood affectedness interacted with cohort fixed effects. The results
are highly robust to the addition of these controls.
In column 5, we explore the possibility that our results are confounded by endogenous
fertility decisions: if the disclosure of information on the vaccine ruse affected optimal fertility
decisions our sample may be selected on parents that decided not to postpone having children
because of the disclosure of information. Note that this selection pattern would only affect
our estimates if there is a correlation between the number of parents whose fertility decisions
was affected and support for Islamist groups. Furthermore, we believe that the shock is
unlikely to have had affected the fertility decisions of a substantial fraction of the population
since higher levels of distrust in vaccines is unlikely to make parents modify their decision
of when to have children. Nevertheless, we empirically explore this possibility. Column 5
reports the results when we restrict the sample to children born before May 2012. Hence,
we are effectively focusing on children conceived before the disclosure of the vaccine ruse.
The results are negative and highly statistically significant. Note that the effects increase
in magnitude. This is driven by the effects of the disclosure of the vaccination ruse being
mitigated over time. This can also be observed in Figure 4. It is possible that over time the
vaccine ruse became a less salient issue among the population. However, it is also possible
that the mitigating effect was driven by an endogenous supply reaction. We further discuss
this possibility in section 6.
Finally, column 6 drops the district of Abbottabad, where the operations to capture Bin
Laden took place. The results are robust, suggesting that the evolution of vaccination rates
in this district are not driving the results.
In Table 4, we assess the robustness of our results to non-linear specifications of support
for Islamist parties. In Panel A, we show the results for above the median level of support
for Islamist parties, whereas in Panel B we examine the effects by terciles. The panels are
consistent with our baseline specification. The results indicate that the effects are monoton-
ically increasing in the magnitude of support for Islamist groups. This is not affected by the
particular functional form that we use for the support for Islamist parties.
17

Another potential concern is that the treatment may have induced differential migration
across districts. This may have lead to a differential household composition across districts
with different levels of support for Islamist groups. Changes in household composition could
affect immunization rates. Unfortunately, the PSLM data does not contain information
on migration or on parent’s place of birth. We can nevertheless, verify that household
characteristics do not change as a result of the treatment variable. We explore this in
Table 5 by using child and household characteristics as dependent variables in our baseline
specification. The dependent variable in column 1 is a dummy indicating whether a child
is male. In column 2 and 3, the dependent variables are the mother’s education level and
age, respectively. Column 4 relies on a dummy that assumes value 1 if the household is
residing in a rural area as a dependent variable. In columns 5 and 6, we use as outcomes
dummy variables to indicate whether a household owns either a radio or a television set,
respectively. Lastly, columns 7 and 8 treat the number of household members as well as the
number of rooms available to the household in its residential dwelling as dependent variables.
The results show that all estimated interaction coefficients are close to zero and statistically
insignificant. This supports the notion that there were no differential changes in the sample
composition across repeated cross-sections that could possibly confound the baseline results.
6 Mechanisms
The results presented in this paper are consistent with the hypothesis that the disclosure of
the vaccine ruse eroded the population’s trust in vaccine and towards formal medicine. The
disclosure of this information lent credibility to the ongoing anti-vaccine propaganda of the
Taliban. Naturally, the Taliban used this opportunity to increase their efforts to discredit
vaccines by increasing the number of anti-vaccine messages. We believe our treatment is
explained by the combination of the disclosure of the information of the vaccine ruse and
the increase in the intensity in the anti-vaccine propaganda of the Taliban.
It is possible that these events affected vaccination rates through different channels. It is
useful to decompose these set of mechanisms in two groups: supply and demand channels.
One possible demand channel relates to the increase in distrust in vaccines among the
population. As a result, a larger fraction of parents became more skeptical about vaccines
and started actively refusing to vaccinate their children. We believe this mechanism is likely
to have played an important role and we provide further supporting evidence below.
A second demand channel may relate to Taliban intimidation. Even if the level of distrust
on vaccines was not affected, parents may have increasingly perceived vaccinating their
children as an action in opposition to the Taliban’s directives. In a context, where there
18

was extensive Taliban intimidation this may have dissuaded some parents to vaccinate their
children.
Third, the supply of vaccines may have been reduced as a result of intensified anti-vaccine
propaganda of the Taliban. As reported in section 2, the Taliban attacked polio vaccination
workers starting in mid-2012.
While these three channels may have played some role, we believe that the trust-demand
channel is quantitatively important. Next, we present some evidence consistent with the
relevance of the trust-demand mechanism.
If the disclosure of information eroded the level of trust in vaccines and in the medical
sector, we may expect that households also reduced their demand for other health services.
In Table 6, we investigate whether parents decided to consult a medical worker if their
children got sick. We modify the empirical specification from a cohort to a time dimension.
Yitaj = γ0 + γt + γj + βPosttIj + δci + εitaj (3)
Yitaj corresponds to a health seeking behavior measure related to child i, whose parents
were interviewed in date t, at age a, and in district j; γt are quarter-year of interview fixed
effects; γj are district fixed effects; Postt is a dummy that takes value 1 if the household was
interviewed after July 2011; Ij is electoral support for Islamist parties in standard deviations;
ci contains individual-level controls: dummy for rural region and monthly age of children
i. We focus on the same sample of children, younger than 24 months old to facilitate the
comparison across results.29
The outcome variable in column 1 of Table 6 is an indicator for whether the child was
sick in the two weeks prior to the date at which the survey took place. The results show that
the likelihood of children getting sick was differentially higher in areas with higher support
for Islamist parties. This suggests that the lower vaccination rates and demand of formal
medicine might have made children more vulnerable to diseases.
In columns 2 to 4, we restrict the sample to children that reported being sick in the last
two weeks. The dependent variable in column 2 is a dummy that takes on value 1 if the
parents of a sick child indicated that they consulted anyone for the sickness of their child.
We estimate a negative and significant effect, suggesting that parents were less likely to seek
for help in the event of sickness. In the survey, parents are asked specifically which type of
health care provider they consulted. In columns 3 to 4, we divide the answers among two
29Note, however, that we do not eliminate from the sample partially treated children in a cohort-sense.When we redefine the variation from a cohort to a time dimension, all health seeking behavior observed afterJuly 2011 is subject to the new information scenario, while all behavior observed before July 2011 is notaffected by the new information.
19

different possibilities. We find that the negative effect on demand for consultation is driven
by asking for help in the formal medical sector — hospital, basic health units and lady health
workers. In contrast, there is a positive effect, albeit not significant, in consulting non-formal
medicine — spiritualist, homeopath, chemist, hakeem, or other. Hence, consistent with the
demand channel, we find that parents in districts with higher Islamist sentiments reduced
their demand for formal medicine after the disclosure or information about the vaccine ruse.
An alternative channel that could also provide an explanation for our main results could
be that the supply of medical services, such as vaccination drives, may have endogenously
reacted to the disclosure of the vaccine ruse. Starting in mid-2012 the Taliban carried out
attacks and intimidation of health workers. While this is a plausible channel, we believe it
cannot account for the entire magnitude of our effects. The intimidation of health workers
only started to take place about a year after the disclosure of the vaccine ruse, while we
observe a decline in vaccination rates immediately after the disclosure. Furthermore, our
analysis focuses on the period 2010-2012, when the attacks and intimidation to health workers
were rare.
Furthermore, note that the evidence presented in panel A of Table 2 is not fully consistent
with the results being entirely driven by a supply channel. We observe that the decline in
vaccination rates was higher for girls than for boys. This is consistent with the rumors spread
by the Taliban that vaccinations were a conspiracy to sterilize Muslim girls. However, the
supply of vaccines is unlikely to be differential between boys and girls, since Lady Health
Workers and EPI have a mandate to vaccinate and treat all children equally regardless of
their gender.
7 Conclusion
In this paper, we provide empirical evidence on the causal effect of the disclosure of infor-
mation that damages the reputation of vaccines or health system on immunization rates.
We exploit a sequence of events that took place in the recent history of Pakistan and that
severely affected the degree to which citizens trusted formal medicine and vaccines, in par-
ticular. As part of the operations to capture Osama Bin Laden in 2011, the CIA launched a
fake vaccination campaign in the city of Abbottabad, Pakistan. The disclosure of this infor-
mation caused uproar in Pakistan. The Pakistani Taliban used this information to intensify
their discrediting campaign against formal medicine and polio vaccination, in particular.
We empirically evaluate the effects of the disclosure of the vaccination ruse on immuniza-
tion rates. We use household-level data from several waves of the Pakistani Social Living
Standards Measurement (PSLM) survey to implement a Difference-in-Differences strategy
20

(DID, henceforth) where we compare immunization rates of children born before and after
the vaccine ruse was disclosed and, across districts, depending on the extent of support for
Islamist groups. Our underlying assumption is that, on average, parents in districts with
higher support for political Islamist groups will be more likely to change their believes about
vaccines according to the messages spread by the Taliban. As a measure of support for Is-
lamist groups we use district-level measures of electoral support for Muttahida Majlis-e-Amal
(MMA), which is a coalition of Islamist parties that ran under a single banner in the 2008
general election.
Our estimates suggest that the disclosure of the vaccine ruse had substantial effects on
vaccination rates: a one standard deviation increase in the support for Islamist groups leads
to approximately an 9 to 13% larger decline in the likelihood that children have received the
first dose of a number of different vaccines.
These results are consistent with the hypothesis that the disclosure of the vaccine ruse
damaged the reputation of vaccines. As a result, a larger fraction of parents were hesitant
about vaccinations or decided to actively refuse to vaccinate their children. Consequently,
immunization rates declined. These effects are stronger in regions where political Islamist
groups had higher rates of support. This is consistent with the idea that individuals ideo-
logically close to the Taliban were more likely to receive their messages discrediting vaccines
and changed their beliefs accordingly.
21
REFERENCES
Alazraki, Melly (2011). “The Autism Vaccine Fraud: Dr. Wakefield’s Costly Lie
to Society”, aol.com, January 12. http://www.aol.com/article/2011/01/12/autism-vaccine-
fraud-wakefield-cost-money-deaths/19793484/ (last accessed 06.09.2017)
Alsan, Marcella, and Marianne Wanamaker (2016). ”Tuskegee and the Health of
Black Men”. National Bureau of Economic Research, No. w22323.
Banerjee, Abhijit, and Esther Duflo (2012). “Poor economics: A radical rethinking
of the way to fight global poverty.” PublicAffairs.
Boone, Jon (2012). “Doctor who helped US in search for Osama Bin Laden jailed for 33
years”. theguardian.com, May 23. http://www.theguardian.com/world/2012/may/23/doctor-
bin-laden-cia-jail (last accessed 06.09.2017)
Bursztyn, Leonardo, Callen, Michael, Ferman, Bruno, Hasanain, Ali, and
Noam Yuchtman (2016). “Political Identity: Experimental Evidence on Anti-Americanism
in Pakistan”. Working Paper
Das, Jishnu, and Saumya Das (2003). ”Trust, learning, and vaccination: a case
study of a North Indian village.” Social science & medicine 57.1: 97-112.
DellaVigna, Stefano, and Matthew Gentzkow (2010). “Persuasion: empirical
evidence.” Annual Review of Economics, 2(1), 643-669.
Dupas, Pascaline (2011). “Health behavior in developing countries.” Annual Review
of Economics, 3(1), 425-449.
Election Commission of Pakistan (2015) “General Elections 18 Feb 2008”. Election
Comission of Pakistan.https://ecp.gov.pk/AllResults.aspx (last accessed 01.04.2015)
Expanded Program on Immunization (EPI), Pakistan (2017). “Immunization
Schedule”. http://epi.gov.pk/?page id=139 (last accessed 06.09.2017)
Mazetti, Mark (2012). “Panetta Credits Pakistani Doctor in Bin Laden Raid”. ny-
times.com, January 28. http://www.nytimes.com/2012/01/29/world/asia/panetta-credits-
pakistani-doctor-in-bin-laden-raid.html? r=0 (last accessed 06.09.2017)
Nishtar, Sania (2009) “Pakistan, politics and polio”. Bulletin of the World Health
Organisation, December 8. http://www.who.int/bulletin/volumes/88/2/09-066480/en/ (last
accessed 06.09.2017)
Norell, Magnus (2007). “The Taliban and the Muttahida Majlis-e-Amal (MMA)”.
China and Eurasia Forum quarterly, v.5 (no. 3), 61-82.
Research and Development Solutions (2012). “Childhood Immunization in Pak-
istan”. Research and Development Solutions, Policy Briefs Series, No. 3, February 2012.
Roul, Aminesh (2014). “The Pakistani Taliban’s Campaign Against Polio Vaccina-
tion”. CTC Sentinel, August 27. https://www.ctc.usma.edu/posts/the-pakistani-talibans-
22

campaign-against-polio-vaccination, (last accessed 06.09.2017)
Scientific American (2013). “How the CIA’s Fake Vaccination Campaign Endangers
Us All”. scientificamerican.com, May 1. https://www.scientificamerican.com/article/how-
cia-fake-vaccination-campaign-endangers-us-all/ (last accessed 06.09.2017)
Shah, Saeed (2011). “CIA organized fake vaccination drive to get Osama bin Laden’s
family DNA”. theguardian.com, July 11. http://www.theguardian.com/world/2011/jul/11/cia-
fake-vaccinations-osama-bin-ladens-dna (last accessed 06.09.2017)
Sheik, Sana, Ali, Asad, Zaidi, Anita K. M., Agha, Ajmal, Khowaja, Asif,
Allana, Salim, Qureshi, Shahida, and Iqbal Azam (2011). “Measles Susceptibility
in Children in Karachi, Pakistan”. Vaccine, April 18; 29(18): 3419-3423.
The Express Tribune (2012). “Six polio workers shot dead in Pakistan: Police”.
tribune.com.pk, December 18. https://tribune.com.pk/story/481168/five-polio-workers-shot-
dead-in-pakistan/ (last accessed 06.09.2017)
Walsh, Decan (2012). “Taliban Block Vaccinations in Pakistan”. nytimes.com, June
18. http://www.nytimes.com/2012/06/19/world/asia/taliban-block-vaccinations-in-pakistan.html
(last accessed 06.09.2017)
World Health Organization (2010). “Weekly epidemiological record”. http://www.who.int/wer,
June 4. No. 23, 2010, 85, 213-228.
23
Figure 1: Distribution of Electoral Support for MMA
Vote Share of MMA in 2008(10.89,47.82](1.06,10.89](0.11,1.06][0.00,0.11]
24

Figure 2: Age Profiles of Vaccines (Pre-Treatment Period)
0.2
.4.6
.8Sh
are
of V
acci
nate
d C
hild
ren
1 2 3 4 5 6 7 8 9 10 11 12Months of Age
Polio Vaccine Age Profile
0.2
.4.6
.8Sh
are
of V
acci
nate
d C
hild
ren
1 2 3 4 5 6 7 8 9 10 11 12Months of Age
DPT Vaccine Age Profile
0.2
.4.6
.8Sh
are
of V
acci
nate
d C
hild
ren
1 2 3 4 5 6 7 8 9 10 11 12 13 14 15 16 17 18Months of Age
Measles Vaccine Age Profile
25

Figure 3: Age Profiles of Vaccines. Before & After Treatment. By level of Islamist Support
0.2
.4.6
.8Sh
are
of V
acci
nate
d C
hild
ren
1 2 3 4 5 6 7 8 9 10 11 12Months of Age
Pre-Period Post-Period
Low Islamic SupportPolio Vaccine Age Profile
0.2
.4.6
.8Sh
are
of V
acci
nate
d C
hild
ren
1 2 3 4 5 6 7 8 9 10 11 12Months of Age
Pre-Period Post-Period
High Islamic SupportPolio Vaccine Age Profile
0.2
.4.6
.8Sh
are
of V
acci
nate
d C
hild
ren
1 2 3 4 5 6 7 8 9 10 11 12Months of Age
Pre-Period Post-Period
Low Islamic SupportDPT Vaccine Age Profile
0.2
.4.6
.8Sh
are
of V
acci
nate
d C
hild
ren
1 2 3 4 5 6 7 8 9 10 11 12Months of Age
Pre-Period Post-Period
High Islamic SupportDPT Vaccine Age Profile
0.2
.4.6
.8Sh
are
of V
acci
nate
d C
hild
ren
1 2 3 4 5 6 7 8 9 10 11 12 13 14 15 16 17 18Months of Age
Pre-Period Post-Period
Low Islamic SupportMeasles Vaccine Age Profile
0.2
.4.6
.8Sh
are
of V
acci
nate
d C
hild
ren
1 2 3 4 5 6 7 8 9 10 11 12 13 14 15 16 17 18Months of Age
Pre-Period Post-Period
High Islamic SupportMeasles Vaccine Age Profile
26

Figure 4: Treatment Effects by Monthly Cohort
March2011
July2011
-.15
-.1-.0
50
.05
.1C
oef o
f Coh
ort X
Isla
mic
Sup
port
Jan 2010 Jul 2010 Jan 2011 Jul 2011 Jan 2012 Jul 2012Month of Birth (cohort)
Polio Vaccine
March2011
July2011
-.15
-.1-.0
50
.05
.1C
oef o
f Coh
ort X
Isla
mic
Sup
port
Jan 2010 Jul 2010 Jan 2011 Jul 2011 Jan 2012 Jul 2012Month of Birth (cohort)
DPT Vaccine
July2010
July2011
-.2-.1
5-.1
-.05
0.0
5.1
Coe
f of C
ohor
t X Is
lam
ic S
uppo
rt
Jan 2010 Jul 2010 Jan 2011 Jul 2011 Jan 2012 Jul 2012Month of Birth (cohort)
Measles Vaccine
27

8 Tables
Table 1. Effects of the Disclosure on Vaccination Rates. Main Results
Polio DPT Measles All Vaccines(1) (2) (3) (4)
Mean Dep. Var. 0.422 0.455 0.231
Post × IslSup -0.045** -0.043** -0.029**(0.019) (0.017) (0.014)
Observations 20,350 20,350 16,175R-squared 0.269 0.251 0.253Number of Clusters 109 109 109
Mean Dep. Var. 0.338 0.371 0.231 0.213
Post × IslSup -0.042** -0.042** -0.029** -0.025*(0.017) (0.017) (0.014) (0.014)
Observations 14,901 14,901 16,175 14,901R-squared 0.279 0.260 0.253 0.263Number of Clusters 109 109 109 109
Magnitude0,422 0,455 0,231 0,231-0,045 -0,043 -0,029 -0,029
-0,106635071 -0,094505495 -0,125541126 -0,125541126
Dependent Variables:
Notes: Standard errors clustered at the parent district-level in parentheses. There are 114 districts in the sample. The unit of observation is the child level. The sample consists of children born between 2010 and 2012 that are less than 24 months of age at the time of interview. We exclude partially treated children. In particular, for both the first dose of Polio and DPT, we exclude children born between March and June 2011. In the case of Measles, we exclude children born between July 2010 and June 2011. For the receipt each dose of Polio, DPT as well as for all vaccines, we exclude children born between May 2010 and June 2011. All regressions include district, monthly cohort, monthly age, and calendar month of interview fixed effects and a dummy for rural regions. The dependent variables in Panel A take value 1 if the first dose of each vaccine was received, 0 otherwise. The dependent variables in Panel B take value 1 if a child has received all doses of a given vaccine, 0 otherwise. In particular, for Polio and DPT, we require that the child has received the first 3 shots of vaccine and for measles we require that the child has received the first dose of measles vaccine. The outcome for all vaccines combines all of these requirements. *** p<0.01, ** p<0.05, *p<0.1.
Panel A. 1st Dose of Each Vaccine
Table 1. Vaccination Rates Main Results
Panel B. All Doses of Each Vaccine
28

Table 2. Heterogenous Effects by Child or Household Characteristics
Polio DPT Measles
(1) (2) (3)
Post × IslSup -0.031* -0.030* -0.018(0.018) (0.018) (0.014)
Post × IslSup × Female -0.029** -0.029** -0.024(0.012) (0.013) (0.016)
Observations 20,350 20,350 16,175R-squared 0.269 0.251 0.253
Notes: Standard errors clustered at the district-level in parentheses. The unit of observation is the child level. All regressions include district, monthly cohort, monthly age, and calendar month of interview fixed effects and a dummy for rural regions. All regressions include all the double interactions: post x female, IslSup x female. *** p<0.01, ** p<0.05, *p<0.1.
Table 2. Heterogenous Effects
Dependent Variable: Dummy for 1st Dose of each Vaccine
29

Table 3. Robustness ChecksTable 3. Robustness Checks
Baseline Initial Health x Cohort FE
Initial Education x Cohort FE
Flood-Affected x Cohort FE
Dropping children born
after May 2012
Drop District of Abottabad
(1) (2) (3) (4) (5) (6)
Post × IslSup -0.045** -0.036** -0.032* -0.039** -0.058*** -0.042**(0.019) (0.016) (0.019) (0.017) (0.020) (0.018)
Observations 20,350 20,350 20,350 20,350 14,526 20,171R-squared 0.269 0.271 0.269 0.271 0.253 0.271
Post × IslSup -0.043** -0.039*** -0.045** -0.042** -0.056*** -0.040**(0.017) (0.015) (0.018) (0.017) (0.019) (0.016)
Observations 20,350 20,350 20,350 20,350 14,526 20,171R-squared 0.251 0.254 0.251 0.251 0.234 0.253
Post × IslSup -0.029** -0.028** -0.034** -0.029** -0.065*** -0.027**(0.014) (0.014) (0.015) (0.014) (0.018) (0.013)
Observations 16,175 16,175 16,175 16,175 10,351 16,038R-squared 0.253 0.257 0.257 0.254 0.255 0.254
Panel A. First Dose of Polio Vaccine
Panel B. First Dose of DPT Vaccine
Panel C. First Dose of Measles Vaccine
Notes: Standard errors clustered at the district-level in parentheses. The unit of observation is the child level. All regressions include district, monthly cohort, monthly age, and calendar month of interview fixed effects and a dummy for rural regions Column 2 adds controls for district-level measures of access to health services as reported in the 2008/9 PSLM share, respectively interacted with yearly cohort fixed effects. The health measures are the share of mothers that received pre-natal care, post-natal care, and tetanus vaccine during previous pregnancy. Column 3 adds controls for share of mothers that had no formal education in 2008/9 interacted with yearly cohort fixed effects. Column 4 adds as controls a dummy for whether the district was severely affected by floods in 2010 interacted with yearly cohort fixed effects. Column 5 drops children born after May 2012. Column 6 drops the district where Abottabad is located. *** p<0.01, ** p<0.05, *p<0.1.
30

Table 4. Robustness Checks. Alternative Specifications of Support for Islamist Groups
Polio DPT Measles(1) (2) (3)
Mean Dep. Var. 0.422 0.455 0.231
Post × 1(IslSup>P50) -0.117*** -0.104*** -0.049**(0.033) (0.031) (0.023)
Observations 20,350 20,350 16,175R-squared 0.271 0.252 0.253
Post × 1(IslSup>P33 & IslSup<P66) -0.097** -0.074** -0.033(0.040) (0.037) (0.024)
Post × 1(IslSup>P66) -0.140*** -0.133*** -0.075**(0.037) (0.037) (0.032)
Observations 20,350 20,350 16,175R-squared 0.271 0.253 0.253
Table X. Vaccination Rates. Alternative Specifications
Dependent Variable: Dummy for Receipt of 1 Vaccine Dose
Notes: Standard errors clustered at the district-level in parentheses. The unit of observation is the child level. All regressions include district, monthly cohort, monthly age, and calendar month of interview fixed effects and a dummy for rural regions. *** p<0.01, ** p<0.05, *p<0.1.
Panel A. Cutoff-Level: Median
Panel B. Cutoff-Levels: Terciles
31

Table 5. Robustness Checks. Lack of Household Compositional Changes
Dummy for Male Child
Mother's Education Mother's Age
Dummy for Rural Region
Dummy for Radio
Ownership
Dummy for Television Ownership
Number of Household Members
Number of Rooms
(1) (2) (3) (4) (5) (6) (7) (8)
Mean Dep. Var. 0.514 3.528 27.930 0.658 0.223 0.581 8.268 2.637
Post July2011 × IslSup -0.006 0.012 -0.087 -0.004 -0.003 -0.018 0.065 0.063(0.008) (0.061) (0.147) (0.009) (0.017) (0.017) (0.083) (0.044)
Observations 22,346 22,346 22,346 22,346 22,346 22,346 22,346 22,346R-squared 0.008 0.261 0.027 0.190 0.145 0.230 0.094 0.112
Appendix Table X. Compositional Changes
Dependent Variables:
Notes: Standard errors clustered at the district-level in parentheses. The unit of observation is the child level. All regressions include district, monthly cohort, monthly age, and calendar month of interview fixed effects and a dummy for rural regions (except for the specification displayed in column 4). *** p<0.01, ** p<0.05, *p<0.1.
32

Table 6. Effect on Health Seeking Behavior
Dummy for Illness in Last 2
Weeks
Dummy for Consulted Anyone
Dummy for Consulted Formal
Medical Sector
Dummy for Consulted
Informal Medical Sector
(1) (2) (3) (4)
Mean Dep. Var. 0.191 0.981 0.926 0.055
Post July2011 × IslSup 0.032** -0.018* -0.040* 0.021(0.013) (0.010) (0.022) (0.018)
Observations 22,346 4,260 4,260 4,260R-squared 0.063 0.063 0.144 0.139
Table X.HealthSeeking
Dependent Variables:
Notes: Standard errors clustered at the district-level in parentheses. The unit of observation is the child level. All regressions include district fixed effects, quarter of interview fixed effects, monthly age, and a dummy for rural regions. In column 3, formal medical sector corresponds to hospital, basic health units and lady health workers. In column 4, informal medical sector corresponds to spiritualist, homeopath, chemist, hakeem, or other. *** p<0.01, ** p<0.05, *p<0.1.
33

Online Appendix
9 Data Appendix
Data Sources
Pakistan Social and Living Standards Measurement (PSLM)
The PSLM Project is designed to provide social & economic indicators at district levels.
It is implemented by the Pakistan Bureau of Statistics. We use the PSLM survey waves
implemented in 2010/11 and 2012/13 for our main analysis. For robustness, we further com-
plement the analysis with data from the survey wave implemented in 2008/09. We construct
the following outcomes of interest from survey responses in the Vaccination Diarrhea module
of the PSLM survey.
Firstly, we construct indicators for the receipt of different doses of vaccines. In particular,
we consider and construct indicators for polio, DPT, as well as, measles vaccines. Enumer-
ators for the PSLM surveys could choose among the following options in order to record a
child’s vaccination status: 1) yes (based on vaccination card); 2) yes (based on recall); 3) no;
4) yes (polio campaign). We focus only on the first choice as a measure of immunization.
Vaccination status measures based on recall have been shown to be prone to suffer from se-
vere measurement error (Research and Development Solutions (2012); Sheikh et al (2011)).
Hence, when constructing the outcome variable “received one shot of vaccine type”, we code
answers based on recall as 0.
We also construct indicators for full immunization. The PSLM survey only records the
first three doses of polio and DPT, as well as the first dose of measles.30 Hence, we consider
children fully immunized against polio or DPT if the three doses reported in the survey have
been provided and registered in the vaccination card.31 Similarly, the survey only recorded
information regarding the first dose of the measles vaccine. Hence, we cannot assess full
immunization for measles. We also combine information on the three vaccines to create a
measure of “complete immunization”. We consider a child to be completely immunized if all
doses of polio, DPT vaccine, and measles, were recorded in the survey.
Secondly, the vaccination & diarrhea module of the PSLM survey also contains some
information on general measures of health seeking behavior. The available information allows
us to construct the following measures:
30In 2009/10 the World Health Organization began recommending a first dose of the polio vaccine at birthin high endemic regions, as well as a second dose of the measles vaccine at 15 months of age (see WorldHealth Organization 2010). The reason why the PSLM survey differs from the official vaccination calendaris probably that the survey was not updated after these changes in the official vaccination calendar.
31See Appendix Table 1 for the official vaccination calendar.
34

• Dummy for Illness in Last 2 Weeks: Survey respondents are asked in the survey - for
each child separately - whether a child was ill or injured in the two weeks prior to the
survey. We use this information to construct a dummy variable that has value 1 if the
respondent states that a given child was ill or injured in the two weeks prior to the
survey, 0 otherwise.
• Dummy for Consulted Anyone: For each child which was reported as had been ill or
injured in the two weeks prior to the survey, the survey respondent was then asked
whether anyone was consulted regarding the reported illness or injury. We use this
information to construct a dummy variable that assumes value 1 if the respondent
states that someone had been consulted regarding the illness or injury, 0 otherwise.
• Dummy for Consulted Formal Medical Sector: If a respondent reported that a child
had been ill or injured in the two weeks prior to the survey and also stated that some-
one had been consulted regarding the illness or injury, the survey enumerators also
elicited which part of the medical sector in Pakistan had been consulted. This allows
us to construct a dummy variable that assumes value 1 if the respondent states that
the formal medical sector in Pakistan was consulted regarding the illness or injury. In
particular, we consider the answer choices “Private Dispensary/Hospital”, “Govern-
ment Hospital”, “Rural Health Clinic/Basic Health Unit” and “Lady Health Worker”
as representing the formal medical sector.
• Dummy for Consulted Informal Medical Sector: If a respondent reported that a
child had been ill or injured in the two weeks prior to the survey and also stated that
someone had been consulted regarding the illness or injury, the survey enumerators also
elicited which part of the medical sector in Pakistan had been consulted. This allows
us to construct a dummy variable that assumes value 1 if the respondent states that
the informal medical sector in Pakistan was consulted regarding the illness or injury.
In particular, we consider the answer choices “spiritualist”, “homeopath”, “chemist”,
“hakeem” and “other” as representing the informal medical sector.
Electoral Data Provinces elect provincial assemblies as their legislature. The members
of these provincial assemblies are directly elected during general elections and serve 5-year
terms.
We obtained constituency-level data for the general election to the provincial assembly
of 2008. We obtained the names of all the contesting candidates, their political parties, and
the number of votes obtained by each candidate. We use the official delimitation of 2002
35

and the amendments of 2008 published in the Gazette of Pakistan to locate constituencies
within the districts of Pakistan.
Since electoral constituencies are smaller than districts, we construct a district-level mea-
sure of support for different parties. In particular, we calculate the population-weighted aver-
age share of votes across all constituencies of a district. The weights correspond to the share
of the population living in the respective constituency relative to the overall district popu-
lation. In the absence of population data, we use number of total votes as a proxy for popu-
lation numbers. Hence, our main measure of Islamist sentiments is the population-weighted
share of votes obtained by the Islamist parties alliance MMA, across all constituencies within
a given district in the 2008 provincial legislative election. The spatial distribution of this
measure of support for Islamist political parties across the districts of Pakistan is presented
in Figure 1.
Construction of the Dataset We combine datasets from multiple sources to conduct
our analysis. The different datasets are matched by district and time period (month and
year). The matching is performed by current district of residence as well as month and year
of child birth.
Over the course of our sample period, Pakistan experienced a mild process of district
splitting. In particular, the number of districts in our study provinces increased from 109 to
114 between 2008 and 2012. We refer to the former set of districts as the parent districts and
to the later set of districts are labeled current districts. Given the lower level of aggregation
of our electoral data, we are able to calculate our measure of support for Islamist political
parties at the level of current districts. Moreover, all regressions use district fixed effects
at the current district level. However, in our analysis, we cluster standard errors at the
level of parent districts to allow for potentially correlated errors across current districts that
originated from the same parent district.
36

10 Appendix Figures
Appendix Figure 1. Age Profile for All Doses of Vaccines. Pre-Treatment Period
0.2
.4.6
.8Sh
are
of V
acci
nate
d C
hild
ren
1 2 3 4 5 6 7 8 9 10 11 12 13 14 15 16 17 18Months of Age
Complete Immunization Polio Age Profile
0.2
.4.6
.8Sh
are
of V
acci
nate
d C
hild
ren
1 2 3 4 5 6 7 8 9 10 11 12 13 14 15 16 17 18Months of Age
Complete Immunization DPT Age Profile
0.2
.4.6
.8Sh
are
of V
acci
nate
d C
hild
ren
1 2 3 4 5 6 7 8 9 10 11 12 13 14 15 16 17 18Months of Age
Full Immunization Age Profile
37

Appendix Figure 2. Age Profile for All Doses of Vaccines. Before & After Treatment. ByLevel of Islamist Support
0.2
.4.6
.8Sh
are
of V
acci
nate
d C
hild
ren
1 2 3 4 5 6 7 8 9 10 11 12 13 14 15 16 17 18Months of Age
Pre-Period Post-Period
Low Islamic SupportComplete Polio Vaccine Age Profile
0.2
.4.6
.8Sh
are
of V
acci
nate
d C
hild
ren
1 2 3 4 5 6 7 8 9 10 11 12 13 14 15 16 17 18Months of Age
Pre-Period Post-Period
High Islamic SupportComplete Polio Vaccine Age Profile
0.2
.4.6
.8Sh
are
of V
acci
nate
d C
hild
ren
1 2 3 4 5 6 7 8 9 10 11 12 13 14 15 16 17 18Months of Age
Pre-Period Post-Period
Low Islamic SupportComplete DPT Vaccine Age Profile
0.2
.4.6
.8Sh
are
of V
acci
nate
d C
hild
ren
1 2 3 4 5 6 7 8 9 10 11 12 13 14 15 16 17 18Months of Age
Pre-Period Post-Period
High Islamic SupportComplete DPT Vaccine Age Profile
0.2
.4.6
.8Sh
are
of V
acci
nate
d C
hild
ren
1 2 3 4 5 6 7 8 9 10 11 12 13 14 15 16 17 18Months of Age
Pre-Period Post-Period
Low Islamic SupportComplete Immunization Vaccine Age Profile
0.2
.4.6
.8Sh
are
of V
acci
nate
d C
hild
ren
1 2 3 4 5 6 7 8 9 10 11 12 13 14 15 16 17 18Months of Age
Pre-Period Post-Period
High Islamic SupportComplete Immunization Vaccine Age Profile
38

Appendix Figure 3. Treatment Effects by Monthly Cohort. Full Immunization
May2010
July2011
-.15
-.1-.0
50
.05
.1C
oef o
f Coh
ort X
Isla
mic
Sup
port
Jan 2010 Jul 2010 Jan 2011 Jul 2011 Jan 2012 Jul 2012Month of Birth (cohort)
Complete Polio Immunization
May2010
July2011
-.2-.1
0.1
Coe
f of C
ohor
t X Is
lam
ic S
uppo
rt
Jan 2010 Jul 2010 Jan 2011 Jul 2011 Jan 2012 Jul 2012Month of Birth (cohort)
Complete DPT Immunization
May2010
July2011
-.2-.1
5-.1
-.05
0.0
5C
oef o
f Coh
ort X
Isla
mic
Sup
port
Jan 2010 Jul 2010 Jan 2011 Jul 2011 Jan 2012 Jul 2012Month of Birth (cohort)
Complete Immunization
39

Appendix Figure 4. Treatment Effects by Monthly Cohort. Only Controlling for Montly-Cohort and District Fixed Effects
March2011
July2011
-.15
-.1-.0
50
.05
.1C
oef o
f Coh
ort X
Isla
mic
Sup
port
Jan 2010 Jul 2010 Jan 2011 Jul 2011 Jan 2012 Jul 2012Month of Birth (cohort)
Polio Vaccine
March2011
July2011
-.15
-.1-.0
50
.05
.1C
oef o
f Coh
ort X
Isla
mic
Sup
port
Jan 2010 Jul 2010 Jan 2011 Jul 2011 Jan 2012 Jul 2012Month of Birth (cohort)
DPT Vaccine
July2010
July2011
-.2-.1
5-.1
-.05
0.0
5C
oef o
f Coh
ort X
Isla
mic
Sup
port
Jan 2010 Jul 2010 Jan 2011 Jul 2011 Jan 2012 Jul 2012Month of Birth (cohort)
Measles Vaccine
40

Appendix Figure 5. Treatment Effects by Monthly Cohort. Longer Pre-Treatment Period.
March2011
July2011
-.2-.1
0.1
.2C
oef o
f Coh
ort X
Isla
mic
Sup
port
Jan 2008 Jan 2009 Jan 2010 Jan 2011 Jan 2012Month of Birth (cohort)
Polio Vaccine
March2011
July2011
-.2-.1
0.1
.2C
oef o
f Coh
ort X
Isla
mic
Sup
port
Jan 2008 Jan 2009 Jan 2010 Jan 2011 Jan 2012Month of Birth (cohort)
DPT Vaccine
July2010
July2011
-.2-.1
0.1
.2C
oef o
f Coh
ort X
Isla
mic
Sup
port
Jan 2008 Jan 2009 Jan 2010 Jan 2011 Jan 2012Month of Birth (cohort)
Measles Vaccine
41

11 Appendix Tables
Appendix Table 1. Immunization Calendar of Pakistan
Vaccine First Dose Second Dose Third Dose Fourth Dose
Polio At birth 6 Weeks 10 Weeks 14 WeeksDPT 6 Weeks 10 Weeks 14 WeeksMeasles 9 Months 15 Months
Notes: Official immunization schedule of Pakistan for the main three vaccines. Published by the Expanded Program on Immunization (EPI), Pakistan http://epi.gov.pk/?page\_id=139 (last accessed April 18th, 2017)
42

Appendix Table 2. Descriptive Statistics
Observations Mean Std. Dev.(1) (2) (3)
Received one dose of Polio vaccine 22,346 0.420 0.494Received one dose of DPT vaccine 22,346 0.453 0.498Received one dose of Measles vaccine 22,346 0.226 0.418Received three doses of Polio vaccine 22,346 0.313 0.464Received three doses of DPT vaccine 22,346 0.341 0.474Received all vaccines 22,346 0.202 0.401Illness or injury (two weeks prior to interview) 22,346 0.191 0.393Age (in months) 22,346 9.910 6.358Male 22,346 0.514 0.500
Mother's education level 22,346 3.538 4.369Mother's age 22,346 27.926 6.049
Rural region 22,346 0.658 0.474Radio ownership 22,346 0.223 0.416Television ownership 22,346 0.581 0.493Number of household members 22,346 2.637 1.558Number of rooms 22,346 8.268 3.891
Appendix Table 2. Summary Statistics
Panel A. Child Characteristics
Panel B. Mother Characteristics
Panel C. Household Characteristics
Notes: The unit of observation is the child level. The sample consists of children born between 2010 and 2012 that are less than 24 months of age at the time of interview.
43

Appendix Table 3. Only Controlling for District and Cohort Fixed Effects
Polio DPT Measles(1) (2) (3)
Mean Dep. Var. 0.422 0.455 0.231
Post × IslSup -0.042** -0.041** -0.041**(0.019) (0.018) (0.016)
Observations 20,350 20,350 16,175R-squared 0.257 0.235 0.230Number of Clusters 109 109 109
Magnitude0,422 0,455 0,231-0,042 -0,041 -0,041
-0,099526066 -0,09010989 -0,177489177
Baseline Results, only including month and district FE
Dependent Variable: Dummy for Receipt of 1 Vaccine Dose
Notes: Standard errors clustered at the district-level in parentheses. The unit of observation is the child level. The sample consists of children born between 2010 and 2012 that are less than 24 months of age at the time of interview. We exclude children partially treated. All regressions include district and monthly cohort fixed effects. *** p<0.01, ** p<0.05, *p<0.1.
44


![Finite Elements in Analysis and Designthe fiber angle in individual plies is chosen as design variable, see Stegmann and Lund [34] and Stolpe and Stegmann [35], just to mention only](https://static.fdocuments.us/doc/165x107/5fbb1ab9eedd7453f61b72c2/finite-elements-in-analysis-and-the-iber-angle-in-individual-plies-is-chosen-as.jpg)
