In the Demand Intelligence Universe, Perspective Matters.
11
In the Demand Intelligence Universe, Perspective Matters.
Transcript of In the Demand Intelligence Universe, Perspective Matters.

© 2010 LumiData • In the Demand Intelligence Universe, Perspective Matters. p. 1
In the Demand Intelligence Universe, Perspective Matters.
© 2010 LumiData • In the Demand Intelligence Universe, Perspective Matters. p. 2
Humans used to think the earth was the center of the universe.
Understandable — it was a matter of perspective. With your feet firmly
planted on terra firma, it certainly looked that way.
It wasn’t until Galileo viewed the heavens through his hand-
crafted telescope that the Copernican “sun-as-the-center-
of-the-universe” theory was confirmed. Having viewed the
universe from a perspective never seen before, Galileo made
whole new realms of data and insights available.
So how do things operate within your terra firma — your CPG
enterprise? Are you constrained by looking at things from
just one perspective? Let’s hope not. I mean, you would never
focus your incremental sales growth initiatives on one retailer.
Or one SKU. Or one promotion. Right?
If you’re only looking at raw data, favoring a single data source
or making decisions based on a limited perspective — you’re
missing the bigger picture. Everyone in your organization has
a different perspective and that perspective determines ex-
actly what data they need to see and when they need to see
it. When you pull these varied perspectives together across
your enterprise, you — like Galileo — will be granted a larger,
more informed perspective, based on a 360-degree view of
your entire retail universe.
Just how do you gain a greater perspective?
You start by going vertical.
Right now, many CPG organizations follow a horizontal
data delivery path, in which warehouse data is pushed
out horizontally from business process systems using ETL
capabilities. With ETL platforms, the emphasis is primarily
on delivering raw data —simply making data available to
everyone in the enterprise no matter what their position is
within the enterprise. Little or no regard is paid to providing
the right data to the right user teams, nor providing them
with ready analytics that will help them make more informed
business decisions quickly. As a result, retail team members
© 2010 LumiData • In the Demand Intelligence Universe, Perspective Matters. p. 3
(tier-two) are left to sort the wheat from the chaff, searching
for data insights most relevant to them when it comes to
managing performance. And functional C-level executives
(tier-one) are left to wonder why they appear to have
actionable information within their grasp, but always just out
of reach.
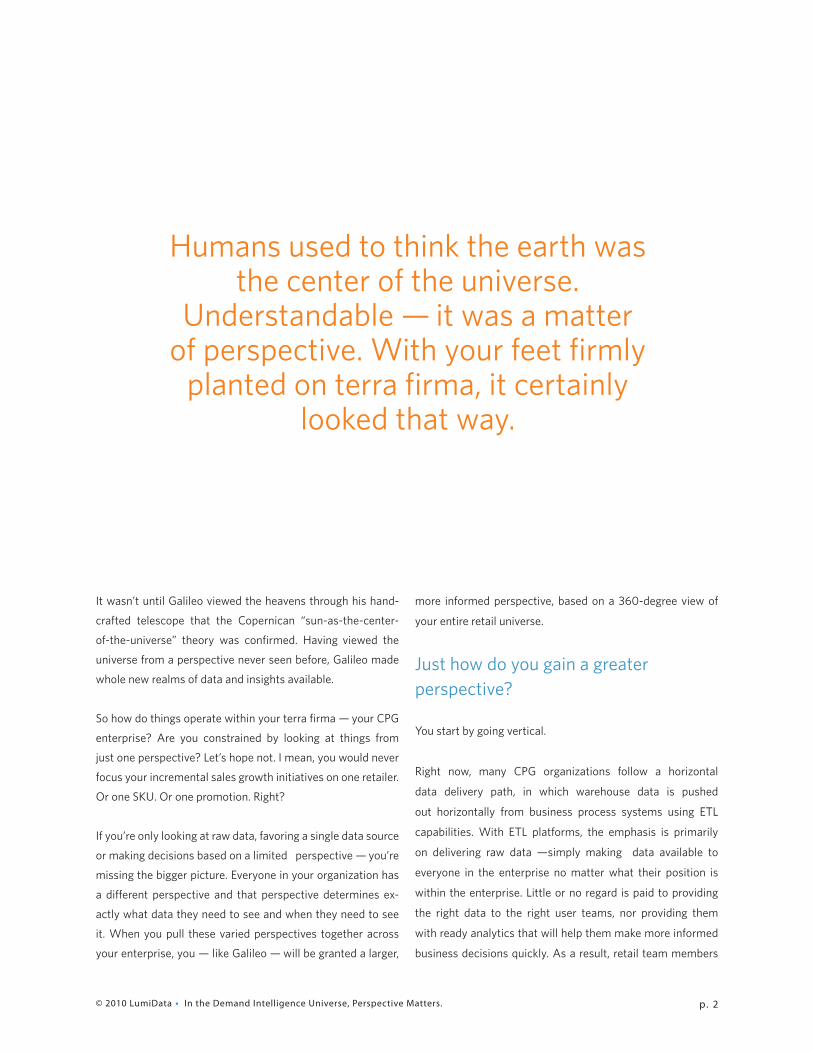
To get a 360-degree perspective you need a vertical business
intelligence (BI) enterprise stack (Figure 1) — the right BI
architecture, tiered BI demands analytics and BI applications
that suit the specific demand intelligence needs of each
member of your organization. This model ensures that you get
the right data to the right people at the right time using the
right analytics. By doing so, you facilitate effective, strategic
decision-making across the enterprise.
CategoryManagement
SalesManagement
ForecastManagement
Supply ChainManagement
S&OPManagement
BI Demand Analytics
POS Data Market Data Forecast Data Order Data Shipment Data
Tier 1: Management TeamIn-house ETL,
process, infrastructure
Tier 2: Retail TeamRetail ETL, conversion, harmonizing
BI Demand Applications
OIT Architecture
BI Demand Enterprise Stack
(Figure 1)
© 2010 LumiData • In the Demand Intelligence Universe, Perspective Matters. p. 4
Which BI architecture offers greater perspectives?
One that integrates and supports varied perspectives, rather
than putting those perspectives into silos. Your BI architecture
serves as a blueprint for how your organization manages
demand intelligence and how you communicate around that
intelligence. Done right, it ensures that each member of your
organization receives the data they need and opens up vertical
and horizontal channels of communication that enhance
strategic decision-making.
In general, three BI architectures are currently in place within
major CPG organizations. The primary differentiators among
the three have to do with who controls data distribution, the
tools used to distribute data, what data individuals receive
and the resulting flow of communication and decision-making.
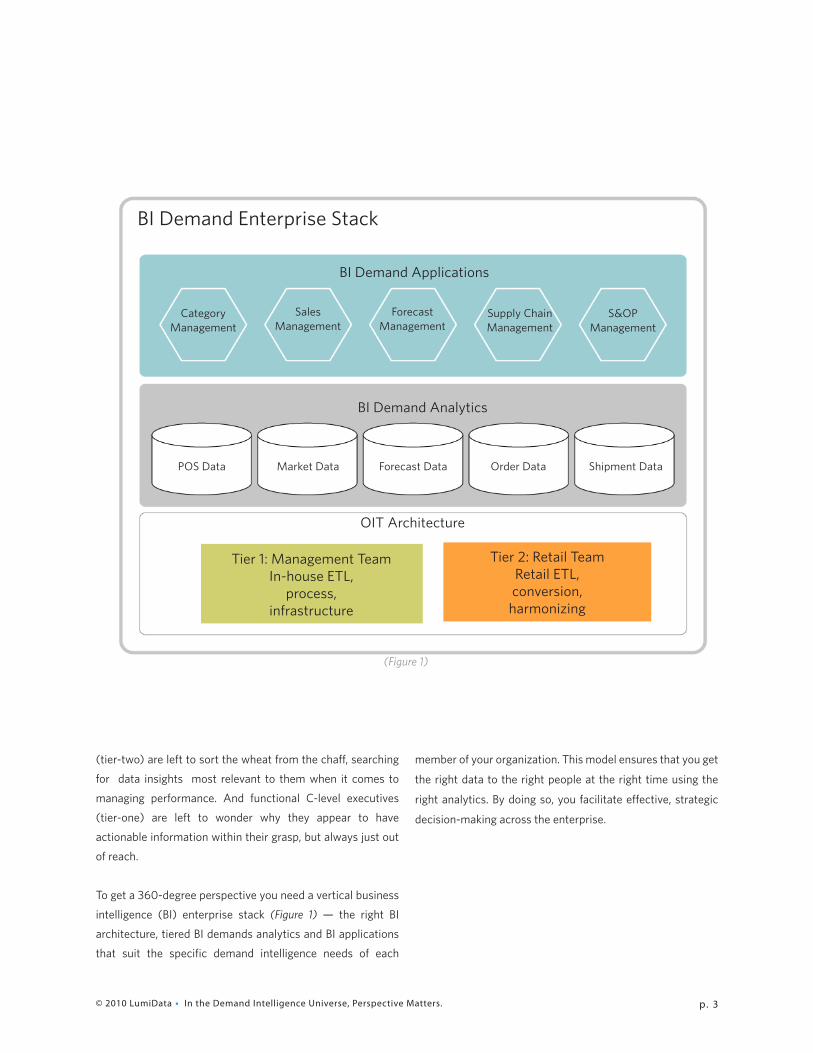
INSIDE-OUT (Figure 2)
The Inside-Out BI architecture favors tier-one managerial
teams and relies heavily on the use of retailer-driven, build-
to-inventory internal order data, and supply side process
operations. Decision making data is largely a by-product of
data flowing from within the company and its order process-
ing systems out to the tier-one managerial teams — thus, an
Inside-Out approach. With the Inside-Out architecture both
suppliers and retailers are potentially vulnerable, because the
supply-demand enterprise is in a perpetual state of reaction
and as such, requires a timely and accurate demand forecast.
In this architecture, data is controlled and processed by IT,
then distributed via an Extract-Transfer-Load (ETL) capability.
Data is not sent according to team needs, but is simply sent
en masse with the expectation that users will utilize the data
to develop their own unique applications. Also, ETLs do not
typically collect and integrate weekly POS data in a timely
manner. Because of this latency, tier-two teams are confined
by conflicting process schedules, and challenged to integrate
dated internal data with weekly POS data. They are also
responsible for writing custom programs to analyze internal
data and then convert, cleanse, harmonize and move POS
data into heir own unique BI application.
While this architecture meets the needs of tier-one teams,
this architecture isn’t well suited to the needs of tier-two retail
sales teams that need timely POS demand data. In most cases,
CPG enterprises with a BI solution based upon this inside-out
architecture now find themselves with an expensive, clumsy
architecture that doesn’t allow retail teams to respond to
demand as it happens nor effectively communicate across
organizational tiers.
p. 4
Operations
Marketing
Sales
Executive Team
Supplier Corporate Headquarters
Corporate DataWarehouse
ETL Data Cube Platform
Business Process Systems
Shipment DataOrder Data
Raw Retailer POS Data
General Demand Management
Analytics
(Figure 2)
© 2010 LumiData • In the Demand Intelligence Universe, Perspective Matters. p. 5
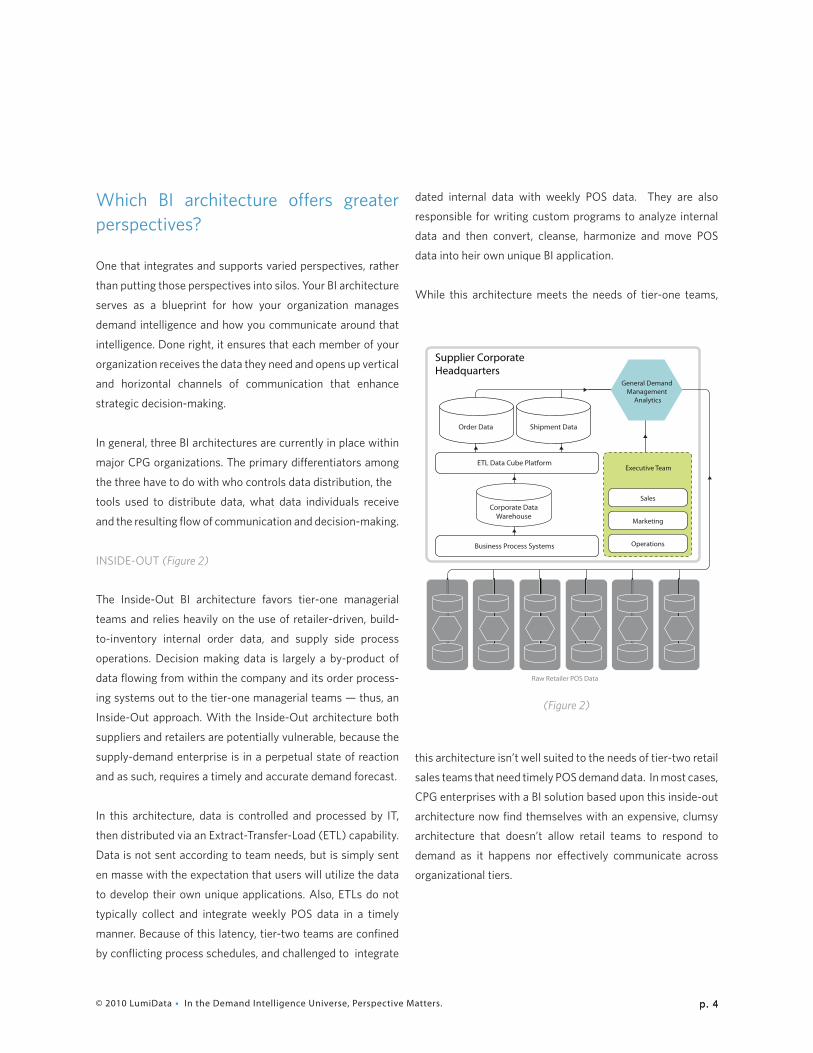
OUTSIDE-IN (Figure 3)
This architecture is driven by, and serves, the tier-two sales
teams — providing them with the real-time demand data they
need. Teams obtain POS data via the retailers’ ETL systems
and integrate disparate sources of order and shipment
data depending upon the supplier’s priorities. While this
architecture can facilitate communication with the retailer,
the retail team’s ability to gather data from their retailers
is subject to each retailer’s ETL system, or lack thereof.
If a retailer does not have a user-friendly, efficient or reliable
ETL system, the team must spend crucial time downloading,
converting, verifying, cleansing and harmonizing that data.
Further, while this architecture promotes active and construc-
tive communication between the retailer and tier-two team
members, it does little for communication between tier-two
and tier-one teams because the majority of the data is POS
data, which is more relevant to tier-two teams.
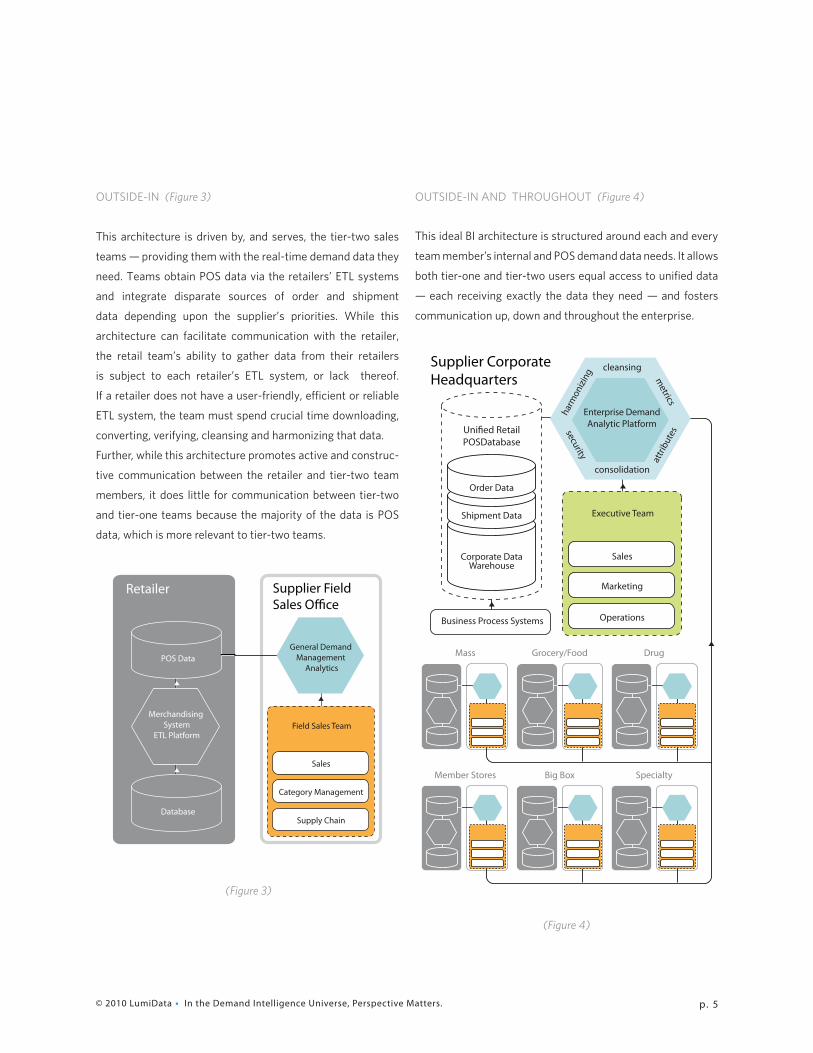
OUTSIDE-IN AND THROUGHOUT (Figure 4)
This ideal BI architecture is structured around each and every
team member’s internal and POS demand data needs. It allows
both tier-one and tier-two users equal access to unified data
— each receiving exactly the data they need — and fosters
communication up, down and throughout the enterprise.
Supply Chain
Category Management
Sales
Field Sales Team
Database
Merchandising System
ETL Platform
POS Data
Retailer Supplier Field Sales O�ce
General Demand Management
Analytics
(Figure 3)
(Figure 4)
Mass Grocery/Food Drug
Member Stores Big Box Specialty
OperationsBusiness Process Systems
Marketing
Sales
Executive Team
attributes
harm
onizing
security
metrics
consolidation
cleansing
Corporate DataWarehouse
Shipment Data
Order Data
Supplier Corporate Headquarters
Uni�ed RetailPOSDatabase
Enterprise DemandAnalytic Platform
© 2010 LumiData • In the Demand Intelligence Universe, Perspective Matters. p. 6
In this architecture, real-time POS data for every retailer in
every channel is gathered and integrated with internal order
and shipment data into a unified enterprise demand database.
Both tier-one and tier-two team members are in complete
control of the timing, availability, and utilization of the demand
and internal data because the data is made instantaneously
available to every team member based upon their unique
needs. People receive what data they want, when they want
it. Ultimately, that means your enterprise can make strategic
decisions based on demand as it happens, as well as access
historical data that helps your enterprise better anticipate
demand going forward.
Now that you understand how critical the right BI architecture
is in utilizing the right BI solution, let’s turn our attention to the
importance of BI analytics.
Why do CPG team members need different analytics?
Because you need to create informed perspectives that build
a 360-degree view of your enterprise, your retailers and
your consumers. Your organization, and the team members
who comprise it, cannot reach their full potential without the
right information and the right analytic tools that help them
strategize based upon a holistic 360-degree view of demand.
If you want them to proactively identify and respond to
opportunities and challenges, then you need to provide them
with the data most relevant to their responsibilities and in
sync with their unique time frame. To do so, you need tiered
business analytics that can address the time frame and job
role disparities of your various team members.
TIME FRAMES
One of the greatest obstacles to using demand intelligence
effectively is coordinating the dynamic decision-making time
frames of consumers, suppliers and retailers.
Consumers make decisions every single day. When they go to
the store, they expect their needs to be met. The result? Daily
POS consumption data is captured that reflects changes and
trends in their purchasing behaviors.
On the other hand, retailers, in cooperation with suppliers,
adjust their decisions on a weekly basis in response to the
previous week’s consumption data. Every week retailers adjust
purchasing, promotional assortments and item allocations
to better meet the consumer’s needs. In turn, these weekly
adjustments affect their overall tactical and operational
merchandising plans and business activities.
Besides adjusting to the weekly needs of retailers, suppliers
utilize historical data and current POS data to adjust their
monthly production plans in order to come up with more
accurate current and new product assortments across all
channels that best meet consumer demands.
JOB ROLES
Everyone in your enterprise has very specific responsibilities.
They all inhabit a very distinct job space — such as a C-level
marketing officer, Target retail team member, Wal-Mart cat-
egory manager, and supply chain manager. And how they
view retail data — and what specific data they need to look
at — is highly dependent on where they are and what they are
charged to do. A c-level marketing executive and a retail team
For a more in-depth discussion of BI
architectures, visitwww.lumidata.com/
whitepapers/
© 2010 LumiData • In the Demand Intelligence Universe, Perspective Matters. p. 7
category manager for Target need to look at the same data at
certain times and very different data at other times.
If you’re just providing tier-one and tier-two team members
with generic or limited demand analytics, they under use
or lose their much-needed unique perspective. And your
company loses
efficiency, synergy
and time. To clearly
identify and act
upon challenges
and opportunities,
they need to
receive the right
information at the
right time. And then
communicate that
distinct perspective
across the internal demand chain, creating a 360-degree
“universal” view comprised of various perspectives.
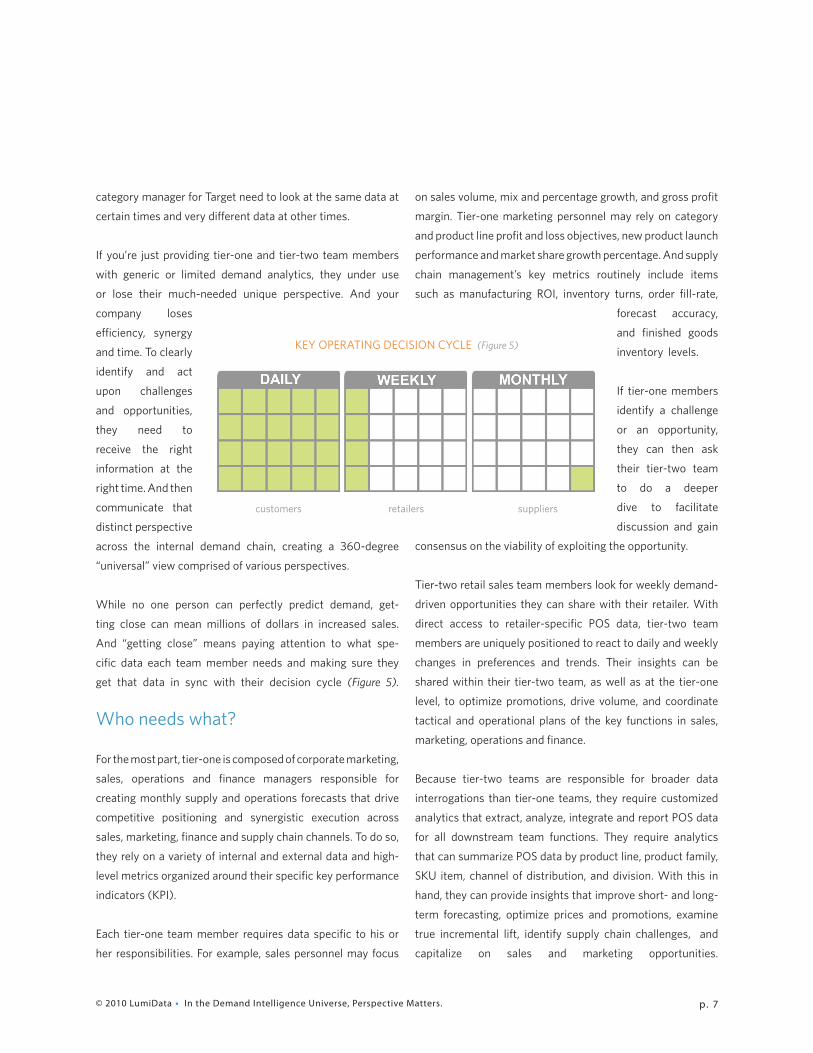
While no one person can perfectly predict demand, get-
ting close can mean millions of dollars in increased sales.
And “getting close” means paying attention to what spe-
cific data each team member needs and making sure they
get that data in sync with their decision cycle (Figure 5).
Who needs what?
For the most part, tier-one is composed of corporate marketing,
sales, operations and finance managers responsible for
creating monthly supply and operations forecasts that drive
competitive positioning and synergistic execution across
sales, marketing, finance and supply chain channels. To do so,
they rely on a variety of internal and external data and high-
level metrics organized around their specific key performance
indicators (KPI).
Each tier-one team member requires data specific to his or
her responsibilities. For example, sales personnel may focus
on sales volume, mix and percentage growth, and gross profit
margin. Tier-one marketing personnel may rely on category
and product line profit and loss objectives, new product launch
performance and market share growth percentage. And supply
chain management’s key metrics routinely include items
such as manufacturing ROI, inventory turns, order fill-rate,
forecast accuracy,
and finished goods
inventory levels.
If tier-one members
identify a challenge
or an opportunity,
they can then ask
their tier-two team
to do a deeper
dive to facilitate
discussion and gain
consensus on the viability of exploiting the opportunity.
Tier-two retail sales team members look for weekly demand-
driven opportunities they can share with their retailer. With
direct access to retailer-specific POS data, tier-two team
members are uniquely positioned to react to daily and weekly
changes in preferences and trends. Their insights can be
shared within their tier-two team, as well as at the tier-one
level, to optimize promotions, drive volume, and coordinate
tactical and operational plans of the key functions in sales,
marketing, operations and finance.
Because tier-two teams are responsible for broader data
interrogations than tier-one teams, they require customized
analytics that extract, analyze, integrate and report POS data
for all downstream team functions. They require analytics
that can summarize POS data by product line, product family,
SKU item, channel of distribution, and division. With this in
hand, they can provide insights that improve short- and long-
term forecasting, optimize prices and promotions, examine
true incremental lift, identify supply chain challenges, and
capitalize on sales and marketing opportunities.
KEY OPERATING DECISION CYCLE (Figure 5)
customers retailers suppliers
© 2010 LumiData • In the Demand Intelligence Universe, Perspective Matters. p. 8
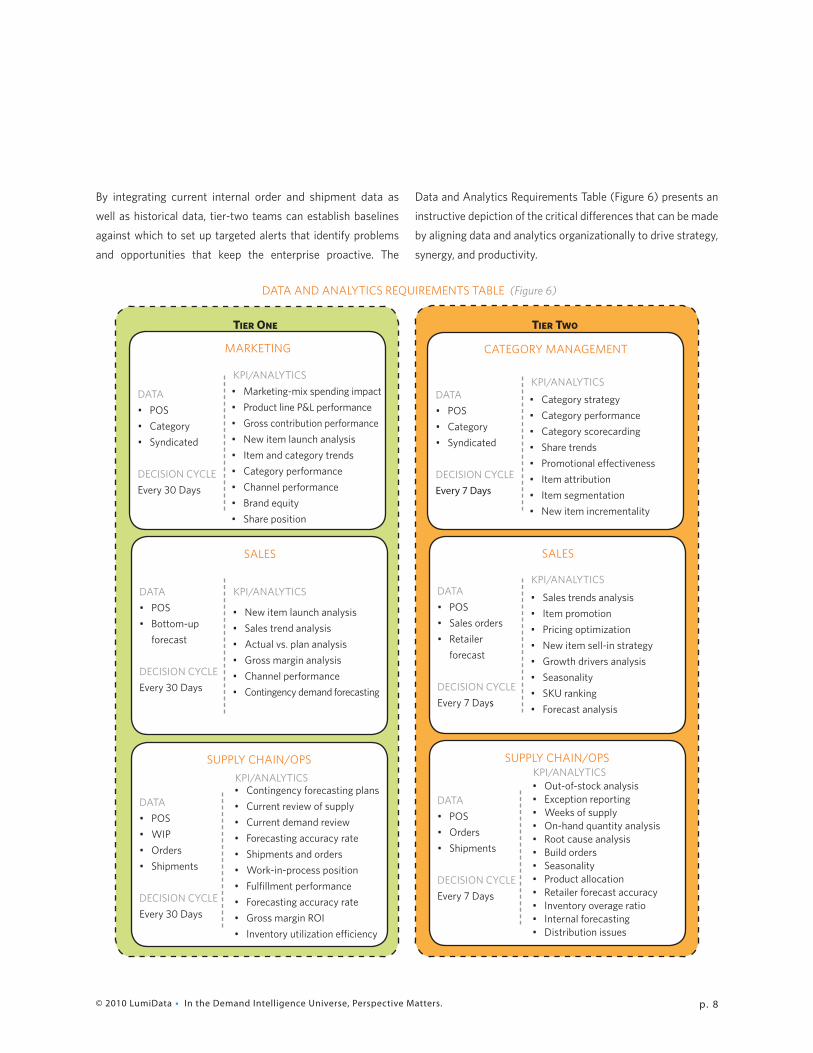
By integrating current internal order and shipment data as
well as historical data, tier-two teams can establish baselines
against which to set up targeted alerts that identify problems
and opportunities that keep the enterprise proactive. The
Data and Analytics Requirements Table (Figure 6) presents an
instructive depiction of the critical differences that can be made
by aligning data and analytics organizationally to drive strategy,
synergy, and productivity.
Tier One
Sales POS Every Bottom-up 30 forecast Days
DATA• POS• WIP• Orders• Shipments
DECISION CYCLE Every 30 Days
KPI/ANALYTICS• Contingency forecasting plans• Current review of supply• Current demand review• Forecasting accuracy rate• Shipments and orders• Work-in-process position• Fulfillment performance• Forecasting accuracy rate• Gross margin ROI• Inventory utilization efficiency
DATA• POS• Bottom-up forecast
DECISION CYCLE Every 30 Days
KPI/ANALYTICS
• New item launch analysis• Sales trend analysis• Actual vs. plan analysis• Gross margin analysis• Channel performance• Contingency demand forecasting
DATA• POS• Category• Syndicated
DECISION CYCLE Every 30 Days
KPI/ANALYTICS• Marketing-mix spending impact• Product line P&L performance• Gross contribution performance• New item launch analysis• Item and category trends• Category performance• Channel performance • Brand equity• Share position
MARKETING
SALES
SUPPLY CHAIN/OPS
Tier Two
Sales POS Every Bottom-up 30 forecast Days
DATA• POS• Orders• Shipments
DECISION CYCLE Every 7 Days
KPI/ANALYTICS• Out-of-stock analysis• Exception reporting• Weeks of supply• On-hand quantity analysis• Root cause analysis• Build orders• Seasonality• Product allocation• Retailer forecast accuracy• Inventory overage ratio• Internal forecasting• Distribution issues
DATA• POS• Sales orders• Retailer forecast
DECISION CYCLE Every 7 Days
KPI/ANALYTICS
• Sales trends analysis• Item promotion• Pricing optimization• New item sell-in strategy• Growth drivers analysis• Seasonality• SKU ranking• Forecast analysis
DATA• POS• Category• Syndicated
DECISION CYCLE Every 7 Days
KPI/ANALYTICS
• Category strategy• Category performance• Category scorecarding• Share trends• Promotional effectiveness• Item attribution • Item segmentation• New item incrementality
CATEGORY MANAGEMENT
SALES
SUPPLY CHAIN/OPS
DATA AND ANALYTICS REQUIREMENTS TABLE (Figure 6)
© 2010 LumiData • In the Demand Intelligence Universe, Perspective Matters. p. 9
Aren’t all analytics the same?
No — analytics are as varied as the individuals in your
organization. Business analytics can be as simple as a single
user-defined Excel calculation or as robust as a collection of
advanced quantitative methods and statistical techniques. The
broad domain of analytics is classified into two basic types:
deterministic and predictive. Each is designed to be used on
different forms and dimensions of data, at different times, in
different parts of the business, and for different purposes.
Deterministic analytics include a wide range of user-defined
analytics, tailored to meeting the unique KPI-related business
requirements of the user. Deterministic analytics are usually
included in a BI application that allow a user to intuitively
and easily explore past performance, correlate metric trends,
and ask self-directed iterative questions – usually on the fly.
Because these analytics are user-defined, they can more
readily adapt to rapid fluctuations in consumer trends, and
provide answers to questions that speak to at-the-moment
challenges in sales trends. With the help of these analytics,
users can also review and analyze historical demand to affirm
what’s already known, validate current facts, and discover
new insights that can improve performance.
Predictive analytics, on the other hand, are static pre-written
statistical functions and quantitative data-handling methods
that routinely analyze massive amounts of data in order to
determine the best indicator(s) of future performance or de-
sired outcomes. Predictive analytics initially found an earlier
home in manufacturing and supply chain operations — em-
bedded within supply forecasting routines in order to use
multi-variables such as economic order quantities, inventory,
orders, shipments, plant capacity, conflicting and competing
line constraints, and transportation logistics to determine the
optimum production forecast.
Now, CPG organizations and major retailers use predictive
analytics on different hierarchical slices of POS data to
analyze current and past consumer purchasing behaviors
and from that, determine how likely consumers are to act in
a similar manner in the future and what to do about it. Users
can identify both risks and opportunities by examining factors
such as consumer demographics, marketing mix elements,
SKU assortment, promotions, and seasonality to see which
combination is the most effective in improving sales.
Both deterministic and predictive analytics allow users to:
• Accommodate and handle large amounts of data.
• Quickly understand and interpret informational insights.
• Generate basic reporting and tracking of current-period
results.
• Measure current position against key performance
indicators.
• Address multiple levels of data, with drill-down
interrogative and investigative capability.
• Present summary analysis in a wide variety of reporting
formats, dashboards, charts, graphs, and tables.
Which analytics give me the 360-degree view of my business?
Again, it all comes down to perspective — a person’s posi-
tion in the organization, what that person’s responsibilities
are and how that defines their unique data and analytic needs.
Each member of your organization is charged with analyzing
performance data, providing insights based on that data and
using those insights to successfully manage their own unique
KPIs.
In general, predictive analytics are most commonly used by
specific tier-one teams as an integral part of business process
systems and one-off special projects in marketing and
operations management. As an example, a tier-one corporate
marketing officer might use predictive analytics to gain a
fresher look at how national demographics such as disposable
income, age, ethnicity, and geographic regions are statistically
© 2010 LumiData • In the Demand Intelligence Universe, Perspective Matters. p. 10
related to the sales performance of a single SKU, or group of
SKUs, sold over time. The outcome of such an analysis would
then be used to fine-tune the marketing mix spending model.
While predictive statistical models are rather reliable in
predicting future performance when business and market
conditions remain relatively stable, these tools are less
effective when unpredictable market forces occur, such as a
sharp downturn in the economy, spiraling interests rates, and
rapidly increasing gas prices. Thus, predictive analytics are
best used in conjunction with tier-two team members using
deterministic analytics to look at current demand data in more
responsive and tactical ways.
Tier-two teams are the most common users of deterministic
analytics because these analytics are more agile and allow the
teams to respond rapidly to the dynamic changes in
downstream retail channels. These comprehensive, flexible,
intuitive, and easy-to-use
analytics can be customized
around the unique needs of the
retailer and supplier. And they
can be used to examine the
effects of varied factors on
demand, such as statistical facts,
exogenous trends, shifting
demand, new product
introduction, and evolving
shopper insights. Deterministic analytics can also incorporate
built-in performance-driven alerts that flag potential problems
and potential opportunities.
Thus, deterministic analytics play to the needs of tier-two
sales teams that need to respond rapidly to blips in
performance by providing innovative analysis and insights as
to how the company and retailer should respond. If your
organization’s downstream sales teams aren’t armed with
deterministic analytics, you can gradually lose competitive
ground and aisle share. So in reality, your organization will
need a demand intelligence solution that provides you with
both deterministic and predictive analytics in order to respond
on a daily, weekly and monthly basis to ever-changing
consumer trends and the unique data needs of each of your
team members.
Gain perspective — start asking questions.
In the recent past, supply and order data were the center of
the CPG universe. Today, demand intelligence has widened
our perspective and presents CPG organizations with the
opportunity to make timely decisions that better meet the
needs of consumers on a daily, weekly and monthly basis.
When assessing how to either better use your current demand
intelligence solution — or whether a new demand intelligence
solution is needed — look to the BI demand enterprise stack
to help blueprint your strategy.
Every level of the stack is
critical to optimizing the use
of demand data and driving
strategic synergy and cross-
functional communication
and collaboration throughout
your enterprise. You need an
Outside-In and Throughout BI
architecture that inherently fuels
enterprise-wide collaboration
and communication. You need a mix of deterministic and
predictive BI demand analytics, capitalizing on the strengths of
each analytic to ensure you get the right data into the hands of
the right people at the right time. And then you look to specific
BI demand applications that can be further customized to the
unique needs of each member in your organization.
Start by asking relevant, practical and strategic questions.
Yes, in the greater sense, everyone at every tier needs a
unified data source. But the trick is understanding what they
specifically need from that data source and when they need it.
So ask them — and yourself — what data and analytics matter
What unique mix of demand intelligence
capabilities will best enable you to perform
at optimal levels?
© 2010 LumiData • In the Demand Intelligence Universe, Perspective Matters. p. 11
most relative to achieving superior business performance
from their perspective? What unique mix of demand
intelligence capabilities will best enable you to perform at
optimal levels? And how soon — and often — do you need it?
This will help you determine which set of analytics will best
suit their needs.
True CPG champions will ask these questions. And with that
information in hand, they will build a BI demand enterprise
stack that increases the productivity, organizational synergy,
and incremental gains that help them strategically compete in
the CPG industry and — like Galileo — provide much-needed
new perspectives that open up a universe of opportunity.
ABOUT LUMIDATA
LumiData is a demand intelligence specialist providing retail demand information that assists Fortune 1000 consumer goods companies to evolve their business strategies. LumiData’s combina-tion of software dashboard applications and client services creates easy-to-visualize demand planning solutions utilized to drive sales and marketing strategies that increase revenue, improve margins, enhance retailer partnerships and strengthen market positions.
ABOUT THE AUTHOR
Ransom Stafford, MBARansom Stafford has served as the president and CEO of LumiData for five years. He has more than 25 years of corporate experience in information technology, business consulting and infra-structure change management, and has held a variety of managerial positions with IBM, Control Data and The St. Paul Companies. He is an expert at business architecture re-engineering — aligning strategic intent, technology, business processes and people to achieve maxi-mum organizational productivity. During his career, he has been instrumental in helping organizations optimize their success by providing employees with the right resources they need to maximize their contribution.
12 S. Sixth Street 710 Plymouth Building Minneapolis, MN 55402Phone: 612.767.2880
Toll Free: 888.767.2885
203 S.E. 22nd StreetSuite 5Bentonville, AR 72712Phone: 479.876.8680
www.lumidata.com
CMYK: 3 61 100 0CMYK: 0 47 87 0CMYK: 94 80 51 64CMYK: 47 13 7 0