
In Support of the First Five Years of B.C.’s Carbon ... · PDF fileIn Support of the...
28
Head Office: 825 Raoul-Jobin, Quebec City (Quebec) Canada, G1N 1S6 T: +1 418 780-0158 Montreal Office, 203-1097 Saint-Alexandre, Montreal (Quebec) Canada, H2Z 1P8 T: +1 514 787-1724 ECONOMIC ANALYSIS OF BRITISH COLUMBIA’S CARBON OFFSET PROJECTS In Support of the First Five Years of B.C.’s Carbon Neutral Government Program (2010-2014) FINAL REPORT Prepared for the Climate Action Secretariat December 1, 2015
Transcript of In Support of the First Five Years of B.C.’s Carbon ... · PDF fileIn Support of the...

Head Office: 825 Raoul-Jobin, Quebec City (Quebec) Canada, G1N 1S6 T: +1 418 780-0158
Montreal Office, 203-1097 Saint-Alexandre, Montreal (Quebec) Canada, H2Z 1P8 T: +1 514 787-1724
ECONOMIC ANALYSIS OF BRITISH COLUMBIA’S
CARBON OFFSET PROJECTS
In Support of the First Five Years of B.C.’s Carbon Neutral Government Program (2010-2014)
FINAL REPORT
Prepared for the Climate Action Secretariat
December 1, 2015

©2015 ÉcoRessources Published by ÉcoRessources
ECONOMIC IMPACTS ANALYSIS OF B.C.’S CARBON NEUTRAL GOVERNMENT PROGRAM
I
EXECUTIVE SUMMARY
In accordance with its greenhouse gas (GHG) emission reduction targets set out in the Greenhouse Gas Reduction Targets Act, the government of British Columbia (B.C.) has declared carbon neutrality across its public sector every year since 2010. This includes provincial ministries and agencies, hospitals, schools, colleges and universities, and Crown corporations. To achieve carbon neutrality, these organizations measure, reduce, offset, and report their GHG emissions. Offsets are purchased from eligible emission reduction projects on behalf of the public sector organizations by the Climate Action Secretariat (CAS), a part of the B.C. Ministry of Environment. To be eligible, offset projects must be based in B.C. and offsets must be generated in compliance with the Greenhouse Gas Reduction Targets Act and the Emission Offsets Regulation.
The objective of this study is to assess the economic impacts of the capital and operating expenditures of the 23 emission offset projects undertaken by private organizations from which the provincial public sector purchased offsets in 2013 and 2014. This assessment focuses on the employment, gross domestic product (GDP) and government revenues generated by these projects’ expenditures. The objective of this study is similar to that of a study conducted for the period of 2008-2012 (PwC, 2012).
OFFSET PROJECTS
In order to provide emission offsets to the provincial public sector, all potential emission offset project proponents must submit their proposals through a Request for Emission Offsets (RFEO) competitive process. The RFEO identifies four key offset project types, which are: i) fuel switch projects that replace a GHG-emitting energy source with another energy source that emits less or no GHG, ii) energy efficiency projects that use new technologies to reduce fuel or energy consumption, iii) sequestration projects that remove GHG from the atmosphere or avoid the release of GHG through activities such as planting trees and protecting forests that would otherwise be harvested, and iv) GHG destruction activities that convert one or more GHG to reduce their global warming potential.

ECONOMIC IMPACTS ANALYSIS OF B.C.’S CARBON NEUTRAL GOVERNMENT PROGRAM
II
In 2013 and 2014, the government of B.C. invested over $23.7 million in 23 offset projects to purchase a total of 1.92 million tonnes of offsets. The demand for offsets has resulted in capital investments and operating expenditures from offset projects that have created positive economic and social impacts in the province. These offset projects were implemented by organizations from seven industries: agriculture, forestry (industrial), forestry (land-based), industrial, oil & gas, transportation, and waste management.
ECONOMIC IMPACTS OF OFFSET PROJECTS
This economic impact assessment is based on an input-output (I-O) framework; it uses capital and operating expenditures from offset projects and introduces them into an I-O model to determine how the money circulates through the different sectors of the B.C. economy, creating jobs, GDP and revenues for the different levels of government. The approach used in this study only considers positive economic impacts as a consequence of project expenditures, and does not assess the opportunity costs of project expenditures or alternative scenarios in which project proponents would not have received payment for offset sales.1 Primary expenditure data were obtained from project proponents for 10 projects, including four projects for which partial data were obtained. These data were assessed for reasonableness, but were not reviewed for accuracy and completeness. Secondary data sources were used to approximate the expenditures of the remaining projects. ÉcoRessources was unable to approximate the operating expenditures of three offset projects; these projects were thus excluded from the economic impacts assessment.
KEY FINDINGS
Compared to PwC (2012), we observe a shift from capital expenditure predominance to operating expenditure predominance, because most projects in the 2013 and 2014 offset portfolio were implemented before 2013 and were in their operation phase during the years covered in this study. Their capital investments were made before 2013 and were captured in PwC (2012).
1 One exception to this approach was for the operating expenditures of the BC Transit/TransLink offset project. See footnote
on page 3.
ECONOMIC IMPACTS ANALYSIS OF B.C.’S CARBON NEUTRAL GOVERNMENT PROGRAM
III
The annual operating expenditures of the offset projects in the 2013 and 2014 offset portfolio, estimated at $24.0 million, generate the following annual economic impacts:
o Contribution to the provincial GDP: $28.9 million;
o Revenues for governments: $3.7 million including $1.9 million in revenue for the federal government, $1.5 million for the provincial government and $0.3 million for municipal governments;
o Job creation: 221 jobs measured in person-years.
Taken together with the previous study (PwC, 2012), this study provides a complete evaluation of the economic impacts of offset projects in B.C. since the launch of the Carbon Neutral Government program in 2008.
o Overall, the Province of British Columbia has invested $53.4 million to purchase 4.5 million tonnes of offsets since the beginning of the program.
o From the beginning of the program in 2008 until the end of 2014, total capital expenditures from offset projects reached an estimated $327 million. These expenditures led to the following impacts:
Contribution to the provincial GDP: $248.2 million;
Revenues for governments: $49.8 million including $23.4 million in revenue for the federal government, $20.5 million for the provincial government and $5.9 million for municipal governments;
Job creation: 2,903 jobs measured in person-years.
o The estimated economic impacts of operating expenditures from the beginning of the program in 2008 until the end of 2014 are:
Contribution to the provincial GDP: $124.3 million;
Revenues for governments: $26.8 million including $12.1 million in revenue for the federal government, $12.3 million for the provincial government and $2.4 million for municipal governments;
Job creation: 1,535 jobs measured in person-years.

ECONOMIC IMPACTS ANALYSIS OF B.C.’S CARBON NEUTRAL GOVERNMENT PROGRAM
IV
TEAM
ACKNOWLEDGMENTS
ÉcoRessources thanks all of the organizations that contributed directly or indirectly to the outcome of this project by sharing data and information and, in particular, the proponents of the offset projects analyzed in this study.
WRITING, RESEARCH AND ANALYSIS Renaud Sanscartier ÉcoRessources
ADDITIONAL RESEARCH Mathieu Dumas ÉcoRessources
Michael Margolick President, Michael Margolick & Assoc. Ltd
ECONOMIC MODELLING Marcel LeBreton President, EcoTec Consultants
SCIENTIFIC ADVISORS Mathieu Dumas ÉcoRessources
Michael Margolick President, Michael Margolick & Assoc. Ltd
Jean Nolet President, ÉcoRessources

ECONOMIC IMPACTS ANALYSIS OF B.C.’S CARBON NEUTRAL GOVERNMENT PROGRAM
V
TABLE OF CONTENTS
EXECUTIVE SUMMARY ................................................................................................................. I
TEAM ................................................................................................................................... IV
ACKNOWLEDGMENTS ................................................................................................................ IV
1. INTRODUCTION ................................................................................................................... 1
1.1 CONTEXT AND OBJECTIVES ................................................................................................................... 1 1.2 STUDY LIMITATIONS ............................................................................................................................ 3
2. CARBON NEUTRALITY AND OFFSET PROJECTS ............................................................................... 5
3. ECONOMIC IMPACTS OF OFFSET PROJECTS .................................................................................. 7
3.1 METHODOLOGY ................................................................................................................................. 7 3.2 EXPENDITURE DATA ............................................................................................................................ 9
3.2.1 CAPITAL AND OPERATING EXPENDITURES CONSIDERED ................................................................... 9 3.2.2 DATA COLLECTION ................................................................................................................. 10
3.3 ECONOMIC IMPACTS OF CAPITAL EXPENDITURES .................................................................................... 11 3.4 ECONOMIC IMPACTS OF OPERATING EXPENDITURES ............................................................................... 12 3.5 TOTAL ECONOMIC IMPACTS OF OFFSET PROJECTS SINCE THE BEGINNING OF THE
CARBON NEUTRAL GOVERNMENT PROGRAM ........................................................................................ 13
REFERENCES .......................................................................................................................... 15
APPENDICES .......................................................................................................................... 16
APPENDIX 1. GHG EMISSIONS REDUCTION PROJECTS THAT PROVIDED OFFSETS IN 2013 AND 2014 ...................... 17 APPENDIX 2. INPUT-OUTPUT FRAMEWORK: MODEL AND ASSUMPTIONS ............................................................ 19 APPENDIX 3. SELECTED COMMODITIES FOR MODELLING ................................................................................. 21
LIST OF TABLES
TABLE 1. EMISSION OFFSET PROJECT PORTFOLIO BY INDUSTRY SECTOR, 2013 AND 2014 ............................ 6
TABLE 2. ECONOMIC IMPACTS OF CAPITAL EXPENDITURES FROM EMISSION OFFSET PROJECTS THAT WERE UNDER AN OFFSET PURCHASE AGREEMENT SIGNED IN 2013 OR LATER ............................. 11
TABLE 3. ECONOMIC IMPACTS OF ANNUAL OPERATING EXPENDITURES FROM EMISSION OFFSET PROJECTS THAT WERE UNDER AN OFFSET PURCHASE AGREEMENT IN 2013 AND IN 2014 ..................... 12
TABLE 4. TOTAL ECONOMIC IMPACTS OF CAPITAL EXPENDITURES FROM OFFSET PROJECTS, 2008-2014............... 13
TABLE 5. TOTAL ECONOMIC IMPACTS OF OPERATING EXPENDITURES FROM OFFSETS PROJECTS, 2008-2014.... 14
TABLE 6. GHG EMISSIONS REDUCTION PROJECTS THAT PROVIDED OFFSETS IN 2013 AND 2014 ................... 17

ECONOMIC IMPACTS ANALYSIS OF B.C.’S CARBON NEUTRAL GOVERNMENT PROGRAM
1
1. INTRODUCTION
1.1 CONTEXT AND OBJECTIVES
As part of its greenhouse gas (GHG) emission reduction objectives set out in the Greenhouse Gas Reduction Targets Act, the Province of British Columbia committed to become carbon neutral across its provincial public sector every year starting in 2010. To achieve carbon neutrality, public sector organizations (PSO) are required to measure their GHG emissions, reduce these emissions as much as possible (e.g. through energy efficiency or emission reduction measures), apply emission offsets to emissions that cannot be reduced, and report on their achievement. The PSOs concerned with these requirements include provincial ministries and agencies, hospitals, schools, colleges and universities, and Crown corporations.2
Emission offsets are reductions in GHG emissions (measured in tonnes of carbon dioxide equivalent, or CO2e) that can be used to compensate for, or offset, emissions from other sources. In this case, GHG emissions reductions from private sector projects are used to compensate for the public sector’s emissions that cannot be eliminated. To be eligible for the B.C. Carbon Neutral Government program, offset projects must be based in B.C. and offsets must be generated in compliance with the Greenhouse Gas Reduction Targets Act and the Emission Offsets Regulation.
The Climate Investment Branch (CIB), a unit of the B.C. Ministry of Environment’s Climate Action Secretariat, was created in 2014 to procure offsets on behalf of the B.C. public sector. It replaced the Pacific Carbon Trust (PCT), a Crown corporation that was responsible for offset procurement until April 2014, when it was dissolved and its functions transferred to CIB.
From 2010 to 2014, between 14 and 26 emissions reduction projects delivered offsets to the B.C. public sector each year to enable it to achieve carbon neutrality. These projects, all of which have been implemented within the province (as required by the regulation), not only contribute to the province’s emissions reduction goals, but also provide economic benefits through the creation of jobs, gross domestic product (GDP) and government revenues. In some cases, offset projects also provide other benefits to the province, such as fostering the development of clean energy and technologies (e.g. hydrogen fuel cell buses), contributing to
2 To achieve carbon neutrality, hospitals, schools, colleges and universities, Crown corporations, ministries and agencies must
account for their paper, fleet and building emissions. Core government ministries and agencies must also account for their business travel emissions.

ECONOMIC IMPACTS ANALYSIS OF B.C.’S CARBON NEUTRAL GOVERNMENT PROGRAM
2
forest conservation efforts, or providing new economic opportunities (e.g. market for biomass, or wood residues).
The objective of this study was to assess the economic impacts of the capital and operating expenditures of the 23 emission offset projects undertaken by private organizations from which the provincial public sector purchased offsets in 2013 and 2014. This assessment focused on the employment, GDP and government revenues resulting from these offset projects.
The objective of the present study is similar to that of a study conducted for the period of 2008-2012 (PwC, 2012). As the previous study considered the capital expenditures of many offset projects that are still part of the 2013 and 2014 portfolio, this present study only analyzed the economic impacts of these projects’ operating expenditures. This was to ensure that expenditure data were only considered once in each report, so that both studies taken together provide a complete evaluation of the economic impacts of offset projects in B.C. since the inception of the Carbon Neutral Government program.
This report is constructed as follows:
In Section 2, the Carbon Neutral Government program implemented in B.C. under the Greenhouse Gas Reduction Targets Act is described. The types of projects that provided offsets to the B.C. government in 2013 and 2014 are also presented. Overall, 23 projects from seven industries were included in this assessment.
The methodology implemented to achieve the study’s objectives, including data collection and input-output (I-O) modelling, is explained in Section 3. Data availability and reliability are also discussed. The study’s results, i.e. the economic impacts of offset projects in B.C., are then presented. These results are presented first for the offset projects that were part of the province’s offset portfolio for the years 2013 and 2014, and are divided between impacts resulting from capital expenditures and impacts resulting from operating expenditures. These impacts are then summed with those of projects from which offsets were sourced and delivered to the government between 2008 and 2012, as measured in a previous study (PwC, 2012). Together, these provide a complete evaluation of the economic benefits created by offset projects since the beginning of B.C.’s Carbon Neutral Government program.
ECONOMIC IMPACTS ANALYSIS OF B.C.’S CARBON NEUTRAL GOVERNMENT PROGRAM
3
1.2 STUDY LIMITATIONS
This economic impact assessment is based on an I-O framework; it uses capital and operating expenditures from offset projects and introduces them into an I-O model to determine how the money circulates through the different sectors of the B.C. economy, creating jobs, GDP and revenues for the different levels of government.
The approach used in this study did not consider the opportunity costs of project expenditures, i.e. the value of the best alternative use that could have been made of these funds. Nor did it consider alternative scenarios in which project proponents would not have received payment for offset sales. Hence, only positive economic impacts as a consequence of project expenditures were estimated.3
Primary expenditure data were collected for 10 offset projects (out of 23), including four projects for which partial data were obtained. These data were not reviewed by ÉcoRessources, and were presumed to be complete and accurate. Project expenditures were approximated for most remaining projects through secondary data obtained from various sources. Although ÉcoRessources adopted a conservative approach in approximating those expenditures, it was impossible to assess the accuracy of these approximations. Finally, the information gathered from secondary sources was considered insufficient to develop solid approximations of the expenditures of three of the offset projects, which were thus excluded from the economic impacts assessment (see Appendix 1).
Finally, an attempt was made to integrate the results of this study, which covers the years 2013 and 2014, with results from a previous economic impacts study covering the period of 2008-2012 (PwC, 2012). Though both studies used an I-O framework, their respective approach and assumptions are not entirely similar. For example, in evaluating the impacts of operating expenditures, PwC (2012) used data provided by the PCT, which covered 13 of the 31 projects that were assessed. The operating expenditures of the other projects were excluded from the assessment. In the current study, no operating or capital expenditure data were provided by CIB due to confidentiality requirements, so both primary expenditure data obtained from project proponents and secondary data were used to estimate expenditure data of offset projects. This approach enabled the assessment of operating expenditures for 3 One exception to this approach was for the operating expenditures of the BC Transit/TransLink offset project. This project,
which involved purchasing new low-emissions vehicles such as hybrid buses, stands out from other offset projects since it leads to a significant increase in the proponents’ core business activities (and, consequently, to a significant increase in operating costs), while other projects concern peripheral activities of the proponents’ organizations (e.g. boiler modification in a greenhouse or a pulp mill). A more conservative approach was thus adopted, in which an alternative scenario was determined (i.e. the same number of vehicles would have been purchased, but these would have been conventional diesel buses instead of hybrid buses), and only the increased maintenance costs of hybrid buses compared to diesel buses was considered in the analysis.
ECONOMIC IMPACTS ANALYSIS OF B.C.’S CARBON NEUTRAL GOVERNMENT PROGRAM
4
20 of the 23 projects considered, but relied more heavily on approximations. Furthermore, in the PwC study (2012), the methodology used was described in general terms, and it was not possible to obtain more in-depth methodological details. It was thus impossible to determine the precise similarities and differences between the methodologies used in each of the studies.
For these reasons, the results presented in this report should be considered as orders of magnitude of actual values and should therefore be used with caution.

ECONOMIC IMPACTS ANALYSIS OF B.C.’S CARBON NEUTRAL GOVERNMENT PROGRAM
5
2. CARBON NEUTRALITY AND OFFSET PROJECTS
The Emission Offsets Regulation sets out requirements for emission reduction projects. This regulation ensures the quality of offsets purchased by the Province of British Columbia through requirements such as having the project plan validated and the project reports verified in manners that are consistent with international standards, and ensuring that GHG emission reductions are calculated in a conservative manner. The regulation also requires that emission reductions occur within the province of B.C.
Four types of projects provide emission offsets to the B.C. government to help the public sector achieve carbon neutrality: fuel switch, energy efficiency, sequestration, and GHG destruction activities. Fuel switch projects involve replacing a GHG-emitting energy source (e.g. natural gas, diesel) with another energy source that emits less or no GHG (e.g. hydroelectricity, biomass). Energy efficiency projects involve implementing technologies to reduce fuel or energy consumption while maintaining a similar service. Sequestration projects remove GHG from the atmosphere or avoid the release of GHG through activities such as planting trees, protecting forests that would otherwise be harvested, and other forest management practices. Finally, GHG destruction activities convert one or more GHG to reduce their global warming potential (e.g. converting methane produced in a landfill into CO2
through flaring).
In 2013 and 2014, the government of B.C. invested over $23.7 million in 23 offset projects to purchase a total of 1.92 million tonnes of offsets4. These leveraged investments and expenditures from offset projects which, in turn, generated positive economic impacts in the province (see Section 3). These offset projects were implemented by organizations from seven industries: agriculture, forestry (industrial), forestry (land-based), industrial, oil & gas, transportation, and waste management (see Table 1).
4 Emission offsets are measured in tonnes based on their carbon dioxide equivalencies.

ECONOMIC IMPACTS ANALYSIS OF B.C.’S CARBON NEUTRAL GOVERNMENT PROGRAM
6
TABLE 1. EMISSION OFFSET PROJECT PORTFOLIO BY INDUSTRY SECTOR, 2013 AND 2014
Sector Number of projects
Volume of offsets (tonnes)
Percentage of industry offsets
to total
Agriculture 1 25,984 1.4%
Forestry (industrial) 8 305,115 15.9%
Forestry (land-based) 5 1,170,140 60.9%
Industrial 1 12,157 0.6%
Oil & gas 5 341,474 17.8%
Transportation 1 4,541 0.2%
Waste management 2 61,272 3.2%
TOTAL 23 1,920,683 100.0%
The list of offset projects that were assessed for this study can be found in Appendix 1.
ECONOMIC IMPACTS ANALYSIS OF B.C.’S CARBON NEUTRAL GOVERNMENT PROGRAM
7
3. ECONOMIC IMPACTS OF OFFSET PROJECTS
3.1 METHODOLOGY
I-O models are built from a system of linear equations that describe how an industry buys products (from itself and other industries) to produce the goods and services that it sells (to itself, to other industries or to final consumers). I-O models can include anywhere from a few industries (e.g. large categories such as “manufacturing”) to several hundred industries (e.g. petroleum products manufacturing, dairy product manufacturing, plastic product manufacturing). These equations are constructed from observed economic data and can pertain to various geographical levels, such as a province or a whole country. I-O models are used to assess how a shock to the economy, in this case a set of new expenditures on goods and services from offset projects, generates activity in various industries (because of the interindustry relations described above), which leads to economic impacts, namely job creation, GDP and government tax revenues. The results of such assessments are those economic benefits that can be reasonably attributed to the project spending based upon past interactions within the economy.
The economic impacts resulting from the B.C. government’s policy on carbon neutrality were evaluated using the DYNATEC model developed by EcoTec Consultants, which is based on an I-O core linked to econometric modules. The model is considered representative of the B.C. economy since it is based on an enhanced version of Statistics Canada’s I-O model (2010 datasets) (Statistics Canada, 2014). Furthermore, it has been fine tuned to better represent the B.C. economy over a number of projects conducted in the province during the last 25 years.5 The model is dynamic because it uses the iterative form of I-O models. The core of the model operates at the Large Level aggregation of 295 commodities and 117 industries. Both open (indirect impacts) and closed (induced impacts: consumer expenditures) versions of the models were used to calculate the impacts for this project. The model structure and how it operates are further described in Appendix 2, which also includes a list of the main assumptions on which the model relies.
5 During these projects, special emphasis was put on economic linkages between districts and on supplier chains throughout
the province.
ECONOMIC IMPACTS ANALYSIS OF B.C.’S CARBON NEUTRAL GOVERNMENT PROGRAM
8
Key inputs
The key inputs for I-O modelling are the expenditures on goods and services made as part of offset projects. Both capital expenditures and operating expenditures are introduced in the model.
The methodological approach used in this study consisted of identifying 27 commodities that were determined to be the most relevant for offset projects considering the information available (i.e. the commodities that were most likely to be concerned with the capital and operating expenditures of offset projects) (see Appendix 3). Benchmark runs of the model were made for each commodity, using an expenditure of $100 million each time. These runs provided initial economic impacts that were then adjusted to take into account the actual capital and operating expenditures estimated for each project.
Key outputs
The main outputs of the model are employment, GDP and government tax revenues (federal, provincial and municipal). Employment is measured in person-years, that is, in units of 2,000 hours of work. For example, two temporary jobs providing 1,000 hours of work each is counted as one person-year. A full-time job providing 2,000 hours of work per year in 2013 and in 2014 is counted as two person-years.
GDP is the value added generated by businesses and other organizations during a production process. It includes salaries and pre-tax pay, benefits, sole proprietorship revenues, profits and depreciation, as well as indirect taxes on goods and services, minus commodity subsidies. Tax revenues for the federal and provincial governments include revenues from personal income tax, sales taxes, other indirect taxes and tax on company profits. These tax revenues are net revenues, with subsidies and other government contributions having been subtracted from gross revenues. Municipal tax revenues estimated in this report consist of property taxes. GDP and government revenues are presented in dollars.
ECONOMIC IMPACTS ANALYSIS OF B.C.’S CARBON NEUTRAL GOVERNMENT PROGRAM
9
For each of these measures, three levels of impact are evaluated: direct, indirect and induced.
Direct impacts are simply the initial expenditures used to do a simulation which, in this case, are the capital and operating expenditures of offset projects in B.C. Direct employment is, for example, employees working on emissions reduction projects from which offsets are sold to the province’s public sector.
Indirect impacts result from inter-industry purchases of goods and services. These purchases are either made locally or directly outside the local economy.
Induced impacts result from consumption expenditures of households. The sole source of money for induced impacts is household income (mostly wages and salaries) that comes from direct or indirect employment (measured earlier). The amount of wages paid by an industry is reduced by: (i) personal income tax collected at the source, and (ii) various deductions related to RRSP contributions and a few other deductions. The resulting after-tax income is divided into two portions: the largest one is expenditures on goods and services with the rest going towards savings. This treatment ensures that induced impacts are correctly calculated.
Total impacts consist of the sum of direct, indirect and induced impacts.
3.2 EXPENDITURE DATA
3.2.1 CAPITAL AND OPERATING EXPENDITURES CONSIDERED
This study considers the capital and operating expenditures of the 23 offset projects under an offset purchase agreement in 2013 and 2014 that were not considered in a similar study conducted for the period of 2008-2012 (PwC, 2012). The previous study analyzed the capital expenditures of offset projects (2008-2012), which include projects that are still part of the 2013 and 2014 portfolio. Out of the 23 offset projects in the 2013 and 2014 offset portfolio, 20 were assessed in the PwC study (2012); hence, the analysis of these 20 projects focuses exclusively on their operating expenditures made in 2013 and 2014.6
The remaining three projects were brought into the provincial offset portfolio after 2012, and were therefore not considered in the PwC study (2012). Hence, the total capital and operating expenditures of these projects since their implementation are considered in the current
6 We assume that capital expenditures were made entirely at the onset of an offset project, and that they include all upfront
costs associated with the project development. We also assume that when a project’s capital expenditures were considered in the PwC study (2012), they were considered entirely (and, thus, should not be considered here).

ECONOMIC IMPACTS ANALYSIS OF B.C.’S CARBON NEUTRAL GOVERNMENT PROGRAM
10
study. Furthermore, all three projects started before 2013 even though an agreement was only signed in 2013 or afterwards. Hence, capital and operating expenditures made before 2013 by these projects are included in this assessment.
For most offset projects, this study considers all the operating expenditures associated with the equipment, system or activities implemented as part of the project (operation, maintenance, inputs, etc.), as well as the costs associated with the sale of offsets (e.g. project report preparation and verification). In one case, the BC Transit/TransLink project, a more limited scope of operating expenditures was considered because the initial approach led to reporting disproportionally high expenditures. This was due to the fact that this offset project (which consisted mainly in purchasing hybrid buses), led to a significant increase in the proponents’ core business activities, while other offset projects concern peripheral activities of other proponent organizations (e.g. boiler modification in a greenhouse or a pulp mill). A more conservative approach was thus adopted, in which an alternative scenario was determined (i.e. the same number of vehicles would have been purchased, but these would have been conventional diesel buses instead of hybrid buses), and only the increased maintenance costs of hybrid buses compared to diesel buses was considered in the analysis.
3.2.2 DATA COLLECTION
Because of confidentiality issues, the CIB was unable to provide information or data on capital and operating expenditures of offset projects. Therefore, in order to collect the necessary data (i.e. capital and operating expenditures), every project proponent was contacted at the onset of the study and a follow-up communication was made with proponents that had not yet sent data three days before the deadline.
Primary expenditure data were obtained from project proponents for 10 projects, including four projects for which partial data were obtained. These data were assessed for reasonableness, but were not reviewed for accuracy and completeness. Secondary data sources were used to approximate the expenditures of the remaining projects. These sources included:
Project plan summaries of offset projects;7
Consultations with project proponents and experts;
Technical documents presenting operating costs of similar technologies;
7 Available for consultation on the Markit’s Environmental Registry
(http://www.markit.com/sites/en/products/environmental/markit-environmental-registry-public-view.page).

ECONOMIC IMPACTS ANALYSIS OF B.C.’S CARBON NEUTRAL GOVERNMENT PROGRAM
11
Corporate reports of proponent organizations; and
Other documentary sources.
In approximating project expenditures, ÉcoRessources adopted a conservative approach; whenever secondary information and data were deemed insufficient to develop solid approximations concerning a project’s expenditures, this project was excluded from the analysis. In the end, ÉcoRessources was unable to approximate the operating expenditures of three offset projects; because of their unique nature, no information on comparable projects or technologies was available (see Appendix 1). These projects were excluded from the economic impacts assessment.
3.3 ECONOMIC IMPACTS OF CAPITAL EXPENDITURES
The economic impacts of capital expenditures from three offset projects are presented in Table 2. These capital expenditures totalled $10.3 million.8
TABLE 2. ECONOMIC IMPACTS OF CAPITAL EXPENDITURES FROM EMISSION OFFSET PROJECTS THAT WERE UNDER AN OFFSET PURCHASE AGREEMENT SIGNED IN 2013 OR LATER
Impact Direct Indirect Induced Total1
GDP (millions) $1.0 $3.1 $1.6 $5.6
Government revenues (millions) $0.27 $0.29 $0.41 $0.97
Federal government (millions) $0.12 $0.19 $0.17 $0.48
Provincial government (millions) $0.12 $0.10 $0.19 $0.40
Municipal government (millions) $0.03 $0.01 $0.05 $0.09
Employment (person-years) 16 38 13 67 Note 1: Numbers may not add up due to rounding.
8 When comparing the expenditures calculated in this study with the ones found in the PwC study (2012), we observe a shift
from capital expenditure predominance to operating expenditure predominance. In fact, the capital expenditures presented here are low compared to the ones found in the PwC study (2012); they represent just over 3% of what was estimated in that study. The analysis conducted in the PwC study (2012) covered the years from 2008 to 2012, which included the launch of the Carbon Neutral Government program and, because many offset projects were initiated in the few years following the program launch, significant capital investments were made by offset projects in those early years and were considered in the PwC study (2012). During the years covered in the current study (2013 and 2014), most offset projects were in their operation phase and this is reflected in their expenditures, which we assume to be made entirely of operating expenditures. The capital expenditures analyzed in the current study are those made by newer projects for which proponents had not signed an agreement with PCT before 2013.
ECONOMIC IMPACTS ANALYSIS OF B.C.’S CARBON NEUTRAL GOVERNMENT PROGRAM
12
The $10.3 million capital expenditures of the three offset projects considered here contributed a total of $5.6 million to the provincial GDP, consisting of $1.0 million direct, $3.1 million indirect, and $1.6 million induced GDP. Government revenue generated by these expenditures totalled $0.97 million, of which $267,000 was direct, $295,000 was indirect and $413,000 was induced revenue.
Finally, job creation from these capital expenditures amounted to 67 person-years, including 16 direct, 38 indirect and 13 induced person-years. Average job impact of these capital expenditures is estimated at 6.5 person-years per million dollars of capital spending.
3.4 ECONOMIC IMPACTS OF OPERATING EXPENDITURES
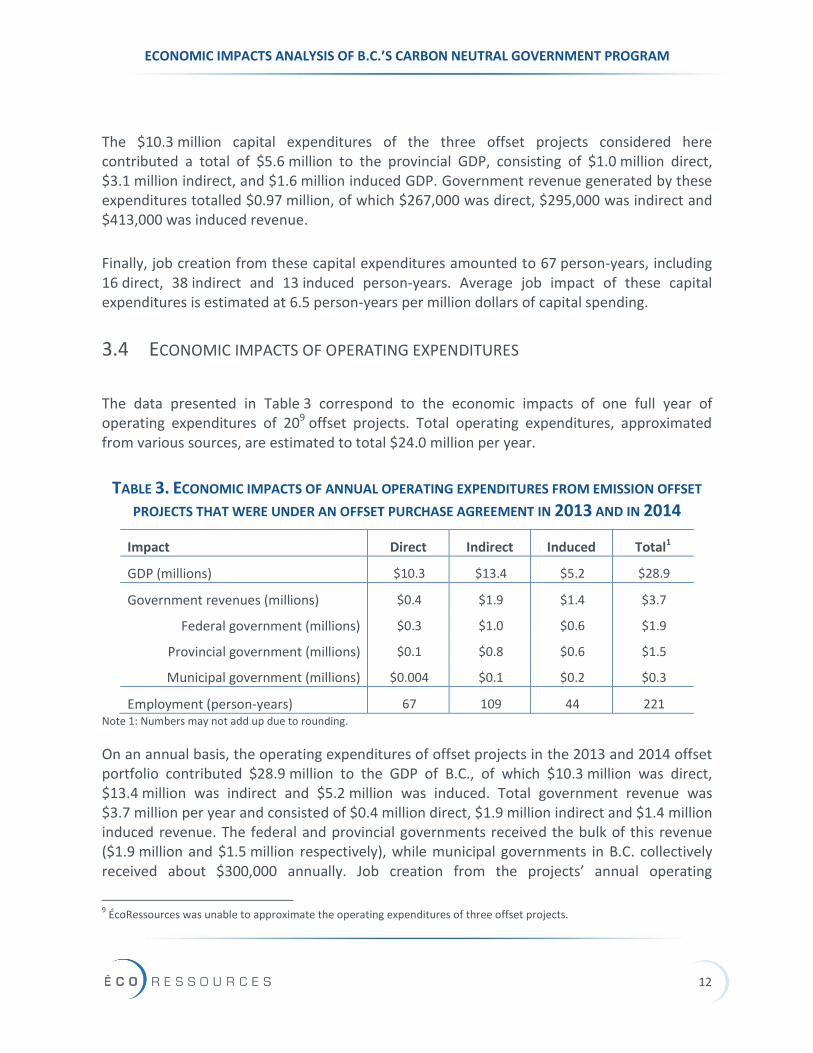
The data presented in Table 3 correspond to the economic impacts of one full year of operating expenditures of 209 offset projects. Total operating expenditures, approximated from various sources, are estimated to total $24.0 million per year.
TABLE 3. ECONOMIC IMPACTS OF ANNUAL OPERATING EXPENDITURES FROM EMISSION OFFSET
PROJECTS THAT WERE UNDER AN OFFSET PURCHASE AGREEMENT IN 2013 AND IN 2014
Impact Direct Indirect Induced Total1
GDP (millions) $10.3 $13.4 $5.2 $28.9
Government revenues (millions) $0.4 $1.9 $1.4 $3.7
Federal government (millions) $0.3 $1.0 $0.6 $1.9
Provincial government (millions) $0.1 $0.8 $0.6 $1.5
Municipal government (millions) $0.004 $0.1 $0.2 $0.3
Employment (person-years) 67 109 44 221 Note 1: Numbers may not add up due to rounding.
On an annual basis, the operating expenditures of offset projects in the 2013 and 2014 offset portfolio contributed $28.9 million to the GDP of B.C., of which $10.3 million was direct, $13.4 million was indirect and $5.2 million was induced. Total government revenue was $3.7 million per year and consisted of $0.4 million direct, $1.9 million indirect and $1.4 million induced revenue. The federal and provincial governments received the bulk of this revenue ($1.9 million and $1.5 million respectively), while municipal governments in B.C. collectively received about $300,000 annually. Job creation from the projects’ annual operating
9 ÉcoRessources was unable to approximate the operating expenditures of three offset projects.

ECONOMIC IMPACTS ANALYSIS OF B.C.’S CARBON NEUTRAL GOVERNMENT PROGRAM
13
expenditures amounted to 221 person-years, including 67 direct, 109 indirect and 44 induced person-years.
3.5 TOTAL ECONOMIC IMPACTS OF OFFSET PROJECTS SINCE THE BEGINNING OF
THE CARBON NEUTRAL GOVERNMENT PROGRAM
As previously mentioned, the present assessment of the economic impacts of offset projects follows a similar study covering the period of 2008-2012 (PwC, 2012). Taken together, these two studies provide a complete evaluation of the economic impacts of offset projects since the beginning of the Carbon Neutral Government program.
Overall, the province of B.C. has invested $53.4 million to purchase 4.5 million tonnes of offsets since the beginning of the program. These investments have supported offset projects across the province, and leveraged further investments and expenditures from these projects. We estimate that, from the beginning of the program until the end of 2014, total capital expenditures from offset projects reached $327 million.
The economic impacts of all the capital expenditures made by offset projects from 2008 to 2014 are illustrated in Table 4. They represent the summation of the impacts from capital expenditures estimated in both studies.
TABLE 4. TOTAL ECONOMIC IMPACTS OF CAPITAL EXPENDITURES FROM OFFSET PROJECTS, 2008-2014
Impact Direct Indirect Induced Total1
GDP (millions) $163.7 $55.5 $29.1 $248.2
Government revenues (millions) $30.9 $9.3 $9.6 $49.8
Federal government (millions) $14.5 $4.7 $4.2 $23.4
Provincial government (millions) $12.2 $3.8 $4.5 $20.5
Municipal government (millions) $4.1 $0.9 $0.9 $5.9
Employment (person-years2) 1,654 817 432 2,903 Note 1: Numbers may not add up due to rounding.
Note 2: We assume that employment impacts presented in the PwC study (2012) were measured in person-years.
In total, capital expenditures made by offset projects since the start of the Carbon Neutral Government program in 2008 have contributed a total of $248.2 million to the B.C. GDP, made of $163.7 million direct, $55.5 million indirect and $29.1 million induced contribution. Total government revenue was $49.8 million, including $30.9 million direct, $9.3 million
ECONOMIC IMPACTS ANALYSIS OF B.C.’S CARBON NEUTRAL GOVERNMENT PROGRAM
14
indirect and $9.6 million induced revenue. Finally, total job creation by these expenditures reached 2,903 person-years, including 1,654 direct, 817 indirect and 432 induced jobs measured in person-years.
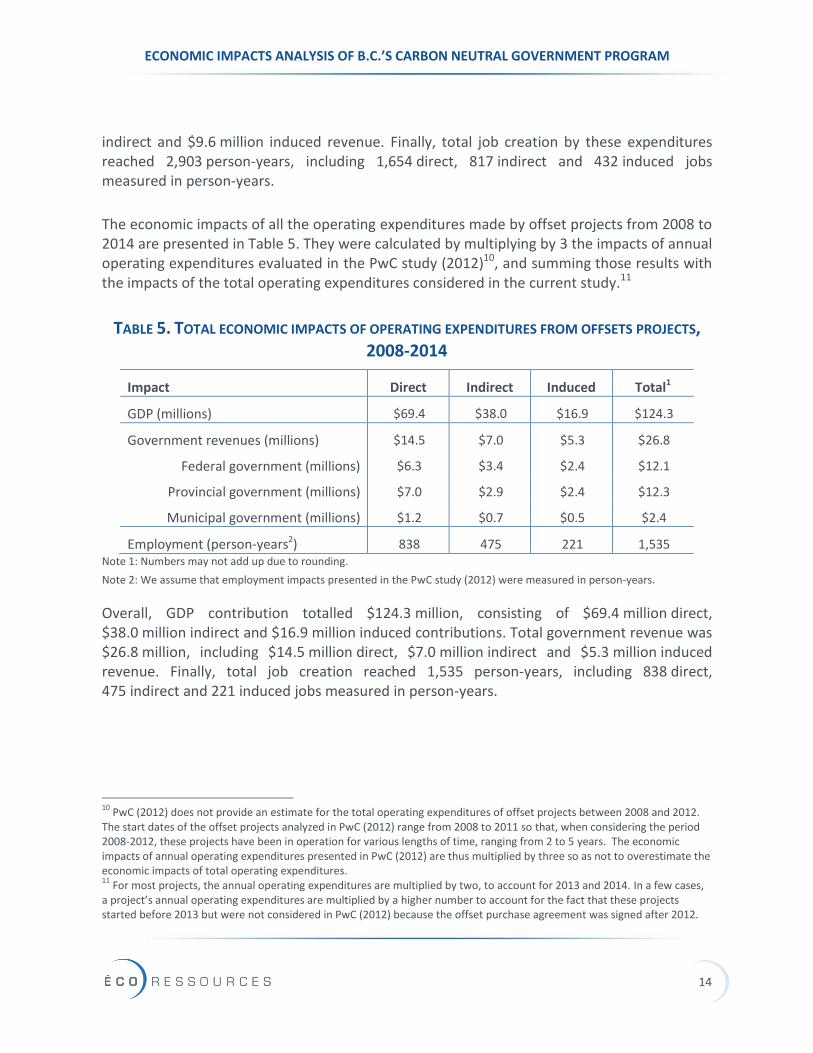
The economic impacts of all the operating expenditures made by offset projects from 2008 to 2014 are presented in Table 5. They were calculated by multiplying by 3 the impacts of annual operating expenditures evaluated in the PwC study (2012)10, and summing those results with the impacts of the total operating expenditures considered in the current study.11
TABLE 5. TOTAL ECONOMIC IMPACTS OF OPERATING EXPENDITURES FROM OFFSETS PROJECTS, 2008-2014
Impact Direct Indirect Induced Total1
GDP (millions) $69.4 $38.0 $16.9 $124.3
Government revenues (millions) $14.5 $7.0 $5.3 $26.8
Federal government (millions) $6.3 $3.4 $2.4 $12.1
Provincial government (millions) $7.0 $2.9 $2.4 $12.3
Municipal government (millions) $1.2 $0.7 $0.5 $2.4
Employment (person-years2) 838 475 221 1,535 Note 1: Numbers may not add up due to rounding.
Note 2: We assume that employment impacts presented in the PwC study (2012) were measured in person-years.
Overall, GDP contribution totalled $124.3 million, consisting of $69.4 million direct, $38.0 million indirect and $16.9 million induced contributions. Total government revenue was $26.8 million, including $14.5 million direct, $7.0 million indirect and $5.3 million induced revenue. Finally, total job creation reached 1,535 person-years, including 838 direct, 475 indirect and 221 induced jobs measured in person-years.
10
PwC (2012) does not provide an estimate for the total operating expenditures of offset projects between 2008 and 2012. The start dates of the offset projects analyzed in PwC (2012) range from 2008 to 2011 so that, when considering the period 2008-2012, these projects have been in operation for various lengths of time, ranging from 2 to 5 years. The economic impacts of annual operating expenditures presented in PwC (2012) are thus multiplied by three so as not to overestimate the economic impacts of total operating expenditures. 11
For most projects, the annual operating expenditures are multiplied by two, to account for 2013 and 2014. In a few cases, a project’s annual operating expenditures are multiplied by a higher number to account for the fact that these projects started before 2013 but were not considered in PwC (2012) because the offset purchase agreement was signed after 2012.
ECONOMIC IMPACTS ANALYSIS OF B.C.’S CARBON NEUTRAL GOVERNMENT PROGRAM
15
REFERENCES
Government of British Columbia (n.d.a). Carbon Neutral Government. Available at: http://www2.gov.bc.ca/gov/content/environment/climate-change/policy-legislation-programs/carbon-neutral-government. Accessed November 3, 2015.
Government of British Columbia (n.d.b). Investing in Carbon Offset Projects. Available at: http://www2.gov.bc.ca/gov/content/environment/climate-change/reports-data/carbon-neutral-action-reports/carbon-offset-projects. Accessed November 3, 2015.
PwC (2012). Economic Analysis of British Columbia Carbon Offset Projects. PricewaterhouseCoopers LLP, for Pacific Carbon Trust.
Statistics Canada (2014). Input-Output Model Simulations (Interprovincial Model), 2010. Catalogue no. 15F0009X

ECONOMIC IMPACTS ANALYSIS OF B.C.’S CARBON NEUTRAL GOVERNMENT PROGRAM
16
APPENDICES
ECONOMIC IMPACTS ANALYSIS OF B.C.’S CARBON NEUTRAL GOVERNMENT PROGRAM
17
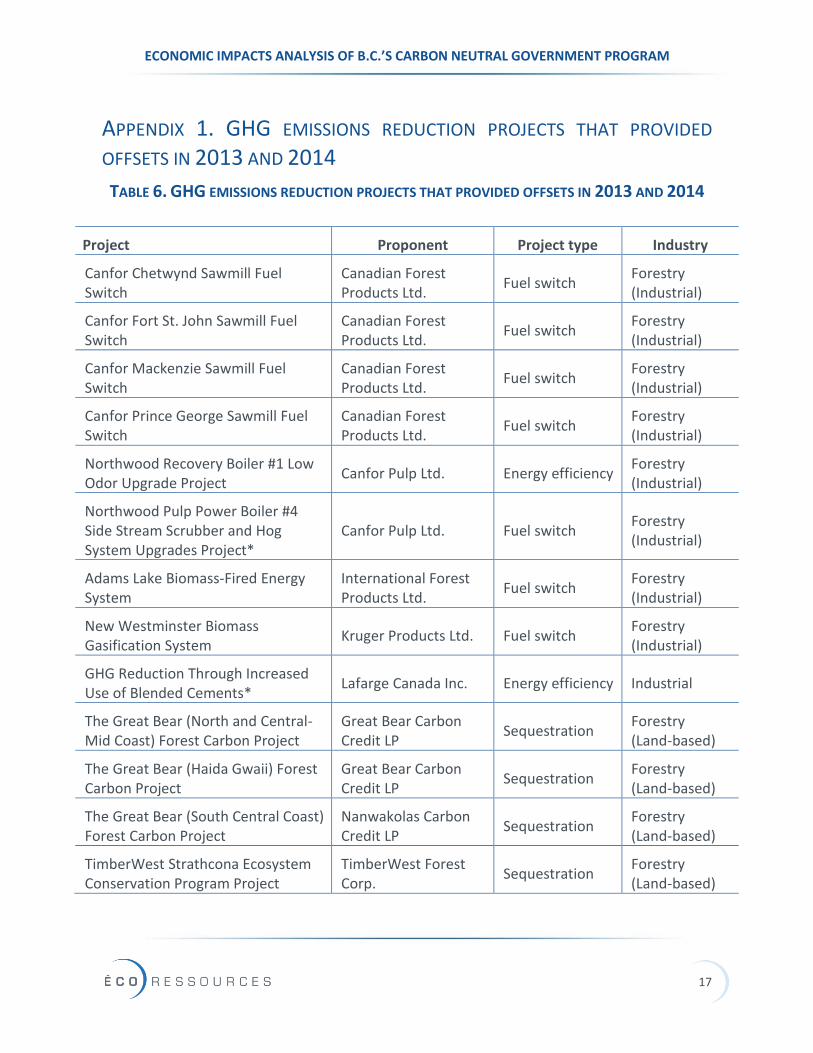
APPENDIX 1. GHG EMISSIONS REDUCTION PROJECTS THAT PROVIDED
OFFSETS IN 2013 AND 2014
TABLE 6. GHG EMISSIONS REDUCTION PROJECTS THAT PROVIDED OFFSETS IN 2013 AND 2014
Project Proponent Project type Industry
Canfor Chetwynd Sawmill Fuel Switch
Canadian Forest Products Ltd.
Fuel switch Forestry (Industrial)
Canfor Fort St. John Sawmill Fuel Switch
Canadian Forest Products Ltd.
Fuel switch Forestry (Industrial)
Canfor Mackenzie Sawmill Fuel Switch
Canadian Forest Products Ltd.
Fuel switch Forestry (Industrial)
Canfor Prince George Sawmill Fuel Switch
Canadian Forest Products Ltd.
Fuel switch Forestry (Industrial)
Northwood Recovery Boiler #1 Low Odor Upgrade Project
Canfor Pulp Ltd. Energy efficiency Forestry (Industrial)
Northwood Pulp Power Boiler #4 Side Stream Scrubber and Hog System Upgrades Project*
Canfor Pulp Ltd. Fuel switch Forestry (Industrial)
Adams Lake Biomass-Fired Energy System
International Forest Products Ltd.
Fuel switch Forestry (Industrial)
New Westminster Biomass Gasification System
Kruger Products Ltd. Fuel switch Forestry (Industrial)
GHG Reduction Through Increased Use of Blended Cements*
Lafarge Canada Inc. Energy efficiency Industrial
The Great Bear (North and Central-Mid Coast) Forest Carbon Project
Great Bear Carbon Credit LP
Sequestration Forestry (Land-based)
The Great Bear (Haida Gwaii) Forest Carbon Project
Great Bear Carbon Credit LP
Sequestration Forestry (Land-based)
The Great Bear (South Central Coast) Forest Carbon Project
Nanwakolas Carbon Credit LP
Sequestration Forestry (Land-based)
TimberWest Strathcona Ecosystem Conservation Program Project
TimberWest Forest Corp.
Sequestration Forestry (Land-based)

ECONOMIC IMPACTS ANALYSIS OF B.C.’S CARBON NEUTRAL GOVERNMENT PROGRAM
18
Project Proponent Project type Industry
Cheakamus Community Forest Carbon Project
Cheakamus Community Forest
Sequestration Forestry (Land-based)
Dawson Creek Gas Plant Electrification and Instrument Air Project
ARC Resources Fuel switch Oil & Gas
Engine Fuel Gas Management Program of Activities*
Blue Source Energy efficiency Oil & Gas
Noel Electrification Project Apache Canada Ltd. Fuel switch Oil & Gas
Septimus Electrification Project Canadian Natural Resources Ltd.
Fuel switch Oil & Gas
Reduction Of Methane Venting From A Gas Transmission Pipeline System
Spectra Energy Energy efficiency Oil & Gas
BC Transit and TransLink Low Carbon and Electric Vehicle Offset Project
BC Transit / TransLink Fuel switch Transportation
The Landfill Gas Collection, Transmission and/or Flaring System for the Salmon Arm Landfill Project
Columbia Shuswap Regional District
GHG destruction Waste Management
Foothills Boulevard Regional Landfill Gas Management Project
Green Municipal Corporation
Federation of Canadian Municipalities
The Regional District of Fraser Fort George
GHG destruction Waste management
SunSelect Delta Energy Curtains and Biomass Boiler
SunSelect Delta Fuel switch Agriculture
Note: Projects marked with an * were excluded from the economic impacts assessment because no available information allowed an approximation of their operating expenditures.

ECONOMIC IMPACTS ANALYSIS OF B.C.’S CARBON NEUTRAL GOVERNMENT PROGRAM
19
APPENDIX 2. INPUT-OUTPUT FRAMEWORK: MODEL AND ASSUMPTIONS
A simulation starts with a shock to the economy, which enters the model as a data set containing expenditures on goods and services from offset projects. The main algorithm is essentially used to allocate the expenditures on all goods and services to the industries that produce them. The industries in turn purchase goods and services required to produce the items that were purchased initially, and so on (suppliers purchase goods and services from other suppliers, who purchase from other suppliers, etc.). As such, a shock to the economy (i.e. new expenditures) generates activity in various sectors and, thus, leads to job creation, GDP and government tax revenues.
The core of the model operates with a standard I-O algorithm. When expenditures are first entered into the model, retail, wholesale and transportation margins are extracted and reallocated to the retail trade, wholesale trade and transportation industries. Import coefficients are applied to the remaining dollar amounts to leak out expenditures for items that are not produced in the province. The dollars remaining in the province are allocated to the industries that produce the commodities. An interprovincial trade flow matrix is used to allocate production by industry, by province.
The model continues to iterate until there is no money left in the model (imports, taxes and savings are all leakages that eventually reduce to zero the amount of money spent initially as part of the policy on carbon neutrality). The model is then stopped and the total impacts by industry are added up from all iterations. The statistic generated by the I-O model is called the Gross Production (sales) by industry. Employment is calculated by extracting salaries data by industry from the Gross Production table and dividing it by the average annual salaries by industry for each province.
The GDP is calculated by extracting from the Gross Production by industry the primary inputs components: indirect taxes (e.g. GST), subsidies, salaries and benefits for employees, as well as profits and depreciation for the private sector. Extraction of both (i) salaries to calculate employment, and (ii) GDP components is based on coefficients contained in the Use (Technology matrix) tables.
Tax revenues are calculated by using taxation coefficients derived from Statistics Canada and the Canada Revenue Agency publications on federal and provincial tax revenues by province. Taxes are collected on wages and salaries and corporate profits through the use of taxation coefficients. The indirect taxes are split between the federal and provincial governments according to the latest data from the Economic Accounts (Statistics Canada).
ECONOMIC IMPACTS ANALYSIS OF B.C.’S CARBON NEUTRAL GOVERNMENT PROGRAM
20
The amount of money collected by governments is subtracted from wages and salaries and profits at each round of expenditures. A total of 32 personal income tax coefficients (16 federal and 16 provincial) are in the model for 16 different income brackets. The workers in the model are submitted to different tax rates depending on the average salary in each industry: for example, salaries in the retail trade industry are taxed at a much lower rate than salaries in the professional services industry.
To operate, I-O models rely on specific assumptions that influence the results of an economic impact study. The main assumptions used in this study's model are presented below:
No economies of scale result from the expenditures used to calculate the economic impacts, because relationships between a sector’s output and its inputs are considered to be fixed. In this regard, production operates under what is known as constant returns to scale.
In addition, I-O analysis requires that a sector use inputs in fixed proportions.
There is no bottleneck or other limits to the potential supply of goods and services. Hence, there is no price effect related to a potential shortage of any good or service purchased as a result of the policy on carbon neutrality.
The expenditures made under the carbon neutrality initiative will have no measurable impact on wage levels, productivity or consumer behaviour, in aggregate, in B.C.
It is assumed that the input structure of industries benefiting from the policy on carbon neutrality is similar to the input structure of those industries in the provincial economy. In other words, it is assumed that the input structure of businesses X and Y in the transportation industry, for example, that benefited from the policy on carbon neutrality is similar to the input structure of all businesses in the transportation sector in the province.

ECONOMIC IMPACTS ANALYSIS OF B.C.’S CARBON NEUTRAL GOVERNMENT PROGRAM
21
APPENDIX 3. SELECTED COMMODITIES FOR MODELLING
Benefits
Compressors
Diesel
Electric motors
Electric power
Engineering services
Fabricated metal products
Indirect taxes
Industrial electric equipment
Insurance
Interest
Logs
Management and scientific services
Motor vehicle repairs
Natural gas
Non-electric furnaces
Other forestry products
Other repairs and maintenance services
Plastic pipes
Pulpwood
Salaries
Spare parts
Supporting services for forestry
Truck transportation
Wholesale margins
Wood chips and wood waste