In-State Merit Aid and College Choice: New Jersey’s … Merit Aid and College Choice: ... model...
77
In-State Merit Aid and College Choice: New Jersey’s STARS Program as a Tuition Subsidy Namir Shah 1 Department of Economics Stanford University, Stanford, CA 94305 [email protected] Under the direction of Prof. Caroline Hoxby May 8, 2014 Abstract In this paper, I test how the implementation of the NJ STARS program has changed patterns of college enrollment choice among eligible students. Applying difference-in-difference logic to a college choice model, I analyze the variation in college enrollment choices of students who were eligible for NJ STARS scholarship aid and students who were similarly qualified but not eligible. In addition, I measure several indicators of college quality and other characteristics of the school(s) in which the students enrolled for post-estimation analysis. My conditional logit choice model shows that students eligible for NJ STARS are 1.7% more likely to enroll in an in-state institution and 61% more likely to enroll in an in- state, public, two-year college. Based on the enrollment shifts, I also find that eligible students, on average, enroll in an institution with a 0.79% lower graduation rate and 0.71% less in instructional spending, indicating adverse effects of the program. Keywords Keywords Keywords Keywords: College choice, college quality, in-kind subsidy, academic spending, merit aid, NJ STARS, Peltzman hypothesis 1 I would like to extend my warmest thanks, first and foremost, to Professor Caroline Hoxby, who has developed the foundation for my understanding of the economics of education and has supported my research on this topic for over one year. Similarly, I would like to thank Professor Michael Boskin, who has guided me through the Economics major, and Marcelo Clerici-Arias, who has continuously offered his assistance with the Honors program. Finally, I would be remiss in not mentioning the other mentors and advisors who have contributed to my interest in education policy, even if they were not directly involved with this thesis: Ana McCullough and Bill Abrams.
Transcript of In-State Merit Aid and College Choice: New Jersey’s … Merit Aid and College Choice: ... model...
In-State Merit Aid and College Choice: New Jersey’s
STARS Program as a Tuition Subsidy
Namir Shah1
Department of Economics Stanford University, Stanford, CA 94305
Under the direction of Prof. Caroline Hoxby
May 8, 2014
Abstract
In this paper, I test how the implementation of the NJ STARS program has changed patterns of college enrollment choice among eligible students. Applying difference-in-difference logic to a college choice model, I analyze the variation in college enrollment choices of students who were eligible for NJ STARS scholarship aid and students who were similarly qualified but not eligible. In addition, I measure several indicators of college quality and other characteristics of the school(s) in which the students enrolled for post-estimation analysis. My conditional logit choice model shows that students eligible for NJ STARS are 1.7% more likely to enroll in an in-state institution and 61% more likely to enroll in an in-state, public, two-year college. Based on the enrollment shifts, I also find that eligible students, on average, enroll in an institution with a 0.79% lower graduation rate and 0.71% less in instructional spending, indicating adverse effects of the program.
KeywordsKeywordsKeywordsKeywords: College choice, college quality, in-kind subsidy, academic spending, merit aid, NJ STARS, Peltzman hypothesis
1 I would like to extend my warmest thanks, first and foremost, to Professor Caroline Hoxby, who has developed the foundation for my understanding of the economics of education and has supported my research on this topic for over one year. Similarly, I would like to thank Professor Michael Boskin, who has guided me through the Economics major, and Marcelo Clerici-Arias, who has continuously offered his assistance with the Honors program. Finally, I would be remiss in not mentioning the other mentors and advisors who have contributed to my interest in education policy, even if they were not directly involved with this thesis: Ana McCullough and Bill Abrams.
Namir Shah 1
1111 IntroductionIntroductionIntroductionIntroduction
State and federal governments allocate billions of dollars in grants and
subsidized loans annually to students through both merit and need-based financial
aid. These programs are intended to increase college enrollment, generate more
optimal human capital investments, reduce the costs faced by families, and retain
students in their state of residence. Many of these justifications are rooted in the
belief that society underinvests in education because part of the return is non-
private or, alternatively, that individuals underinvest in education because they are
liquidity constrained. In either case, greater investments in education may pay for
themselves over time. The state might even be more than repaid for its
expenditures through higher future tax payments (Long, “Does the Format” 5).
Regardless of the intended purpose, economic theory tells us that scholarships
should be portable in the sense that they are tied to the student. However, public
college tuition subsidies in most states are contingent upon enrollment in one of a
particular group of colleges, usually the state’s public colleges and universities. In
this way, tuition subsidies are tied to the college rather than the student.
Because states design their financial aid schemes differently, including the
degree of portability, eligibility requirements, and type of aid, there is significant
variability regarding the effects of each state’s aid program(s). In particular,
conditioning financial aid on a student's attending a specific school can create
incentives for the student to change her education investment in unintended ways.
That is, while public college tuition subsidies are launched to expand educational

Namir Shah 2
opportunities to those who may otherwise be unable to afford college, they could
have the opposite effect of inducing students to attend schools with more meager
resources. If the financial aid induces students to enroll in colleges of lesser quality,
often measured by instructional spending, the program could undesirably decrease
aggregate investment in education.
This paper tests these hypotheses through the lens of the New Jersey
Student Tuition Assistance Reward Scholarship (NJ STARS) program, a merit-
based scholarship that allowed New Jersey students in the top two deciles of their
graduating high school class to receive free tuition and fees at public, in-state two-
year colleges. Though larger programs like Georgia’s HOPE Scholarship have
received considerable attention from education economists, there has been no
significant study of the NJ STARS program or others with similar subsidy
structures. Toward this end, I present an empirical evaluation of the effects of the
NJ STARS program. The central question is whether the program negatively or
positively affects students' investments in education. My empirical strategy exploits
(i) the discontinuity in eligibility on the basis of class rank and (ii) the timing of the
introduction NJ STARS program. Using these sources of variation simultaneously
in a differences-in-differences method, I can credibly estimate the program’s causal
effects on college enrollment.
Figure 2 shows the percentage of New Jersey students above and below the
eligibility cut-off who enroll at different types of colleges. The data shows different
enrollment trends between eligible and non-eligible students from the inception of
Namir Shah 3
the scholarship program. These patterns provide a preliminary indication that the
scholarship is altering college enrollment of eligible and/or non-eligible students.
The percentage of second-decile students enrolling at public two-year colleges rose
from 2.0% to 3.8%, an 87% increase, while the equivalent statistic for second
quintile students was only 23%. In-state enrollment rates also showed disparate
patterns between eligible and non-eligible students, though not quite as drastic.
This simple data analysis provides support for the more detailed econometric
analysis of the program.
However, the enrollment decision is inherently a choice between many
alternatives, not a binary decision to enroll or not enroll or a binary decision to
enroll at a public or private school. Therefore, to understand the effects of NJ
STARS, I must fully model all of the factors that affect students’ college choices
including the scholarship program as one of those factors. This type of analysis
requires an econometric choice model such as conditional logit or multinomial
probit. I use the former because there are so many college choices and so many
students that the latter model is computationally infeasible. My empirical strategy,
then, is to estimate a college choice model using data on students who are and are
not eligible for NJ STARS (the first difference) and from cohorts before and after NJ
STARS was enacted (the second difference). That is, I estimate an appropriate
choice model but derive identifying variation through a difference-in-differences
logic. Using this strategy, I can answer questions such as: Do students switch to in-
state colleges or two-year colleges when eligible for in-kind subsidies valid only at
Namir Shah 4
such institutions? Are high-achieving students willing to sacrifice relatively large
amounts of college quality for relatively small financial incentives? Does an
exclusively in-state, two-year college-based subsidy increase or decrease the
aggregate investment in education?
I rely upon a combination of administrative data from the National Student
Clearinghouse, the College Board, and the National Center for Education Statistics’
Integrated Postsecondary Education Data System. My data set includes information
on over 57,186 students and 1,400 colleges and universities. This data set contains
student performance data, student demographic data, actual college enrollment,
and college characteristics, including expected costs and admissions data.
I find that the NJ STARS has increased enrollment into STARS-eligible in-
state, two-year colleges by 61% among eligible students. Similarly, overall two-year
enrollment rates increased by 41%, in-state enrollment rates increased by 1.7%, and
the percentage of students enrolling in colleges unranked by the Barron’s Selectivity
Index increased by 26%. Based on the enrollment changes, my analysis finds that
students eligible for NJ STARS enroll in colleges with 0.71% less educational
inputs, 0.79% lower graduation rates, and 0.85% higher admissions rates. This
indicates that students are shifting to less selective and less resourced institutions.
This paper is organized into the following sections. Section 2 provides a brief
overview of the NJ STARS program. Section 3 consists of an overview of the
Peltzman model of in-kind subsidies, which is the foundation of my college choice
analysis. In Section 4, I review the relevant literature: papers that study the impact
Namir Shah 5
of financial aid on college enrollment and choice, with an emphasis on tuition
subsidy distortions and the choices of high-achieving students. Section 5 describes
my empirical methodology, particularly the difference-in-difference and conditional
logistic econometric models. Section 6 discusses the sources of my data set, the
strengths and limitations of the available data, and descriptive statistics of the
students and colleges. In Section 7, I explain the results of the econometric model
and show the effects of the NJ STARS program on college choice patterns. Finally,
Section 8 contains a broader discussion of the impact of NJ STARS and similar
programs.
2222 BackgroundBackgroundBackgroundBackground
New Jersey’s public college system includes eleven four-year colleges and
nineteen two-year colleges. The two-year colleges are associated with individual
counties offer tuition discounts for county residents. Thus, students most commonly
attend the community college associated with their respective county. Rutgers
University – New Brunswick, the largest of the three campuses, is commonly
considered the flagship university of New Jersey and enrolls more students than
any other postsecondary school in New Jersey. In addition to the public institutions,
there are also fourteen not-for-profit four-year colleges and two for-profit
institutions that could be considered four-year colleges.2
2 If one considers the campuses of Rutgers University and Farleigh Dickinson University as
separate colleges, there would be thirteen public four-year colleges and fifteen private, not-for-
profit four-year colleges.

Namir Shah 6
The NJ STARS program was passed by the New Jersey legislature and
signed into law by Governor McGreevey in 2004 to be implemented immediately for
the graduating high school class of 2004. It was designed to allow students who
graduated in the top 20% of their high school class to attend any of New Jersey’s 19
two-year community colleges free of charge. The original grant could be applied to
tuition, books, and required fees for a maximum of five semesters. In 2006, NJ
STARS II was passed to provide an additional partial scholarship to NJ STARS
students to continue their education in a New Jersey four-year college. This second
scholarship provided $7,000 toward tuition and fees to all NJ STARS students who
completed their associate degree at a two-year institution with at least a 3.0 GPA.
The state’s public four-year colleges were originally the only eligible participants in
the NJ STARS II program, though several private colleges created reciprocal
programs to match the NJ STARS grant. Since the inception of the programs, only
students with household incomes below $250,000 have been eligible.
In the first year of the program, 789 students used the scholarships to attend
two-year public colleges at a cost to state of about $1.7 million (Washington Times).
Participation in the program peaked in the 2008-2009 academic year at over 5,700
students. Subsequently, the eligibility requirements and monetary values were
revised owing to budget constraints. Specifically, in 2009, eligibility for NJ STARS
was narrowed to the top 15% of graduating high school classes. At the same time,
NJ STARS II increased its GPA requirement to 3.25, with a two-tier structure: the
scholarship was maintained at $7,000 for students who completed their associate
Namir Shah 7
degree with a GPA at least 3.5 and decreased to $6,000 for students with a GPA
greater than 3.25 but less than 3.5. For students in both NJ STARS and NJ STARS
II, the scholarship was limited to only tuition and students were made responsible
for books and student fees. Starting in 2012, the state further cut the NJ STARS II
subsidy amount to $2,500 per year but began to allow student to use their
scholarship to transfer to fourteen of the state private four-year colleges, including
one for-profit institution: Berkeley College. The only private not-for-profit four-year
college that is ineligible is Princeton University because it does not participate in
New Jersey’s Tuition Aid Grant (TAG) Program. The state projects that
participation in NJ STARS will fall to 3,000 in the 2014-2015 school year, with four-
year college recipients dropping from 1,844 in the 2013-2014 school year to 1,200 in
2014-2015. This reflects a five-year decline in state funding for the program, from
$18 million in the 2008-2009 academic year to $8.5 million proposed for 2014-2015.
The program’s stated primary goals are to increase college attendance among
high-achieving students, retain top New Jersey students who may have otherwise
attended out-of-state colleges and perhaps been more likely to make careers out-of-
state, and provide a path to bachelors degrees that the state has touted as more
successful than direct enrollment in a four-year institution. In analyzing the
efficacy of the NJ STARS program, an important question is whether the program
actually affects students' decision to enroll or not or affects where they enroll. It
could simply subsidize their education without affecting any decision – that is, be a

Namir Shah 8
mere income transfer. If NJ STARS does affect students' decisions, it could have
important effects on their educational outcomes and lifetime incomes.
New Jersey’s merit-based aid program is particularly interesting due to the
unique design of NJ STARS. It gives high-achieving students an incentive to attend
two-year colleges which are more often the destination of students who are only
marginally college-ready and therefore unable to gain admission at selective four-
year colleges. Tables 1 and 2 shows costs and educational inputs of New Jersey’s
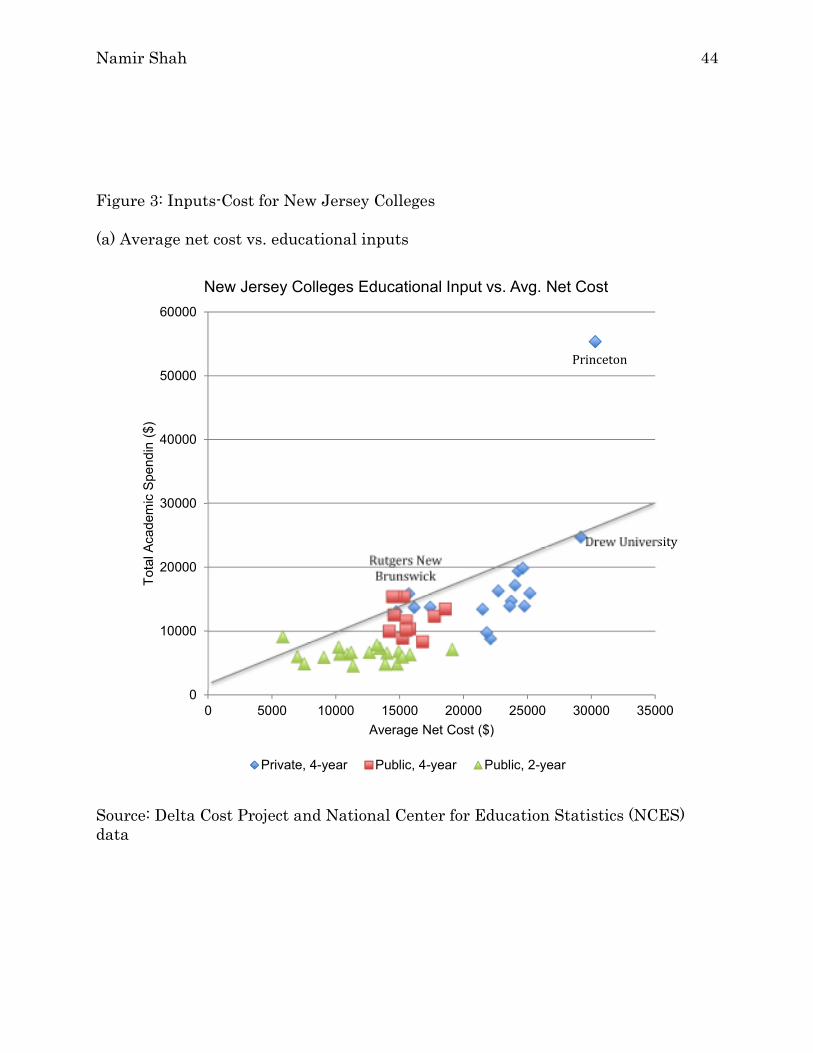
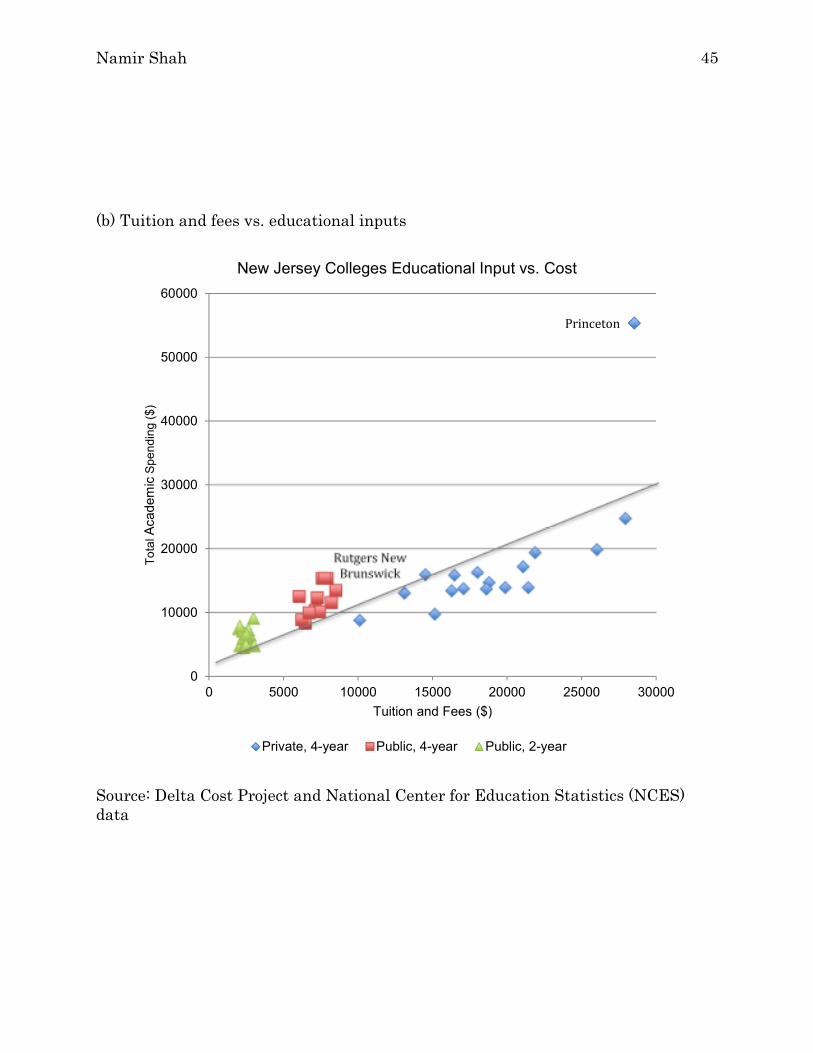
two-year and four-year colleges for the 2003-2004 academic year.3 Figures 3(a) and
3(b) provide a graphical representation of the cost-input consideration. Colleges that
spend exactly what they charge students would be located on the 45-degree line.
Public colleges and universities tend to fall above the line due to public tuition
subsidies, while private colleges can be found closer to the line or sometimes below
it. However, some of the country’s most elite private universities are often also
located above the line because they subsidize students through endowment
spending. Princeton University is a prime example.
It is immediately obvious that educational inputs, specifically instructional
spending, are significantly lower at two-year colleges than at four-year colleges.
Simultaneously, graduation rates at four-year colleges are dramatically higher than
the two-year colleges. These are cause for interest because it presents the possibility
that students may have worse educational outcomes if they are persuaded by the
scholarship to attend a two-year college instead of a four-year college. However, NJ
3 All monetary values in this paper are in nominal dollars or multiples thereof.
Namir Shah 9
STARS participants may be much more likely to graduate than would the average
student of the two-year colleges.
3333 Related Literature Related Literature Related Literature Related Literature
3.1 Financial Aid & College Choice
Peltzman (1973) develops a model to test whether subsidies-in-kind increases
total consumption of higher education. His theoretical framework provides the
foundation for understanding the impact of subsidies on student enrollment choices
and the tradeoff between cost and quality. Peltzman’s empirical model attempts to
measure the extent to which government expenditures through subsidies-in-kind
decrease private higher education expenditures. Given the strength of the
theoretical model, Peltzman’s empirical methodology lacks the same analytical
precision. His analysis uses a relatively simple econometric model and lacks a true
identification strategy on which to base it.
Ganderton (1992) built upon Peltzman’s research by using data on individual
student characteristics, including ability and wealth, and college characteristics
(e.g. quality) to further explain the effect of public in-kind subsidies on choices made
within higher education. Ganderton attempts to answer three questions in
particular: (1) what college quality would a student with given characteristics
choose in the public sector? (2) what quality college would be chosen in the private
sector? and (3) what quality college would be chosen if forced to choose a private
college due to the closure of a public college? Based on applications to four-year
colleges, Ganderton attempts estimates the likelihood of choosing a private vs.
Namir Shah 10
public college and the quality of the most preferred college in each of the private
and public sectors. Specifically, the model estimates the impact of student
demographics, socio-economic status, and academic performance on the SAT score of
the student’s first choice college to estimate the desired quality. His identification
strategy takes advantage of cross-state variation in tuition subsidies. However,
Ganderton does not make use of a choice model in his econometric analysis, which
provides significant limitations in understanding the impact of his covariates on the
college choice decision.
Long (2004) further examines subsidy schemes of several different states,
including Massachusetts, California, Illinois, and Nebraska, and simulates how
decisions would change if the aid were awarded in different ways. Long uses
extensive match-specific data between individuals and nearly 2,800 colleges in a
conditional logistic choice model. The conditional logit model used here controls for
student body characteristics, college expenditures, and distance to measure the
impact of cost on likelihood of attendance. Her identification comes from the fact
that states have different tendencies to subsidize their public colleges. The model
finds that when offered large in-kind subsidies, students choose public colleges even
when there is a substantial gap between the resources offered by public and private
college options. In addition, the subsidies introduce incentives for students to choose
public four-year colleges over two-year colleges. If these in-kind subsidies are
instead offered as a transferable credit, Long estimates that up to 29 percent more
students would prefer to attend a private four-year college. As a result, she
Namir Shah 11
concludes that these non-transferable subsidies lead students to choose colleges of
lower quality. From her interstate comparisons, Long finds, for example, that when
faced with California’s generous subsidies and diverse system of public colleges as
opposed to Massachusetts’ less generous and limited array of public options,
individuals paid far less but received a similar amount in resources. Long’s findings
validate Peltzman’s hypothesis in states with average or above average amounts of
state aid but limited availability of public options with high levels of resources.
Avery and Hoxby (2003) track a group of high-achieving students through the
college admissions process, collecting information on college applications, high
school academic performance, parental preferences, enrollment, and college costs.
Avery and Hoxby use a conditional logit model in this paper to estimate college
choice. This conditional logit considers the colleges to which each student was
admitted to be the student’s college choice set. Within-student variation comes from
the actual selection of one college from the choice set. The estimation relates the
binary choice outcome for each option to the college-specific attributes and match
characteristics. Avery and Hoxby find that students are more likely to attend more
selective colleges that offer larger grants, loans, and/or work -study opportunities,
with less differentiation between the three types of aid. They calculate that one-
third of students lose lifetime present value – based on colleges’ instructional
resources – because they respond unwisely to financial aid offers. The relevant
finding from this paper is that students are differently sensitive to financial aid
depending on the structure of the aid. Estimates are identified from variation across
Namir Shah 12
states in their public colleges’ expenditure levels, state-provided subsidies, and aid
packages.
Cohodes and Goodman (2013) find compelling evidence to support Peltzman’s
hypothesis using Massachusetts high school students who were awarded merit
scholarships through the Adams Scholarship (top 25% of high school graduates in
each school district). Their identification strategy exploits a regression discontinuity
in the eligibility requirement to estimate the impact of the subsidy on college
quality in the enrollment decisions of students just above and below the threshold.
Students on either side of the eligibility cutoff are theoretically very similar other
than their exact percentile rank, so they make strong control and treatment groups.
Cohodes and Goodman provide evidence of reduced consumption of higher education
driven by an exogenous shock of the in-kind subsidy and show that the reduced
costs come at the potential sacrifice of degree completion. They note that the Adams
Scholars were granted tuition waivers at in-state public colleges of lower quality
than the average alternative available to them and show that students are willing
to sacrifice college quality for relatively small amounts of money. Furthermore, the
choice of a lower quality college reduces the probability of graduating on time by
40%, indicating that the subsidy has effects on not only on enrollment, but
potentially also on achievement. Their results confirm the hypothesis that merit aid
is effective at keeping students in state but that marginal students are a small
fraction of total aid recipients.
Namir Shah 13
3.2 Financial Aid & College Attendance
There is a fairly robust economic literature regarding the impact of financial
aid on college attendance and persistence. In general, economists agree that
increased financial aid increases the probability of a student enrolling in college,
though the distributive impact and accompanying effects are less clear.
Dynarski (2003) analyzes the impact of the elimination of the Social Security
Student Benefit Program on college attendance and completed schooling. The
program, which provided monthly payments to the 18- to 22-year-old children of
deceased, disabled, or retired beneficiaries while the children were enrolled in
college, was eliminated in 1982. Using a difference-in-differences methodology, the
study estimates that increasing aid by $1,000 increases the probability of attending
college by about 3.6 percentage points and finds that aid eligibility increases
completed school.
Dynarski’s (2000) study of Georgia’s Helping Outstanding Students
Educationally (HOPE) Scholarship program estimates the impact of grants on the
college attendance of middle- and upper-income students. It shows that the
program, which covers a significant portion of tuition for public colleges in Georgia
or an equivalent amount for private colleges, had a substantial impact on college
attendance, increasing attendance rates by 7 to 8 percentage points. The effects
were concentrated among whites, with little to no effect on the schooling of Blacks,
widening the racial and income gaps in college attendance in Georgia. This article
Namir Shah 14
suggests that a well-designed program may successfully increase college
attendance, though the associated side effects may be undesirable.
Dynarski (2004) analyzes changes in merit aid programs, particularly in
Georgia and Arkansas, and their effect on schooling decisions. She reviews evidence
regarding whether colleges increase tuition in response to increased aid, whether
colleges decrease other types of aid offered, and whether merit aid linked to
performance leads to grade inflation, among other topics. This article provides a
summary of state merit aid program changes since the early 1990s and describes
the historical and economic context associated with the important revisions. Using
more recent data than in Dynarski (2000), this paper reaches a similar conclusion to
find that the Georgia HOPE scholarship increased the college attendance rate by
8.6 percentage points relative to the rates of other Southern, nonmerit states. In
addition, Dynarski (2004) finds that the HOPE Scholarship increases the likelihood
of attending a four-year public institution by 4.5 percentage points, increases the
likelihood of attending four-year private institutions by 2.2 to 2.8 percentage points,
and decreases the probability of attending a two-year public institution by 1.7 to 5.5
percentage points.
3.3 Contribution
This paper contributes to the existing literature by providing an analysis of
one of the more obvious redirections of academic talent to less-resourced colleges.
The exogenous subsidy shock at public two-year colleges provided by the NJ STARS
program allows us to determine the causal effect of tuition subsidies with a natural
Namir Shah 15
experiment. New Jersey is a particularly interesting case study of tuition subsidies
because of the unique structure that funnels high-achieving students to two-year
colleges. In addition, the above-average college preparedness and demographic
diversity of New Jersey high school students and the relatively small range of in-
state public and private college options provide compelling circumstances for
determining how conditional tuition subsidies alter college choices.
4444 Theoretical Theoretical Theoretical Theoretical FrameworkFrameworkFrameworkFramework
When economists model students' college choices, they typically assume that
students weigh the benefits of each college (and the non-college option) against the
costs of each college. The benefits include the college's effect on future income and
the utility gained from the experience itself. Since a student's utility from college
may be affected by its geography, her peers, and her match with its curriculum,
these factors potentially affect her choice. The costs of a college include opportunity
costs (lost wages, lost time), tuition, and fees. Any econometric college choice model
should attempt to include, as explanatory variables, a full array of measures of or
proxies for these costs and benefits.
Although some goods and services bundled into "college" are consumption
(housing, food, and so on), economists typically treat the educational services
provided by colleges as an investment in human capital. Therefore, classic
microeconomic theory largely predicts that individuals choose the college (or non-
college option) with the highest return on their investment (tuition, fees, effort,
foregone earnings, and so on). In such a case, institution-specific scholarships in the

Namir Shah 16
form of in-kind tuition subsidies always lead students to invest weakly less in
education than they otherwise would if given the same amount in the form of fully
portable scholarship. It is even possible that in-kind tuition subsidies will lead some
students to invest less in education than they would if they were given no aid at all.
The former result is fairly obvious because it merely depends on the idea that
students are unable to top up (at an efficient cost) the education offered by the
colleges with in-kind subsidies. For instance, a student cannot efficiently reduce the
student-faculty ratio at her chosen college by hiring faculty on the side to teach her
or her. The latter result, in-kind subsidies potentially causing students to less than
they would with no aid, can occur because if the only colleges that qualify for
subsidies offer a fairly low amount of educational inputs. As a rule, the lower and
narrower are the range of colleges with in-kind subsidies, the more likely are
students' investments likely to be distorted downwards.
To see this, consider Peltzman's (1973) model of the effects of government
subsidies-in-kind on college choice. Peltzman’s model finds that some students will
be induced to pick lower quality colleges if subsidies are college-specific compared to
the choices that would prevail without any subsidy. Using a human capital
investment model to describe these subsidies, students would like to choose a
college with the greatest amount of educational inputs for the lowest cost, subject to
a set of preferences described by iso-input/tuition curves. Assuming educational
inputs can be measured monetarily, academic spending by a college becomes a
reasonable, though imperfect, parameter. The full range of college choices are now
Namir Shah 17
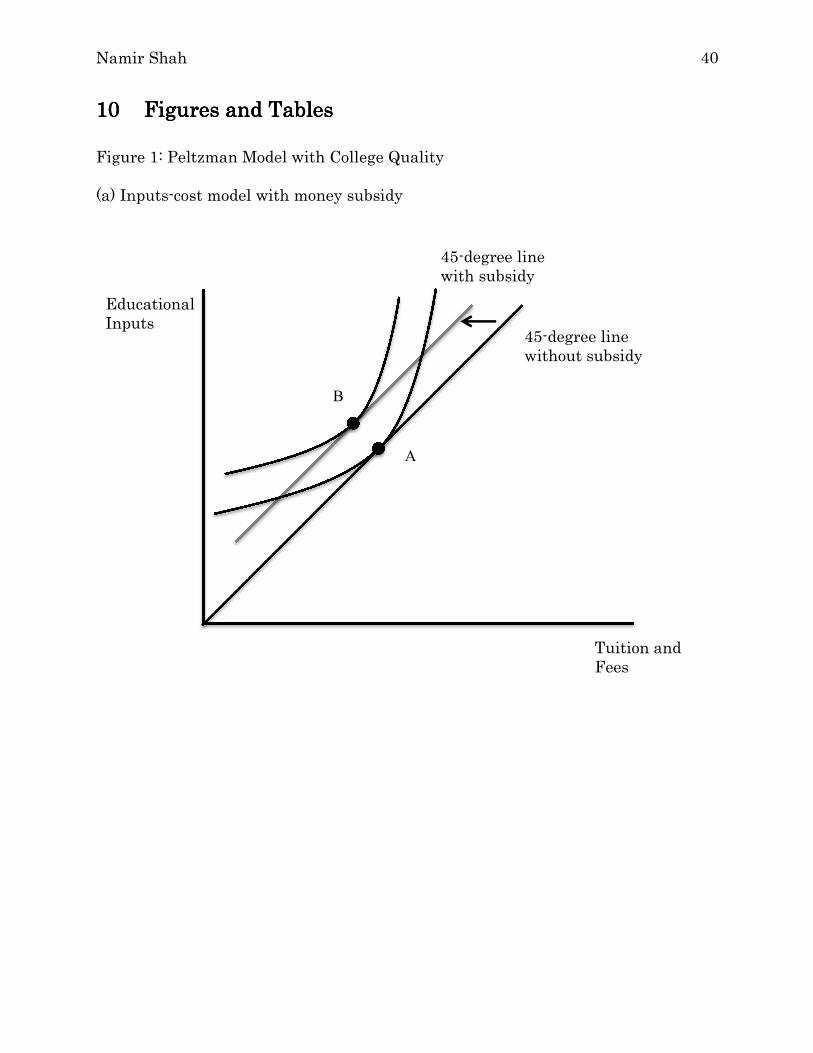
depicted as occupying points on the 45-degree line of the input-cost space in Figure
1(a). Student preferences, similar to indifference curves, display the tradeoff that
students are willing to make between cost and quality.
In a perfect market, the consumer may be seen as choosing from an infinite
number of higher education institutions, each offering a different amount of
educational inputs at $1 per unit, allowing the consumer to choose any point on the
45-degree line of Figure 1(a). In the market for higher education, though, a
consumer does not directly choose a given dollars’ amount of higher education.
Instead, the student selects a college, based on her aggregate preferences, that she
expects to deliver some amount of education.
Using Figure 1(a) to illustrate the market for higher education, consider an
unsubsidized student who selects college A. Given a relatively small general
subsidy, a subsidy with no requirements on where it is used, she would prefer to
enroll in college B with greater quality than college A. With general subsidies, the
student is unambiguously better off than without the subsidy and will choose to
invest in at least as much quality as before. However, most students are not offered
general subsidies but instead a subsidy-in-kind by their state governments, which
operate a university – or several universities – providing some maximum amount or
quality of education. More often than not, these subsidies are restricted to use at
one of these public, in-state colleges. The student can either accept the subsidy at
the colleges(s) allowed by the state or choose from the entire market without the
subsidy. In such states, the student faces a more limited range of choice than with
an equivalent subsidy not restricted to a particular subset of colleges, placing a
Namir Shah 18
limit on the amount of quality that the student may receive if she decides to use the
subsidy.
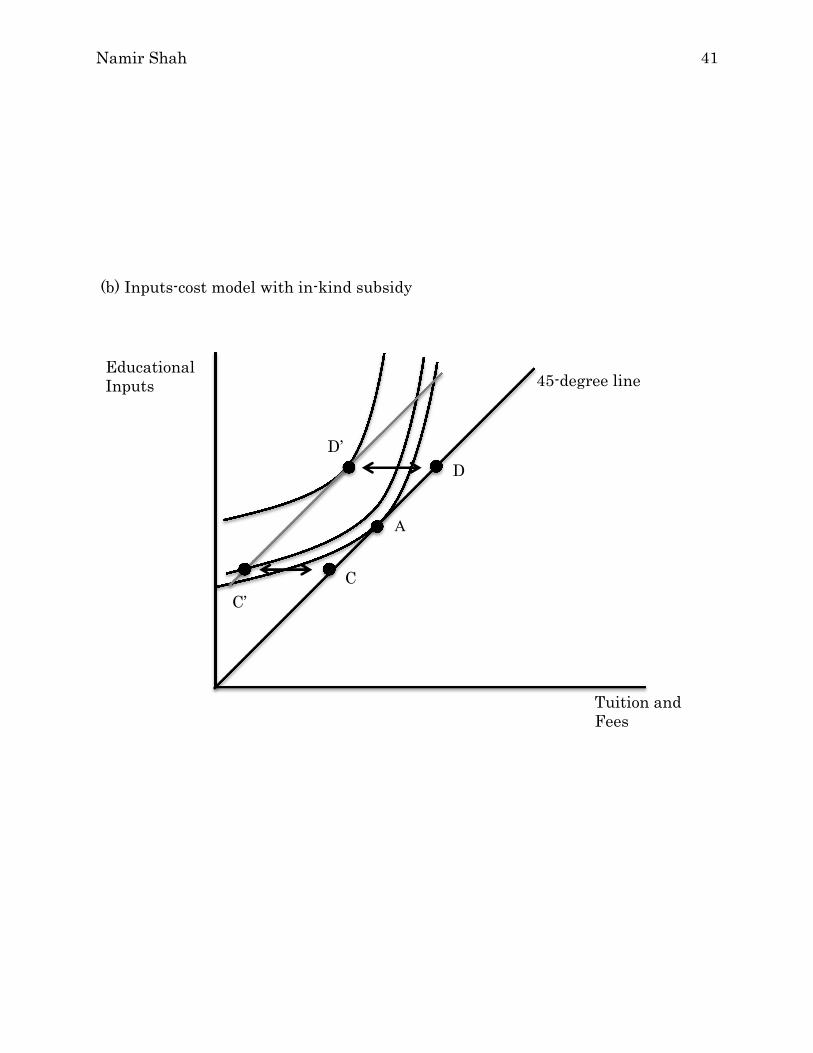
Figure 1(b) describes this situation with institution-specific subsidies.
Because the student may only use the subsidy at a specific subset of colleges, the
relative treatment of college choices has changed for students. It is this change that
opens the possibility that students could change to a college of lower quality. For
example, the student can consider colleges C and D. Their subsidies are exactly the
same size, but a college-specific subsidy valid only at college C and not D would
induce the student to choose college C, a choice with much lower quality than
without any subsidy at all. As a result, utility-maximizing behavior for some
individuals will induce acceptance of a subsidy-in-kind even though the quality of
their unsubsidized choice would exceed that amount attained with the subsidy. If
these individuals are numerous enough, the subsidy-in-kind could reduce total
investment in higher education among eligible students.
Because the market for higher education diverges from the stylized version
modeled above, several revisions are required to understand the effects of the NJ
STARS program. First, students do not face an infinite number of choices; unlike
Figure 1(a), there are a finite number of colleges, leading to discontinuities in the
45-degree line. Second, as seen in Figure 3(b), even unsubsidized colleges do not
necessary provide $1 worth of education at a cost of $1. This is partly because the
measures of expenditure on students are far from perfect. Third, merit programs
that focus on high-achieving student necessarily have different effects than a
population-wide subsidy. Subsidies, like the NJ STARS program, that target the top
Namir Shah 19
performers are more likely to include students whose original unsubsidized choices
would have fairly high levels of quality. Moreover, the NJ STARS program included
only a small group of colleges with relatively low educational inputs. This, combined
with the high-achieving nature of the eligible students, makes it more likely that
NJ STARS induced students to enroll in colleges with lower educational inputs.
This could translate into a lower educational attainment and decreased lifetime
earnings, In short, theory suggests that NJ STARS is a program fairly likely to
change college choices and not necessarily in a way that raises educational
investments.
5555 Empirical MethodologyEmpirical MethodologyEmpirical MethodologyEmpirical Methodology
I am interested in discovering the impact of eligibility for the NJ STARS
program on students’ college choice beyond the factors that normally influence
college choice. As such, conditional logit is best suited for this estimation problem
because it estimates the probability of choosing each alternative based on the
empirical factors built into the model. These factors are divided into three
categories: (i) characteristics of the student, (ii) characteristics of the college, and
(iii) characteristics that describe the match between the student and the college
choice. Student characteristics include GPA, class rank, and standardized test
scores. Because the student characteristics do not vary based on the alternatives
being considered, they have no influence on the conditional logit choice model.
College characteristics include costs, educational inputs, student population
attributes, and selectivity. Finally, match characteristics include distance from the
Namir Shah 20
student’s home and the difference between the student’s test scores and the median
accepted student’s test scores. In this case, NJ STARS eligibility falls into all three
categories. The student must be academically eligible for the scholarship and the
college must be a participating institution in the program, which creates a match
dummy variable for joint eligibility.
Conditional logit groups together every student-choice pair so that the total
number of observations is equal to the product of the number of students and
number of alternatives. Because I do not know the exact colleges to which the
student applied and was admitted, I include as options all colleges to which
students in my data set have enrolled, at times combined together into specific
groups of similar colleges. This partially endogenous choice set formation helps to
eliminate irrelevant alternatives, though not as precisely as if the data set included
all colleges to which he student applied. For each student-choice pair, there exists a
binary outcome dummy variable that indicates the actual choice of the student; only
one of these outcome variables is equal to 1 for each student. Each observation is
linked to the alternative-specific characteristics and the characteristics that depend
both upon the student and the alternative. Conditional logit is specifically
appropriate because it is able to examine choices in the presence of match-specific
variables, unlike a multinomial logit.
Conditional logit relies on the binary outcome variable to maximize the
similarity between estimated likelihoods and actual enrollment outcomes. Formally,
the equation I estimate is:
Namir Shah 21
������������ℎ����� = �� = ������
∑ �����������
to maximize
ln� = �� !"�����ln�������
����������ℎ����� = ��
#
���
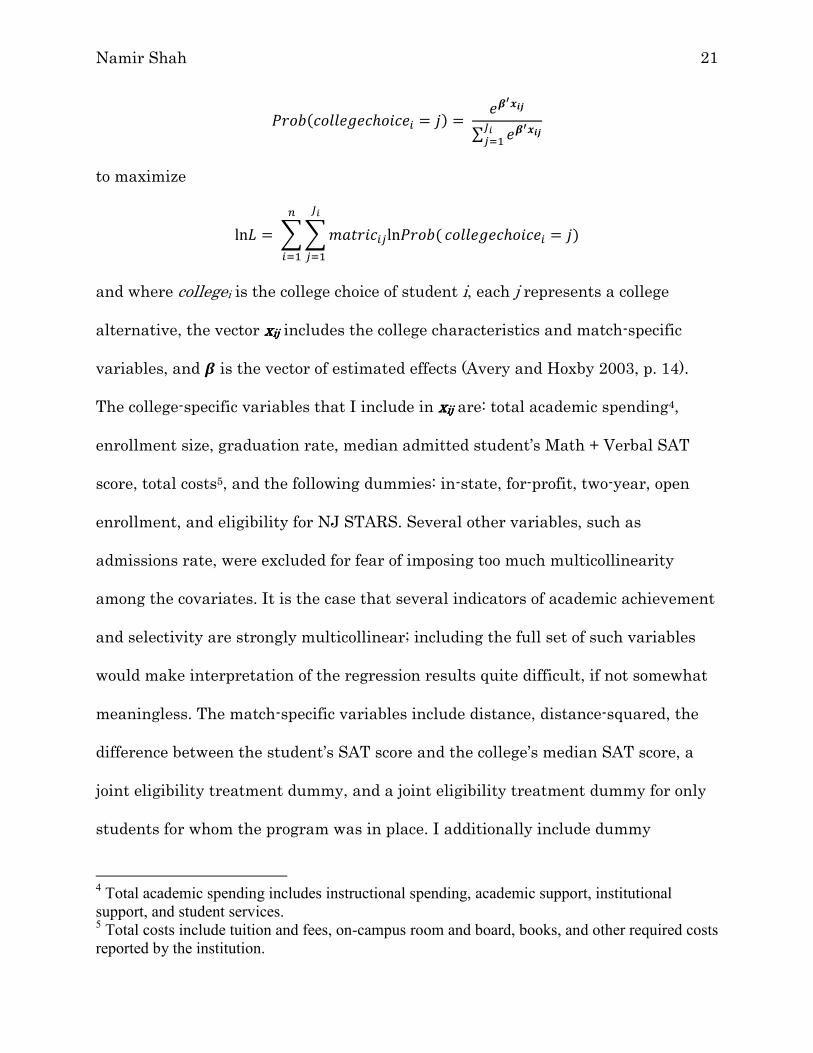
and where collegei is the college choice of student i, each j represents a college
alternative, the vector xxxxijijijij includes the college characteristics and match-specific
variables, and � is the vector of estimated effects (Avery and Hoxby 2003, p. 14).
The college-specific variables that I include in xxxxijijijij are: total academic spending4,
enrollment size, graduation rate, median admitted student’s Math + Verbal SAT
score, total costs5, and the following dummies: in-state, for-profit, two-year, open
enrollment, and eligibility for NJ STARS. Several other variables, such as
admissions rate, were excluded for fear of imposing too much multicollinearity
among the covariates. It is the case that several indicators of academic achievement
and selectivity are strongly multicollinear; including the full set of such variables
would make interpretation of the regression results quite difficult, if not somewhat
meaningless. The match-specific variables include distance, distance-squared, the
difference between the student’s SAT score and the college’s median SAT score, a
joint eligibility treatment dummy, and a joint eligibility treatment dummy for only
students for whom the program was in place. I additionally include dummy
4 Total academic spending includes instructional spending, academic support, institutional
support, and student services. 5 Total costs include tuition and fees, on-campus room and board, books, and other required costs
reported by the institution.
Namir Shah 22
variables to indicate whether the following are missing and/or unreported in my
data set: median SAT score, graduation rate, academic spending, total cost, and the
difference between the college’s median and the student’s SAT scores.
The variation that drives my estimates arises from within-student differences
in the college alternatives rather than differences between students. Because
college characteristics are exogenous to the student, she must accept the
alternatives before her and make a decision based on the alternative-specific and
match-specific variables described above. Student characteristics can influence the
college choice decision by affecting the manner in which she responds to college or
other match characteristics. In the case of significant disparities in these
considerations, it can be appropriate to estimate the choice model separately based
on the student characteristics. Characteristics that vary by student but not by
alternative are thus not included independently in the model. However,
characteristics that vary by college but not by student are modeled because they can
be direct factors in the college choice.
I display results of the conditional logit estimation using odds ratios. The
odds ratio indicates the ratio of post- odds of a choice to the pre- odds of a choice
given a ceteris paribus change in the variable in question. Formally, the odds ratio
is ��$. Positive odds ratios denote an increase in likelihood of a choice as the variable
in question increases, while negative odds ratios signify the opposite. Using the
estimated odds ratios, I am able to manipulate the regression results to yield
estimated probabilities of enrollment for each choice before and after NJ STARS.

Namir Shah 23
These predictions represent counterfactual probabilities based on all academically
qualified students being treated as eligible for NJ STARS and none of the
academically qualified students being treated as eligible. This involves turning the
match variable for joint eligibility “on” and “off” to mimic pre- and post-NJ STARS
scenarios. From these pre- and post-STARS probabilities, I am able to measure the
effects of the program on a specific set of college characteristic and educational
outcome variables, such as in-state enrollment, two-year college enrollment,
graduation rates, and academic spending.
6666 DataDataDataData
6.1 Data Construction and Sources
To address the questions posed at the beginning of this paper, student-
specific and college-specific administrative data are most helpful. For student data,
the above model requires measures of high school academic performance,
particularly class rank percentiles and standardized testing scores, the institution
in which the student enrolls after graduating from high school, the type of degree
program, and information on college transfers. To create an effective choice model, I
additionally require college-specific characteristics, including location, enrollment,
and costs. In order to measure college quality, it is also important to consider per-
student academic spending and measures of peer aptitude such as the median
student's standardized test scores.
In this paper, I draw on three primary data sets. Student performance and
demographic data comes from the College Board, and enrollment information from
Namir Shah 24
the National Student Clearinghouse (NSC) data is liked to the College Board data
set using unique identifiers. College variables, including academic characteristics,
selectivity information, and spending data are obtained from the National Center
for Education Statistics’ (NCES) Integrated Postsecondary Education Data System
(IPEDS). Here, I describe these three data sets and the construction of the full data
set that I use in my final analysis.
The College Board data set provides the foundation of New Jersey student
information, including descriptions of students’ college enrollment preferences,
including location, size, and type, and a list of the colleges to which each student
sent an SAT score report. In addition, the College Board provides demographic
information, academic performance metrics, and standardized test scores. Students
in the top quintile are considered the treatment students, while students in the
second quintile are the control. Class rank is self-reported by students when they
take the SAT so it is not a completely accurate measure of the class rank that a
student has at the time she graduates. Nevertheless, it is a strong predictor of
eligibility for the NJ STARS scholarship. To improve the accuracy of the prediction,
I removed all students who reported themselves to be in the two quintiles but who
also reported themselves to have a GPA of less than a B.
The NSC data set contains information about students’ college enrollment,
location, and educational history. The data includes every college in which the
student has enrolled, as well as some degree information depending on the college,
particularly the students’ degree type and major. From this baseline, three
Namir Shah 25
categories were calculated: (i) the college in which the student first enrolled after
high school graduation, (ii) the college in which the student was enrolled for the
longest period of time after high school graduation, and (iii) the college in which the
student was most recently enrolled. For the purposes of this paper, I am interested
in the initial college choice decision and must designate a single institution to
consider the student’s actual choice for the regression. However, the first college is
not always the best fit for the analysis. As a result, I created a basic algorithm to
assign a single college as each student’s choice. First, if the college that the student
first attended and the college that the student most recently attended are the same,
that college is assigned. By extension, if all three college categories were identical,
the same rule applies. Approximately 81% of the students satisfied this first
criterion. Next, if the student’s first period of college enrollment after high school
lasted for at least three months, that college was used. Finally, if the student’s first
period of college enrollment was less than three months, I assigned the college in
which they were enrolled for the longest period of time. In the rare case that NCS
records could not be located for the three aforementioned categories, the student
was dropped from the analysis. For these students, it is possible that the student
did not enroll in college after graduating high school or the student enrolled in a
college not covered by the NCS. The NCS data was then merged with the College
Board data using the students’ unique random identification number.
From the NSC data set, I extract a list of the colleges in which the students
have enrolled. Using the IPEDS database, I compile a range of detailed college
Namir Shah 26
variables. Because the program was passed and first implemented in 2004, I use
IPEDS data from 2004 to gather college characteristics corresponding with the
inception of the program. For most colleges, this data would have contained
information for the 2003-2004 academic year, which is the most recent information
that the graduating class of 2004 would have had when making their college choice
decision. The IPEDS data set includes detailed data on college characteristics,
enrollment, admissions criteria and selectivity, graduation rates, institutional
expenditures, published student costs, and financial aid. College characteristics,
particularly institutional sector (e.g. four-year, not-for-profit) and location were
primarily used to construct the college categories used in the choice model.
Graduation rates and institutional spending are the primary observable college
quality characteristics, while median test scores and the admissions rate are helpful
as indicators of peer quality and the likelihood of admission conditional on applying.
The characteristics that I expect, based on the previous literature, to be most
important in college choice are total enrollment, instructional spending, total
academic spending, the admissions rate, the median Math + Verbal SAT score, the
graduation rate, total costs, and average net cost. Because these variables tend to
be multicollinear, it can be difficult to interpret the coefficient on one of them
without considering the coefficients on the others. Using the available IPEDS data,
I construct variables for each college’s admissions rate and median SAT scores,
computed as the mean of the 75th and 25th percentiles of SAT scores of the schools.
For colleges that reported only ACT score percentiles and no SAT score percentiles,
Namir Shah 27
I use the College Board and ACT’s published concordance tables to calculate the
equivalent SAT scores. For a small group of colleges, expenditure information could
not be found in the IPEDS database. In these cases, I consulted the Delta Cost
Project’s publicly available data set for academic spending metrics.
Beyond these three data sets, I also utilized the Barron’s Admissions
Competitiveness Index. The Barron’s Admissions Competitiveness Index classifies
institutions of higher education into seven categories based on selectivity: Most
Competitive (1), Highly Competitive (2), Very Competitive (3), Competitive (4), Less
Competitive (5), Noncompetitive (6), and Special (7). Furthermore, there are three
“plus” subcategories: 2+, 3+, and 4+, which contain colleges at the upper echelon of
their respective score. Hundreds of colleges, particularly two-year colleges, are not
included; I classify these as “unranked” by Barron's.
To construct the list of 170 college categories for the conditional logit model, I
began with individual categories for each New Jersey college with at least 15
observations in the combined College Board-National Student Clearinghouse data
set. Next, I added the 50 out-of-state colleges with the greatest number of
enrollment observations. For the remaining colleges, I sort them into groups based
on Barron’s Admissions Competitiveness Index scores, location, and sector.
Categories with too few observations were merged into similar categories. For
example, given low enrollment in distant colleges, I combined all colleges in the Far
West, Plains, Rocky Mountain, and Southwest regions by Barron’s score. In some
cases, categories were compressed even further. For each category, I then calculated
Namir Shah 28
category-specific variables for use in the choice model regression by using an
enrollment-weighted-average of the values of the colleges within that category.
Thus, colleges that students chose more often within a category were given more
weight in the calculation of the category variables; colleges that did not report those
variables were given no weight. These variables included total academic spending,
admissions rate, median Math + Verbal SAT score, graduation rate, total costs, and
average net cost.
To estimate a conditional logit model, it is necessary to structure the data set
in such a way that there is an observation for every possible student-category choice
pair. The data set includes not only the characteristics of the choices but also
match-specific (“match”) variables that depend on both the student and the college
category choice. For instance, I calculate the difference between the student’s SAT
score and the median score of students in the choice category. I also compute the
distance in miles between the student and the average location of a college within
each category. Crucially, I include a dummy variable that indicates whether the
student-college match was eligible for the NJ STARS program.
Because the NJ STARS program changed so substantially in 2009, I focus on
New Jersey high school graduating classes from 2000 to 2008. Another reason for
focusing on these classes is that the families of students in the graduating classes of
2009 onwards were potentially seriously affected by macroeconomic and financial
market conditions. These could have had independent effects on students' college
choices that would confound an investigation of the effects of NJ STARS.
Namir Shah 29
6.2 Weakness of the Data Set
The data sets described above do not include a precise measure of students’
financial circumstances, particularly household income. Because only students with
household incomes below $250,000 are eligible for NJ STARS grants, the treatment
group may also include students who are not financially eligible. From 2004 to
2008, the percentage of New Jersey households exceeding this income eligibility
stayed fairly consistent at about 3.8% to 3.9% (State of New Jersey). Since only a
small fraction of New Jersey families fall outside this eligibility range, I estimate
that the estimation’s precision is only slightly diminished by the inability to
determine financial ineligibility for the scholarship. However, due to the structure
of the program, it is conceivable that the program would have varying degrees of
impact on students based on their family’s financial circumstances. Students from
lower-income households may be more heavily swayed by free tuition to a two-year
college, while a more affluent student may not react at all to the relatively small
financial incentive.
6.3 Summary and Descriptive Statistics
My completed data set includes 57,186 New Jersey students from the
graduating classes of 2000 to 2008. Approximately 47.6 percent of the students
graduated before the inception of NJ STARS in 2004, so the program was in place
for the later 52.4 percent of students. 45,455 of these students self-identified their
class rank as the top quintile, while 11,731 listed their rank as the second quintile.
The former subset comprises the treatment group, while the latter make up the
Namir Shah 30
control group. 49 percent of the students reported at least an A average. Across the
full set of students, the mean SAT Critical Reading and Math scores are 613 and
629, respectively, with combined scores in the range of 1010 to 1600.
Using the NSC data set, I find that that colleges in which these students
most frequently enroll first are Rutgers New Brunswick, The College of New Jersey,
Rowan University, Montclair State University, and New York University, in that
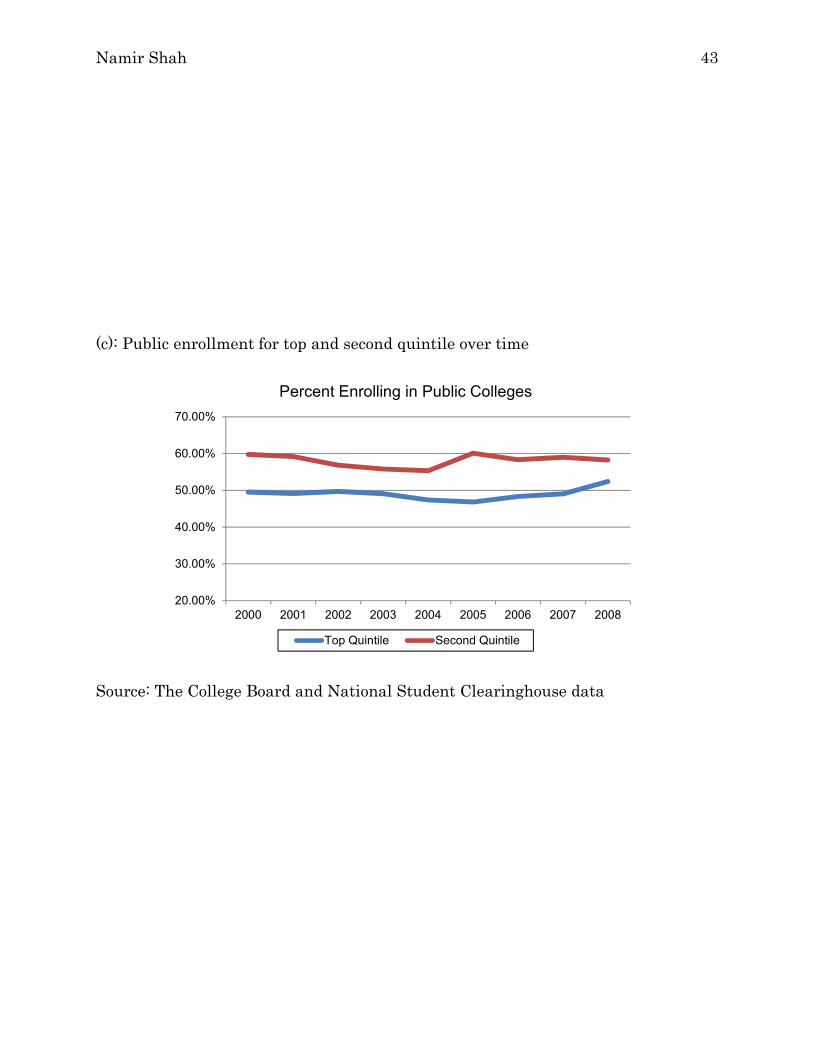
order. From 2000 to 2008, the percentage of students in the top two quintiles
enrolling in public colleges has remained fairly consistent, while the percentage
enrolling in New Jersey colleges slightly increased over the same period.
Enrollment in two-year colleges, however, grew significantly more among top
quintile students than second quintile students, an increase of 87% and 23%,
respectively.
Table 2 contains a summary of New Jersey’s two-year and four-year colleges
with selected academic and selectivity data for the 2003-2004 academic year.
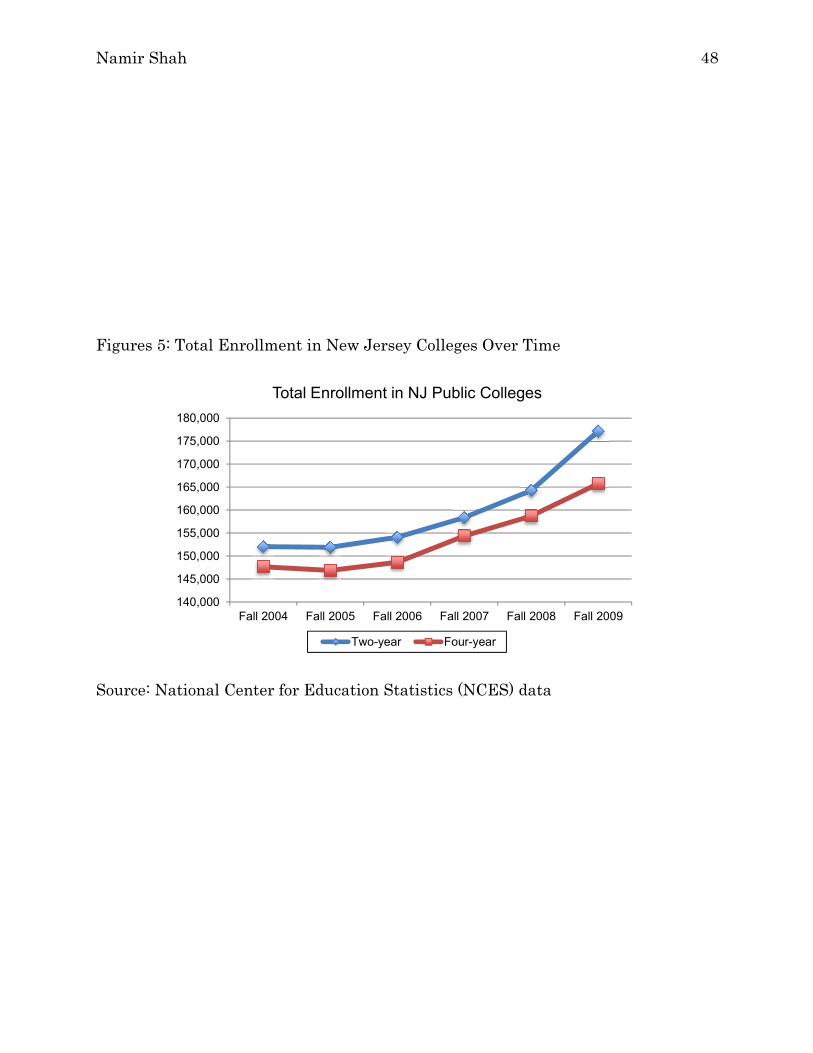
Enrollment in public, two-year colleges increased by 16.5 percent from fall 2004 to
fall 2009, while enrollment in public, four-year colleges increased by only 12.2
percent over the same period. Among New Jersey’s public, four-year colleges, The
College of New Jersey is the only college with a Barron’s Admissions
Competitiveness Index score of 1; its 50th percentile SAT score of 1265 is also the
highest of New Jersey’s public colleges. Rutgers University’s $10,226 in
instructional spending and $15,376 in total academic spending position it as the
best-resourced public college in New Jersey based on educational inputs. Union
Namir Shah 31
County College’s $4,206 in instructional spending, the highest of New Jersey’s
public, two-year colleges, falls slightly short of Montclair State University’s $4,466,
the lowest of the public, four-year colleges.
Overall, the summary statistics indicate that top quintile students have
disproportionately shifted their enrollment from four-year colleges to two-year
colleges with less academic resources. Such a shift impacts the educational
outcomes of the students through potentially lower-quality education, diminished
persistence to graduation, and decreased future income. However, this simple
analysis does not fully account for the numerous factors that may influence
students’ college enrollment decisions. Thus, my empirical strategy going forward
employs an appropriate econometric multinomial choice model in addition to
variation in eligibility caused by the program's rules and introduction.
7777 ResultsResultsResultsResults
7.1 Conditional Logit Enrollment Rates
My basic conditional logit results on the determinants of college choice are
summarized in Table 6. Reported values are odds ratios for all students, control and
treatment, regardless of year. The overall patterns of signs, magnitude, and
significance make sense in relation to the college choice model. The results are
broadly close to my expectations and likely the expectations of most economists
estimating a college choice model. Students are 1.2% more likely to enroll in a
college with a one percentage point higher graduation rate, 3.6% more likely to
enroll in a college with a ten point increase in median Math + Verbal SAT score,
Namir Shah 32
and 26.5% less likely to enroll in a college 100 miles further from their homes. Next,
for every ten points that the student’s SAT score exceeds the college’s median SAT
score, the probability of enrollment increases by 1%.
When looking at the inputs-cost consideration, I find that students are 3.8%
less likely to enroll in a college with a $1,000 increase in total costs but also 0.8%
less likely to enroll in a college with a $1,000 increase in total academic spending.
While the latter may seem counterintuitive, it is helpful to remember that total
costs and academic spending are highly multicollinear, leading to difficulty in
interpreting either covariate independently. Finally, we see that students who are
academically equivalent to STARS-eligible students but graduated before the
program’s inception NJ STARS are 62.4% less likely to enroll in one of the eligible
public, two-year colleges in New Jersey, while joint eligibility between the student
and the college choice increases probability of enrollment by 62.2%. This is intuitive
because students who have no financial incentive to attend one of the public, two-
year colleges would likely otherwise attend a much more selective and better-
resourced institution.
The initial conditional logit model shows fairly good results in terms of
precision and model fitness. Due to the large number of students and student-
college observations (over 9.7 million), it is logical that the coefficients and odds
ratios are measured with great precision. The R-squared of 0.0855 indicates that
8.55 % of variation in the sample is modeled by the existing covariates. In a college
choice model designed to analyze the effects of the scholarship program, this degree
Namir Shah 33
of model fitness is quite adequate. Many variables that would increase the R-
squared are of little importance to my analysis, including availability of desired
major and legacy status. At the same time, other variables that could may would
enhance the fit of the model could overly complicate interpretation of regression
results by adding further multicollinearity. For example, instructional spending,
student-faculty ratio, admissions rate, and other selectivity measures are correlated
with variables already included in my analysis. Furthermore, selectivity tends to be
correlated with college resources generally, even without including multiple
measurements of each. The lack of convergence in the model, specifically for two
variables, is an area of caution but not of a point of great concern.
7.2 Counterfactual Enrollment Effects
Beyond the conditional logit odds ratios, I manipulate the data set to
calculate counterfactual summary statistics. That is, I estimate enrollment for
students that are academically eligible for NJ STARS (i.e. in the top quintile) with
and without NJ STARS. Predicted enrollment rates for each college category are
reported in Table 7. Overall, the model predicts that enrollment in New Jersey’s
public, two-year colleges increases at the sacrifice of enrollment in nearly every
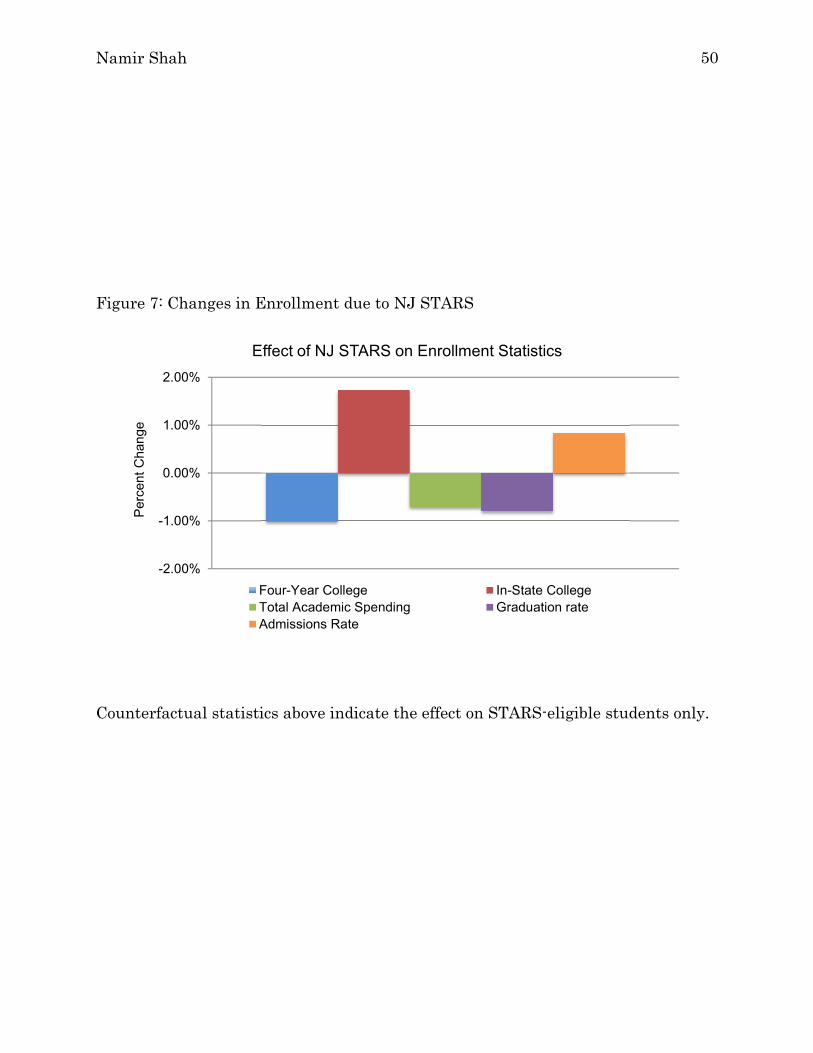
other college category. As summarized in Table 8, we see that the NJ STARS
program has induced academically eligible students to enroll in two-year colleges at
a rate 41% higher and four-year colleges at a rate 1% lower than the hypothetical
scenario in which the same students were not eligible for the program. Similarly,
students enroll in New Jersey colleges and universities 1.7% more frequently. These
Namir Shah 34
are equivalently thought of as the differences in enrollment rates between the
scenarios in which the STARS program does and does not exist.6
To assess the post-enrollment effects of the program on students, I also
calculate the mean admissions rate, graduation rate, and total academic spending
of students’ college choices with and without NJ STARS. Under the STARS
incentive scheme, students in the top quintile enroll in colleges with, on average, a
0.85% higher admissions rate, a 0.79% lower graduation rate, and 0.71% less in
total academic spending. These correspond with less selective and less resourced
colleges when compared with enrollment in the absence of the program.
8888 ConclusionConclusionConclusionConclusion
Overall, I would describe the students in my sample as altering their college
choice behavior in an expected manner. The conditional logit choice model indicates
that eligible students reacted quite significantly to NJ STARS by shifting their
enrollment patterns from four-year colleges to the in-state, public, two-year colleges
that qualify for the program. This result is less surprising given the unusual
structure of the program, which requires students to first attend one of New
Jersey’s community colleges to receive the scholarship. However, my analysis also
points strongly toward adverse, unintended consequences.
As a result of directing high-achieving students to two-year colleges, I find a
nontrivial decrease in the quality of colleges that eligible students attend in the
6 Importantly, this analysis is conditional on the students in question enrolling in a college with or without the NJ STARS program. The model is unable to consider whether students would not have attended college at all in the absence of the program.
Namir Shah 35
presence of the NJ STARS incentives. Total academic spending is an accurate
indicator of the academic resources that a college provides to its students. Though a
$151 per-student decrease in total academic spending may seem small, that amount
aggregated over the entire eligible population results in a significant quantity of
resources foregone. When the state of New Jersey is paying over $4,000 per NJ
STARS scholar in an attempt to increase their educational attainment, the
decreased investment by students who would otherwise have attended a better
resourced institution calls into question the net benefit of the program.
Beyond educational inputs during college, a widespread shift of students from
four-year college to two-year colleges has important consequences on actual
educational attainment. While STARS-eligible students are high-achieving, two-
year colleges have much lower graduation rates than their four-year rivals and
often lack the institutional resources to necessary to support persistence to
graduation. In a program designed to encourage students to transfer to four-year
colleges at the completion of a two-year degree, it is a reasonable concern whether
students are actually graduating with a two-year degree or dropping out of college
before doing so. Furthermore, after receiving an associate’s degree, the opportunity
cost of attending a four-year college is even greater, so graduates of NJ STARS may
choose not to continue their education in a four-year college at all. This is not only a
potential barrier to educational attainment, but could impact students’ future
earnings, as well.
Namir Shah 36
Conditioning scholarship on in-state and public college enrollment,
particularly two-year colleges with a limited range of college quality, greatly
distorts college choice in a way that scholarships transferable to private, out-of-
state, and/or four-year colleges could avoid. Students already planning to attend
college would be able to optimize their quantity of education investment while
keeping the subsidy, while those who would not be able to attend college could still
use the scholarship at the institution of their choice.
With between 87,000 and 90,000 students in each graduating high school
class in New Jersey, about 18,000 students per year would have been eligible for NJ
STARS using the top 20% class rank eligibility. Applying the average decrease in
total academic spending among eligible students of $151 to this eligible population
yields an aggregate loss of roughly $2.7 million in academic spending. Compared to
the $1.7 million spent by the state for the inaugural class’s 789 students and even
the $18 million spent at the program’s peak in the 2008-2009 academic year, the
adverse effects seem fairly large.
There is a certain cost-benefit analysis that should be considered when
implementing an in-kind subsidy like New Jersey’s STARS program. At some level,
the actual cost of the scholarships combined, the opportunity cost of reduced
investment by students already attending college, and potentially worse educational
outcomes could exceed the benefits of the students who are able to afford a college
education. This consideration becomes even more important when the eligible
options for use of the scholarship are as limited as they are in New Jersey. The
Namir Shah 37
unintended consequences of the program may be undermining the objectives it was
created to achieve. At the very least, the NJ STARS program merits further study
in order to evaluate the net benefits as the state continues to alter its eligibility
requirements and scholarship structure.

Namir Shah 38
9999 ReferencesReferencesReferencesReferences
Avery, C. and Hoxby, C. 2003. “Do and Should Financial Aid Packages Affect
Students’ College Choices?” in College Choices, ed. C. Hoxby. Chicago:
University of Chicago Press.
Cohodes, S. and Goodman, J. 2013. “Merit Aid, College Quality and College
Completion: Massachusetts’ Adams Scholarship as an In-Kind Subsidy,”
Harvard University (Cambridge, MA). Working Paper.
Dynarski, S. 2000. “Hope for Whom? Financial Aid for the Middle Class and Its
Impact on College Attendance,” National Tax Journal.
Dynarski, S. 2004. “The New Merit Aid.” in College Choices, ed. C. Hoxby. Chicago:
University of Chicago Press.
"Fewer NJSTARS Enrolling in 4-year NJ Colleges." Washington Times. Associated
Press, 19 Apr. 2014. Web. 20 Apr. 2014.
Ganderton, P. 1992. “The effect of subsidies in kind on the choice of a college,”
Journal of Public Economics, 48(3): pp. 269-292.
Long, B.T. 2004. “Does the Format of a Financial Aid Program Matter? The Effect of
State In-Kind Tuition Subsidies,” The Review of Economics and Statistics:
pp. 767-782.
Peltzman, S. 1973. “The Effect of Government Subsidies-in-Kind on Private
Expenditures: The Case of Higher Education,” Journal of Political Economy,
81: pp. 1-27.
Namir Shah 39
State of New Jersey Department of the Treasury, Office of Revenue and Economic
Analysis. “Statistics of Income: 2004 Income Tax Returns.” 2006.
United States Department of Education, National Center for Education Statistics,
Integrated Postsecondary Education Data System, Higher Education Finance
Data File. Electronic data, 2001.
Namir Shah 40
10101010 Figures and TablesFigures and TablesFigures and TablesFigures and Tables
Figure 1: Peltzman Model with College Quality (a) Inputs-cost model with money subsidy
Educational Inputs
Tuition and Fees
45-degree line without subsidy
B
A
45-degree line with subsidy
Namir Shah 41
(b) Inputs-cost model with in-kind subsidy
Educational Inputs
Tuition and Fees
45-degree line
D
D’
C
C’
A

Namir Shah 42
Figure 2: Enrollment Types as a Percentage of Student Quintile (a): Two-year college enrollment for top and second quintile over time
(b): In-state enrollment for top and second quintile over time
Source: The College Board and National Student Clearinghouse data
0.00%
1.00%
2.00%
3.00%
4.00%
5.00%
6.00%
7.00%
2000 2001 2002 2003 2004 2005 2006 2007 2008
Percent Enrolling in Two-Year Colleges
Top Quintile Second Quintile
20.00%
25.00%
30.00%
35.00%
40.00%
45.00%
50.00%
2000 2001 2002 2003 2004 2005 2006 2007 2008
Percent Enrolling in In-State Colleges
Top Quintile Second Quintile
Namir Shah 43
(c): Public enrollment for top and second quintile over time
Source: The College Board and National Student Clearinghouse data
20.00%
30.00%
40.00%
50.00%
60.00%
70.00%
2000 2001 2002 2003 2004 2005 2006 2007 2008
Percent Enrolling in Public Colleges
Top Quintile Second Quintile
Namir Shah 44
Figure 3: Inputs-Cost for New Jersey Colleges (a) Average net cost vs. educational inputs
Source: Delta Cost Project and National Center for Education Statistics (NCES) data
Drew University
Princeton
Rutgers New
Brunswick
0
10000
20000
30000
40000
50000
60000
0 5000 10000 15000 20000 25000 30000 35000
Total Academic Spendin ($)
Average Net Cost ($)
New Jersey Colleges Educational Input vs. Avg. Net Cost
Private, 4-year Public, 4-year Public, 2-year
Namir Shah 45
(b) Tuition and fees vs. educational inputs
Source: Delta Cost Project and National Center for Education Statistics (NCES) data
Princeton
Rutgers New
Brunswick
0
10000
20000
30000
40000
50000
60000
0 5000 10000 15000 20000 25000 30000
Total AcademicSpending ($)
Tuition and Fees ($)
New Jersey Colleges Educational Input vs. Cost
Private, 4-year Public, 4-year Public, 2-year
Namir Shah 46
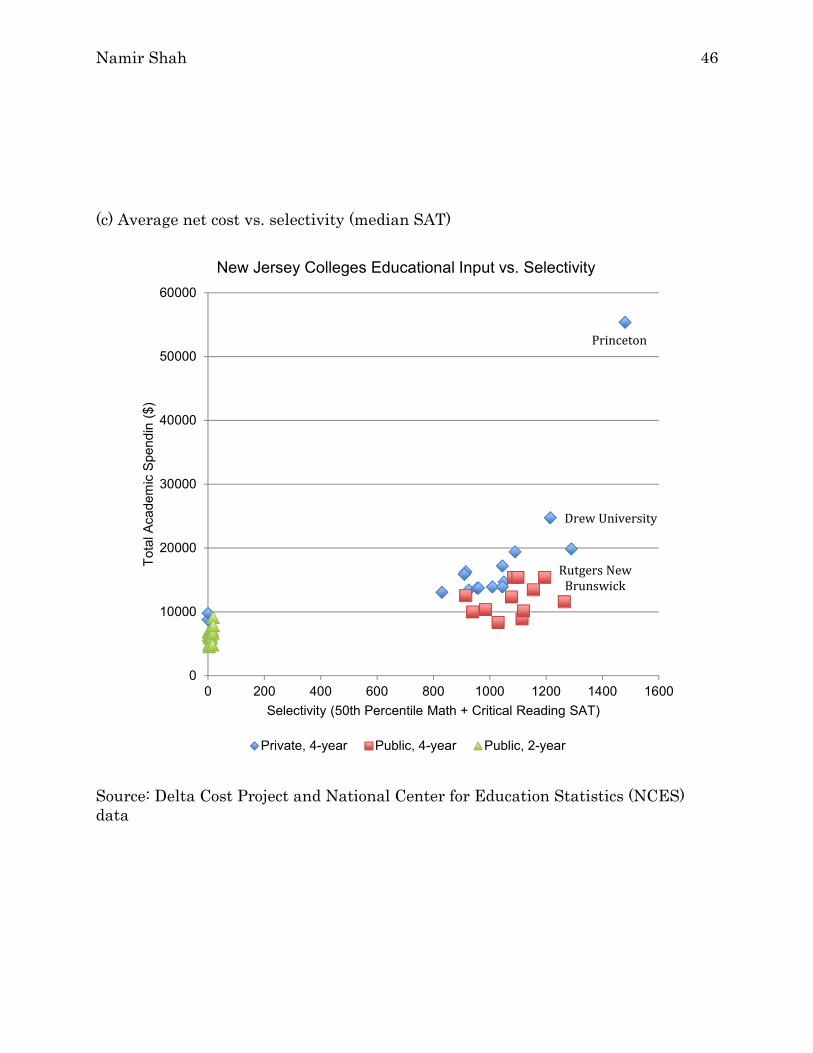
(c) Average net cost vs. selectivity (median SAT)
Source: Delta Cost Project and National Center for Education Statistics (NCES) data
Drew University
Princeton
Rutgers New
Brunswick
0
10000
20000
30000
40000
50000
60000
0 200 400 600 800 1000 1200 1400 1600
Total Academic Spendin ($)
Selectivity (50th Percentile Math + Critical Reading SAT)
New Jersey Colleges Educational Input vs. Selectivity
Private, 4-year Public, 4-year Public, 2-year

Namir Shah 47
Figure 4: Enrollment-Weighted Mean Graduation Rates of Four-Year and Two-Year Public, New Jersey Colleges Over Time
Source: National Center for Education Statistics (NCES) data
0.00%
10.00%
20.00%
30.00%
40.00%
50.00%
60.00%
70.00%
2004 2005 2006 2007 2008 2009
Average Graduation Rates of NJ Public Colleges
Two-year Four-year
Namir Shah 48
Figures 5: Total Enrollment in New Jersey Colleges Over Time
Source: National Center for Education Statistics (NCES) data
140,000
145,000
150,000
155,000
160,000
165,000
170,000
175,000
180,000
Fall 2004 Fall 2005 Fall 2006 Fall 2007 Fall 2008 Fall 2009
Total Enrollment in NJ Public Colleges
Two-year Four-year

Namir Shah 49
Figures 6: Enrollment-Weighted Tuition Rates at Two-Year and Four-Year, Public New Jersey Colleges Over Time
Source: National Center for Education Statistics (NCES) data
$0
$2,000
$4,000
$6,000
$8,000
$10,000
2000-01 2001-02 2002-03 2003-04 2004-05 2005-06 2006-07 2007-08 2008-09
Average Tuition of NJ Public Colleges
Two-year Four-year
Namir Shah 50
Figure 7: Changes in Enrollment due to NJ STARS
Counterfactual statistics above indicate the effect on STARS-eligible students only.
-2.00%
-1.00%
0.00%
1.00%
2.00%
Percent Change
Effect of NJ STARS on Enrollment Statistics
Four-Year College In-State College
Total Academic Spending Graduation rate
Admissions Rate


Namir Shah 52
Table 1: Cost Breakdown of New Jersey Colleges
(a) Public, two-year colleges
Institution Name STARS Tuition & Fees
Total Costs
Costs with STARS
Average Net Cost
Atlantic Cape Community College Yes $2,440 $12,185 $9,745 $10,881.25
Bergen Community College Yes $2,273 $8,445 $6,172 $7,001.58
Brookdale Community College Yes $2,432 $16,184 $13,752 $14,914.19
Burlington County College Yes $2,067 $15,621 $13,554 $14,776.72
Camden County College Yes $2,310 $12,970 $10,660 $11,349.17
County College of Morris Yes $2,465 $13,331 $10,866 $12,624.53
Cumberland County College Yes $2,640 $15,485 $12,845 $13,462.04
Essex County College Yes $2,478 $10,182 $7,704 $7,520.61
Gloucester County College Yes $2,736 $15,211 $12,475 $13,992.52
Hudson County Community College Yes $3,033 $15,153 $12,120 $13,850.23
Mercer County Community College Yes $1,992 $11,192 $9,200 $10,218.88
Middlesex County College Yes $2,513 $16,561 $14,048 $15,189.79
Ocean County College Yes $2,524 $16,678 $14,154 $15,793.08
Passaic County Community College Yes $2,483 $13,062 $10,579 $11,192.00
Raritan Valley Community College Yes $2,470 $9,860 $7,390 $9,053.16
Salem Community College Yes $2,975 $7,965 $4,990 $5,842.87
Sussex County Community College Yes $2,514 $11,536 $9,022 $10,309.27
Union County College Yes $2,243 $20,243 $18,000 $19,098.30
Warren County Community College Yes $2,064 $14,286 $12,222 $13,203.21
Source: Delta Cost Project and National Center for Education Statistics (NCES) data
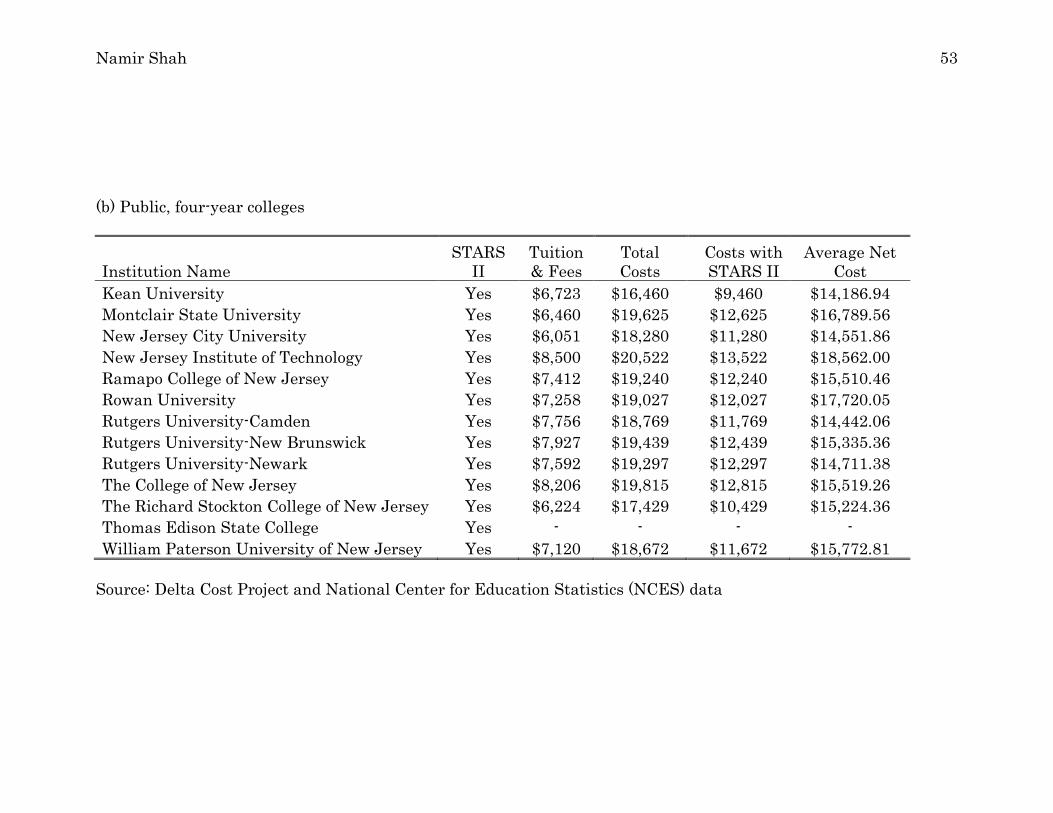
Namir Shah 53
(b) Public, four-year colleges
Institution Name STARS
II Tuition & Fees
Total Costs
Costs with STARS II
Average Net Cost
Kean University Yes $6,723 $16,460 $9,460 $14,186.94
Montclair State University Yes $6,460 $19,625 $12,625 $16,789.56
New Jersey City University Yes $6,051 $18,280 $11,280 $14,551.86
New Jersey Institute of Technology Yes $8,500 $20,522 $13,522 $18,562.00
Ramapo College of New Jersey Yes $7,412 $19,240 $12,240 $15,510.46
Rowan University Yes $7,258 $19,027 $12,027 $17,720.05
Rutgers University-Camden Yes $7,756 $18,769 $11,769 $14,442.06
Rutgers University-New Brunswick Yes $7,927 $19,439 $12,439 $15,335.36
Rutgers University-Newark Yes $7,592 $19,297 $12,297 $14,711.38
The College of New Jersey Yes $8,206 $19,815 $12,815 $15,519.26
The Richard Stockton College of New Jersey Yes $6,224 $17,429 $10,429 $15,224.36
Thomas Edison State College Yes - - - -
William Paterson University of New Jersey Yes $7,120 $18,672 $11,672 $15,772.81
Source: Delta Cost Project and National Center for Education Statistics (NCES) data
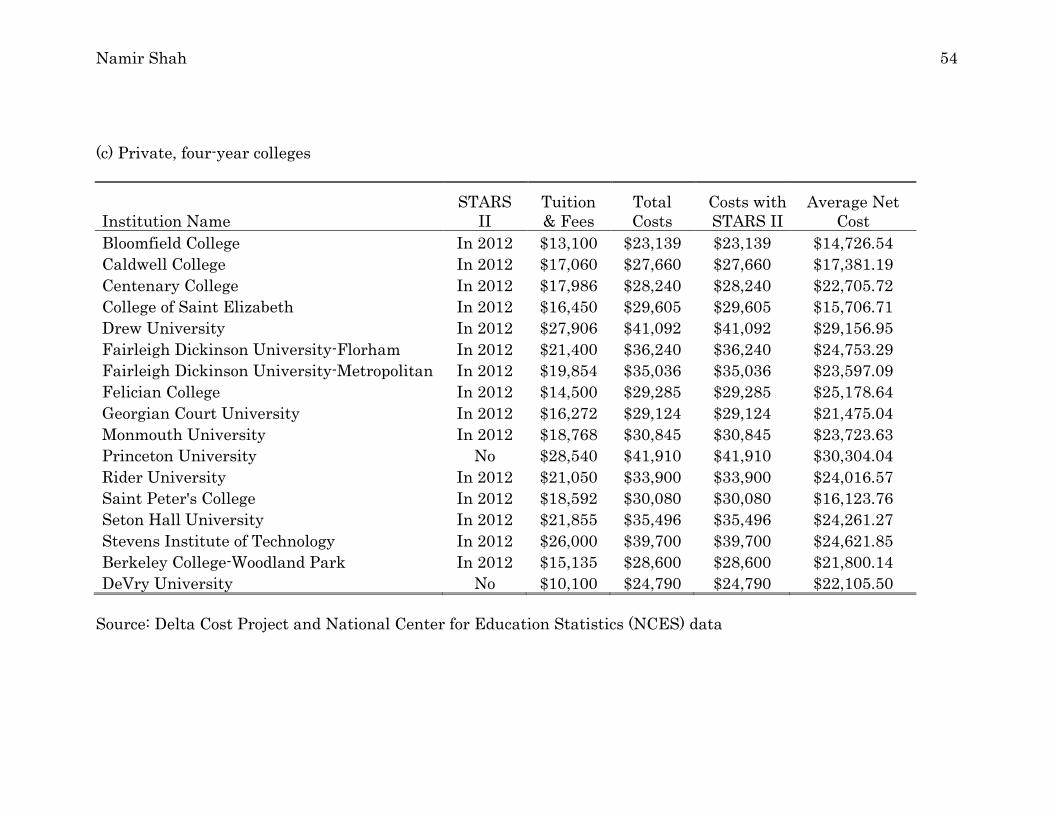
Namir Shah 54
(c) Private, four-year colleges
Institution Name STARS
II Tuition & Fees
Total Costs
Costs with STARS II
Average Net Cost
Bloomfield College In 2012 $13,100 $23,139 $23,139 $14,726.54
Caldwell College In 2012 $17,060 $27,660 $27,660 $17,381.19
Centenary College In 2012 $17,986 $28,240 $28,240 $22,705.72
College of Saint Elizabeth In 2012 $16,450 $29,605 $29,605 $15,706.71
Drew University In 2012 $27,906 $41,092 $41,092 $29,156.95
Fairleigh Dickinson University-Florham In 2012 $21,400 $36,240 $36,240 $24,753.29
Fairleigh Dickinson University-Metropolitan In 2012 $19,854 $35,036 $35,036 $23,597.09
Felician College In 2012 $14,500 $29,285 $29,285 $25,178.64
Georgian Court University In 2012 $16,272 $29,124 $29,124 $21,475.04
Monmouth University In 2012 $18,768 $30,845 $30,845 $23,723.63
Princeton University No $28,540 $41,910 $41,910 $30,304.04
Rider University In 2012 $21,050 $33,900 $33,900 $24,016.57
Saint Peter's College In 2012 $18,592 $30,080 $30,080 $16,123.76
Seton Hall University In 2012 $21,855 $35,496 $35,496 $24,261.27
Stevens Institute of Technology In 2012 $26,000 $39,700 $39,700 $24,621.85
Berkeley College-Woodland Park In 2012 $15,135 $28,600 $28,600 $21,800.14
DeVry University No $10,100 $24,790 $24,790 $22,105.50
Source: Delta Cost Project and National Center for Education Statistics (NCES) data
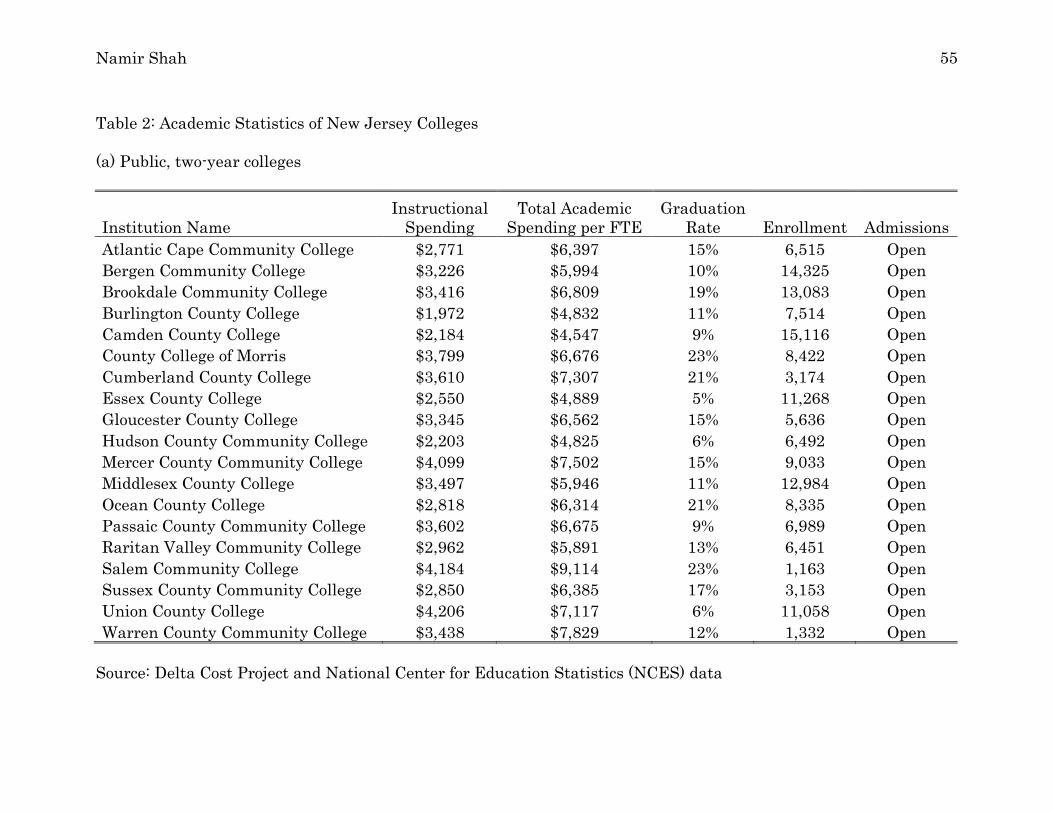
Namir Shah 55
Table 2: Academic Statistics of New Jersey Colleges
(a) Public, two-year colleges
Institution Name Instructional Spending
Total Academic Spending per FTE
Graduation Rate Enrollment Admissions
Atlantic Cape Community College $2,771 $6,397 15% 6,515 Open
Bergen Community College $3,226 $5,994 10% 14,325 Open
Brookdale Community College $3,416 $6,809 19% 13,083 Open
Burlington County College $1,972 $4,832 11% 7,514 Open
Camden County College $2,184 $4,547 9% 15,116 Open
County College of Morris $3,799 $6,676 23% 8,422 Open
Cumberland County College $3,610 $7,307 21% 3,174 Open
Essex County College $2,550 $4,889 5% 11,268 Open
Gloucester County College $3,345 $6,562 15% 5,636 Open
Hudson County Community College $2,203 $4,825 6% 6,492 Open
Mercer County Community College $4,099 $7,502 15% 9,033 Open
Middlesex County College $3,497 $5,946 11% 12,984 Open
Ocean County College $2,818 $6,314 21% 8,335 Open
Passaic County Community College $3,602 $6,675 9% 6,989 Open
Raritan Valley Community College $2,962 $5,891 13% 6,451 Open
Salem Community College $4,184 $9,114 23% 1,163 Open
Sussex County Community College $2,850 $6,385 17% 3,153 Open
Union County College $4,206 $7,117 6% 11,058 Open
Warren County Community College $3,438 $7,829 12% 1,332 Open
Source: Delta Cost Project and National Center for Education Statistics (NCES) data
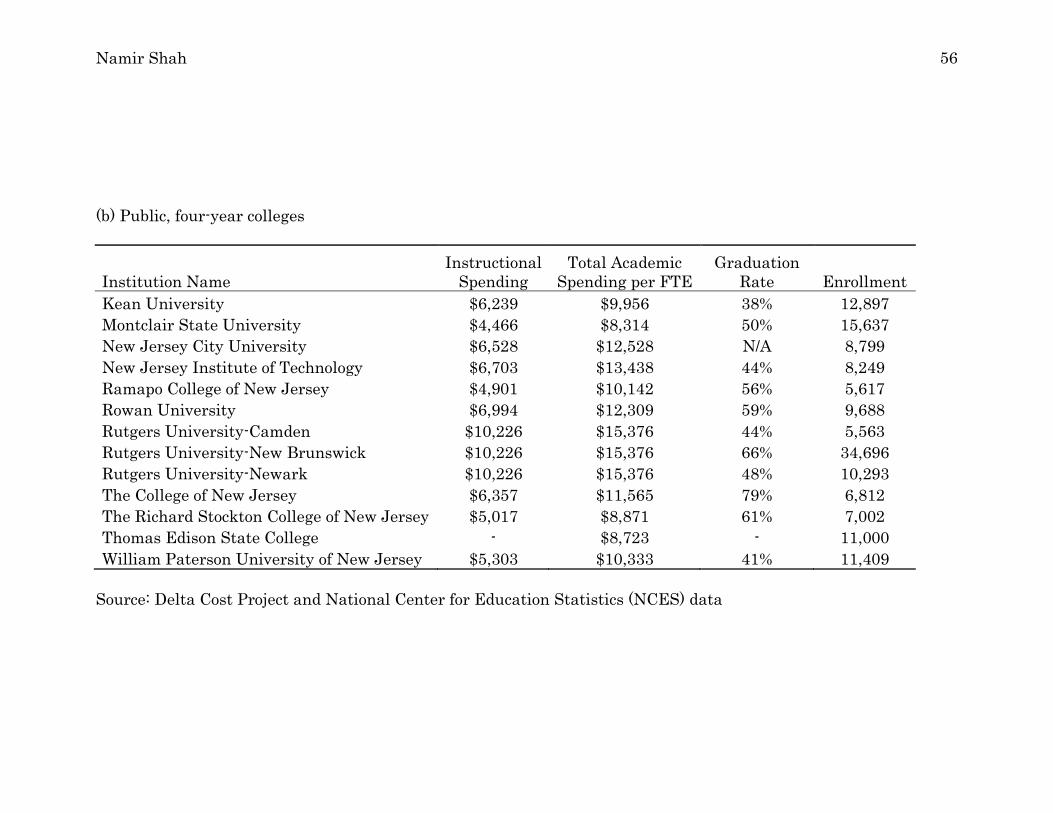
Namir Shah 56
(b) Public, four-year colleges
Institution Name Instructional Spending
Total Academic Spending per FTE
Graduation Rate Enrollment
Kean University $6,239 $9,956 38% 12,897
Montclair State University $4,466 $8,314 50% 15,637
New Jersey City University $6,528 $12,528 N/A 8,799
New Jersey Institute of Technology $6,703 $13,438 44% 8,249
Ramapo College of New Jersey $4,901 $10,142 56% 5,617
Rowan University $6,994 $12,309 59% 9,688
Rutgers University-Camden $10,226 $15,376 44% 5,563
Rutgers University-New Brunswick $10,226 $15,376 66% 34,696
Rutgers University-Newark $10,226 $15,376 48% 10,293
The College of New Jersey $6,357 $11,565 79% 6,812
The Richard Stockton College of New Jersey $5,017 $8,871 61% 7,002
Thomas Edison State College - $8,723 - 11,000
William Paterson University of New Jersey $5,303 $10,333 41% 11,409
Source: Delta Cost Project and National Center for Education Statistics (NCES) data
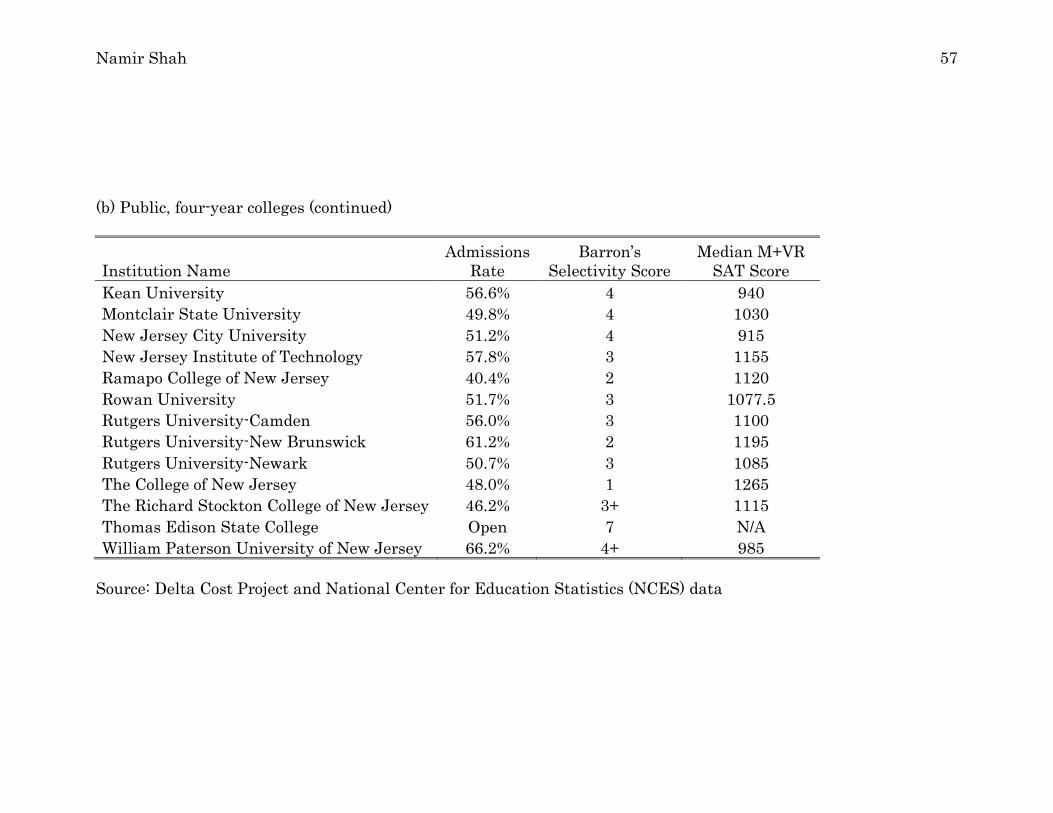
Namir Shah 57
(b) Public, four-year colleges (continued)
Institution Name Admissions
Rate Barron’s
Selectivity Score Median M+VR SAT Score
Kean University 56.6% 4 940
Montclair State University 49.8% 4 1030
New Jersey City University 51.2% 4 915
New Jersey Institute of Technology 57.8% 3 1155
Ramapo College of New Jersey 40.4% 2 1120
Rowan University 51.7% 3 1077.5
Rutgers University-Camden 56.0% 3 1100
Rutgers University-New Brunswick 61.2% 2 1195
Rutgers University-Newark 50.7% 3 1085
The College of New Jersey 48.0% 1 1265
The Richard Stockton College of New Jersey 46.2% 3+ 1115
Thomas Edison State College Open 7 N/A
William Paterson University of New Jersey 66.2% 4+ 985
Source: Delta Cost Project and National Center for Education Statistics (NCES) data
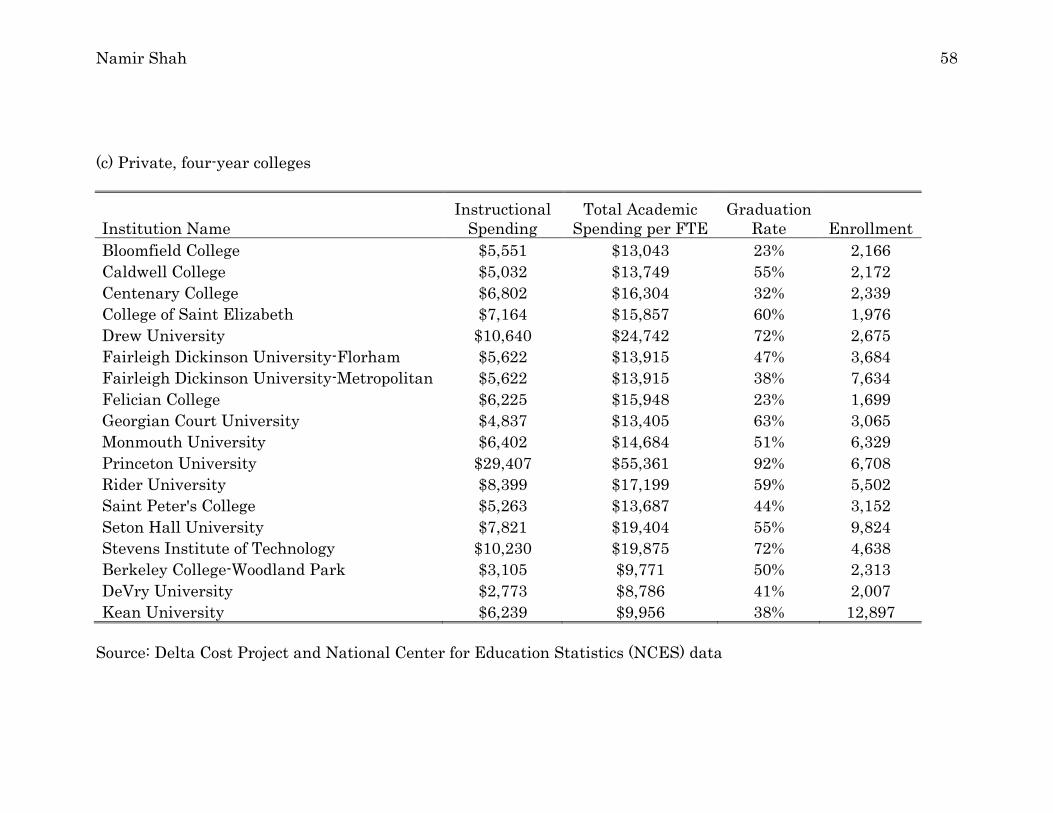
Namir Shah 58
(c) Private, four-year colleges
Institution Name Instructional Spending
Total Academic Spending per FTE
Graduation Rate Enrollment
Bloomfield College $5,551 $13,043 23% 2,166
Caldwell College $5,032 $13,749 55% 2,172
Centenary College $6,802 $16,304 32% 2,339
College of Saint Elizabeth $7,164 $15,857 60% 1,976
Drew University $10,640 $24,742 72% 2,675
Fairleigh Dickinson University-Florham $5,622 $13,915 47% 3,684
Fairleigh Dickinson University-Metropolitan $5,622 $13,915 38% 7,634
Felician College $6,225 $15,948 23% 1,699
Georgian Court University $4,837 $13,405 63% 3,065
Monmouth University $6,402 $14,684 51% 6,329
Princeton University $29,407 $55,361 92% 6,708
Rider University $8,399 $17,199 59% 5,502
Saint Peter's College $5,263 $13,687 44% 3,152
Seton Hall University $7,821 $19,404 55% 9,824
Stevens Institute of Technology $10,230 $19,875 72% 4,638
Berkeley College-Woodland Park $3,105 $9,771 50% 2,313
DeVry University $2,773 $8,786 41% 2,007
Kean University $6,239 $9,956 38% 12,897
Source: Delta Cost Project and National Center for Education Statistics (NCES) data
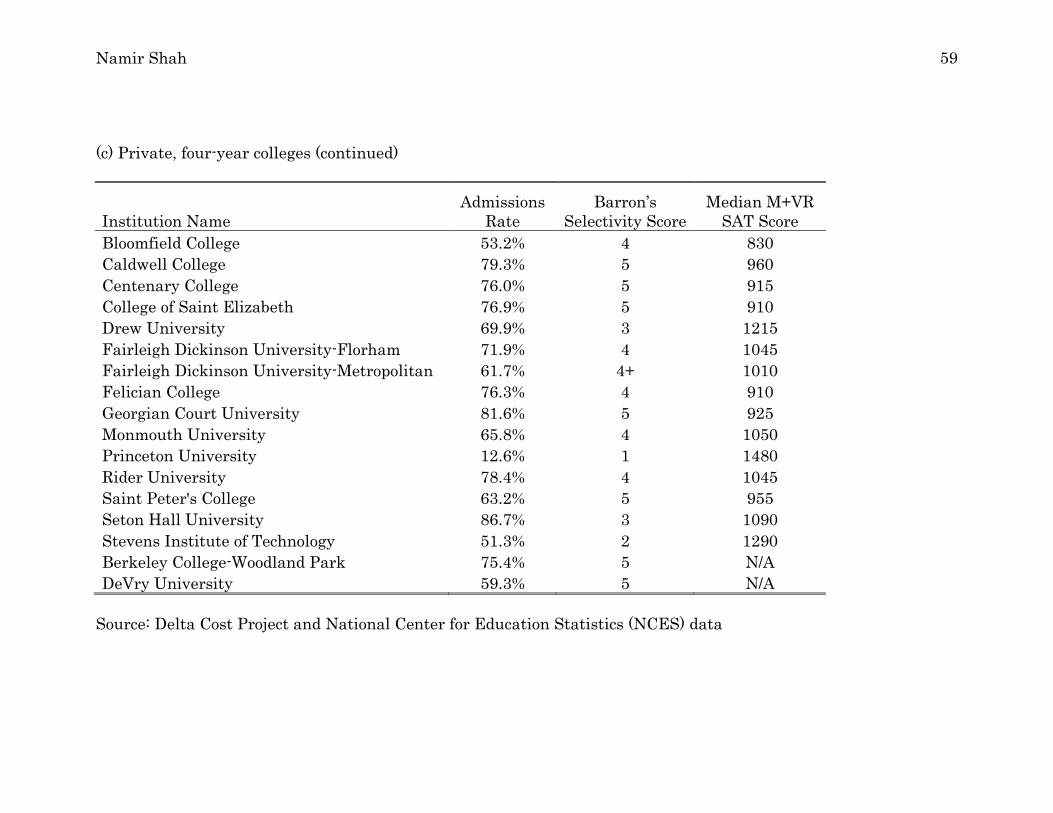
Namir Shah 59
(c) Private, four-year colleges (continued)
Institution Name Admissions
Rate Barron’s
Selectivity Score Median M+VR SAT Score
Bloomfield College 53.2% 4 830
Caldwell College 79.3% 5 960
Centenary College 76.0% 5 915
College of Saint Elizabeth 76.9% 5 910
Drew University 69.9% 3 1215
Fairleigh Dickinson University-Florham 71.9% 4 1045
Fairleigh Dickinson University-Metropolitan 61.7% 4+ 1010
Felician College 76.3% 4 910
Georgian Court University 81.6% 5 925
Monmouth University 65.8% 4 1050
Princeton University 12.6% 1 1480
Rider University 78.4% 4 1045
Saint Peter's College 63.2% 5 955
Seton Hall University 86.7% 3 1090
Stevens Institute of Technology 51.3% 2 1290
Berkeley College-Woodland Park 75.4% 5 N/A
DeVry University 59.3% 5 N/A
Source: Delta Cost Project and National Center for Education Statistics (NCES) data
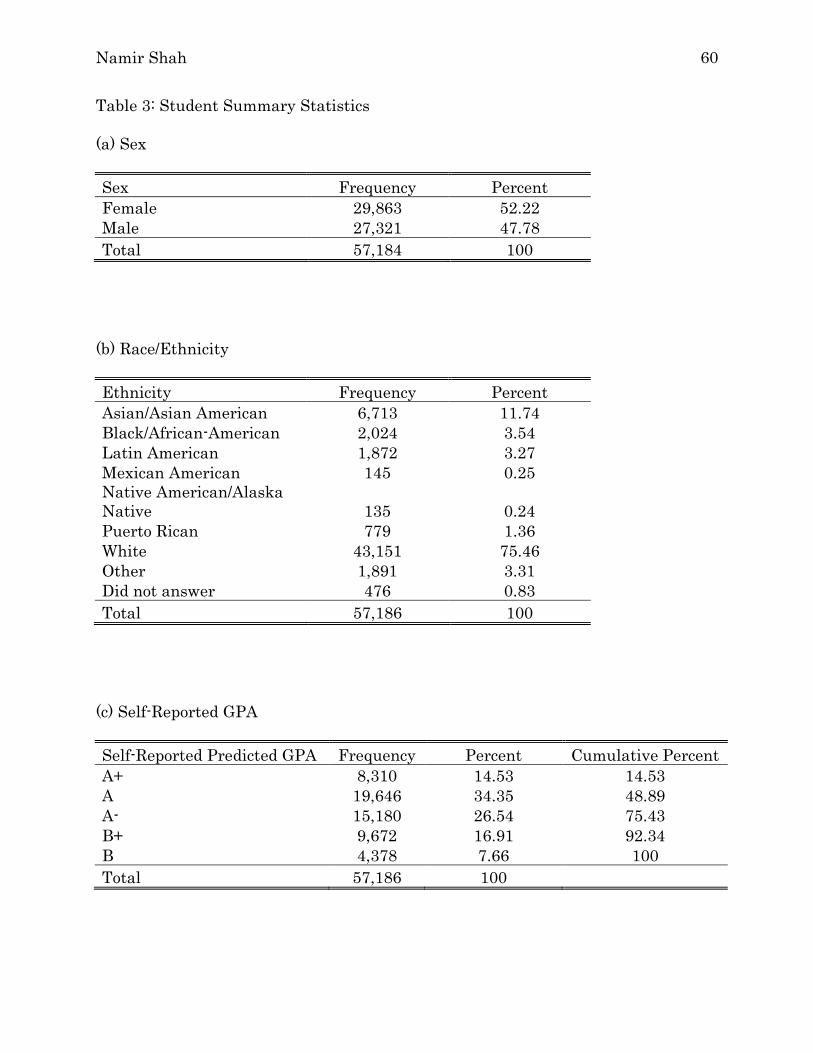
Namir Shah 60
Table 3: Student Summary Statistics
(a) Sex
Sex Frequency Percent Female 29,863 52.22 Male 27,321 47.78
Total 57,184 100
(b) Race/Ethnicity
Ethnicity Frequency Percent Asian/Asian American 6,713 11.74 Black/African-American 2,024 3.54 Latin American 1,872 3.27 Mexican American 145 0.25 Native American/Alaska Native 135 0.24 Puerto Rican 779 1.36 White 43,151 75.46 Other 1,891 3.31 Did not answer 476 0.83
Total 57,186 100
(c) Self-Reported GPA
Self-Reported Predicted GPA Frequency Percent Cumulative Percent A+ 8,310 14.53 14.53 A 19,646 34.35 48.89 A- 15,180 26.54 75.43 B+ 9,672 16.91 92.34 B 4,378 7.66 100
Total 57,186 100
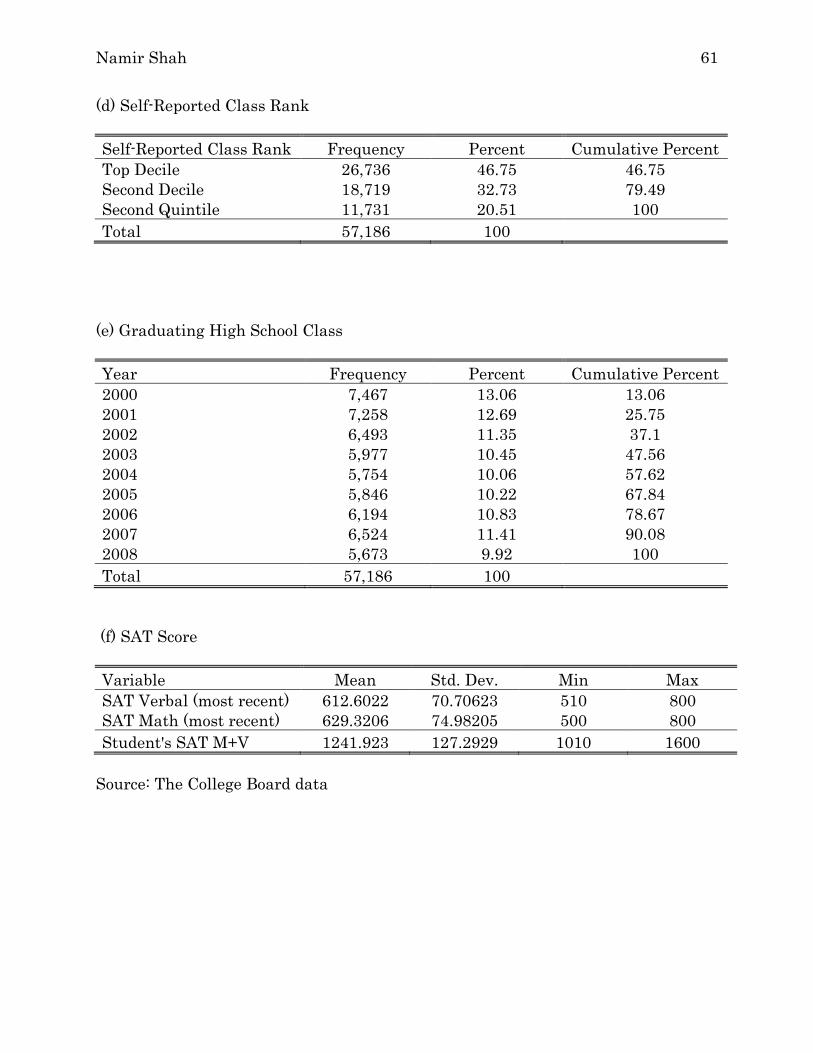
Namir Shah 61
(d) Self-Reported Class Rank
Self-Reported Class Rank Frequency Percent Cumulative Percent Top Decile 26,736 46.75 46.75 Second Decile 18,719 32.73 79.49 Second Quintile 11,731 20.51 100
Total 57,186 100
(e) Graduating High School Class
Year Frequency Percent Cumulative Percent 2000 7,467 13.06 13.06 2001 7,258 12.69 25.75 2002 6,493 11.35 37.1 2003 5,977 10.45 47.56 2004 5,754 10.06 57.62 2005 5,846 10.22 67.84 2006 6,194 10.83 78.67 2007 6,524 11.41 90.08 2008 5,673 9.92 100
Total 57,186 100
(f) SAT Score
Variable Mean Std. Dev. Min Max SAT Verbal (most recent) 612.6022 70.70623 510 800 SAT Math (most recent) 629.3206 74.98205 500 800
Student's SAT M+V 1241.923 127.2929 1010 1600
Source: The College Board data
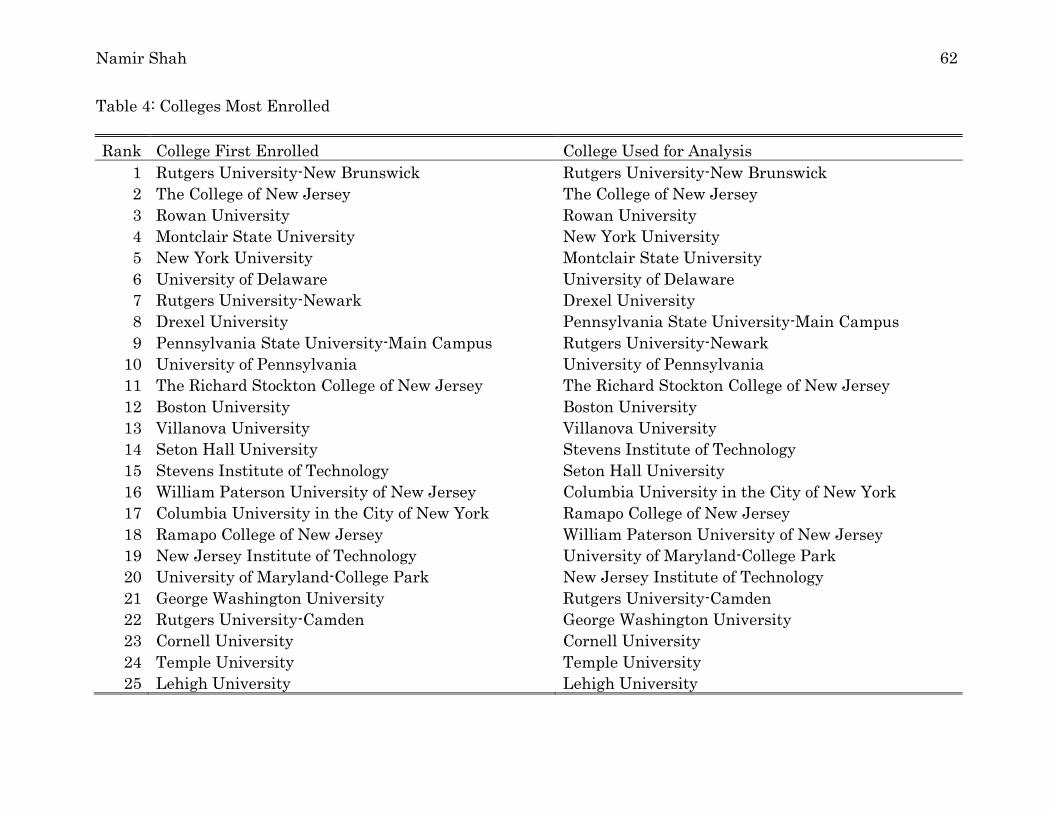
Namir Shah 62
Table 4: Colleges Most Enrolled
Rank College First Enrolled College Used for Analysis
1 Rutgers University-New Brunswick Rutgers University-New Brunswick
2 The College of New Jersey The College of New Jersey
3 Rowan University Rowan University
4 Montclair State University New York University
5 New York University Montclair State University
6 University of Delaware University of Delaware
7 Rutgers University-Newark Drexel University
8 Drexel University Pennsylvania State University-Main Campus
9 Pennsylvania State University-Main Campus Rutgers University-Newark
10 University of Pennsylvania University of Pennsylvania
11 The Richard Stockton College of New Jersey The Richard Stockton College of New Jersey
12 Boston University Boston University
13 Villanova University Villanova University
14 Seton Hall University Stevens Institute of Technology
15 Stevens Institute of Technology Seton Hall University
16 William Paterson University of New Jersey Columbia University in the City of New York
17 Columbia University in the City of New York Ramapo College of New Jersey
18 Ramapo College of New Jersey William Paterson University of New Jersey
19 New Jersey Institute of Technology University of Maryland-College Park
20 University of Maryland-College Park New Jersey Institute of Technology
21 George Washington University Rutgers University-Camden
22 Rutgers University-Camden George Washington University
23 Cornell University Cornell University
24 Temple University Temple University
25 Lehigh University Lehigh University
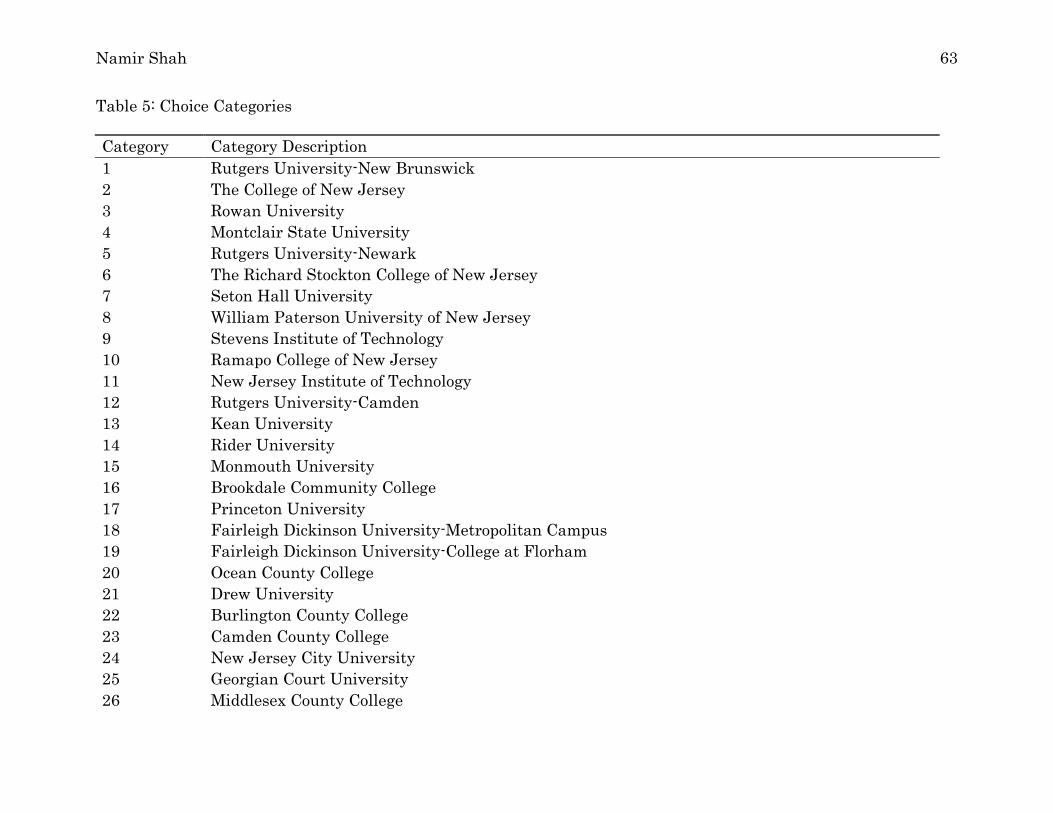
Namir Shah 63
Table 5: Choice Categories
Category Category Description
1 Rutgers University-New Brunswick
2 The College of New Jersey
3 Rowan University
4 Montclair State University
5 Rutgers University-Newark
6 The Richard Stockton College of New Jersey
7 Seton Hall University
8 William Paterson University of New Jersey
9 Stevens Institute of Technology
10 Ramapo College of New Jersey
11 New Jersey Institute of Technology
12 Rutgers University-Camden
13 Kean University
14 Rider University
15 Monmouth University
16 Brookdale Community College
17 Princeton University
18 Fairleigh Dickinson University-Metropolitan Campus
19 Fairleigh Dickinson University-College at Florham
20 Ocean County College
21 Drew University
22 Burlington County College
23 Camden County College
24 New Jersey City University
25 Georgian Court University
26 Middlesex County College
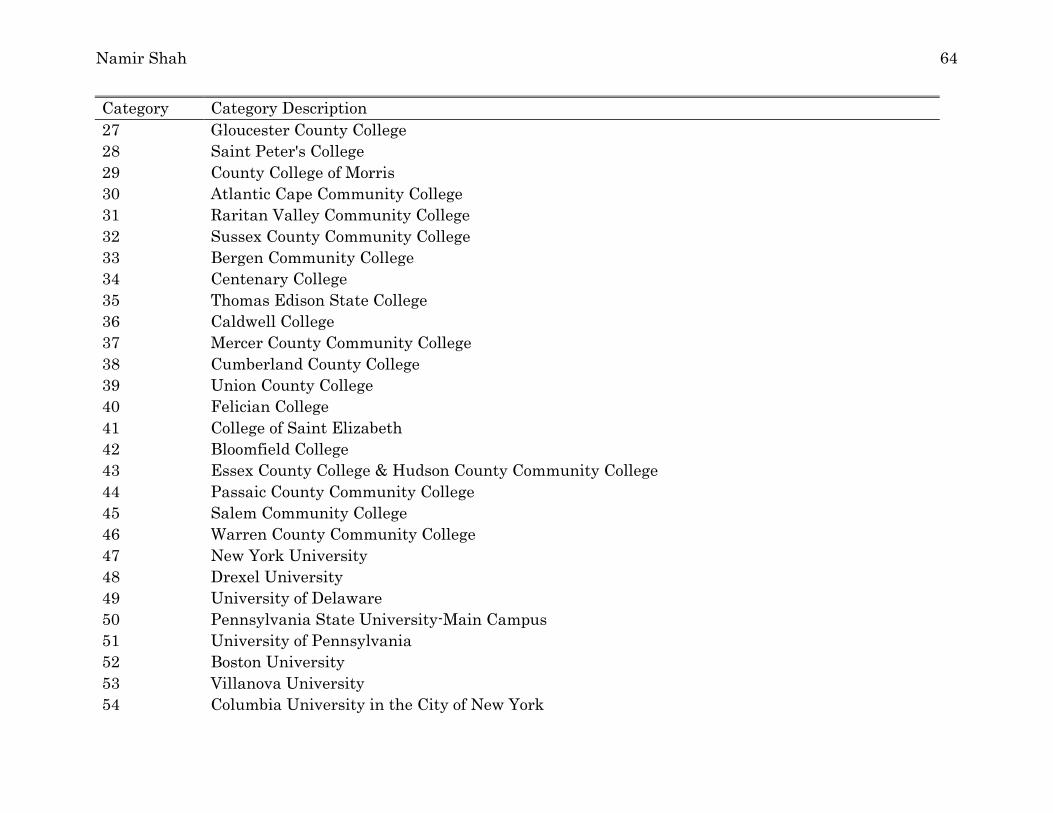
Namir Shah 64
Category Category Description
27 Gloucester County College
28 Saint Peter's College
29 County College of Morris
30 Atlantic Cape Community College
31 Raritan Valley Community College
32 Sussex County Community College
33 Bergen Community College
34 Centenary College
35 Thomas Edison State College
36 Caldwell College
37 Mercer County Community College
38 Cumberland County College
39 Union County College
40 Felician College
41 College of Saint Elizabeth
42 Bloomfield College
43 Essex County College & Hudson County Community College
44 Passaic County Community College
45 Salem Community College
46 Warren County Community College
47 New York University
48 Drexel University
49 University of Delaware
50 Pennsylvania State University-Main Campus
51 University of Pennsylvania
52 Boston University
53 Villanova University
54 Columbia University in the City of New York
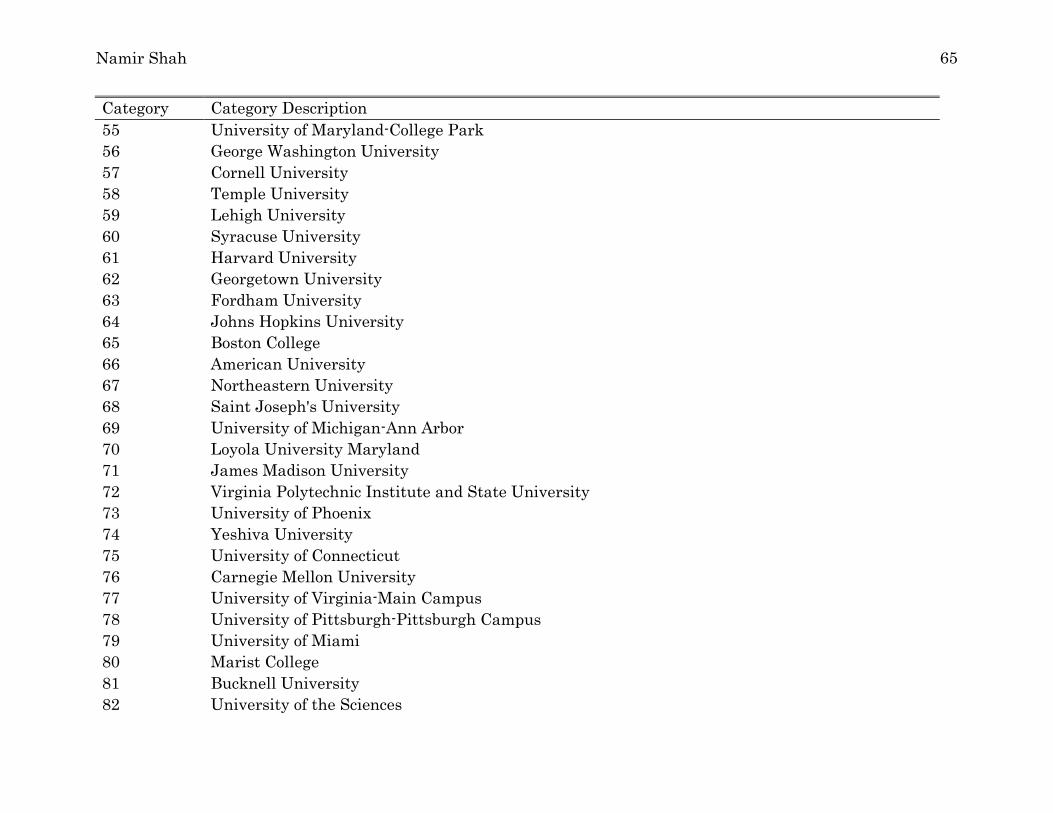
Namir Shah 65
Category Category Description
55 University of Maryland-College Park
56 George Washington University
57 Cornell University
58 Temple University
59 Lehigh University
60 Syracuse University
61 Harvard University
62 Georgetown University
63 Fordham University
64 Johns Hopkins University
65 Boston College
66 American University
67 Northeastern University
68 Saint Joseph's University
69 University of Michigan-Ann Arbor
70 Loyola University Maryland
71 James Madison University
72 Virginia Polytechnic Institute and State University
73 University of Phoenix
74 Yeshiva University
75 University of Connecticut
76 Carnegie Mellon University
77 University of Virginia-Main Campus
78 University of Pittsburgh-Pittsburgh Campus
79 University of Miami
80 Marist College
81 Bucknell University
82 University of the Sciences
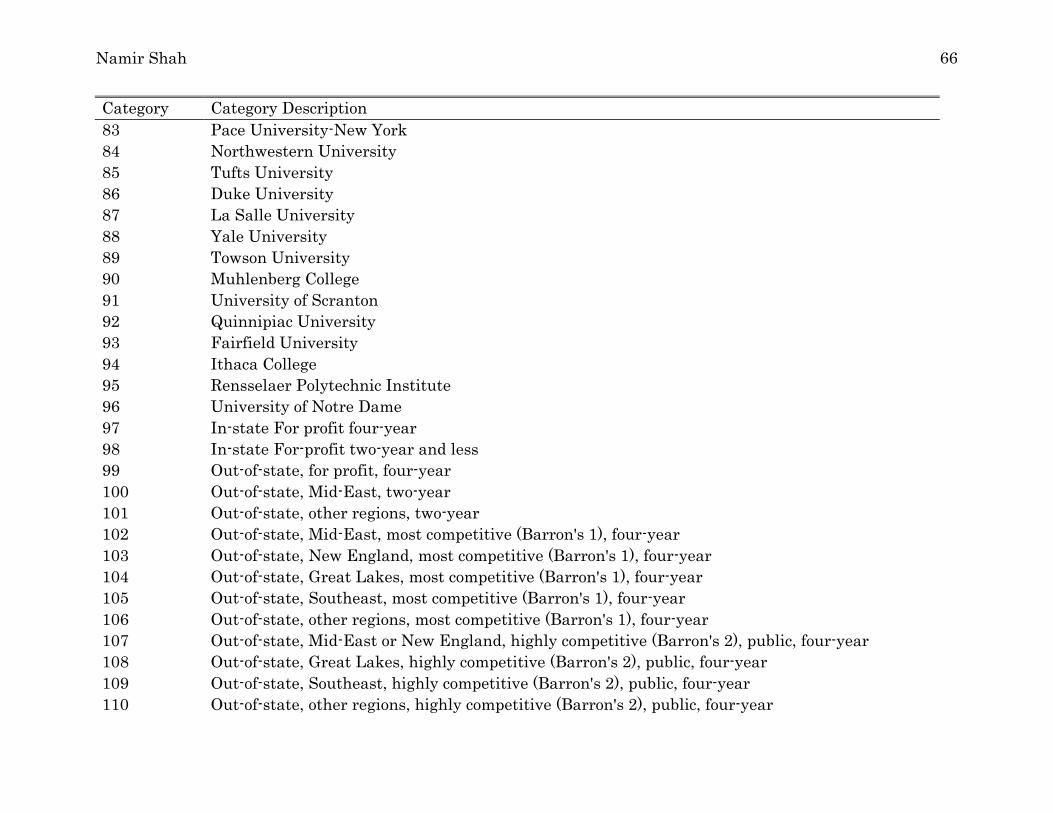
Namir Shah 66
Category Category Description
83 Pace University-New York
84 Northwestern University
85 Tufts University
86 Duke University
87 La Salle University
88 Yale University
89 Towson University
90 Muhlenberg College
91 University of Scranton
92 Quinnipiac University
93 Fairfield University
94 Ithaca College
95 Rensselaer Polytechnic Institute
96 University of Notre Dame
97 In-state For profit four-year
98 In-state For-profit two-year and less
99 Out-of-state, for profit, four-year
100 Out-of-state, Mid-East, two-year
101 Out-of-state, other regions, two-year
102 Out-of-state, Mid-East, most competitive (Barron's 1), four-year
103 Out-of-state, New England, most competitive (Barron's 1), four-year
104 Out-of-state, Great Lakes, most competitive (Barron's 1), four-year
105 Out-of-state, Southeast, most competitive (Barron's 1), four-year
106 Out-of-state, other regions, most competitive (Barron's 1), four-year
107 Out-of-state, Mid-East or New England, highly competitive (Barron's 2), public, four-year
108 Out-of-state, Great Lakes, highly competitive (Barron's 2), public, four-year
109 Out-of-state, Southeast, highly competitive (Barron's 2), public, four-year
110 Out-of-state, other regions, highly competitive (Barron's 2), public, four-year
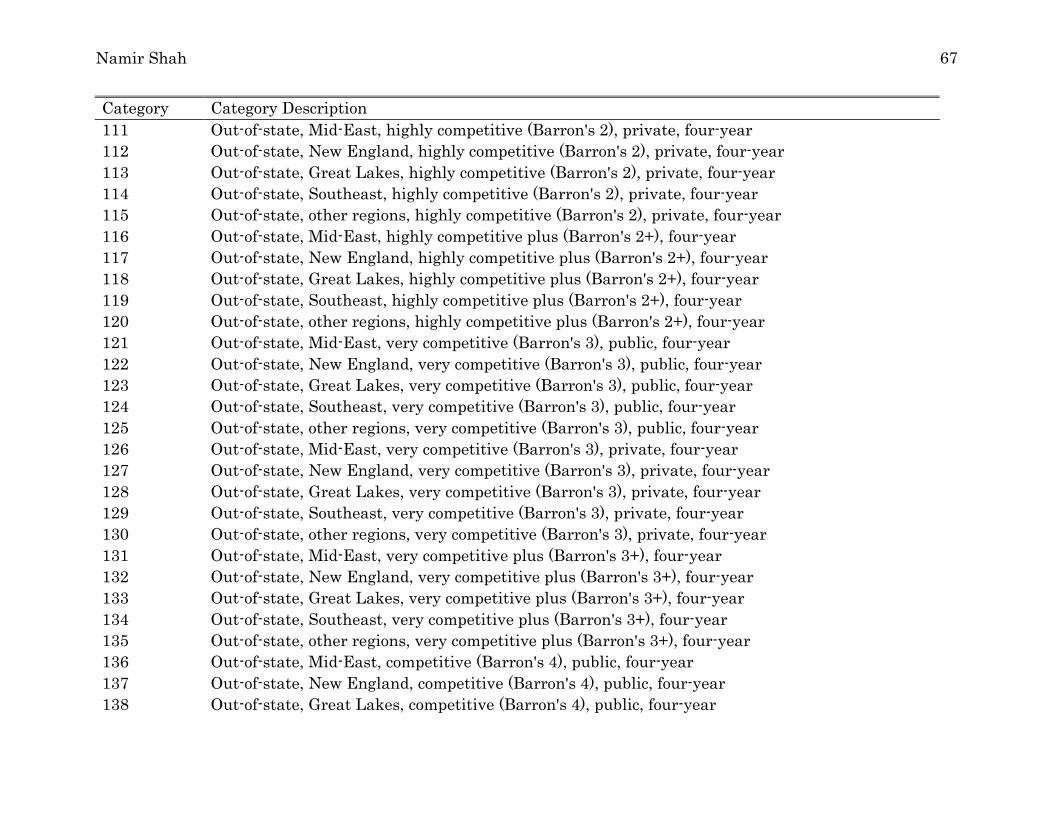
Namir Shah 67
Category Category Description
111 Out-of-state, Mid-East, highly competitive (Barron's 2), private, four-year
112 Out-of-state, New England, highly competitive (Barron's 2), private, four-year
113 Out-of-state, Great Lakes, highly competitive (Barron's 2), private, four-year
114 Out-of-state, Southeast, highly competitive (Barron's 2), private, four-year
115 Out-of-state, other regions, highly competitive (Barron's 2), private, four-year
116 Out-of-state, Mid-East, highly competitive plus (Barron's 2+), four-year
117 Out-of-state, New England, highly competitive plus (Barron's 2+), four-year
118 Out-of-state, Great Lakes, highly competitive plus (Barron's 2+), four-year
119 Out-of-state, Southeast, highly competitive plus (Barron's 2+), four-year
120 Out-of-state, other regions, highly competitive plus (Barron's 2+), four-year
121 Out-of-state, Mid-East, very competitive (Barron's 3), public, four-year
122 Out-of-state, New England, very competitive (Barron's 3), public, four-year
123 Out-of-state, Great Lakes, very competitive (Barron's 3), public, four-year
124 Out-of-state, Southeast, very competitive (Barron's 3), public, four-year
125 Out-of-state, other regions, very competitive (Barron's 3), public, four-year
126 Out-of-state, Mid-East, very competitive (Barron's 3), private, four-year
127 Out-of-state, New England, very competitive (Barron's 3), private, four-year
128 Out-of-state, Great Lakes, very competitive (Barron's 3), private, four-year
129 Out-of-state, Southeast, very competitive (Barron's 3), private, four-year
130 Out-of-state, other regions, very competitive (Barron's 3), private, four-year
131 Out-of-state, Mid-East, very competitive plus (Barron's 3+), four-year
132 Out-of-state, New England, very competitive plus (Barron's 3+), four-year
133 Out-of-state, Great Lakes, very competitive plus (Barron's 3+), four-year
134 Out-of-state, Southeast, very competitive plus (Barron's 3+), four-year
135 Out-of-state, other regions, very competitive plus (Barron's 3+), four-year
136 Out-of-state, Mid-East, competitive (Barron's 4), public, four-year
137 Out-of-state, New England, competitive (Barron's 4), public, four-year
138 Out-of-state, Great Lakes, competitive (Barron's 4), public, four-year
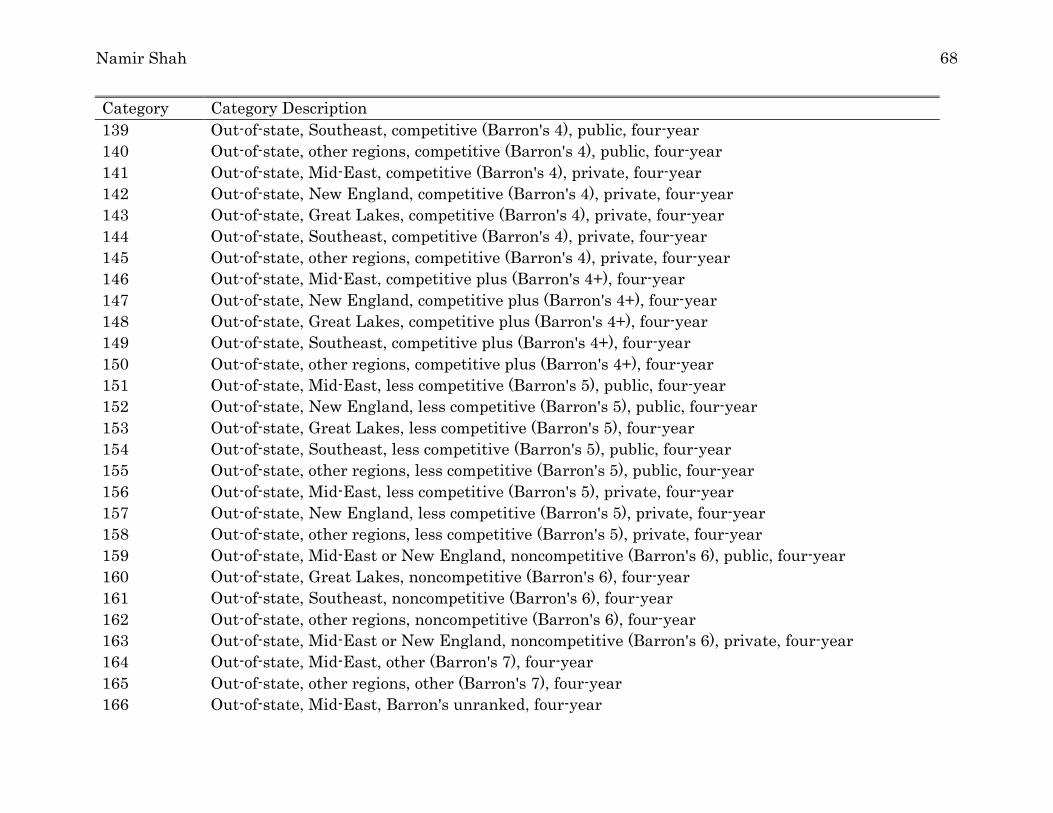
Namir Shah 68
Category Category Description
139 Out-of-state, Southeast, competitive (Barron's 4), public, four-year
140 Out-of-state, other regions, competitive (Barron's 4), public, four-year
141 Out-of-state, Mid-East, competitive (Barron's 4), private, four-year
142 Out-of-state, New England, competitive (Barron's 4), private, four-year
143 Out-of-state, Great Lakes, competitive (Barron's 4), private, four-year
144 Out-of-state, Southeast, competitive (Barron's 4), private, four-year
145 Out-of-state, other regions, competitive (Barron's 4), private, four-year
146 Out-of-state, Mid-East, competitive plus (Barron's 4+), four-year
147 Out-of-state, New England, competitive plus (Barron's 4+), four-year
148 Out-of-state, Great Lakes, competitive plus (Barron's 4+), four-year
149 Out-of-state, Southeast, competitive plus (Barron's 4+), four-year
150 Out-of-state, other regions, competitive plus (Barron's 4+), four-year
151 Out-of-state, Mid-East, less competitive (Barron's 5), public, four-year
152 Out-of-state, New England, less competitive (Barron's 5), public, four-year
153 Out-of-state, Great Lakes, less competitive (Barron's 5), four-year
154 Out-of-state, Southeast, less competitive (Barron's 5), public, four-year
155 Out-of-state, other regions, less competitive (Barron's 5), public, four-year
156 Out-of-state, Mid-East, less competitive (Barron's 5), private, four-year
157 Out-of-state, New England, less competitive (Barron's 5), private, four-year
158 Out-of-state, other regions, less competitive (Barron's 5), private, four-year
159 Out-of-state, Mid-East or New England, noncompetitive (Barron's 6), public, four-year
160 Out-of-state, Great Lakes, noncompetitive (Barron's 6), four-year
161 Out-of-state, Southeast, noncompetitive (Barron's 6), four-year
162 Out-of-state, other regions, noncompetitive (Barron's 6), four-year
163 Out-of-state, Mid-East or New England, noncompetitive (Barron's 6), private, four-year
164 Out-of-state, Mid-East, other (Barron's 7), four-year
165 Out-of-state, other regions, other (Barron's 7), four-year
166 Out-of-state, Mid-East, Barron's unranked, four-year
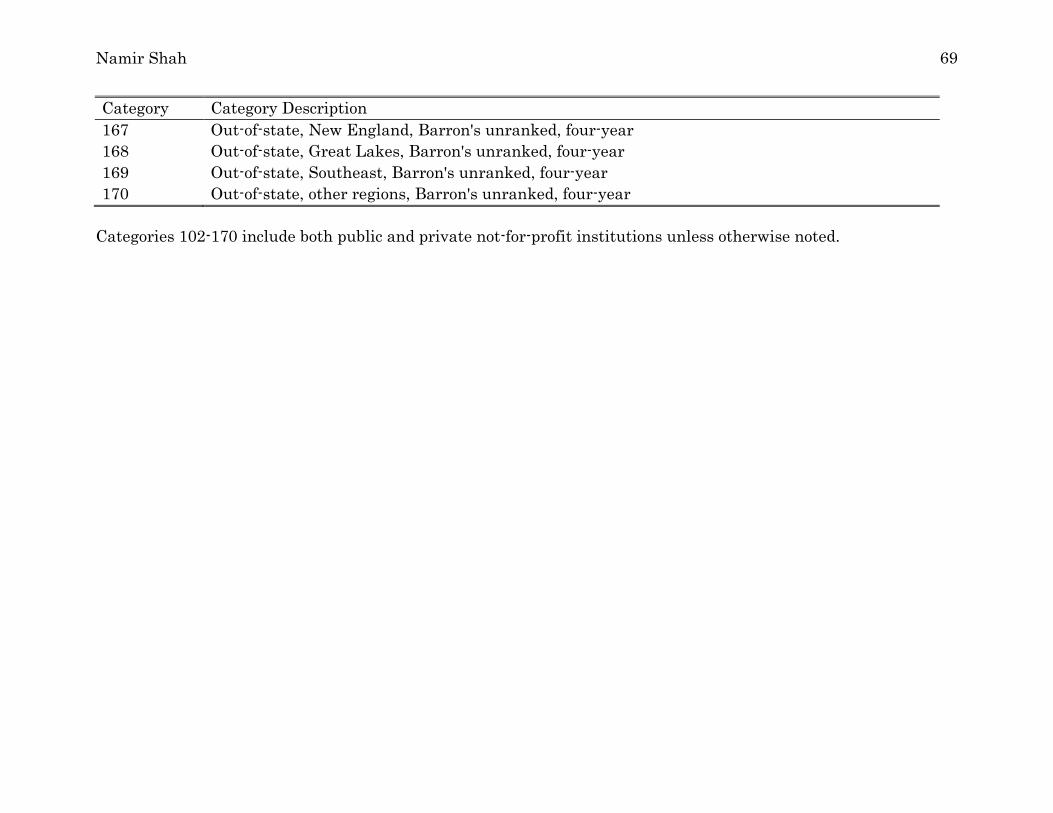
Namir Shah 69
Category Category Description
167 Out-of-state, New England, Barron's unranked, four-year
168 Out-of-state, Great Lakes, Barron's unranked, four-year
169 Out-of-state, Southeast, Barron's unranked, four-year
170 Out-of-state, other regions, Barron's unranked, four-year
Categories 102-170 include both public and private not-for-profit institutions unless otherwise noted.
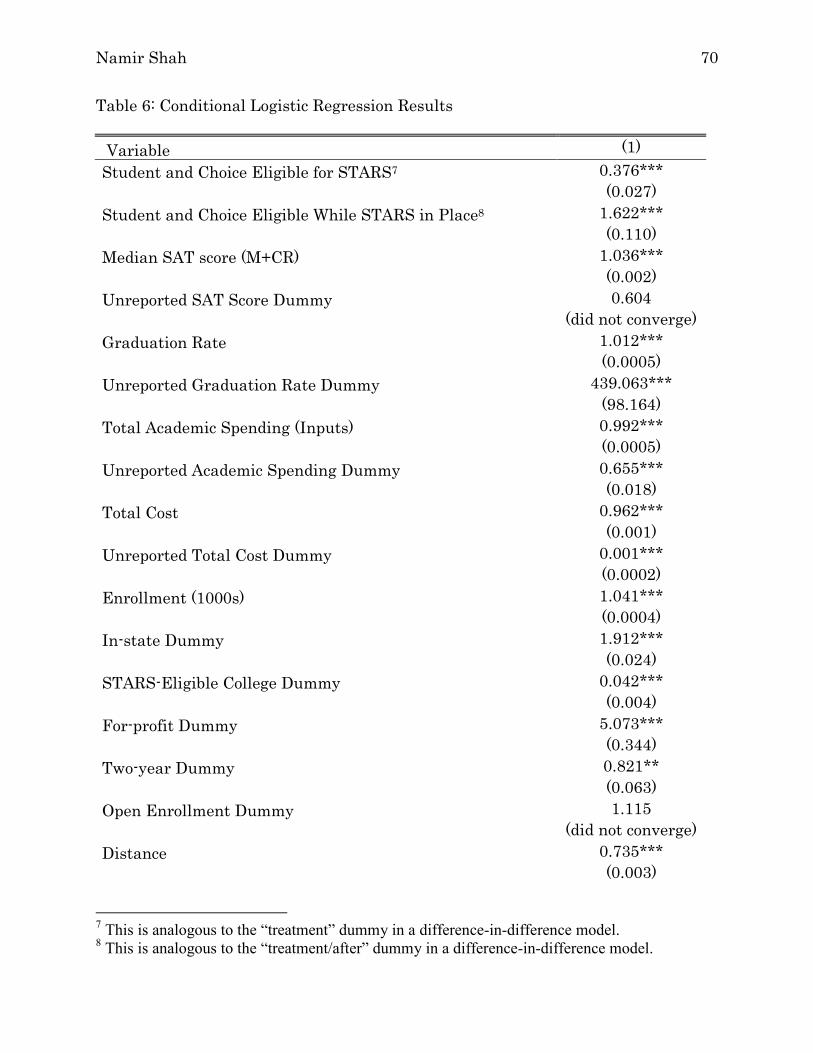
Namir Shah 70
Table 6: Conditional Logistic Regression Results
Variable (1)
Student and Choice Eligible for STARS7 0.376***
(0.027)
Student and Choice Eligible While STARS in Place8 1.622***
(0.110)
Median SAT score (M+CR) 1.036***
(0.002)
Unreported SAT Score Dummy 0.604
(did not converge)
Graduation Rate 1.012***
(0.0005)
Unreported Graduation Rate Dummy 439.063***
(98.164)
Total Academic Spending (Inputs) 0.992***
(0.0005)
Unreported Academic Spending Dummy 0.655***
(0.018)
Total Cost 0.962***
(0.001)
Unreported Total Cost Dummy 0.001***
(0.0002)
Enrollment (1000s) 1.041***
(0.0004)
In-state Dummy 1.912***
(0.024)
STARS-Eligible College Dummy 0.042***
(0.004)
For-profit Dummy 5.073***
(0.344)
Two-year Dummy 0.821**
(0.063)
Open Enrollment Dummy 1.115
(did not converge)
Distance 0.735***
(0.003)
7 This is analogous to the “treatment” dummy in a difference-in-difference model.
8 This is analogous to the “treatment/after” dummy in a difference-in-difference model.
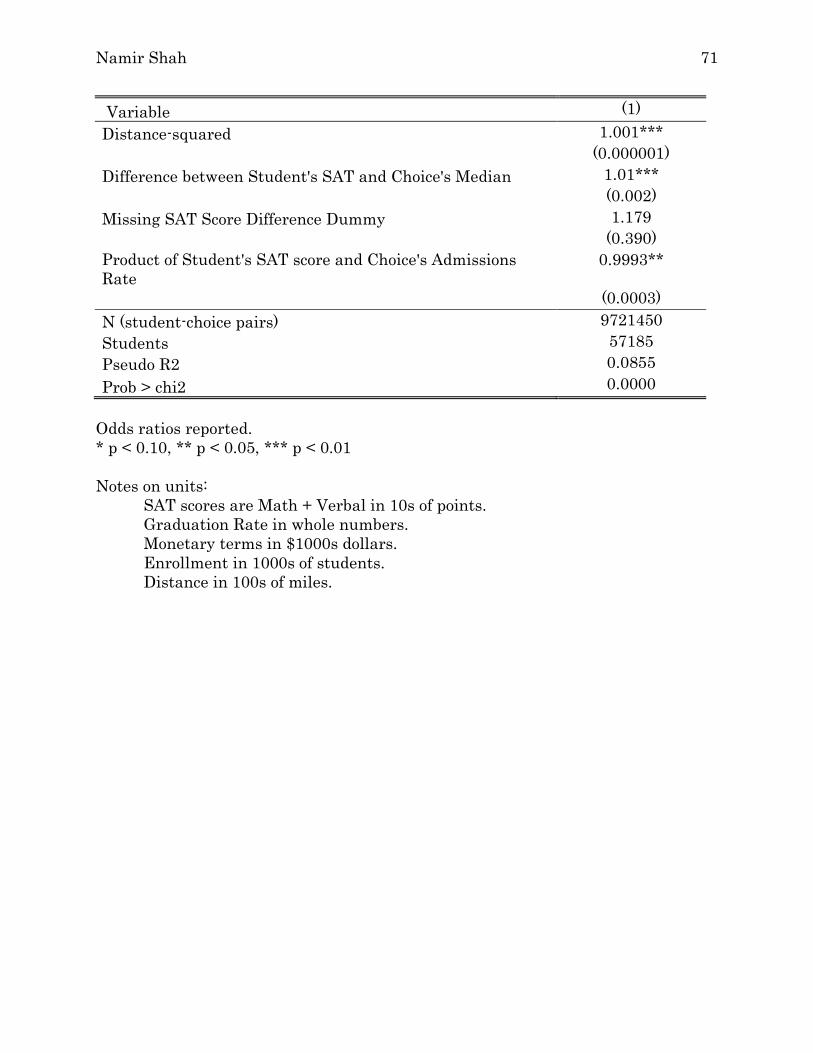
Namir Shah 71
Variable (1)
Distance-squared 1.001***
(0.000001)
Difference between Student's SAT and Choice's Median 1.01***
(0.002)
Missing SAT Score Difference Dummy 1.179
(0.390)
Product of Student's SAT score and Choice's Admissions Rate
0.9993**
(0.0003)
N (student-choice pairs) 9721450
Students 57185
Pseudo R2 0.0855
Prob > chi2 0.0000
Odds ratios reported. * p < 0.10, ** p < 0.05, *** p < 0.01 Notes on units:
SAT scores are Math + Verbal in 10s of points. Graduation Rate in whole numbers. Monetary terms in $1000s dollars. Enrollment in 1000s of students. Distance in 100s of miles.
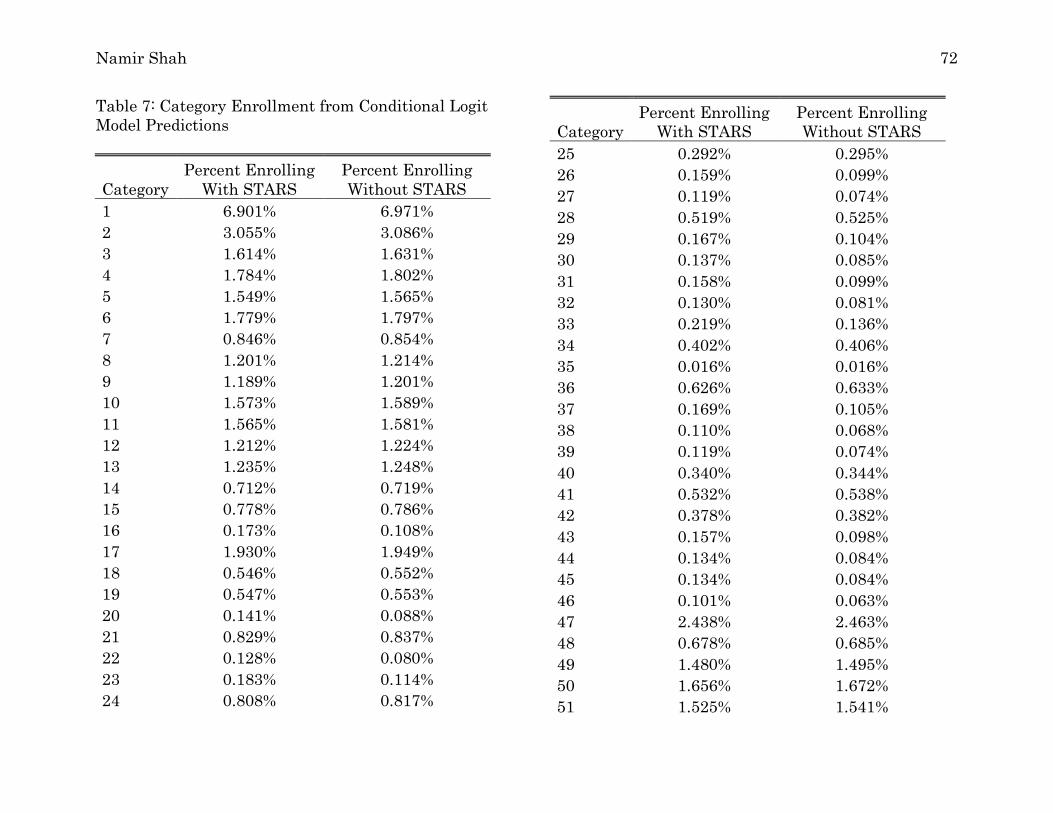
Namir Shah 72
Table 7: Category Enrollment from Conditional Logit Model Predictions
Category Percent Enrolling
With STARS Percent Enrolling Without STARS
1 6.901% 6.971%
2 3.055% 3.086%
3 1.614% 1.631%
4 1.784% 1.802%
5 1.549% 1.565%
6 1.779% 1.797%
7 0.846% 0.854%
8 1.201% 1.214%
9 1.189% 1.201%
10 1.573% 1.589%
11 1.565% 1.581%
12 1.212% 1.224%
13 1.235% 1.248%
14 0.712% 0.719%
15 0.778% 0.786%
16 0.173% 0.108%
17 1.930% 1.949%
18 0.546% 0.552%
19 0.547% 0.553%
20 0.141% 0.088%
21 0.829% 0.837%
22 0.128% 0.080%
23 0.183% 0.114%
24 0.808% 0.817%
Category Percent Enrolling
With STARS Percent Enrolling Without STARS
25 0.292% 0.295%
26 0.159% 0.099%
27 0.119% 0.074%
28 0.519% 0.525%
29 0.167% 0.104%
30 0.137% 0.085%
31 0.158% 0.099%
32 0.130% 0.081%
33 0.219% 0.136%
34 0.402% 0.406%
35 0.016% 0.016%
36 0.626% 0.633%
37 0.169% 0.105%
38 0.110% 0.068%
39 0.119% 0.074%
40 0.340% 0.344%
41 0.532% 0.538%
42 0.378% 0.382%
43 0.157% 0.098%
44 0.134% 0.084%
45 0.134% 0.084%
46 0.101% 0.063%
47 2.438% 2.463%
48 0.678% 0.685%
49 1.480% 1.495%
50 1.656% 1.672%
51 1.525% 1.541%

Namir Shah 73
Category Percent Enrolling
With STARS Percent Enrolling Without STARS
52 0.891% 0.901%
53 0.797% 0.805%
54 1.596% 1.612%
55 1.975% 1.996%
56 0.734% 0.742%
57 1.020% 1.031%
58 1.342% 1.355%
59 0.701% 0.708%
60 0.629% 0.635%
61 0.971% 0.981%
62 0.731% 0.738%
63 0.574% 0.580%
64 0.795% 0.803%
65 0.688% 0.695%
66 0.502% 0.507%
67 0.278% 0.280%
68 0.495% 0.500%
69 1.005% 1.016%
70 0.476% 0.481%
71 0.770% 0.778%
72 0.874% 0.883%
73 0.342% 0.345%
74 0.328% 0.331%
75 0.754% 0.762%
76 0.431% 0.436%
77 1.373% 1.387%
78 0.756% 0.764%
Category Percent Enrolling
With STARS Percent Enrolling Without STARS
79 0.120% 0.121%
80 0.626% 0.632%
81 0.539% 0.544%
82 0.263% 0.265%
83 0.534% 0.539%
84 0.244% 0.246%
85 0.593% 0.600%
86 0.435% 0.440%
87 0.461% 0.466%
88 0.643% 0.650%
89 0.676% 0.682%
90 0.566% 0.572%
91 0.454% 0.458%
92 0.421% 0.425%
93 0.468% 0.473%
94 0.429% 0.433%
95 0.520% 0.525%
96 0.261% 0.263%
97 0.051% 0.052%
98 0.094% 0.095%
99 0.393% 0.397%
100 0.251% 0.254%
101 0.050% 0.051%
102 0.533% 0.538%
103 0.506% 0.511%
104 0.202% 0.204%
105 0.324% 0.327%
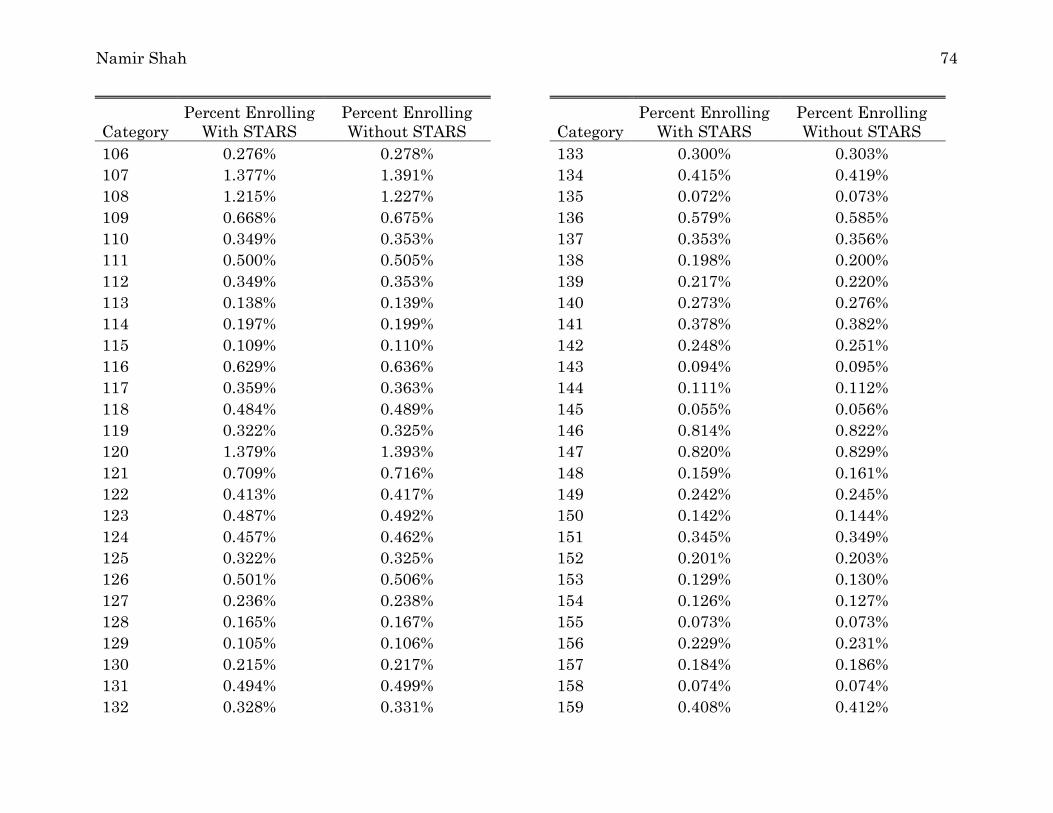
Namir Shah 74
Category Percent Enrolling
With STARS Percent Enrolling Without STARS
106 0.276% 0.278%
107 1.377% 1.391%
108 1.215% 1.227%
109 0.668% 0.675%
110 0.349% 0.353%
111 0.500% 0.505%
112 0.349% 0.353%
113 0.138% 0.139%
114 0.197% 0.199%
115 0.109% 0.110%
116 0.629% 0.636%
117 0.359% 0.363%
118 0.484% 0.489%
119 0.322% 0.325%
120 1.379% 1.393%
121 0.709% 0.716%
122 0.413% 0.417%
123 0.487% 0.492%
124 0.457% 0.462%
125 0.322% 0.325%
126 0.501% 0.506%
127 0.236% 0.238%
128 0.165% 0.167%
129 0.105% 0.106%
130 0.215% 0.217%
131 0.494% 0.499%
132 0.328% 0.331%
Category Percent Enrolling
With STARS Percent Enrolling Without STARS
133 0.300% 0.303%
134 0.415% 0.419%
135 0.072% 0.073%
136 0.579% 0.585%
137 0.353% 0.356%
138 0.198% 0.200%
139 0.217% 0.220%
140 0.273% 0.276%
141 0.378% 0.382%
142 0.248% 0.251%
143 0.094% 0.095%
144 0.111% 0.112%
145 0.055% 0.056%
146 0.814% 0.822%
147 0.820% 0.829%
148 0.159% 0.161%
149 0.242% 0.245%
150 0.142% 0.144%
151 0.345% 0.349%
152 0.201% 0.203%
153 0.129% 0.130%
154 0.126% 0.127%
155 0.073% 0.073%
156 0.229% 0.231%
157 0.184% 0.186%
158 0.074% 0.074%
159 0.408% 0.412%
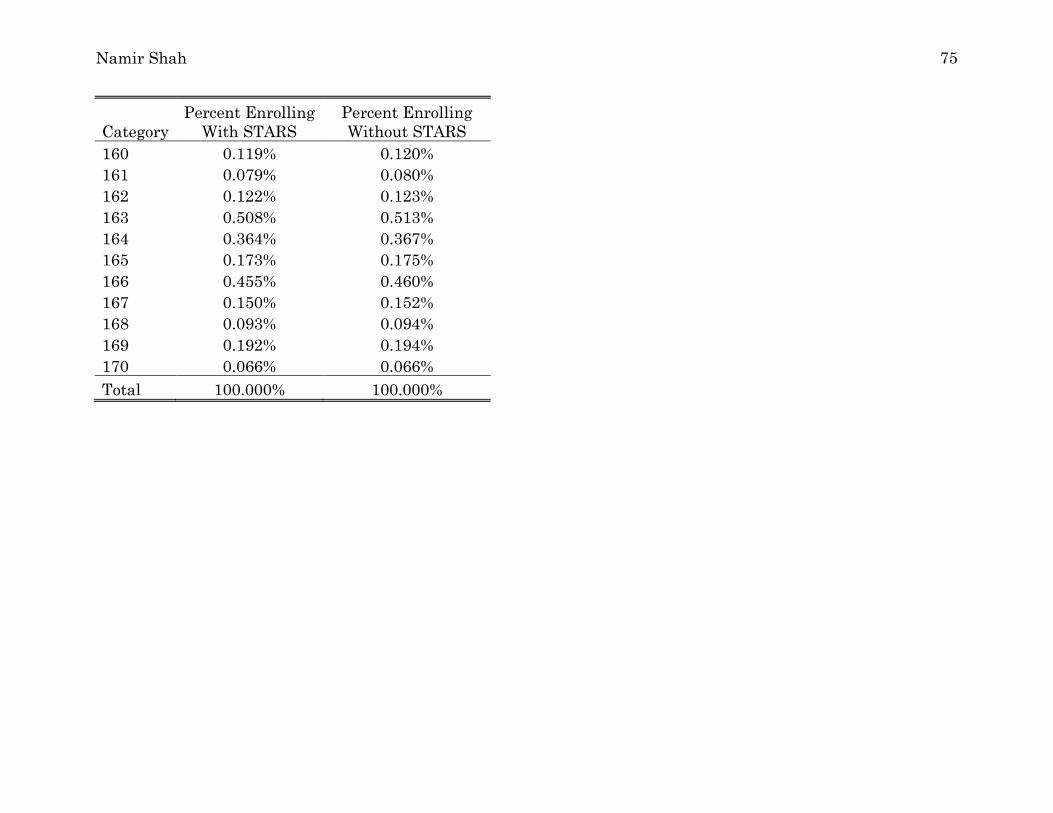
Namir Shah 75
Category Percent Enrolling
With STARS Percent Enrolling Without STARS
160 0.119% 0.120%
161 0.079% 0.080%
162 0.122% 0.123%
163 0.508% 0.513%
164 0.364% 0.367%
165 0.173% 0.175%
166 0.455% 0.460%
167 0.150% 0.152%
168 0.093% 0.094%
169 0.192% 0.194%
170 0.066% 0.066%
Total 100.000% 100.000%
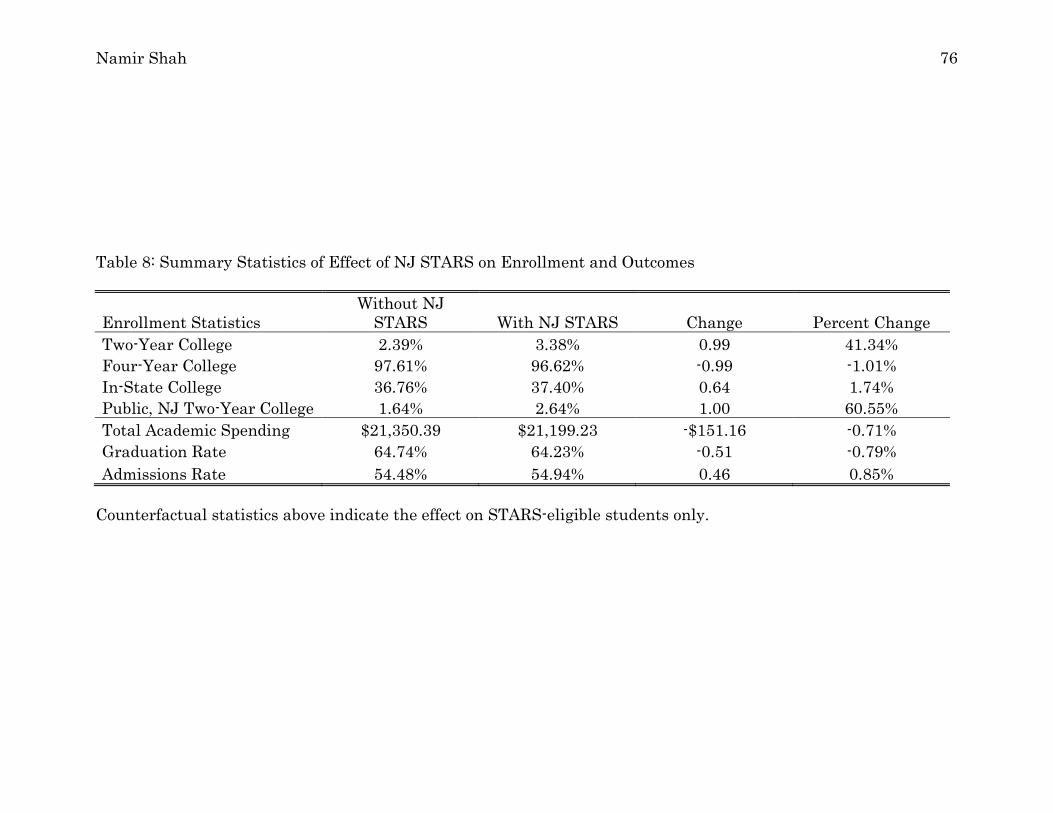
Namir Shah 76
Table 8: Summary Statistics of Effect of NJ STARS on Enrollment and Outcomes
Enrollment Statistics Without NJ STARS With NJ STARS Change Percent Change
Two-Year College 2.39% 3.38% 0.99 41.34%
Four-Year College 97.61% 96.62% -0.99 -1.01%
In-State College 36.76% 37.40% 0.64 1.74%
Public, NJ Two-Year College 1.64% 2.64% 1.00 60.55%
Total Academic Spending $21,350.39 $21,199.23 -$151.16 -0.71%
Graduation Rate 64.74% 64.23% -0.51 -0.79%
Admissions Rate 54.48% 54.94% 0.46 0.85%
Counterfactual statistics above indicate the effect on STARS-eligible students only.