IN SITU STRESS, FRACTURE AND FLUID FLOW ANALYSIS— EAST ...
16
PROCEEDINGS, Twenty-Eighth Workshop on Geothermal Reservoir Engineering Stanford University, Stanford, California, January 27-29, 2003 SGP-TR-173 IN SITU STRESS, FRACTURE AND FLUID FLOW ANALYSIS— EAST FLANK OF THE COSO GEOTHERMAL FIELD Judith Sheridan 2 , Katie Kovac 1 , Peter E. Rose 1 , Colleen Barton 2 , Jess McCulloch 3 , Brian Berard 3 , Joseph M. Moore 1 , Susan Petty 3 , and Paul Spielman 3 , 1 Energy and Geoscience Institute, University of Utah; 2 Geomechanics International, Inc.; 3 Coso Operating Company 250 Cambridge Ave. Suite 103 Palo Alto, CA 94306 USA e-mail: [email protected] ABSTRACT High rock temperatures, a high degree of fracturing, high tectonic stresses, and low permeability are the combination of qualities that define an ideal candidate—Enhanced Geothermal System (EGS) reservoir. The Coso Geothermal Field is an area where fluid temperatures exceeding 300°C have been measured at depths less than 10,000 feet and the reservoir is both highly fractured and tectonically stressed. Some of the wells within this portion of the reservoir are relatively impermeable, particularly on the margins of the field. Geoscientists from the Coso Operating Company, EGI-Utah, and GeoMechanics International Inc. are using well datasets from the east flank of the Coso Geothermal Field to develop an understanding of the relationships between natural fracture distribution, fluid flow, and the ambient tectonic stresses that exist within the resource. Technical results from the first year of analysis are presented. The results discussed here are from the first year of a five year project and include the discrimination of natural from drilling-induced fractures in wellbore image data in the four study wells, natural fracture characterization, wellbore failure characterization, and the correlation of natural fractures and faults with fluid flow indicators. Cuttings collected during the drilling of each of the four east-flank study wells are used to determine the lithologies of the hydrothermally altered zones, the characteristics of the vein fillings, and the extent of large-scale faulting. Future work includes better constraining the geomechanical model for this reservoir. A preliminary stress tensor was used to compute the shear and normal stress resolved on the fracture and fault planes to identify the subset of critically stressed planes that act to maintain permeability within the Coso Geothermal Field. These data will be combined with the results of the log- and fracture-analyses to help elucidate the relationship between local geologic conditions around the wellbore and the east flank geothermal system. INTRODUCTION The east flank of the Coso Geothermal Field is an excellent setting for testing Enhanced Geothermal System (EGS) concepts. Fluid temperatures exceeding 300°C have been measured at depths less than 10,000 feet and the reservoir is both highly fractured and tectonically stressed. However, some of the wells within this portion of the reservoir are relatively impermeable. High rock temperatures, a high degree of fracturing, high tectonic stresses, and low intrinsic permeability are the combination of qualities that define an ideal candidate—EGS reservoir. The long-term goal of this five-year project is to develop and evaluate an approach for the creation of an EGS within the east flank of the Coso Geothermal Reservoir. Key to the creation of an EGS is an understanding of the relationship among natural fracture distribution, fluid flow, and the ambient tectonic stresses that exist within the resource. Establishing those relationships will assist in the subsequent design of a hydraulic and thermal stimulation of an east-flank injection well as the first step in the creation of a heat exchanger at depth. Hydraulic, microseismic, geomechanical, and geochemical measurements will be used to verify this process. Finally, the plan is to drill and, if necessary, stimulate a production well within the east-flank region in order to create the heat-exchanger doublet that will comprise the heart of the EGS. If successful, the protocols developed to create an EGS wherever appropriate tectonic, thermal, and hydraulic conditions exist will allow geothermal operators to greatly extend their developmental reach beyond the relatively few known geothermal resources. Barton et al. (1995, 1998) have shown that optimally oriented, critically stressed fractures control permeability in areas of active tectonics. This
Transcript of IN SITU STRESS, FRACTURE AND FLUID FLOW ANALYSIS— EAST ...
PROCEEDINGS, Twenty-Eighth Workshop on Geothermal Reservoir Engineering Stanford University, Stanford, California, January 27-29, 2003 SGP-TR-173
IN SITU STRESS, FRACTURE AND FLUID FLOW ANALYSIS— EAST FLANK OF THE COSO GEOTHERMAL FIELD
Judith Sheridan2, Katie Kovac1, Peter E. Rose1, Colleen Barton2,
Jess McCulloch3, Brian Berard3, Joseph M. Moore1, Susan Petty3, and Paul Spielman3, 1Energy and Geoscience Institute, University of Utah; 2Geomechanics International, Inc.; 3Coso Operating Company
250 Cambridge Ave. Suite 103 Palo Alto, CA 94306 USA e-mail: [email protected]
ABSTRACT
High rock temperatures, a high degree of fracturing, high tectonic stresses, and low permeability are the combination of qualities that define an ideal candidate—Enhanced Geothermal System (EGS) reservoir. The Coso Geothermal Field is an area where fluid temperatures exceeding 300°C have been measured at depths less than 10,000 feet and the reservoir is both highly fractured and tectonically stressed. Some of the wells within this portion of the reservoir are relatively impermeable, particularly on the margins of the field. Geoscientists from the Coso Operating Company, EGI-Utah, and GeoMechanics International Inc. are using well datasets from the east flank of the Coso Geothermal Field to develop an understanding of the relationships between natural fracture distribution, fluid flow, and the ambient tectonic stresses that exist within the resource. Technical results from the first year of analysis are presented. The results discussed here are from the first year of a five year project and include the discrimination of natural from drilling-induced fractures in wellbore image data in the four study wells, natural fracture characterization, wellbore failure characterization, and the correlation of natural fractures and faults with fluid flow indicators. Cuttings collected during the drilling of each of the four east-flank study wells are used to determine the lithologies of the hydrothermally altered zones, the characteristics of the vein fillings, and the extent of large-scale faulting. Future work includes better constraining the geomechanical model for this reservoir. A preliminary stress tensor was used to compute the shear and normal stress resolved on the fracture and fault planes to identify the subset of critically stressed planes that act to maintain permeability within the Coso Geothermal Field. These data will be combined with the results of the log- and fracture-analyses to
help elucidate the relationship between local geologic conditions around the wellbore and the east flank geothermal system.
INTRODUCTION
The east flank of the Coso Geothermal Field is an excellent setting for testing Enhanced Geothermal System (EGS) concepts. Fluid temperatures exceeding 300°C have been measured at depths less than 10,000 feet and the reservoir is both highly fractured and tectonically stressed. However, some of the wells within this portion of the reservoir are relatively impermeable. High rock temperatures, a high degree of fracturing, high tectonic stresses, and low intrinsic permeability are the combination of qualities that define an ideal candidate—EGS reservoir. The long-term goal of this five-year project is to develop and evaluate an approach for the creation of an EGS within the east flank of the Coso Geothermal Reservoir. Key to the creation of an EGS is an understanding of the relationship among natural fracture distribution, fluid flow, and the ambient tectonic stresses that exist within the resource. Establishing those relationships will assist in the subsequent design of a hydraulic and thermal stimulation of an east-flank injection well as the first step in the creation of a heat exchanger at depth. Hydraulic, microseismic, geomechanical, and geochemical measurements will be used to verify this process. Finally, the plan is to drill and, if necessary, stimulate a production well within the east-flank region in order to create the heat-exchanger doublet that will comprise the heart of the EGS. If successful, the protocols developed to create an EGS wherever appropriate tectonic, thermal, and hydraulic conditions exist will allow geothermal operators to greatly extend their developmental reach beyond the relatively few known geothermal resources. Barton et al. (1995, 1998) have shown that optimally oriented, critically stressed fractures control permeability in areas of active tectonics. This
suggests that critically stressed fracture sets are likely to be responsible for the majority of the geothermal production in the Coso Geothermal Field. Knowledge of the well-constrained local stress tensor is needed to determine the proximity of natural fractures to frictional failure and therefore, to determine their role in reservoir permeability. A detailed analysis is required in order to develop a geomechanical model of the reservoir and to determine which fractures are optimally oriented and critically stressed for shear failure. The geomechanical model includes the pore pressure (Pp), the uniaxial compressive rock strength (C0), and the magnitudes and orientations of the most compressive (S1), intermediate (S2), and least compressive (S3) principal stresses. These are derived from in situ pore pressure measurements, laboratory rock strength tests, wireline log data, minifrac test results, and observations of wellbore failure. Only through fracture and wellbore failure analyses of image data, correlated petrographic analyses, and identifying critically stressed fault orientations and fault orientations in fluid flow intervals can we then understand the effects of subsequent stimulation experiments upon increases in fracture permeability. We adopted a multi-step approach used in previous studies at Coso and elsewhere (Barton et al., 1997a, 1997b, 1998) beginning with the identification of image logs with sufficient data quality to perform the fracture and failure analyses. We measured the orientation and distribution of fractures throughout the logged intervals of the study wells from available electrical Formation Microscanner (FMS) image data. Petrographic and mineralogical studies were conducted to elucidate historical trends of the hydrothermal system and correlate hydrothermal alteration mineralogy and fabric with attributes of electrical image logs. In one well we were able to use high-precision pressure, temperature, and spinner flowmeter (PTS) data and compare the areas of fluid flow with the measured fracture distribution. We developed preliminary constraints on the in situ state of stress based on observations of wellbore failure and available drilling and production data. All fractures were then analyzed for their proximity to frictional failure using two stress state end members. These results will be used to understand and utilize the permeability fabric in ongoing EGS studies in the Coso Geothermal Field.
DATA ASSESSMENT
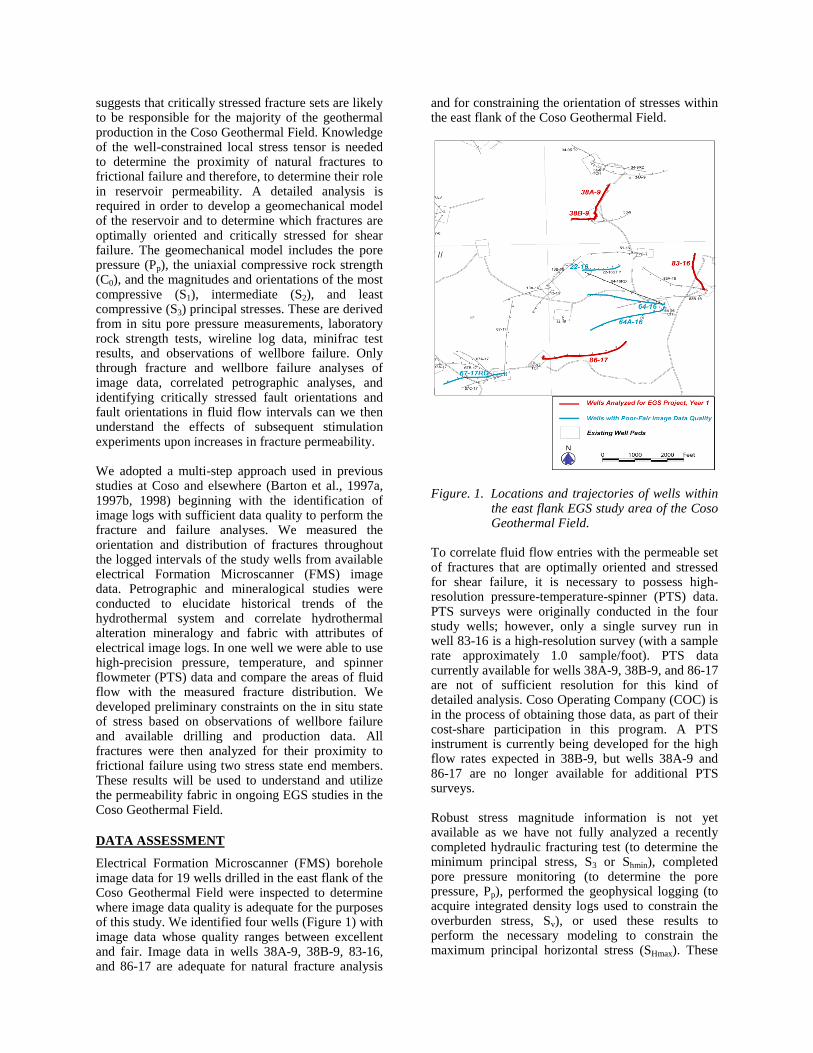
Electrical Formation Microscanner (FMS) borehole image data for 19 wells drilled in the east flank of the Coso Geothermal Field were inspected to determine where image data quality is adequate for the purposes of this study. We identified four wells (Figure 1) with image data whose quality ranges between excellent and fair. Image data in wells 38A-9, 38B-9, 83-16, and 86-17 are adequate for natural fracture analysis
and for constraining the orientation of stresses within the east flank of the Coso Geothermal Field.
Figure. 1. Locations and trajectories of wells within the east flank EGS study area of the Coso Geothermal Field.
To correlate fluid flow entries with the permeable set of fractures that are optimally oriented and stressed for shear failure, it is necessary to possess high-resolution pressure-temperature-spinner (PTS) data. PTS surveys were originally conducted in the four study wells; however, only a single survey run in well 83-16 is a high-resolution survey (with a sample rate approximately 1.0 sample/foot). PTS data currently available for wells 38A-9, 38B-9, and 86-17 are not of sufficient resolution for this kind of detailed analysis. Coso Operating Company (COC) is in the process of obtaining those data, as part of their cost-share participation in this program. A PTS instrument is currently being developed for the high flow rates expected in 38B-9, but wells 38A-9 and 86-17 are no longer available for additional PTS surveys. Robust stress magnitude information is not yet available as we have not fully analyzed a recently completed hydraulic fracturing test (to determine the minimum principal stress, S3 or Shmin), completed pore pressure monitoring (to determine the pore pressure, Pp), performed the geophysical logging (to acquire integrated density logs used to constrain the overburden stress, Sv), or used these results to perform the necessary modeling to constrain the maximum principal horizontal stress (SHmax). These

studies are planned for the future phases of this EGS project.
FRACTURE ANALYSIS
Electrical Formation Microscanner (FMS) data were analyzed for Coso wells 83-16, 38A-9, 38B-9, and 86-17. GMI•Imager™, designed specifically for the analysis of digital wellbore image data, was used to interpret natural and drilling-induced features in the FMS image data for the Coso wells. Planar structural features that intersect the borehole appear as sinusoids on unwrapped 360° views of the image data (Figure 2). Natural fracture orientations were analyzed using image logs for wells 83-16 (3,674 feet), 38A-9 (3,448 feet), 38B-9 (1,604 feet), and 86-17 (233 feet). An extremely dense fracture network was observed and
analyzed in all four study wells. We also identified a subset of fractures with significant apparent aperture in each well and analyzed their orientations. The apparent aperture observed in electrical image logs is based on a high electrical conductivity contrast that can represent either the presence of a highly conductive fluid (e.g., drilling mud), or a highly conductive vein-filling material resulting from hydrothermal alteration. Fractures with significant apparent aperture due to mud infiltration may be acting as fluid flow pathways. The results of the fracture analysis are displayed in depth profiles that include the dip and dip azimuth for all fractures measured in the well, an assessment of the image data quality, and the dip and dip azimuth for fractures with significant apparent aperture.
(a)
(b) (c)
Figure. 2. GMI•Imager™ is used to (a) analyze typical fractures observed in FMS data recorded over the interval
7,054 to 7,057 feet in well 83-16 using the flexible sinusoid tool, and to display examples of (b) good and (c) poor image data.

In well 83-16 (Figure 3) fracture dips at all depths range from intermediate to steep. The upper interval of well 83-16 (2,397–4,053 feet MD) shows a preferred dip azimuth orientation towards the southwest. In the middle interval (4,700–7,100 feet MD), there appears to be a higher concentration of dip azimuths in the southeast direction. In the bottom portion of the well (7,425–8,800 feet MD), the dip azimuths tend towards a bimodal distribution with one set of fractures dipping towards the south and the other set dipping towards the west. Fracture orientations in well 38A-9 (Figure 4) display a dominant northeast to east dip azimuth and a subordinate west to northwest dip azimuth with moderate to steep dips. Fracture orientations in well 38B-9 (Figure 5) display dominant northeast to east dip azimuths with shallow to steep dips. The subordinate northwest-trending dip azimuths observed in 38A-9 are not observed as frequently in 38B-9, particularly below 7,650 feet MD. Fracture
orientations in well 86-17 (Figure 6) display a dominant northwest-trending dip azimuth with a minor northeast-trending dip azimuth. Fracture dips in 86-17 are generally steep to vertical. Well 86-17 is a deviated well, with a deviation ranging between 22° and 26° in the logged interval. As a result, image logs in 86-17 capture vertical fractures that probably exist throughout the rest of the field but that cannot be intersected as easily in the other three study wells that have near vertical wellbores. In all four study wells, the orientations of fractures with significant apparent aperture have steeper dips with much less scatter in dip azimuth than the orientation of all fractures measured. Summary plots show dip (Figure 7) and dip azimuth (Figure 8) versus measured depth (feet TVD) for all four wells.

All Fractures Fractures with Significant Apparent Aperture
(a) (b) (c) (d) (e)
Figure. 3. Well 83-16 fracture (a) dips and (b) dip directions for all observed fractures. (c) Quality assessment of
image data versus depth where white indicates depth ranges for which no data were available. Fracture (d) dips and (e) dip directions for fractures with a significant apparent aperture.
Good data
Fair data
Poor data

All Fractures Fractures with Significant Apparent Aperture
(a) (b) (c) (d) (e)
Figure. 4. Well 38A-9 fracture (a) dips and (b) dip directions for all observed fractures. (c) Quality assessment of
image data versus depth. 38A-9 fracture (d) dips and (e) dip directions for fractures with a significant apparent aperture.
Good data
Fair data
Poor data

All Fractures Fractures with Significant Apparent Aperture
(a) (b) (c) (d) (e)
Figure. 5. Well 38B-9 fracture (a) dips and (b) dip directions for all observed fractures. (c) Quality assessment of
image data versus depth. 38B-9 fracture (d) dips and (e) dip directions for fractures with a significant apparent aperture.
Good data
Fair data
Poor data

All Fractures Fractures with Significant Apparent Aperture
(a) (b) (c) (d) (e)
Figure. 6. Well 86-17 fracture (a) dips and (b) dip directions for all observed fractures. (c) Quality assessment of
image data versus depth where white indicates depth ranges for which no data were available. Well 86-17 fracture (d) dips and (e) dip directions for fractures with a significant apparent aperture.
Good data
Fair data
Poor data
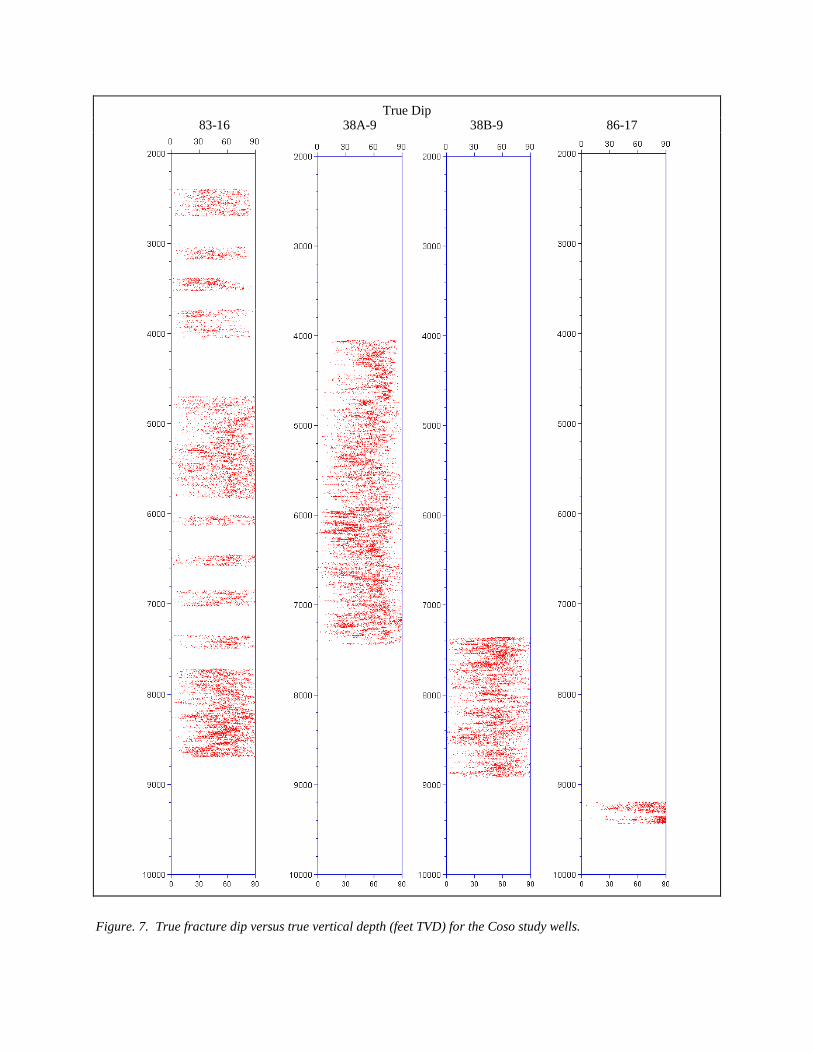
True Dip 83-16 38A-9 38B-9 86-17
Figure. 7. True fracture dip versus true vertical depth (feet TVD) for the Coso study wells.
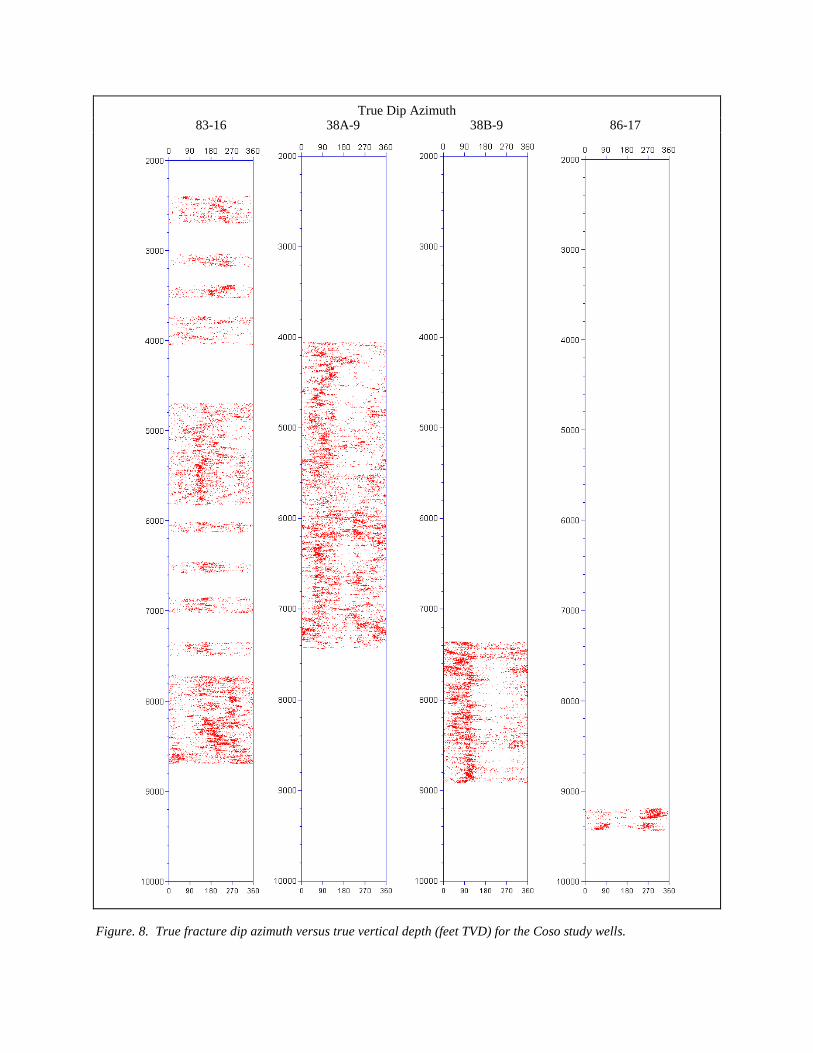
True Dip Azimuth 83-16 38A-9 38B-9 86-17
Figure. 8. True fracture dip azimuth versus true vertical depth (feet TVD) for the Coso study wells.

PETROGRAPHIC AND MINERALOGIC ANALYSES
Petrographic and mineralogical studies have been conducted to 1) construct the overall geologic framework of the East Flank, 2) document and characterize geothermal and older fluid flow, and 3) use rock type, alteration, and veining data to aid in the interpretation of FMS logs. Cuttings from five wells have been analyzed, including the four study wells where FMS image logs are available. Cuttings were analyzed from well 83-16 between the depths of 4,700–5,860 feet, and 7,800–8,800 feet, in well 38A-9 from 4,040–7,350 feet, in well 38B-9 from 5,000–6,000 feet and 7,400–9,000 feet, in well 86-17 from 9,660–9,940 feet, and in well 64-16 between 4,320–4,589 feet, 5,170–5,347 feet, and 8,270–10,300 feet. Studies of cuttings samples provided data including rock type, relative amount of overall alteration, relative amounts and mineralogy of veining, the presence/absence of open-space fillings, and intensity of brecciation. A paragenesis chart has been created through detailed thin section study of well 83-16 (Figure 9) and fluid inclusion studies have been initiated on several wells. For the inclusion studies, samples of calcite, quartz, and epidote were picked from cuttings and studied in detail. The epidote appears to have higher temperature and salinity values than present day. However, many calcite and quartz open space crystals indicated temperatures equal to or lower than the present conditions. Salinities measured in the quartz and calcite are consistent with those of modern geothermal fluids. These data indicate that the epidote veins were created by a previous, higher temperature/salinity event, while the open-space quartz and calcite crystals were formed by recent geothermal activity. The paragenesis chart (Figure 9) shows that the oldest veining present was epidote, pyrite, and sericite. While quartz and chlorite also appear relatively early, their presence persisted over a wide time range. Anhydrite and dolomite were the next minerals to appear, and calcite and hematite are the youngest vein minerals observed.
Figure. 9. Paragenesis chart for five wells in the
eastern flank of the Coso Geothermal Field.
PRESSURE-TEMPERATURE-SPINNER ANALYSIS
High-resolution PTS data are only available for Coso well 83-16. Four separate temperature gradient profiles have been analyzed to identify the depths of flow anomalies in study well 83-16. 70 of 214 temperature gradient anomalies were observed on more than one PTS logging run indicating that these flow horizons are likely to represent steady state flow rather than transient events. There is a partial correspondence between zones of high fracture frequency and the measured flow horizons supporting other studies at Coso that production is fracture controlled. The extremely large number of fractures measured throughout the logged interval and the lack of distinct fracture sets precludes the automatic correlation of natural fractures and flow anomalies in this well. A visual inspection of the image data at the depth of each temperature gradient anomaly was performed to isolate the fracture likely to control fluid flow. We made a comparison of the orientation of fractures in impermeable and permeable intervals to determine if fractures in the vicinity of flow anomalies define a distinct subset of the natural fracture population in the 83-16 well. The fracture data are displayed using stereonet figures showing the orientation of all fractures, and fractures with significant apparent aperture in particular depth intervals. These include rose diagrams showing fracture strike and lower hemisphere stereonets showing poles to the fracture planes (presented in both uncontoured and contoured plots, using the method by Kamb, 1959).
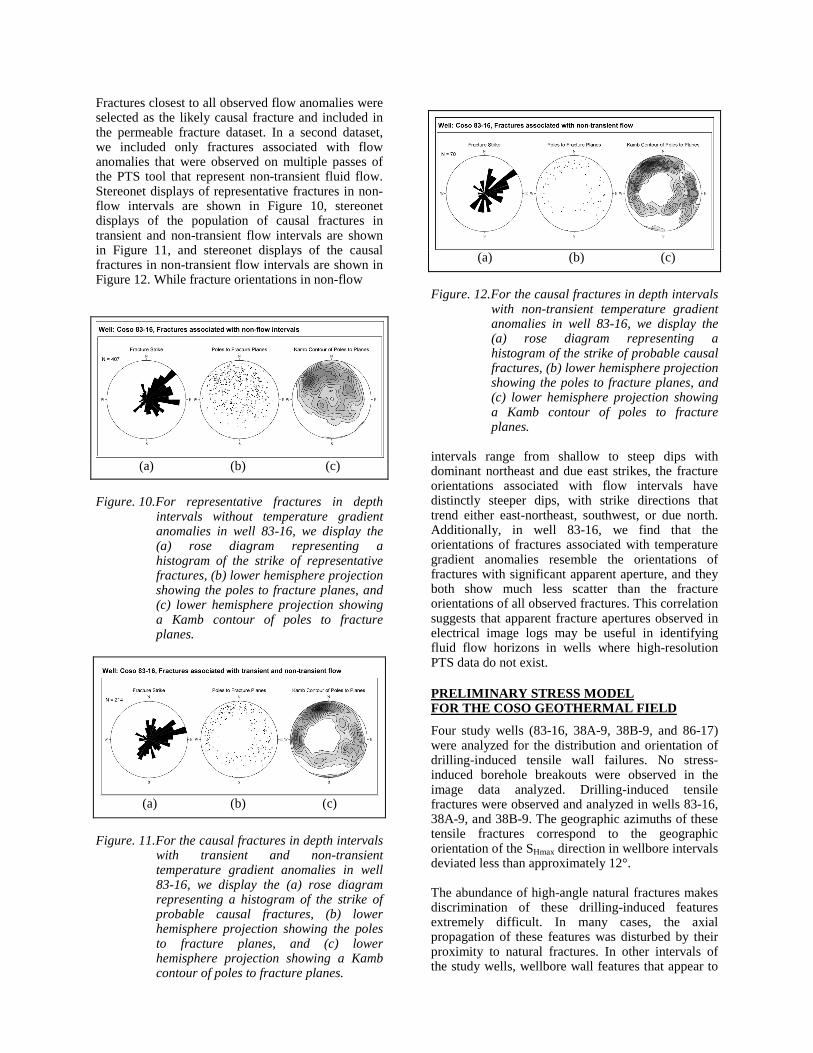
Fractures closest to all observed flow anomalies were selected as the likely causal fracture and included in the permeable fracture dataset. In a second dataset, we included only fractures associated with flow anomalies that were observed on multiple passes of the PTS tool that represent non-transient fluid flow. Stereonet displays of representative fractures in non-flow intervals are shown in Figure 10, stereonet displays of the population of causal fractures in transient and non-transient flow intervals are shown in Figure 11, and stereonet displays of the causal fractures in non-transient flow intervals are shown in Figure 12. While fracture orientations in non-flow
(a) (b) (c)
Figure. 10. For representative fractures in depth
intervals without temperature gradient anomalies in well 83-16, we display the (a) rose diagram representing a histogram of the strike of representative fractures, (b) lower hemisphere projection showing the poles to fracture planes, and (c) lower hemisphere projection showing a Kamb contour of poles to fracture planes.
(a) (b) (c)
Figure. 11. For the causal fractures in depth intervals
with transient and non-transient temperature gradient anomalies in well 83-16, we display the (a) rose diagram representing a histogram of the strike of probable causal fractures, (b) lower hemisphere projection showing the poles to fracture planes, and (c) lower hemisphere projection showing a Kamb contour of poles to fracture planes.
(a) (b) (c)
Figure. 12. For the causal fractures in depth intervals
with non-transient temperature gradient anomalies in well 83-16, we display the (a) rose diagram representing a histogram of the strike of probable causal fractures, (b) lower hemisphere projection showing the poles to fracture planes, and (c) lower hemisphere projection showing a Kamb contour of poles to fracture planes.
intervals range from shallow to steep dips with dominant northeast and due east strikes, the fracture orientations associated with flow intervals have distinctly steeper dips, with strike directions that trend either east-northeast, southwest, or due north. Additionally, in well 83-16, we find that the orientations of fractures associated with temperature gradient anomalies resemble the orientations of fractures with significant apparent aperture, and they both show much less scatter than the fracture orientations of all observed fractures. This correlation suggests that apparent fracture apertures observed in electrical image logs may be useful in identifying fluid flow horizons in wells where high-resolution PTS data do not exist.
PRELIMINARY STRESS MODEL FOR THE COSO GEOTHERMAL FIELD
Four study wells (83-16, 38A-9, 38B-9, and 86-17) were analyzed for the distribution and orientation of drilling-induced tensile wall failures. No stress-induced borehole breakouts were observed in the image data analyzed. Drilling-induced tensile fractures were observed and analyzed in wells 83-16, 38A-9, and 38B-9. The geographic azimuths of these tensile fractures correspond to the geographic orientation of the SHmax direction in wellbore intervals deviated less than approximately 12°. The abundance of high-angle natural fractures makes discrimination of these drilling-induced features extremely difficult. In many cases, the axial propagation of these features was disturbed by their proximity to natural fractures. In other intervals of the study wells, wellbore wall features that appear to

be tensile failure are observed on all four FMS pads. Strict criteria were followed to ensure only non-ambiguous tensile wellbore failure were measured in each well. These measurement criteria require that tensile wall fractures 1) occur in pairs at the same depth, 2) occur in pairs that are approximately 180° apart, and 3) comprise the single set of tensile failure at a given depth. A statistical analysis of the azimuths of tensile wall fractures yields an orientation of SHmax of 50° ±18° in well 83-16, an SHmax orientation of 12° ±15° in well 38A-9, and an SHmax orientation of 65° ±6° in well 38B-9.
Figure. 13. The orientation and relative magnitudes
of the normal faulting and strike-slip faulting stress tensors are displayed for the wells analyzed in this study. The radius of the green circle represents the Sv magnitude for both stress end members, the dark blue bowtie represents the azimuth range and relative magnitude of SHmax for the normal faulting stress end member, the light blue bowtie represents the azimuth range and relative magnitude of SHmax for the strike-slip faulting stress end member, and the red bowtie represents the azimuth range and relative magnitude of Shmin for both stress end members.
Tensile wellbore failures were detected in electrical image data from three of the four wells in this study. Spotty pore pressure information, waterfrac test results, and estimates of the granitic overburden (Sv) provide some constraints on the local stress state for the field. While the least horizontal stress is clearly less than the overburden, we are unable to distinguish between a normal versus strike-slip faulting regime (SHmax ≈ Sv > Shmin). The local earthquake catalog includes both normal (Sv > SHmax > Shmin) and strike-slip (SHmax ≈ >Sv > Shmin) earthquakes. Since neither the absolute nor relative magnitude of the maximum horizontal stress (SHmax) is known, we bracket the normal/strike-slip scenarios by including both these two stress state end members in our preliminary Coulomb failure analyses (Figure 13).
IDENTIFYING CRITICALLY STRESSED FRACTURE ORIENTATIONS USING PRELIMINARY STRESS MODELS
GMI•MohrFracs™ predicts critically stressed fracture orientations using Mohr-Coulomb faulting theory to calculate the shear stress and effective normal stress acting on each fracture plane given the orientations and magnitudes of the three principal stresses and the formation fluid pressure. Barton et al. (1995, 1998) have shown that optimally oriented, critically stressed fractures control permeability in areas of active tectonics. This suggests that critically stressed fracture sets are likely to be responsible for the majority of the geothermal production in the Coso Geothermal Field. Two end-member stress states bracket the likely state of stress at the Coso site. Using a normal faulting (Shmin = SHmax < Sv) and a strike-slip faulting stress state (Sv = SHmax > Shmin), we have determined the proximity of all fractures and faults measured in the electrical image data to Coulomb (i.e., frictional) failure. In well 83-16 the orientation of drilling-induced tensile fractures (and the SHmax azimuth) is N50°E. If this normal stress end member describes the active tectonic environment in this area, then faults striking northeast and dipping approximately 60° towards the southeast, and faults striking southwest and dipping approximately 60° towards the northwest are potentially active and, therefore, may be responsible for geothermal production in the area (Figure 14a). Critically stressed fractures in a strike-slip faulting environment either dip steeply to the southeast with strikes that range from east-northeast to north-northeast, or they dip steeply to the northwest with strikes that range from west-southwest to south-southwest (Figure 14b). Of these two fracture sets measured in the 83-16 wellbore image data, more fractures are observed with a steep southeast dip than with a steep northwest dip.

(a)
(b)
Figure. 14. GMI•MohrFracs analysis results using (a) normal and (b) strike-slip faulting stress tensors applied to all fractures measured in well 83-16. The yellow dot represents the orientation of a fluid producing fracture at 8,406 feet MD in the well.
In well 38A-9 the orientation of drilling-induced tensile fractures is N12°E. As a result, critically stressed faults defined by the normal stress end member strike NNE–SSW and dip approximately 60° either towards the WNW or towards the ESE (Figure 15a). Critically stressed fractures in a strike-slip faulting environment either dip steeply to the east with strikes that range from northeast to northwest, or they dip steeply to the west with strikes that range
(a)
(b)
Figure. 15. GMI•MohrFracs analysis results using (a) normal and (b) strike-slip faulting stress tensors applied to all fractures measured in well 38A-9.
from southwest to southeast (Figure 15b). In well 38A-9 more fractures dip steeply to the east than steeply to the west. In well 38B-9 the orientation of drilling-induced tensile fractures is N65°E. Critically stressed faults defined by the normal stress end member strike northeast to southwest and dip approximately 60° either towards the northwest or towards the southeast (Figure 16a). Critically stressed fractures in a strike-slip faulting environment either dip steeply to the

south-southeast with strikes that range from north-northeast to east-southeast, or they dip steeply to the north-northwest with strikes that range from west-northwest to south-southwest (Figure 16b). In well 38B-9 most fractures dip steeply to the east. Neither drilling-induced tensile fractures nor breakouts were observed in the image data for 86-17; therefore, the SHmax azimuth from the closest well (N50°E in well 83-16) was used in the analysis of critically stressed fractures in this well. Critically
(a)
(b)
Figure. 16. GMI•MohrFracs analysis results using (a) normal and (b) strike-slip faulting stress tensors applied to all fractures measured in well 38B-9.
stressed faults defined by the normal stress end member strike northeast to southwest and dip approximately 60° either towards the northwest or towards the southeast (Figure 17a). Critically stressed fractures in a strike-slip faulting environment either dip steeply to the southeast with strikes that range from north to east, or they dip steeply to the northwest with strikes that range from west to south
(a)
(b)
Figure. 17. GMI•MohrFracs analysis results using (a) normal and (b) strike-slip faulting stress tensors applied to all fractures measured in well 86-17.

(Figure 17b). In well 86-17 most fractures are orthogonal to these potentially critically stressed orientations. This Coulomb analysis using two preliminary end member stress states shows that orientations of steeply dipping critically stressed fractures are quite sensitive to the assumed SHmax value. This result emphasizes the importance of accurately determining the full stress tensor for the East Flank wells of the Coso Geothermal Field.
CONCLUSIONS
The results of these analyses of data available in the first year study of a five-year study are sufficient to provide some guidance for future drilling and completion decisions for the Coso Reservoir. However, selective data acquisition and further work would improve many uncertainties in the results. High-resolution PTS surveys are available in a single well but in conjunction with good quality image data, they are invaluable in identifying the causal fracture orientation in this heavily fractured reservoir. Also, to develop a production strategy that exploits the reservoir in its discrete units, the local in situ stress and pore pressure must be better understood. To this end we plan to carefully conduct minifrac tests (including determinations of pore pressure within the tested interval) at a variety of depths and locations in the field. We also plan to collect and interpret ultrasonic image data in new or existing surrounding wells to identify and improve determination of breakout widths and thereby reduce the uncertainty in the maximum horizontal stress magnitude. More extensive modeling of the existing wellbore failure data, specifically the modeling of observed rotations of failure orientations, which coincide with the locations of active shear fractures, will serve to better constrain the magnitude of SHmax. Better Shmin, pore pressure, and SHmax magnitudes will result in tighter constraints on the stress magnitudes and will improve the precision of the predicted orientations of the most permeable fractures.
REFERENCES
Barton, C. A., Zoback, M. D. and Moos, D. (1995), “Fluid flow along potentially active faults in crystalline rock,” Geology, 23 (8), pp. 683–686. Barton, C. A., Hickman, S., Morin, R., Zoback, M. D., Finkbeiner, T., Sass, J., and Benoit, D. (1997), “In-situ stress and fracture permeability along the Stillwater Fault Zone, Dixie Valley, Nevada,” in Proceedings of the Twenty-Second Workshop on Geothermal Reservoir Engineering, SGP-TR-156, Stanford University, Stanford, California, pp. 147–152.
Barton, C. A., Moos, D., Zoback, M. D. (1997), “In situ stress measurements can help define local variations in fracture hydraulic conductivity at shallow depth,” The Leading Edge, pp. 1,653–1,656. Barton, C. A., Hickman, S., Morin, R., Zoback, M. D. and Benoit, D. (1998), “Reservoir-scale fracture permeability in the Dixie Valley, Nevada, geothermal field, In: Proceedings, Twenty-Third Workshop on Geothermal Reservoir Engineering,” SGP-TR-158, Stanford University, Stanford, California, January 26–28. Byerlee, J. (1978), “Friction of rocks,” Pure and Applied Geophysics, 116, pp. 615–626. Jaeger, J. C. and Cook, N. G. W. (1979), “Fundamentals of Rock Mechanics (Third Edition),” New York, Chapman and Hall, pp. 28–30. Kamb, W. B. (1959), “Ice petrofabric observations from Blue Glacier, Washington, in relation to theory and experiment,” J. Geophys. Res., v. 64, 1,891–1,910. Mastin, L. G. (1988), “Effect of borehole deviation on breakout orientations,” J. Geophys. Res., 93, 9,187–9,195. Moos, D., and Zoback, M. D. (1990), “Utilization of Observations of Well Bore Failure to Constrain the Orientation and Magnitude of Crustal Stresses: Application to Continental, Deep Sea Drilling Project, and Ocean Drilling Program Boreholes,” J. Geophys. Res., 95, pp. 9,305–9,325.