In-Situ Investigation of Adsorbed Surfactants and Polymers on …ps24/PDFs/In-Situ Investigation...
24
245 Colloids and Surfaces, 37 (1989) 245-268 ElsevierScience PublishersB.V., Amsterdam Printed in The Netherlands In-Situ Investigation of Adsorbed Surfactants and Polymers on Solids in Solution P. SOMASUNDARAN and JOY T. KUNJAPPU Langmuir Centerfor Colloidsand Interfaces,Columbia University, New York, NY 10027 (U.S.A.) (Received 15 June 1988; accepted 11 November 1988) ABfrrRACT Adsorption of monomericand polymeric organic compounds onto solidsis crucial in regulating suchprocesses as flotation. flocculation and stabilization of minerals as well as other solids. The microstructure of the adsorbed species is of prime concern in understandingthe complexities of the resultant processes. In this paper, we summarize the resultsof our recent investigation on the alumina-sodiumdodecyl sulfate system by speciallydeveloped techniques based on time-resolved resonance Raman. electron spin resonance and luminescence spectroscopies to supplementthe results from measurements of bulk properties such as adsorption density. zeta potential and hy- drophobicity. Evidenceis presented to substantiate the reverse orientation model. Furthermore. the implications of pH dependent conformational changes of polyelectrolytesin solution and in the adsorbed state are brought forth from fluorescence studieswith pyrene-tagged polymers.and a model for the polymer conformational features is presented supportedby flocculation response measurements. INTRODUCTION Interfacial phenomena havebecome an integral part of all human endeavors, both scientific and technological, since no conceivablesystem can exist with- out the coexistence of different states of matter. Commonly encounteredin- terfacesare of the solid-gas, liquid-gas, liquid-liquid or solid-liquid type. The solid-liquid interface is of paramount importance due to its involvement in many biological and industrial processes. The boundarymarking the interface between two bulk phases as in the solid- liquid interface is discontinuous and associated with residual electrical fields. This imparts specialproperties to the solid surfaceat the solid-liquid interface which influence the course of processes suchas flotation and flocculation. Ad- sorption of surfactants and polymers is usually discussed in connection with flotation and flocculation because the surface modification accompanying the adsorption is mainly responsible in regulating the efficiency of theseprocesses (1,2]. @ 1989 Elaevier Science Publishers B. V. 0166-6622/89/$03.50
Transcript of In-Situ Investigation of Adsorbed Surfactants and Polymers on …ps24/PDFs/In-Situ Investigation...

245Colloids and Surfaces, 37 (1989) 245-268Elsevier Science Publishers B. V., Amsterdam Printed in The Netherlands
In-Situ Investigation of Adsorbed Surfactants andPolymers on Solids in Solution
P. SOMASUNDARAN and JOY T. KUNJAPPULangmuir Center for Colloids and Interfaces, Columbia University, New York, NY 10027
(U.S.A.)(Received 15 June 1988; accepted 11 November 1988)
ABfrrRACT
Adsorption of monomeric and polymeric organic compounds onto solids is crucial in regulatingsuch processes as flotation. flocculation and stabilization of minerals as well as other solids. Themicrostructure of the adsorbed species is of prime concern in understanding the complexities ofthe resultant processes. In this paper, we summarize the results of our recent investigation on thealumina-sodium dodecyl sulfate system by specially developed techniques based on time-resolvedresonance Raman. electron spin resonance and luminescence spectroscopies to supplement theresults from measurements of bulk properties such as adsorption density. zeta potential and hy-drophobicity. Evidence is presented to substantiate the reverse orientation model. Furthermore.the implications of pH dependent conformational changes of polyelectrolytes in solution and inthe adsorbed state are brought forth from fluorescence studies with pyrene-tagged polymers. anda model for the polymer conformational features is presented supported by flocculation response
measurements.
INTRODUCTION
Interfacial phenomena have become an integral part of all human endeavors,both scientific and technological, since no conceivable system can exist with-out the coexistence of different states of matter. Commonly encountered in-terfaces are of the solid-gas, liquid-gas, liquid-liquid or solid-liquid type. Thesolid-liquid interface is of paramount importance due to its involvement in
many biological and industrial processes.The boundary marking the interface between two bulk phases as in the solid-
liquid interface is discontinuous and associated with residual electrical fields.This imparts special properties to the solid surface at the solid-liquid interfacewhich influence the course of processes such as flotation and flocculation. Ad-sorption of surfactants and polymers is usually discussed in connection withflotation and flocculation because the surface modification accompanying theadsorption is mainly responsible in regulating the efficiency of these processes
(1,2].
@ 1989 Elaevier Science Publishers B. V.0166-6622/89/$03.50
246
Adsorption of surfactants or polymers on solids at the solid-liquid interfacegenerally results in the aggregation of the adsorbate on the solid. The proper-ties of the surface would be modified depending upon the extent of surfacecoverage and the nature of surface stacking. Before entering into the differenttechniques usually adopted in unravelling the microstructure of the adsorbedlayers of surfactants and polymers, it is required to define some of the basicconcepts of the aggregation process and assign appropriate nomenclature forthe aggregates in different cases.
'SOLLOIDS' A GENERIC TERM FOR SURFACE AGGREGATES
The shape of surfactant aggregates, especially those of ionic type in solution,is fairly well understood. Ionic surfactant aggregates usually possess a spheri-cal shape and this standard description of them has been of general acceptance[3]. At higher surfactant concentrations, however, the aggregates undergosphere-rod transitions and are further transformed into bilayer structures. Thecritical micellar concentration (c.m.c.) in solution has been determined bymany physical methods to a great degree of accuracy.
The nature of surfactant aggregates on solids has been the subject of muchspeculation. Their shape has not been determined to any degree of certaintyand has been the subject of active discussion. Intuitive suggestions regardingthe nature of the surfactant aggregates on solids have resulted in many termsto represent their shape, incongruent and inconsistent with many observedfacts. At least, in connection with ionic surfactants, the term hemimicelliza-tion [4] has been popular to represent the onset of the aggregation processfollowing its adsorption onto a charged mineral. Notwithstanding the fact thatno definite information is available about the shape of these aggregates, thesemblance of these aggregates with hemispherical particles was implied. Fur-thermore, the changes occurring to the surface aggregates with increasing ad-sorption density are also not reflected in the term hemimicelle.
In another terminology, the adsorbed aggregates of surfactants are referredto as 'admicelles' (adsorbed miceUes) [5]. This connotes that micelles in so-lution adsorb directly on the solid surface. But, it is shown from thermody-namic calculations that even at surfactant concentrations higher than thec.m.c., the monomeric surfactant molecules in equilibrium with the micellaraggregates in solution partake directly in the adsorption process [6].
While analyzing the problem of the nomenclature of surfactant aggregateson solids, we felt that it is imperative to coin a good generic representativeterm to contain all types of aggregates including surfactants and polymers onthe solid surface. We suggest the term 'solloid' for this. It should eliminatesome of the semantic issues and unwarranted connotations linked with the oldterms. Thus, one can speak of surfactant solloids and polymer solloids on solidsurfaces. Solloid should easily accommodate the non-ionic surfactant aggre-

247
gates also in the adsorbed state. It may be remembered that the shape of theaggregates of non-ionic surfactants is not as well-defined as the shape of ionicsurfactant aggregates, even in homogeneous solutions. The characteristics ofadsorbed polymeric materials on the solid surface with and without surfactantspresent a much more complex case due to the possible involvement of differentconformations and the polymer-surfactant interactions. Solloid comprises allthe above situations in a general fashion and should serve as a useful term tosurface chemistry in connection with the adsorption phenomenon. However,the term hemimicelles may still be used to represent the two-dimensional sur-factant aggregates on the solids as in the case of anionic surfactant aggregateson a charged mineral surface like alumina.
IN-SITU VERSUS EX-SITU TECHNIQUES
The methods employed in elucidating the microstructure of solloids may beclassified into in-situ and ex-situ techniques. Ex-situ methods usually makeuse of high vacuum as in electron spectroscopy for chemical analysis (ESCA)and Auger spectroscopy. Any ex-situ technique can only give information aboutirreversible adsorption processes. Exploring the microstructures of solloidswould be possible if measurements were carried out without disturbing theequilibrium at the solid-liquid interface. Although the measurements of bulkproperties like adsorption density, zeta potential, hydrophobicity, etc. may beperformed under in -situ conditions, such methods do not generate any molec-ular information about the solloids or the adsorption process [7]. Spectro-scopic techniques are deemed to be suitable for this purpose since the infor-mation is gathered under conditions in which the environment of the moleculeis least perturbed. To look for the spectroscopic changes, the solloid-formingmolecule should possess an atom or group which would respond to the opticalor magnetic field depending on whether one is interested in optical transitionsor magnetic resonance studies. If the spectroscopically active moiety is an in-tegral part of the natural solloid-forming molecule, it may be referred to as anintrinsic probe. Alternatively, if the probe is incorporated into the system bythe external addition or chemically bonded to the solloid-forming molecule, itis known as an extrinsic probe. Spectroscopic methods based on luminescenceemission and paramagnetic resonance property (ESR) require an appropriatespectroscopically sensitive label whereas techniques like NMR, IR and Ramanutilize, in general, the inherent nuclear spin and vibrational modes, respectively.
This paper encompasses our recent attempts in delineating the microstruc-tures of surfactant and polymeric solloids by luminescence, ESR and time-resolved Raman spectroscopic studies. Solloids of sodium dodecyl sulfate (SOS)on alumina and polyacrylic acid (PAA) on alumina were selected as represen-tatives of surfactant and polymer adsorbates. Information on the micropolar-ity, microviscosity and aggregation number was arrived at using the potentials

248
of the above techniques and search for newer probes has been continued to geta consolidated picture of the adsorption process.
INVFSrIGATIONS ON ~Oa/SDS SOLLOID - SIGNIFICANCE OF S-F ISOTHERM
Adsorption of SOS on alumina provides a model system exemplifying thedifferent stages in the mechanism of adsorption of an ionic surfactant on acharged mineral. A meticulous analysis of the adsorption isotherm of this typewas pioneered by Somasundaran and Fuerstenau using sodium dodecylsulfon-ate and alumina [8]. It was shown then that the isotherm contained distinctinflections which they designated as regions I, II, III and IV. Such an isothermis sometimes referred to as S. F isotherm after Somasundaran and Fuerstenau,the first to show the significance of such an isotherm.
The S-F isotherm as obtained for SOS [9] on alumina at pH 6.5 and a saltconcentration of 10-1 kmol m -3 is shown in Fig. 1 which clearly distinguishes
the four regions mentioned above. Mechanistically, these regions may be viewedas follows:
(1) Region I with a slope of unity under constant ionic strength conditionsis indicative of the existence of electrostatic interaction between the anionicsurfactant and the positively charged mineral.
(2) The conspicuous increase in adsorption in region II marks the onset ofsurfactant association at the surface through lateral interaction between hy-
10"5 M)-4 10.3 10-2RESIDuAl. OODECYLSULFATE. "o,"/lil.'
Fig. 1. Adsorption ofsodiumdodecyl sulfate (SOS) on alumina at pH 6.5 in 10-1 kmol m-3 NaCI.Surfactant aggregation numbers determined at various adsorption densities are shown along theisotherm.

249
~
~60.140:! 20I-~ 0I-O'ZO
4.-40 m
E: l.~ . ,.,.,,1 ,. ,.1 .. ,~~-~~ 0 10'"5 10-4 10-3 10-2
AESI~AL OOOECYLSULFATE. mole~/lit.,
Fig. 2. Zeta potential of alumina as a function of equilibrium concentration of SOS (designationof regions based on shape of isotherm in Fig. 1).
drocarbon chains ( this phenomenon, classically, is referred to ashemimicellization) .
(3) Region III is marked by a decrease in the slope which is ascribed to theincreasing electrostatic hindrance to the surfactant association process follow-ing interfacial charge reversal (the changes in zeta potential of the interfacewith increasing surfactant concentration is depicted in Fig. 2).
(4) The plateau adsorption in region IV corresponds to maximum surfacecoverage as determined by micelle formation in the bulk; further increase insurfactant concentration does not alter the adsorption density.
Classical methods based on zeta potential, adsorption density, hydrophobic-ity, etc. referred to as bulk methods help to generate a gross picture of theadsorption process. They are detailed at length in many earlier reports. Now,we proceed to describe the application of different spectroscopic methods togain insight into the interior of AI2O3/SDS solloid.
LUMINESCENCE SPECTROSCOPY
Photoluminescence emission - fluorescence and phosphorescence - of amolecule is capable of reporting the changes in its microenvironment and hasbeen exploited for long in exploring the solution behavior of surfactants. Pa-rameters of fundamental importance with regard to photoluminescence emis-sion of a molecule are its wavelength maximum, quantum yield and life time.Methods of determining these parameters as established earlier in micellarsolutions have been applied by us to Al2O3/SDS solloids. We employed threedifferent photoluminescent probes, viz. (i) pyrene[lO), (ii)1,3-dinaphthyl-propane (DNP) [9] and (iii) tris(2,2-bipyridyl)ruthenium(lI) chloride (11),for this purpose.
We resorted to both steady-state and decay measurements of luminescenceto arrive at these parameters. The integrity of the adsorbed structures in thepresence of the probe was tested by redetermining the adsorption isotherm. Itwas found that the probes in the concentration levels used in the luminescence

250
study did not perturb the surfactant solloids. This fact is shown for pyrene inFig. I.
Micropolarity with pyrene
Out of the five well-resolved vibrational fine structures of pyrene, the first(11) and the third (13) are found to depend on the micropolarity of the medium.This empirical knowledge has been found to be of universal applicability andused to investigate the micropolarity of micelles [12]. Since the location of thisprobe in micelles is fairly well understood, definite information about the sol-loidal polarity may also be obtained from 13/1\ values of the pyrene emissionspectrum.
The 13/1\ value for pyrene changes from - 0.6 in water to a value of > 1 innon -polar hydrocarbons. Figure 3 shows the variation of 13/11 values for differ-ent regions of the Al2O3/SDS adsorption isotherm. A value of -1 reported for13/11 in hemimicelles is indicative of a non-polar environment comparable tothat in the micelles (- 1). However, the 13/1\ values in solloids were relativelyconstant throughout the higher regions in the isotherm.
Microuiscosity with 1,3-dinaphthyipropane
DNP is a fluorescent molecule which forms an excimer (excited dimer) de-pending on the concentration and the viscosity conditions. At a given concen-tration, the extent of excimer formation is a sensitive function of the microv-iscosity of its neighborhood. This property expressed as the ratio of the yieldof the monomer and excimer (1m/Ie) is determined in solution and in the ad-sorbed layer for various regions of the adsorption isotherm. These values arecompared with the 1m/Ie values ofDNP in mixtures of ethanol and glycerol ofpredetermined viscosity. The results are shown in Figs 4a and 4b. The extent
1.5PYRENE IN ADSORBED LAYER 50S/ALUMINA
.IM NaCl, pH 6.5
:..s.~'~'~!~~.~.~:'.~..~.~!.).t"~-i~~~~
.5
0 . #' ' ..., ... . . ..., ... .. ,..1 ... . . ...10 )0"5 10-4 10-3 lO-t
RESIDUAL DOOECYLSULF"ATE. moles/lile'
Fig. 3. 13//1 fluorescence parameter of pyrene in SDS-alumina slurries.
.
. WATER IO.IM NeCI}.. ., ... ...

251
~
Fig.4a. 1. 3.0inaphthyipropane (ONP) ftuorescence spectra in (A) SOS micellar solution and(B) SOS-alumina slurry; [SOSj/[DNPj refers to ratio ofmicellized or adsorbed SOS to addedDNP.Fig. 4b. Monomer to excimer ratio (/.jl.) ofONP in SOS-alumina slurries as a function ofSDSadsorption density (I.. at 340 om and I. at 420 nm).
of excimer formation in the adsorption sample (1m/I. - 4) is significantly lowerthan in the micellar solution (1m/Ie -1.7).
Based on the Imil. values of DNP calibration in ethanol-glycerol mixtures,a microviscosity value of - 90-120 cP was obtained for the adsorbed layer (in-dependent of surface coverage) compared to a value of - 8 cP for micelles. Theconstancy of microviscosity as reported by DNP is indicative of the existenceof a condensed surfactant assembly on the surface which holds the probe in adensely packed state.
Aggregation number of AiozOa/SDS solloid from fluorescence decay of pyrene
Fluorescence emission of pyrene in micellar solutions interpreted with cau-tion can generate information on the aggregation number [13-16]. For this,the decay kinetics of monomer and excimer emission of. pyrene at differentconcentration levels are to be determined.
A kinetic analysis based on the relations connecting the decay rates of themonomer and excimer was carried out from the decay profiles of pyrene in thesolloidallayer for different regions of the AI2Oa/SDS adsorption isotherm [9].Figure 5a represents typical decay curves for the monomer (curves A and B)at two pyrene levels and the excimer (curve C) corresponding to curve B. Thefluorescence spectra of these two cases are represented in Fig. 5b.
The aggregation number was arrived at from the above studies. The SOSaggregation numbers thus obtained are marked on the adsorption isotherm inFig. 1. The aggregates in region II appear to be relatively of uniform size (121-128). But in region III, there is a marked growth in the aggregate size (166-356). These results are of special significance with respect to the evolution and

252
Fig. 6. Schematic representation of the correlation of surface charge and the growth of ~tesfor various regions of the adsorption isotherm depicted in Fig. 1 (curve shows the regiona in anS-F isotherm). (i) Left hand side - reverse orientation model: In region I, there is no aggregation;in region II, the number of aggregates increases to - 125 molecules per aggregate; in region III,the size of the aggregates increases to > 160 molecules per aggregate. (ii) Right hand side - thebilayer model.

253
structure of the adsorbed layer. Region II and above seem to be characterizedby surfactant aggregates of limited size. Here, the surface is still not occupiedand enough positive sites are available (Fig. 2). Further asorption occursmainly by increasing the number of aggregates as revealed by a near constantaggregation number. The transition from region II to III corresponds to theisoelectric point of the mineral and adsorption in region III is likely to occurthrough the growth of the existing aggregates rather than the formation of newones. This is possible by the hydrophobic interaction between hydrocarbontails of the already adsorbed surfactant molecules and the unadsorbed ones.Such a situation can be expected to result in a reverse orientation of the sur-factant molecules as illustrated in Fig. 6 where the whole process of adsorptionhas been portrayed schematically. Before comparing this model with other sug-gested schemes in the literature, it will be beneficial to evaluate the results ofluminescence emission studies with Ru(bpY)32+ in the solloid.
Emission studies with {Ru(bpy)JC4
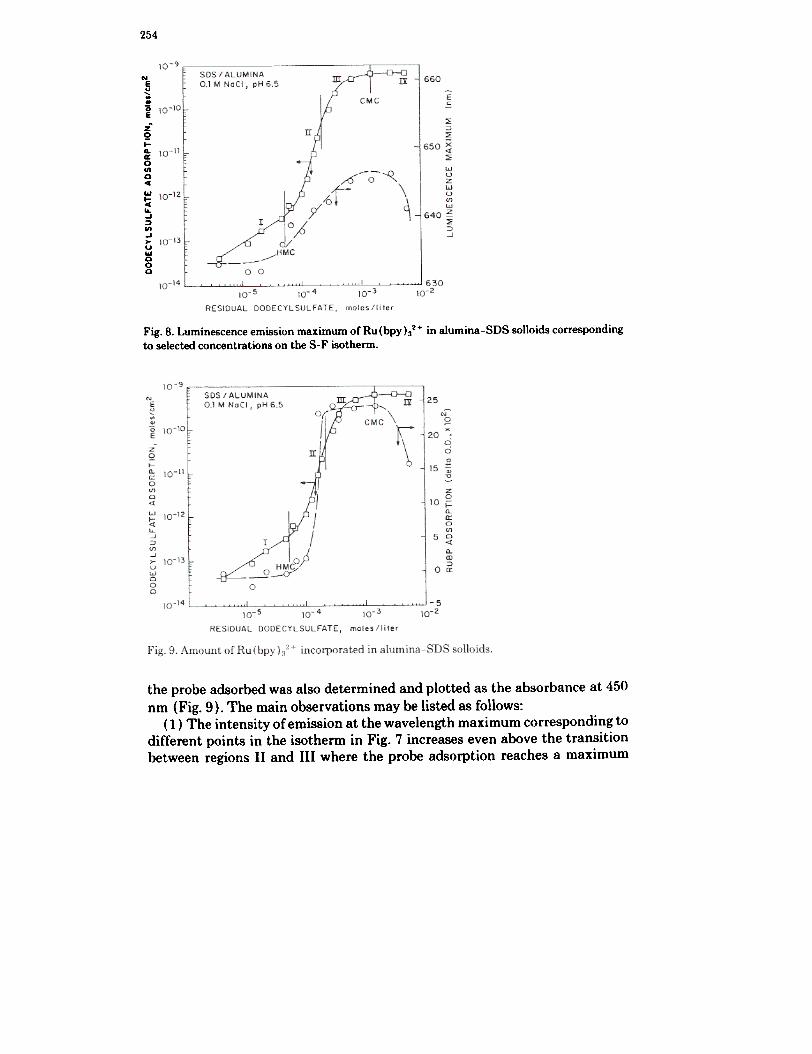
[Ru(bPY)aJCI2, a positively charged probe, may be expected to bind ontoalumina/SDS solloid when a favorable negative charge develops at the inter-face, although the hydrophobic interaction between the probe and solloid layermay also playa role in determining its solubility. The emission intensity andthe emission wavelength maximum were determined for various points in theAI2Oa/SDS isotherm and the results are shown in Figs 7 and 8. The amount of
254
Ne"~.tzQI-0.a:0'"0c(
...I-c(.....J~'"..J...U~00
Fig. 8. Luminescence emission maximum of Ru (bpy ):/2 + in alumina-SDS solloids corresponding
to selected concentrations on the S-F isotherm.
the probe adsorbed was also determined and plotted as the absorbance at 450nm (Fig. 9). The main observations may be listed as follows:
(1) The intensity of emission at the wavelength maximum corresponding todifferent points in the isotherm in Fig. 7 increases even above the transitionbetween regions II and III where the probe adsorption reaches a maximum
255
(Fig. 9). It may be mentioned that the luminescence intensities measured atthe emission maximum in each case many not have any absolute significance.
(2). The variation in luminescence maximum (Fig. 8) also shows a contin-uous increase as observed in the case of intensity changes (Fig. 7).
(3) The probe adsorption has closely followed the changes in the zeta po-tential at the interface (see Fig. 2).
(4) All of the above parameters diminish in magnitude when the residualsurfactant concentration in the supernatant exceeds the c.m.c. This is due tothe partitioning of the probe in the solloidal and micellar phases.
These observations are of significance in unravelliilg the microstructure ofthe adsorbed solloid layer and will be discussed in another section while criti-cally evaluating the adsorption models.
ELECTRON SPIN RESONANCE STUDI~ [17.111
Molecular species with a free electron possess intrinsic angular momentum(spins) which in an external magnetic field undergo Zeeman splitting, due tothe secondary magnetic moments of neighboring nuclei. For a system with aspin number of 1/2, two Zeeman energy levels are possible whose energy gapis given by the equation
E = hv = gBHo
where g is a proportionality constant, B the Bohr magneton (natural unit forthe magnetic moment of the electron), Ho the applied magnetic field and" thefrequency of electromagnetic radiation corresponding to E which causes reso-nance absorptiqn. The position of an absorption line is generally specified bythe g value.
Hyperfine splitting brings further splitting of the absorption signal. Theseparation between the hyperfine lines is an indicator of the nuclear neighbor-hood about the free electron. The hyperfine splitting pattern depends on thespins and actual number of the neighboring nuclei with spins. If the electronis in the field of a proton (8 = 1/2), then the ESR spectrum would yield twolines of equal i~tensity. Similar interaction by a nucleus with 8 = 1, as innitrogen, would produce a triplet of equal intensity. The widths of these linesare subject to various relaxation processes occurring within the spin system(spin-lattice and spin-spin relaxations) as well as anisotropic effects (due tothe differently oriented paramagnetic centers being acted by external magneticfield) .
Spin-probing and spin-labeling techniques are normally employed in study-ing the micellar environment. In the present study, stable free radical nitroxidespin labels were chosen for use of ESR spectroscopy. They were the three iso-meric 5-,12- and 16- doxyl stearic acids (5-D, 12-D, 16-D). These spin labels(in micromole levels) were co-adsorbed individually on alumina along with
256
the main adsorbate, viz. SOS, and the main regions of the adsorption isothermwere studied
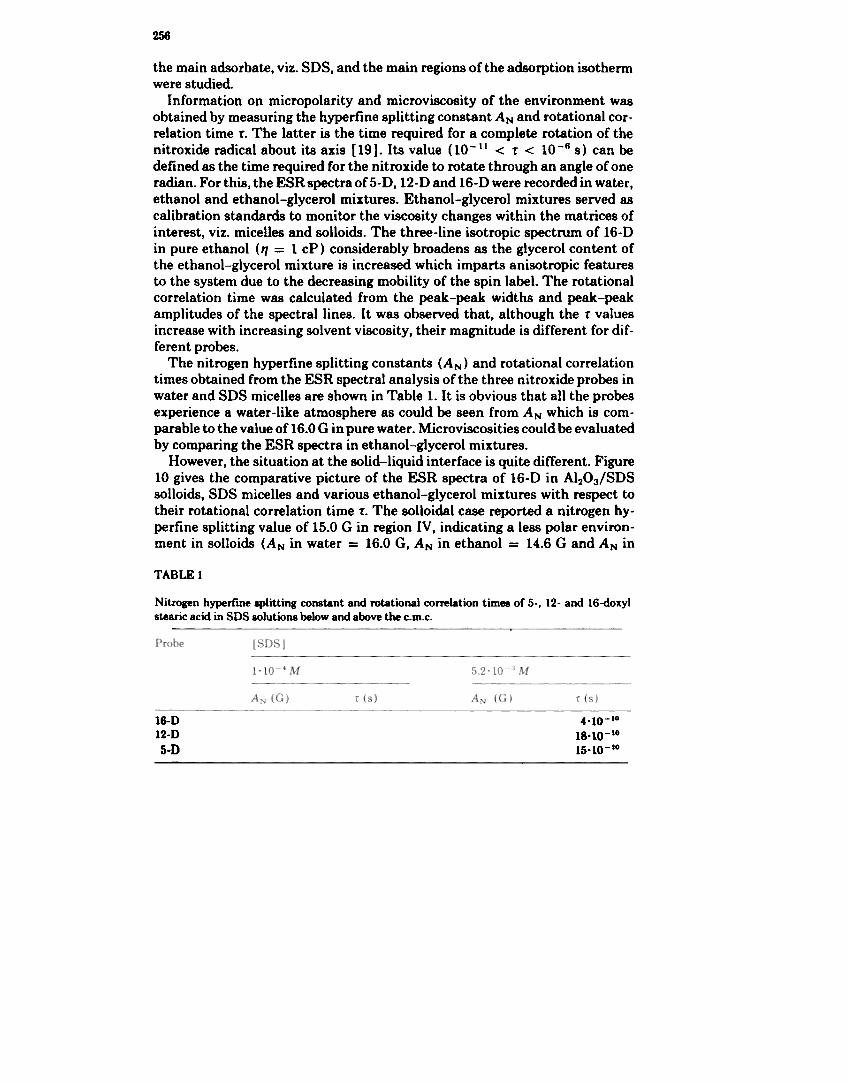
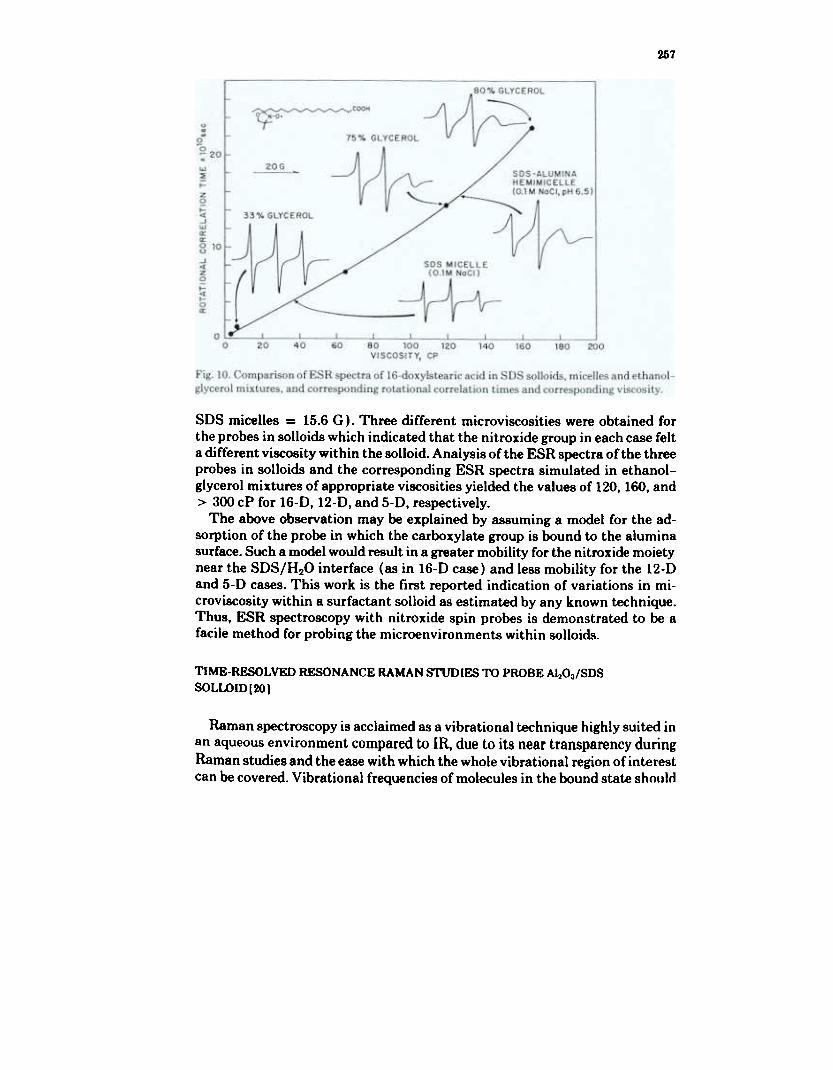
Information on micropolarity and microviscosity of the environment wasobtained by measuring the hyperfine splitting constant AN and rotational cor-relation time f. The latter is the time required for a complete rotation of thenitroxide radical about its axis [19]. Its value (10-11 < f < 10-6 s) can bedefined as the time required for the nitroxide to rotate through an angle of oneradian. For this, the ESR spectra of 5- D, 12- D and 16- D were recorded in water,ethanol and ethanol-glycerol mixtures. Ethanol-glycerol mixtures served ascalibration standards to monitor the viscosity changes within the matrices ofinterest, viz. micelles and solloids. The three-line isotropic spectrum of 16-0in pure ethanol (1f = 1 cP) considerably broadens as the glycerol content ofthe ethanol-glycerol mixture is increased which imparts anisotropic featuresto the system due to the decreasing mobility of the spin label. The rotationalcorrelation time was calculated from the peak-peak widths and peak-peakamplitudes of the spectral lines. It was observed that, although the T valuesincrease with increasing solvent viscosity, their magnitude is different for dif-ferent probes.
The nitrogen hyperfine splitting constants (AN) and rotational correlationtimes obtained from the ESR spectral analysis of the three nitroxide probes inwater and SOS micelles are shown in Table 1. It is obvious that all the probesexperience a water-like atmosphere as could be seen from AN which is com-parable to the value of 16.0 G in pure water. Microviscosities could be evaluatedby comparing the ESR spectra in ethanol-glycerol mixtures.
However, the situation at the solid-liquid interface is quite different. Figure10 gives the comparative picture of the ESR spectra of 16-0 in AI2O3/SDSsolloids, SOS micelles and various ethanol-glycerol mixtures with respect totheir rotational correlation time T. The solloidal case reported a nitrogen hy-perfine splitting value of 15.0 G in region IV, indicating a less polar environ-ment in solloids (AN in water = 16.0 G, AN in ethanol = 14.6 G and AN in
TABLEt
Nitrogen hyperfine splitting constant and rotational correlation times or 5-, 12- and 16-doxylstearic acid in SDS solutions below and above the c.m.c.
16-D12-D5-D
4.
1S-
15.
10-1010-1010-10
257
SDS micelles = 15.6 G). Three different microviscosities were obtained forthe probes in solloids which indicated that the nitroxide group in each case felta different viscosity within the solloid Analysis of the ESR spectra of the threeprobes in solloids and the corresponding ESR spectra simulated in ethanol-glycerol mixtures of appropriate viscosities yielded the values of 120, 160, and> 300 cP for 16-0, 12-0, and 5-0, respectively.
The above observation may be explained by assuming a model for the ad-sorption of the probe in which the carboxylate group is bound to the aluminasurface. Such a model would result in a greater mobility for the nitroxide moietynear the SDSjH2O interface (as in 16-D case) and less mobility for the 12-0and 5-D cases. This work is the first reported indication of variations in mi-croviscosity within a surfactant solloid as estimated by any known technique.Thus, ESR spectroscopy with nitroxide spin probes is demonstrated to be afacile method for probing the microenvironments within solloids.
TIME-RESOLVED RESONANCE RAMAN STUD~ TO PROBE AI2O3/SDS
SOLLOID(20]
Raman spectroscopy is acclaimed as a vibrational technique highly suited inan aqueous environment compared to IR, due to its near transparency duringRaman studies and the ease with which the whole vibrational region of interestcan be covered. Vibrational frequencies of molecules in the bound state shOtJld

258
be different from that in the free state. Also, it is susceptible to changes in thesymmetry properties of the environment. Very few definitive studies exist inthe literature concerning the Raman spectroscopy of surfactants in solution.Raman investigations of surfactant adsorbates are reported as surface-en-hanced Raman studies at the metal colloid or metal electrode/liquid interface.
This study is devoted to the time-resolved Resonance Raman (TR3) spec-troscopic studies of SDS micellar solutions and Al2O3/SDS solloid usingtris(2,2'-bipyridine)ruthenium(lI) chloride as the Raman probe. The thirdharmonic of a Nd- YAG laser was the excitation source (pulse energy, 5 mJ;pulse width, 6 ns; wavelength, 354.5 nm). The spectrum of the probe was cal-ibrated using the published spectrum from the literature. Figure 11a depictsthe ground state absorption, emission and excited state absorption of the ruth-enium complex. Figure 11b shows the ground state and the excited state Ra-man spectra ofRu(bpY)32+ in water. The excited state consists of 14 lines, twosets of seven lines each corresponding to the ground state and excited statetransitions. All these transitions are known to originate from the excited statespecies. They are roughly assigned to the various symmetric stretching vibra-tions of C- Nand C-C bonds of the bipyridine ring.
A
t:\\"'-/.
.- JOG400"".
Fig.lla (A) Absorption and (C) emissionspectr&ofRu(bpy)32+ and (8) tbeexcitedstatetran.sient abeorption spectrum of Ru (bpy) 32 + .Fig. lIb. Raman spectra of the ground state Ru(bpY)3Z+ (upper spectrnm) and excited stateRu(bpy)"z" (lowerspectnJln).

259
~~
..2
~
~.. .. '"'" ...-; -
OQN~
..... 0! ~ :!
IA
.A..c~D
~..
!"-c.C...
.."~"0~
I
~ u1100 1300 1500
Wavenumber (om-1)17C)O
Fig. 12. Resonance Raman spectra of RU(bpY)32+" (A) in water, (B) in SDS and (C) differencespectrum.
TABLE 2
Normalized intensities for various Raman transitions in aqueous solution and SDS micelles
Peak position(cm-')
Normalized Intensities
Aqueous solution(:t3%)
SDS micelles(:t3% )
1213128613241426149915471605
0.661.000.110.420.470.850.26
0.841.000.200.420.730.920.39

260
~. .00 c-- ::
.N .-- 0~~ ;:
RegionI--
.-
c~.a..C-.
~-.c.-c
.>-a
.g:
." ..§~ g
Regionm
!~
~; :2:; 1..3---! '; ~ - ~ ,~.=..=~2g ;:
Rigion11:
1100 1300 1500 1700Wavenumber (cm-1)
Fig. 13. Resonance Raman spectra of Ru(bpY)3"'. (A) on alumina slurry, (B) region I, (C) regionII, (0) region III, (E) region IV of alumina IS OS S-F isotherm.
SDS solutions and slurries of AI2O3/SDS with and without the probe werecirculated as smooth continuous stream before being intercepted by the laser.Figure 12 shows the excited state resonance Raman spectrum of th(" probe inwater and in SOS micelles. The micellar spectrum is marked with intensityvariations and frequency shifts in comparison with the aqueous spectrum. Inparticular, the transition at 1213 cm -1 showed remarkable frequency shifts in

261
to0 1213 cm-l~ 1286c",-10 1428cm-l. 1607cm-1
.."'-
--'-,..,.- ,..
,..'"
/ -
.//',
..
~
'. /'. x"
./ '"
6.0
~ 5.0
II)~41III 4.0GoZ41~41 3.01~
Z-~ 2.0XII)
1.01
0.0 ... . , , . ,I . , . .1 ,.. . . . .,.1.0 10.0 100.0 1000D
[SOS) &105 (moles/lifre )Fig. 14. Frequency shifts of resonance Raman lines of Ru(bpy )32 +. as a function of SDS concentration for alumina/SDS system.
Fig. 15. Intensities of Raman lines (normalized with respect to 1286 cm-1 line) for differentregions of S-F isotherm for alumina/SDS system.

262
micelles. The intensity variations in some of these peaks is shown in Table 2.The transitions at 1213, 1499 and 1605 cm -1 have undergone substantial en-hancement in intensity. It may be noted that the Raman spectra in the pre-micellar regions remained the same as in water.
Panels of Fig. 13 represent the Raman spectra of the probe in AI2O3/S0Ssolloid corresponding to different regions of the AI2O3/S0S isotherm. Thespectra in the absence of SOS and in regions I and II remained similar to theaqueous spectrum. The spectra in regions III and IV showed variation in in-tensity and frequency, showing a definite trend in the magnit1,lde of the changes.Figures 14 and 15 show the shifts in frequencies and variation in intensities ofsome of the Raman lines for the various regions of the isotherm. The curves inthese figures almost trace the shape of the isotherm, reflecting its ability toreport changes occurring in the solloidal structure. The regions I and II wereinactive towards Raman spectra since the probe was not incorporated at theinterface as evidenced from the analysis of supernatant of adsorption samples.
This is the first report of the excited state Raman spectrum of a probe mol-ecule incorporated within surfactant aggregates in solution and in the adsorbedform at a solid-liquid interface under in-situ equilibrium conditions. The studyclearly shows several transitions are sensitive to the evolution and structureof solloidal hemimicelles. Implicit in the results is the potential of TR3 spec-troscopy as a powerful diagnostic tool to explore the solid-liquid interface.Also, this study opens the general possibility of observing the adsorption pro-cess by yet another sensitive technique to provide basic information on ad-sorbed layers.
A DEFENCE OF THE REVERSE ORIENTATION MODEL
The above observations have special significance in gaining insight aboutthe evolution and structure of AI2O3/SDS solloid. The nature of this solloidaggregate is a subject of much controversy. A variation of the adsorption pro-cess discussed earlier treats the adsorption as two-dimensional condensationon heterogeneous surfaces in the form of patches [5a J. The second model [5b ]is referred to as the bilayer model which envisages the adsorption of surfactantmolecules to occur through bilayer adsorption right from the beginning of theaggregation process. According to our reverse orientation model, as aggrega-tion proceeds, some of the surfactant molecules tend to adsorb on the hydro-carbon chain by tail-tail interactions, leaving behind charged polar groups fac-ing the aqueous phase. At higher surface coverage, reverse orientation mayresemble a bilayer in content, although it is not the same type of the bilayerenvisioned in the bilayer model. Changes in the intensity of luminescenceemission and wavelength maxima of Ru (bpy >32+ occurring in different regionsof the isotherm even after the complete adsorption of the probe may be taken

263
as an evidence for changing molecular environment within the solloid. A bi-layer model cannot explain the gradual differences in the nature of the solloidaggregate as inferred from our results. The two models for the various regionsin the AI2O3/S0S isotherm are as shown in Fig. 6.
Another compelling reason for belief in our reverse orientation model stemsfrom the high values of microviscosity reported in the solloid (> 120 cP) byall the ESR probes and the fluorescent probe DNP. The bilayer model putsforward the suggestion that the tail groups of the upper layer of the bilayeredaggregates do not significantly interpenetrate the tail group region of the bot-tom layer[21]. This would result in a microviscosity value comparable to thatin micelles (-8 cP). Notwithstanding some of the thermodynamic calcula-tions sporadically appearing in the literature to suggest the bilayer model, ourexperimental evidence strongly support the reverse orientation model. Finally,the changes observed in the TR3 spectra of the ruthenium probe in alumina/SOS solloids with increasing adsorption density of SDS indicate that the mi-crostructure of the adsorbed layer does not remain the same as implied by thebilayer model.
SOLLOIDS OF POLYELECTROLYTES: EFFECT OF pH DEPENDENTCONFORMATIONAL EQUILffiRIA OF POLYACRYLIC Acm ON FLOCCULATION OF
ALUMINA
Polymers can exist in different conformations both in solution and in theadsorbed state. The adsorption process of macromolecules differs from that ofsmall molecules in that the former can make use of the multifunctional groupsfor adsorption.
Polyelectrolytes are often discussed because of their participation in manybiological processes, e.g. globular proteins and other biopolymers. Polyacrylicacid (PAA) and polymethacrylic acid (PMAA) are usually chosen as simplesystems of polyelectrolytes to gain insight into the adsorption behavior of po-lyelectrolytes. Such an understanding is important in acquiring effective con-trol over the processes of colloidal stabilization and flocculation.
PAA can exist in different conformations depending upon the solvent, pHand ionic strength conditions. Such a flexibility would influence the adsorptionof macromolecules from solution onto solids and, in turn, would affect thedispersion behavior of suspensions. We have used a pyrene-labelled fluores-cent P AA to investigate the adsorbed polymer conformations [22] at the solidinterface of alumina in water (1.5 mol. % of pyrene bearing moiety; Mw =40,()()(); degree of polymerization - 510).
The rationale behind the implementation of this technique is the observa-tion that the extent of the excimer formation which depends on the interactionof an excited state pyrene of polymer pendant group with another pyrene groupin the ground state, has a direct bearing with the polymer conformation. This
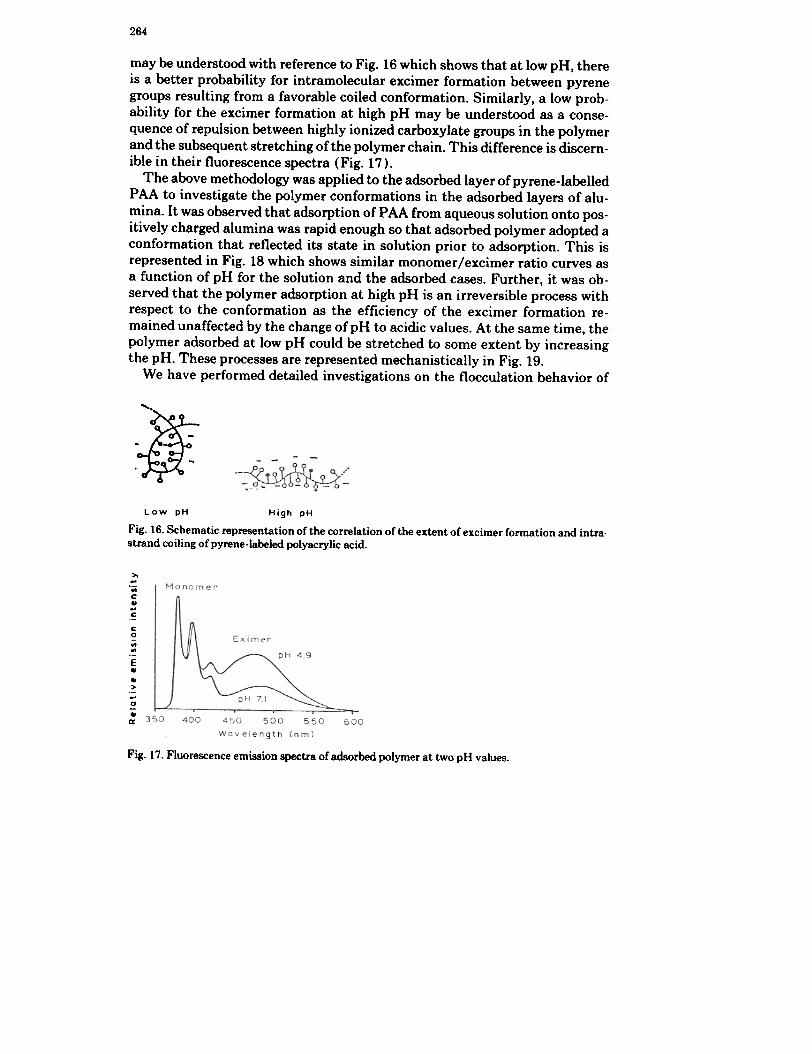
264
may be understood with reference to Fig. 16 which shows that at low pH, thereis a better probability for intramolecular excimer formation between pyrenegroups resulting from a favorable coiled conformation. Similarly, a low prob-ability for the excimer formation at high pH may be understood as a conse-quence of repulsion between highly ionized carboxylate groups in the polymerand the subsequent stretching of the polymer chain. This difference is discern-ible in their fluorescence spectra (Fig. 17).
The above methodology was applied to the adsorbed layer of pyrene-labelledPAA to investigate the polymer conformations in the adsorbed layers of alu-mina. It was observed that adsorption of P AA from aqueous solution onto pos-itively charged alumina was rapid enough so that adsorbed polymer adopted aconformation that reflected its state in solution prior to adsorption. This isrepresented in Fig. 18 which shows similar monomerfexcimer ratio curves asa function of pH for the solution and the adsorbed cases. Further, it was ob-served that the polymer adsorption at high pH is an irreversible process withrespect to the conformation as the efficiency of the excimer fonnation re-mained unaffected by the change of pH to acidic values. At the same time, thepolymer adsorbed at low pH could be stretched to some extent by increasingthe pH. These processes are represented mechanistically in Fig. 19.
We have performed detailed investigations on the flocculation behavior of
~Low pH High pH
Fig. 16. Schematic representation of the correlation of the extent of excimer formation and intra.strand coiling of pyrene-labeled polyacrylic acid.
'"-'inc..-cc0oiloil
E..
..>-0
..IX
Fig. 17. Fluorescence emission spectra of adsorbed polymer at two pH values.

265
6
5-
I
.4-H
E 3'
H..
8pW
104 G
Fig. 18. Monomer to excimer ratio as a function of pH for aqueous solution of polymer and ad-sorbed polymer on alumina.
(b) Hip pH
.l"""e ~-~--
(0) Low pH
,~ ~-. . . .
Expanded'solution. . . .
COiled/.Solution
high pHE ,-A-~/-
+ + + +Ext~nd~d IQbsorb~d
strong binding
.
Low pH
~~/-. . . .Expand@d obsorb~
~High pHC - --~~
+ + + +
Partially expanded/absorbed
Fig. 19. Schematic representation of the adsorption process of pyrene-labeled polyacrylic acid onalumina. (A) At low pH the polymer is coiled in solution which leads to (B), adsorption in thecoiled form. (C) Subsequent raising of the pH in solution causes some expansion of the polymer.(0) Polymer at high pH in solution is extended and binds (E) strongly to the surface in thisconformation. (F) Subsequent lowering of the pH does not allow for sufficient intra-strand inter-actions for coiling to occur.
alumina particles with and without added polymer under fixed and changingpH conditions. Various flocculation responses like sediment volume, % solidsettled, % transmittance and settling rate were studied in conjunction with
266
0.8-6 Fiaed pH conditions0 Chonging pH 4 to II0 Cho"9ing pH 10 to 40
~. ~ " -.~0.6
"\E o.s!1-4
.1-4 0.-.
"'.. .
\ ~. .
\\0
. .\~ 0
D ~ t:::=::~~~£;~i).e0'
0.1- - . '---3 4 " 6 7" . I II
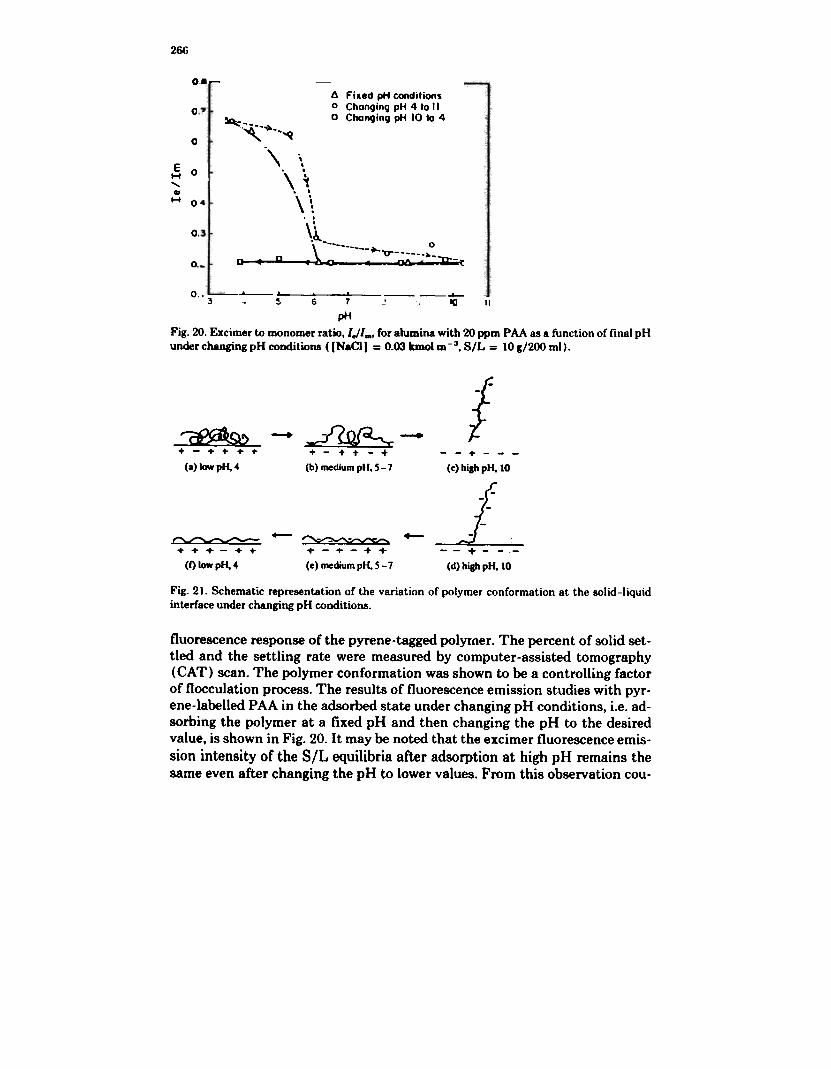
pHFig. 20. Excimer to monomer ratio.I.!I.., for alumina with 20 ppm PAA as a function of final pHunder changing pH conditions ([NaCI) = 0.03 kmol m-3, S/L = 10 g/200 ml).
. ~~ -0---
~
f"'~g ~+-+t-++
(a) low pH, 4
_../1S)f«."",,""+
(b) medium pH. S - 7
~
-..--+---
(c) high pH, 10
L- - + - - .-(d) hip pH. 10
-~... ... + - + +
(I) low pH, 4
- ~... - ... - + +(e) medium pH. S - 7
Fig. 21. Schematic representation of the variation of polymer conformation at the solid-liquidinterface under changing pH conditions.
fluorescence response of the pyrene-tagged polyrner. The percent of solid set-tled and the settling rate were measured by computer-assisted tomography(CAT) scan. The polymer conformation was shown to be a controlling factorof flocculation process. The results of fluorescence emission studies with pyr-ene-labelled PAA in the adsorbed state under changing pH conditions, i.e. ad-sorbing the polymer at a fixed pH and then changing the pH to the desiredvalue, is shown in Fig. 20. It may be noted that the excimer fluorescence emis-sion intensity of the S/L equilibria after adsorption at high pH remains thesame even after changing the pH to lower values. From this observation cou-

pled with the above results, the variation of PAA conformation at the solid-liquid interface under changing pH conditions may be represented as shownin Fig. 21. It may be inferred that the polymer conformation at a given pH maybe manipulated by controlling the adsorption conditions.
CONCLUSIONS
To summarize, this paper consolidates our work on surfactant and polymersolloids at the solid-liquid interface. A number of new findings are reportedwith regard to the structure and evolution of surfactant and polymer solloidsby an integrated approach employing classical bulk property measurementsand relatively modem spectroscopic techniques. Luminescence, electron spinresonance and time-resolved resonance Raman spectroscopic techniques wereemployed for this purpose. The aggregation number of SOS solloid on aluminawas'determined for the various regions of the adsorption isotherm. The vari-ation in microviscosities within the interior of the solloidallayer was deter-mined at different points. The reverse orientation model envisaged by us ear-lier to represent the adsorption process was substantiated by evaluating theresults of all the in-situ bulk and spectroscopic techniques. Finally, the effectof the pH dependent conformational equilibria of polyacrylic acid on the ad-sorption process and its implications to flocculation have been explored tosuggest reasonable conformational structures for the polymer solloid.
ACKNOWLEDGEMENT
We thank the National Science Foundation and the department of Energyfor their financial support.
REFERENCES
1 P. Somasundaran, AIChE Symp. Ser., 71 (1975).2 P. Somasundaran,T.W. Healy and D.W. Fuerstenau,J. Phys. Chern., 68 (1964) 3562.3 D.W.R. Gruen, Prog. Colloid Polym. Sci., 70 (1985) 6.4 (a)A.M. Gaudin and D.W. Fuerstenau, Min. Eng., 7 (1955) 66
(b) A.M. Gaudin and D. W. Fuerstenau, Trans. AIME, 202 (1955) 66.5 (a)J.M. Cases, J.E. Poirier and D. Canet, Solid-Liquid Interactions in Porous Media, Tech-
nip, Paris, 1985, p. 335.(b) D. Bitting and J.H. Harwell, Langmuir, 3 (1987) 500.
6 J.F. Scamerhom, R.S. Schecter and W.H. Wade, J. Colloid Interface Sci., 85 (1982) 463.7 H.S. Hanna and P. Somasundaran, in D.O. Shah and R.S. Schecter (Eds), Improved Oil
Recovery by Surfactant and Polymer Flooding, Academic Press, New York, 1977, p. 253.8 P. Somasundaran and D. W. Fuerstenau, J. Phys. Chern., 70 (1966) 00.9 P. Chandar, P. Somasundaran and N.J. Turro, J. Colloid Interface Sci., 117 (1987) 31.
10 P. Somasundaran, N.J. Turro and P. Chandar, Colloids Surfaces 20 (1986) 145.
268
11 J. T. Kunjappu and P. Somasundaran, Colloids Surfaces, in press.12 K. Kalyanasundaram and J.K. Thomas, J. Am. Chern. Soc., 99 (1977) 2039.13 S.S. Atik, M. Nam and L.A. Singer, Chern. Phys. Lett., 67 (1979) 75.14 P.P. InfeltaandJ. Gratzel,J. Chern. Phys., 70 (1979) 179.15 P. Levitz, H. van Damme and D. Keravis, J. Phys. Chem., 88 (1984) 2228.16 P. Levitz and H. van Damme, J. Phys. Chem., 90 (1986) 1302.17 K.C. Waterman, N.J. Turro, P. Chandar and P. Somasundaran, J. Phys. Chem., 90 (1986)
6830.18 P. Chandar. P. Somasundaran, K.C. Waterman and N.J. Turro J. Phys. Chem., 91 (1987)
150.19 B. Ranby, in J.F. Rabek (Ed.), ESR Spectroscopy in Polymer Research, Springer-Verlag,
Berlin, 1977.20 P. Somasundaran,J.T. Kunjappu, C. V. Kumar, N.J. TurroandJ.K. Barton, Langmuir, (1989)
in press.21 M.A. Yeskie andJ.H. Harwell, J. Phys. Chem., 92 (1988) 2346.22 P. Chandar, P. Somasundaran, N.J. Turro andK.C. Waterman, Langmuir,3 (1987) 298.