`In Reply Refer To - United States Fish and Wildlife Service · · 2011-09-02Table 5 Summary of...
169
Transcript of `In Reply Refer To - United States Fish and Wildlife Service · · 2011-09-02Table 5 Summary of...


ii
TABLE OF CONTENTS
CONSULTATION HISTORY ....................................................................................................... 1 BIOLOGICAL OPINION............................................................................................................... 2 DESCRIPTION OF THE PROPOSED ACTION.......................................................................... 2
Conservation Measures........................................................................................................... 4 Action Area............................................................................................................................. 5
ANALYTICAL FRAMEWORK FOR THE JEOPARDY AND ADVERSE MODIFICATION DETERMINATIONS ..................................................................................................................... 5
Adverse Modification Determination ..................................................................................... 6 STATUS OF THE SPECIES – Northern Spotted Owl .................................................................. 7
Spotted Owl Habitat and Population in the Olympic National Forest.................................... 7 ENVIRONMENTAL BASELINE – Northern Spotted Owl.......................................................... 7
Status of Spotted Owls in the Action Area ................................................................................. 8 Conservation Role of the Action Area.................................................................................. 11 Condition of the Action Area................................................................................................ 11
EFFECTS OF THE ACTION - Spotted Owls.............................................................................. 14 Direct Effects to Spotted Owls ............................................................................................. 15 Indirect Effects to Spotted Owls ........................................................................................... 19
STATUS OF NORTHERN SPOTTED OWL CRITICAL HABITAT........................................ 25 Olympic National Forest Critical Habitat Trends................................................................. 26
ENVIRONMENTAL BASELINE - Spotted Owl Critical Habitat .............................................. 27 Conservation Role of the Critical Habitat............................................................................. 28 Condition of the Critical Habitat........................................................................................... 28
EFFECTS OF THE ACTION - Spotted Owl Critical Habitat...................................................... 28 STATUS OF THE SPECIES - Marbled Murrelet ........................................................................ 31
Murrelet Habitat and Population in the Conservation Zone ................................................. 31 ENVIRONMENTAL BASELINE - Marbled Murrelet................................................................ 31
Distribution and Population Trends .......................................................................................... 32 EFFECTS OF THE ACTION – Marbled Murrelet ...................................................................... 35
Exposure to Effects ................................................................................................................... 35 Direct Effects to Murrelets........................................................................................................ 36 Indirect Effects to Individual Marbled Murrelets ..................................................................... 39
STATUS OF MARBLED MURRELET CRITICAL HABITAT ................................................ 47 ENVIRONMENTAL BASELINE - Murrelet Critical Habitat (CHU WA-06a) ......................... 47 EFFECTS OF THE ACTION - Marbled Murrelet Critical Habitat ............................................. 49
EFFECTS OF INTERDEPENDENT AND INTERRELATED ACTIONS - Murrelets and Spotted Owls............................................................................................................................. 49
CUMULATIVE EFFECTS .......................................................................................................... 49 Climate Change......................................................................................................................... 50
INTEGRATION AND SYNTHESIS ........................................................................................... 50 Spotted Owls............................................................................................................................. 50 Spotted Owl Critical Habitat..................................................................................................... 52 Marbled Murrelets .................................................................................................................... 52 Marbled Murrelet Critical Habitat ............................................................................................ 54
CONCLUSION............................................................................................................................. 54

iii
INCIDENTAL TAKE STATEMENT.......................................................................................... 55 AMOUNT OR EXTENT OF TAKE............................................................................................ 55
EFFECT OF THE TAKE - Spotted Owls and Murrelets ......................................................... 56 REASONABLE AND PRUDENT MEASURES..................................................................... 56 TERMS AND CONDITIONS .................................................................................................. 57
CONSERVATION RECOMMENDATIONS.............................................................................. 58 REINITIATION NOTICE............................................................................................................ 59 LITERATURE CITED................................................................................................................. 60 Appendix 1: Status of the Species: Northern Spotted Owl......................................................... 68 Appendix 2: Status of the Critical Habitat: Northern Spotted Owl ............................................ 69 Appendix 3: Status of the Species: Marbled Murrelet................................................................ 70 Appendix 4: Status of the Critical Habitat: Marbled Murrelet ................................................... 71
LIST OF TABLES AND FIGURES
Table 1 History of known spotted owl activity centers ............................................................... 10 Table 2 Changes to the 1994 FSEIS spotted owl NRF habitat baseline...................................... 11 Table 3 All section 7 consultations issued for effects to spotted owls on the Forest .................. 12 Table 4 Changes to nesting, foraging, roosting (NRF) habitat .................................................... 20 Table 5 Summary of the effects of the proposed action on spotted owls .................................... 25 Table 6 1994 Critical Habitat Baseline for Spotted Owls in the Olympic Peninsula .................. 26 Table 7 Effects to CHUs relative to spotted owls, 1994 to present, on the Forest ...................... 27 Table 8 Spotted owl critical habitat unit overlaying the action area............................................ 29 Table 9 Spotted owl critical habitat unit overlaying the action area............................................ 30 Table 10 Summary of the effects of the proposed action on murrelets ....................................... 47 Figure 1 Project area with 2.7-mi-radius spotted owl territories with 1.4-mi-radius core area... 15

iv
ABBREVIATIONS AND ACRONYMS Act Endangered Species Act BA Biological Assessment CFR Code of Federal Regulations CHU Critical Habitat Unit FHWA Federal Highway Administration Forest Olympic National Forest FR Federal Register FSR Forest Service Road GIS Geographic Information System ha Hectare NSOOM Northern Spotted Owl Occupancy Map km Kilometers LSR Late Successional Reserve m Meter(s) mi Mile(s) murrelet Marbled Murrelet NRF Nesting, Roosting and Foraging NWFP Northwest Forest Plan Opinion Biological Opinion Park Olympic National Park PCEs Primary Constituent Elements PNW U.S. Forest Service's Pacific Northwest Research Station, Olympia, Washington RPMs Reasonable and Prudent Measures Service U.S. Fish and Wildlife Service spotted owl Northern Spotted Owl T&C Terms and Conditions Zone Conservation Zone
1
CONSULTATION HISTORY
• March 22, 2004: The U.S. Fish and Wildlife Service (Service) issued a Biological Opinion (Opinion) for the original project (1-3-04-F-0324).
• June 4, 2009: The Service met with the Olympic National Forest (Forest) to discuss the new forthcoming final Biological Assessment (BA).
• June 24, 2009: The Service and the Forest made a field inspection of the action area.
• October 28, 2009: The Service received the biological assessment with cover letter dated October 26, 2009, that includes the effects determinations of the proposed action to the terrestrial species.
• November 18, 2009: A phone call between the Forest and the Service clarified the cover letter that accompanied the October 26, 2009 Opinion.
• December 4, 2009: The Service received the Biological Assessment with cover letter dated December 2, 2009, that includes the effects determination of the proposed action to aquatic species.
• Between June 11, 2009, and March 31, 2010, several emails and phone calls between the Service and the Forest were exchanged to clarify different aspects of the proposed action.
This Opinion is also based on information contained in the following documents:
• The Forest Ecosystem Management Assessment Team Report (FEMAT 1993).
• The Final Supplemental Environmental Impact Statement on Management of Habitat for Late-Successional and Old-Growth Forest Related Species within the Range of the Northern Spotted Owl (USFS and USBLM 1994).
• The Record of Decision for Amendments to U.S. Forest Service (USFS) and Bureau of Land Management Planning Documents within the Range of the Northern Spotted Owl (USDA and USDI 1994).
A complete project file of this consultation is located at the Service’s Washington Fish and Wildlife Office in Lacey, Washington. Concurrence for Insignificant and Discountable Effects - Coastal Puget Sound Bull Trout The BA included proposed action effects determination of “may affect, not likely to adversely affect” for the bull trout. Based on the information provided in the BA and other sources, we concur with this determination based on the rationale described below. The proposed action includes the construction of a road reroute on Forest Service Road (FSR) 2610, about 10 miles (mi) west of Highway 101 at Brinnon to bypass a washout area that occurred in 2002. Road construction of the 0.8 mi segment will require clearing trees, excavation, and construction of retaining walls, reinforced fill, and other features. Road construction will likely occur between early spring 2011 and late fall 2012. The new road
2
alignment will occur upslope of the original alignment by 130 ft to 530 ft. Some road segments must cross steep, unstable soils, with frequent wet undefined seep areas. It is likely that sediment would be delivered to unnamed tributaries to the Dosewallips River from chronic surface erosion off the new cut and fill slopes and possibly expose some fish to sediments. However, sediment impacts would be limited to only two tributaries. Because of its much larger size and greater ability to transport sediment, fine sediment impacts would be negligible in the mainstem Dosewallips River. The Dosewallips River is considered foraging, migratory, and overwintering habitat for bull trout due to the occasional use by the anadromous life history form of bull trout reported in the lower watershed. However, there have been no documented observations of bull trout above the confluence with Rock Brook (at river mile 3.5). Further, fish inventories in 2002 by the Olympic National Park (Park) fisheries crews did not detect any bull trout in the upper Dosewallips inside the Park boundary. Therefore, the occurrence of migratory bull trout within the action area is so remote that exposure to the limited sediment levels in the Dosewallips River generated by the proposed action is discountable. For these reasons, we concur with the determination that the proposed action is not likely to adversely affect bull trout. As an interrelated and interconnected activity, the Park plans to repair 120 ft of damaged road on the Dosewallips Road at mile post 0.85 in the vicinity of the Dosewallips Falls. The Park would repair the road only after completion of the Dosewallips Washout Project. Here the road would be repaired by removing old road fill material and reconstructing the road prism using riprap and crushed rock. Gabions would be used to stabilize fill. All work would occur above the ordinary high water line of the river. Construction would occur between August 6 and September 30 of any project year. However, there have been no documented observations of bull trout above the confluence with Rock and fish inventories in 2002 by the Park fisheries crews did not detect any bull trout in the upper Dosewallips inside the Park boundary. Therefore, the occurrence of migratory bull trout within the action area is so remote that exposure to sediments generated by the proposed action is discountable.
BIOLOGICAL OPINION DESCRIPTION OF THE PROPOSED ACTION Formal consultation under the Endangered Species Act (Act) for the previous proposed action was originally completed on March 22, 2004. However, the project experienced several delays. Since that consultation, the proposed action’s purpose and need as well as the scope of the project changed, warranting a new consultation and Biological Opinion. The purpose of the previous proposed action was to reestablish access on FSR 2610 to gain access to the USFS Dosewallips Campground and Park facilities. The new purpose and need of the proposed action is to reestablish motorized access on FSR 2610 and the Dosewallips Road to Forest and Park facilities. A detailed description of the proposed project is contained in the Forest’s Biological Assessment (USFS 2009, pp. 1-6). The following is a summary description of the proposed action. The
3
proposed action would occur within the Dosewallips watershed of the Hood Canal Ranger District of the Forest, Jefferson County, Washington. The Forest proposes to reconstruct a portion of the Dosewallips River Road (FSR 2610) that was washed out during the winter of 2002 (T26N, R04E, Sections 23 and 24). The new 0.8-mile road alignment would restore motorized access to approximately 5.0 mi of FSR 2610, 0.5 mi of FSR 2610040, the Forest Elkhorn Campground, the Park’s Dosewallips Campground, the Park’s Dosewallips Ranger Station, and two Park trailheads. The expected duration of construction will be 2.5 years. The current proposed action increased the amount of required clearing over the previous proposed action. About 6.5 acres of forest designated as Late Successional Reserve (LSR) and critical habitat for the spotted owl and murrelet would be cleared. Clearing would include the removal of over 200 trees from a stand, many estimated to be 500+ years old. Some trees may be pushed over to preserve the attached root wads so that the trees may be used in river restoration projects. Tree felling would occur between October 1 and February 28 of any project year to avoid direct injury to spotted owls and murrelets. Trees may also be available for Tribal use while excess trees may be sold. Forest clearing includes the removal of danger trees (formally called “hazard trees”) from within 100 ft of the top of the hill cut or the toe of the fill within 15 acres surrounding the new road alignment. This will occur as danger trees are identified during initial tree felling outside the spotted owl and murrelet nesting seasons. Some danger tree felling (up to 3 per year) may be required during the spotted owl and murrelet nesting seasons. Operation of heavy equipment and chainsaws may occur year-round. A large helicopter may be required to lift out trees. However, helicopter operation will only occur outside the nesting seasons for the spotted owl and murrelet. Northwest Forest Plan Consistency The proposed action requires four amendments to be consistent with the Northwest Forest Plan (NWFP). These amendments are considered non-significant as defined under the National Forest Management Act to the 1990 Olympic National Forest Land and Resource Management Plan. The justification for these amendments is due to the changed physical conditions of the forest, specifically, the road washout. The Forest determined that the proposed amendments were non-significant based on criteria found in Forest Service Regulations (FSM) 1900, Chapter 1920, Section 1926.5. The Forest Plan amendments to the specific NWFP Record of Decision elements that the Forest will drop or modify (in parentheses) include the following:
• Pre-project surveys of murrelet habitat following protocol (C-10). In lieu of completing the required surveys, the Forest assumes occupancy of the action area by murrelets.
• All contiguous existing and recruitment habitat for murrelets within a 0.5 mi radius of murrelet occupancy will be protected (C-10). Some existing murrelet habitat will be removed.
4
• Non-silvicultural activities located inside LSR will be neutral or beneficial to the creation and maintenance of late-successional habitat (C-16). The proposed action will not be neutral or beneficial.
• For each existing or planned road, meet Aquatic Conservation Strategy objectives by avoiding wetlands entirely when constructing new roads (C-32). The proposed action will impact wetlands.
Conservation Measures The proposed action includes conservation measures that are in addition to the NWFP (USDA and USDI 1994) and the Forest’s Land and Resource Management Plan Standards and Guidelines (USFS 1990, pp. 4-81 to 4-142). The Forest will ensure the proposed action impacts are minimized by using terrestrial-specific conservation measures that include, but are not limited to, the following:
• All non-commercial staging, borrow and waste areas will be reviewed by a biologist to ensure no effects would occur to listed species.
• Only weed-free gravel, fill, quarry, and borrow material will be used for the proposed action.
• All construction equipment would be cleaned before being brought into the National Forest Systems Lands and Park lands.
• Only certified weed-free straw or mulch will be used for soil stabilization.
• Strict garbage control measures will be used to prevent the attraction of predators and expose spotted owl, murrelets, and their nestlings and eggs to predation.
• Between April 1 and September 15 of any construction year, construction activities that create noise at or above 92 dBA will be restricted to between 2 hours after sunrise to 2 hours before sunset.
• The Forest will prepare a plan to address the removal of trees greater than or equal to 21 inch dbh and logs (live or dead, standing or down) that would need to be moved for construction activities. A priority use for these logs would be for terrestrial coarse woody debris.
• All tree-felling (except danger trees) within suitable habitat for spotted owl or murrelet would occur between October 1 and February 28 of any construction year.
• Danger trees that require felling during the murrelet nesting season will be visually inspected by a wildlife biologist before felling to determine if the danger tree has the potential to provide nesting structures for murrelets. If evidence suggests potential for murrelet nesting, the tree will be monitored to determine if it is used by murrelets for nesting. The surveys shall be conducted by an individual trained and certified for marbled murrelet survey protocol recognized by the Service. A survey will commence at least 45 minutes before sunrise and conclude no sooner than 75 minutes after sunrise. Surveys will occur over two consecutive days. Should a murrelet be observed landing in the tree in question, or a tree that is immediately adjacent to the danger tree, the Forest

5
shall reinitiate consultation with the Service prior to felling of the danger tree or any tree immediately adjacent to the danger tree. If no murrelets are detected, the danger tree may be felled without the requirement for reinitiation.
• The road would be constructed to minimize impacts to adjacent late-successional forest habitats by falling trees away from the habitat to the extent practicable.
• Blasting with charges larger than 2 lb will not occur during the early breeding seasons for spotted owls or murrelets.
• If helicopter use is required, flights to and from the action area will be at least 1000 ft above the ground.
Action Area The action area is defined as all areas to be affected directly or indirectly by the Federal action and not merely the immediate area involved in the action (50 CFR § 402.02). In delineating the action area, we evaluated the farthest reaching physical, chemical, and biotic effects of the action on the environment. The action area for the proposed action is described based on the area of sound-only impact from road building activities and includes heavy equipment, chainsaws, helicopters, and blasting. We used a 1-mi-wide buffer around the 0.8 mi long new road alignment for a total of about 1,750 acres within the action area. The action area also includes the Dosewallips River Road (FSR 2610) from the washout to its terminus on the Park, and facilities serviced by the road including the Forest’s Elkhorn Campground, and the Park’s Dosewallips Campground. For spotted owls, the action area occurs within the Olympic Peninsula Physiographic Province, and within the spotted owl critical habitat unit WA-49. Under the 2008 final rule revising critical habitat for the spotted owl, the action area occurs within the Olympic Peninsula (Unit 1) critical habitat unit. For murrelets, the action area occurs in Conservation Zone (Zone) 1, and within designated critical habitat unit WA-06a. For land use allocation, the entire action area also occurs within the Quilcene Late-Successional Reserve (RW-105) and Riparian Reserve and within a Tier-1 Key Watershed. ANALYTICAL FRAMEWORK FOR THE JEOPARDY AND ADVERSE MODIFICATION DETERMINATIONS Jeopardy Determination In accordance with policy and regulation, the jeopardy analysis in this Opinion relies on four components: 1) the Status of the Species, which evaluates the species rangewide condition, the factors responsible for that condition, and its survival and recovery needs; 2) the Environmental Baseline, which evaluates the condition of the species in the action area, the factors responsible for that condition, and the relationship of the action area to the survival and recovery of the species; 3) the Effects of the Action, which determines the direct and indirect impacts of the proposed Federal action and the effects of any interrelated or interdependent activities on the

6
species; and 4) Cumulative Effects, which evaluates the effects of future, non-Federal activities in the action area on the species. In accordance with policy and regulation, the jeopardy determination is made by evaluating the effects of the proposed Federal action in the context of the species status, taking into account any cumulative effects, to determine if implementation of the proposed action is likely to cause an appreciable reduction in the likelihood of both the survival and recovery of the species in the wild. The jeopardy analysis in this Opinion places an emphasis on consideration of the rangewide survival and recovery needs of the species and the role of the action area in the survival and recovery of the species as the context for evaluating the significance of the effects of the proposed Federal action, taken together with cumulative effects, for purposes of making the jeopardy determination. Adverse Modification Determination This Opinion does not rely on the regulatory definition of “destruction or adverse modification” of critical habitat at 50 CFR 402.02. Instead, we have relied upon the statutory provisions of the Act to complete the following analysis with respect to critical habitat. In accordance with policy and regulation, the adverse modification analysis in this Opinion relies on four components: 1) the Status of Critical Habitat, which evaluates the rangewide condition of designated critical habitat for the species in terms of Primary Constituent Elements (PCEs), the factors responsible for that condition, and the intended recovery function of the critical habitat overall; 2) the Environmental Baseline, which evaluates the condition of the critical habitat in the action area, the factors responsible for that condition, and the recovery role of the critical habitat in the action area; 3) the Effects of the Action, which determines the direct and indirect impacts of the proposed Federal action and the effects of any interrelated or interdependent activities on the PCEs and how that will influence the recovery role of affected Critical Habitat Units (CHU); and 4) Cumulative Effects, which evaluates the effects of future, non-Federal activities in the action area on the PCEs and how that will influence the recovery role of affected CHUs. For purposes of the adverse modification determination, the effects of the proposed Federal action on spotted owl critical habitat are evaluated in the context of the rangewide condition of the critical habitat, taking into account any cumulative effects, to determine if the critical habitat rangewide would remain functional (or would retain the current ability for the PCEs to be functionally established in areas of currently unsuitable but capable habitat) to serve its intended recovery role for the species. The analysis in this Opinion places an emphasis on using the intended rangewide recovery function of species critical habitat and the role of the action area relative to that intended function as the context for evaluating the significance of the effects of the proposed Federal action, taken together with cumulative effects, for purposes of making the adverse modification determination.
7
STATUS OF THE SPECIES – Northern Spotted Owl Please refer to Appendix 1 for an updated account of the status of spotted owls rangewide. Spotted Owl Habitat and Population in Olympic Peninsula Physiographic Province By the early 1990s, almost 80 percent of old growth or late-successional forest stands of the Olympic Peninsula were lost from timber harvest. Most remaining old growth in on Federal lands, primarily in the Park. The Park contains the largest and most contiguous acres of high quality suitable habitat within the Olympic Peninsula Physiographic Province (Province). The amount of spotted owl habitat in the Province is presented in Appendix B, Table 2. The only indication we have concerning the status of the population of spotted owls in the Province is from data obtained from the Olympic Demographic Study area (see "Current Condition of Spotted Owl Numbers, Distribution, and Reproduction" in Appendix B). It is unknown how similar that study area is to the Province as a whole, or the Forest, but, as of the last cumulative analysis (Anthony et al. 2006); the number of spotted owls in the study area was declining at a rate of 4.4 percent annually. Spotted Owl Habitat and Population in the Olympic National Forest The Forest consists of 632,000 acres, of which approximately 40 percent, or 250,714 acres, are classified as suitable spotted owl habitat (USFWS 2003, p. 95). Some of the patches of older forest in the lower elevations that remained after timber harvest are occupied by scattered, relatively isolated pairs of spotted owls, and clusters of spotted owls have been found in recent surveys at higher elevations (USFWS 2003, p. 85). As with the Province, the only indication we have concerning the status of the population of spotted owls in the Forest is from data obtained from the Olympic Demographic Study area. ENVIRONMENTAL BASELINE – Northern Spotted Owl Regulations implementing the Act (50 CFR 402.02) define the environmental baseline as the past and present impacts of all Federal, State, or private actions and other human activities in the action area. Also included in the environmental baseline are the anticipated impacts of all proposed Federal projects in the action area that have undergone section 7 consultation, and the impacts of State and private actions which are contemporaneous with the consultation in progress. The Environmental Baseline portion of this consultation documents the approved Federal actions that contribute to the conservation of the spotted owl, as well as those actions that authorized incidental take. The baseline includes adoption of the NWFP. Information relevant to describing the environmental baseline for this action is included in the NWFP and associated documents.

8
Status of Spotted Owls in the Action Area Spotted Owls in the Forest Spotted owl surveys have been conducted in nearly all portions of the Forest and the Park over the last two decades. The Forest has conducted surveys for projects and habitat monitoring in may areas of the Forest in the late 1980s and the 1990s while the Pacific Northwest Research Station conducted annual surveys since the 1980s on both the Forest and the Park as part of the Olympic Province Demographic Study. The most recent information indicates that the Forest contains 117 owl territories while the Park has 96 owl territories (USFS 2009, pp. 21-22). Spotted Owl Territories in the Action Areas The action area lies within three spotted owl home ranges. For the purposes of analyses, a circle is used to approximate each spotted owl home range. In the Olympic Peninsula, a 2.7-mile radius circle is used to identify the median annual home-range around a spotted owl activity center. In addition, a 1.4-mi radius circle is used to identify the core area around a spotted owl activity center.
Mt. Jupiter (also known as Number 24 or Gamm Creek by the Washington Department of Fish and Wildlife [WDFW]).
The action area overlaps this home range as well as the core area of the site. The home range contains 5,502 acres (39 percent) suitable habitat (nesting, roosting, and foraging (NRF) while the core contains 1,780 acres (31 percent). This territory is currently below the home range threshold of 40 percent (5,708 acres) of NRF by 206 acres and is below the core area threshold of 50 percent (2,860 acres) of NRF by 1,080 acres.
The U.S. Forest Service’s Pacific Northwest Research Station, Olympia, Washington (PNW) surveyed this site from 1994 to 2004. The owl site was designated as an activity center in 1998. No successful reproduction has been reported for the site since surveys began in 1994. Pair status was last documented in 1995. Spotted owls were not detected during consecutive year surveys of this site since 1997. A barred owl was detected in 2002 (Table 1).
Upper Tunnel Creek (also known as Number 160, or South Fork Tunnel Creek by the WDFW)
The action area overlaps this home range but not the core area. The home range contains 5,888 acres (41.3 percent) of NRF habitat and 3,055 acres (53.4 percent) NRF within the core area and is above the minimum habitat thresholds. The PNW started surveying this site from 1987 and continues to monitor it. The last year a pair of owls was detected was in 2007, but the last year reproduction was confirmed was in 1996. Upper Dosewallips Owl site (computer-generated site). In response to a Ninth Circuit Court decision in 2007, spotted owl specialists from the Service, the Bureau of Land Management, and the USFS developed a methodology for quantifying and monitoring incidental take of spotted owls (FWS et al. 2008). The methodology estimates the

9
number of spotted owl home ranges that are likely to occur within the area affected by a proposed Federal action in areas without adequate or recent surveys. These virtual home ranges are based on the amount and distribution of suitable owl habitat and best available information on known spotted owl locations and spacing patterns for that area. A spotted owl occupancy map was created that includes the estimated placement of modeled activity centers. The action area overlaps the home range of this owl site but not the core area. The owl site contains 5,919 acres (41.5 percent) of NRF habitat. The core area contains 2,929 acres (51.2 percent) of NRF habitat and is above the minimum habitat threshold. However, these figures may be inaccurate due to the Constance Fire of 2009. This fire occurred within the Park and the Forest and burned a total of 440 acres. The fire reached Constance Creek and Bull Elk Creek, which is within the Upper Dosewallips owl site on Forest land. The total acreage of suitable habitat destroyed and how much of that occurred on the Forest or within the Upper Dosewallips owl site has not yet been determined. A rough estimate of 200 acres of suitable habitat destroyed was offered by the Park at this time (Scott Gremmel, pers. comm., 2010). However, it is unlikely that the fire and the loss of suitable habitat would significantly influence this analysis. Spotted Owl Surveys in the Action Area The USFS’s Pacific Northwest Research Station conducted spotted owl surveys in the Dosewallips watershed from the mid 1990s until 2005 as part of the Olympic Demography Study. Researchers visited spotted owl activity centers to record the status of historic spotted owl nests, i.e., presence, sex, and age of spotted owls; nesting behavior; presence of barred owls, etc. Because protocol surveys within the action area are lacking, spotted owls may occupy unsurveyed habitat within or adjacent to the action area (Table 1).
10
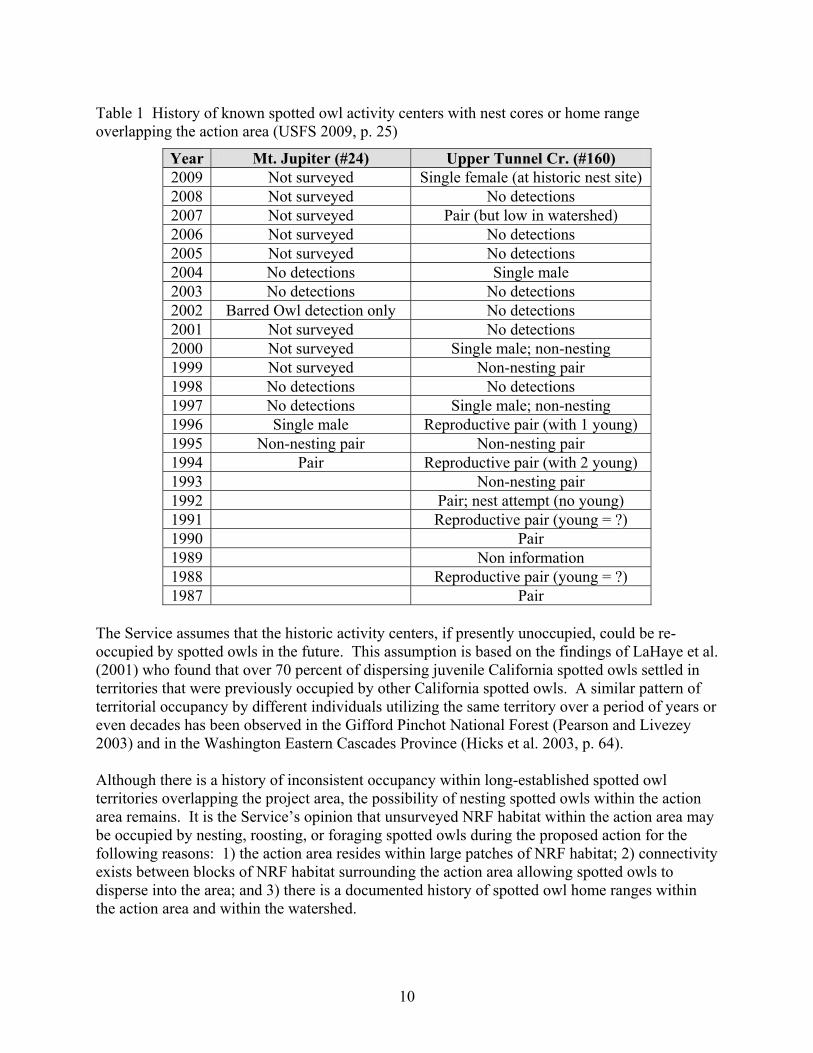
Table 1 History of known spotted owl activity centers with nest cores or home range overlapping the action area (USFS 2009, p. 25)
Year Mt. Jupiter (#24) Upper Tunnel Cr. (#160) 2009 Not surveyed Single female (at historic nest site) 2008 Not surveyed No detections 2007 Not surveyed Pair (but low in watershed) 2006 Not surveyed No detections 2005 Not surveyed No detections 2004 No detections Single male 2003 No detections No detections 2002 Barred Owl detection only No detections 2001 Not surveyed No detections 2000 Not surveyed Single male; non-nesting 1999 Not surveyed Non-nesting pair 1998 No detections No detections 1997 No detections Single male; non-nesting 1996 Single male Reproductive pair (with 1 young) 1995 Non-nesting pair Non-nesting pair 1994 Pair Reproductive pair (with 2 young) 1993 Non-nesting pair 1992 Pair; nest attempt (no young) 1991 Reproductive pair (young = ?) 1990 Pair 1989 Non information 1988 Reproductive pair (young = ?) 1987 Pair
The Service assumes that the historic activity centers, if presently unoccupied, could be re-occupied by spotted owls in the future. This assumption is based on the findings of LaHaye et al. (2001) who found that over 70 percent of dispersing juvenile California spotted owls settled in territories that were previously occupied by other California spotted owls. A similar pattern of territorial occupancy by different individuals utilizing the same territory over a period of years or even decades has been observed in the Gifford Pinchot National Forest (Pearson and Livezey 2003) and in the Washington Eastern Cascades Province (Hicks et al. 2003, p. 64). Although there is a history of inconsistent occupancy within long-established spotted owl territories overlapping the project area, the possibility of nesting spotted owls within the action area remains. It is the Service’s opinion that unsurveyed NRF habitat within the action area may be occupied by nesting, roosting, or foraging spotted owls during the proposed action for the following reasons: 1) the action area resides within large patches of NRF habitat; 2) connectivity exists between blocks of NRF habitat surrounding the action area allowing spotted owls to disperse into the area; and 3) there is a documented history of spotted owl home ranges within the action area and within the watershed.
11
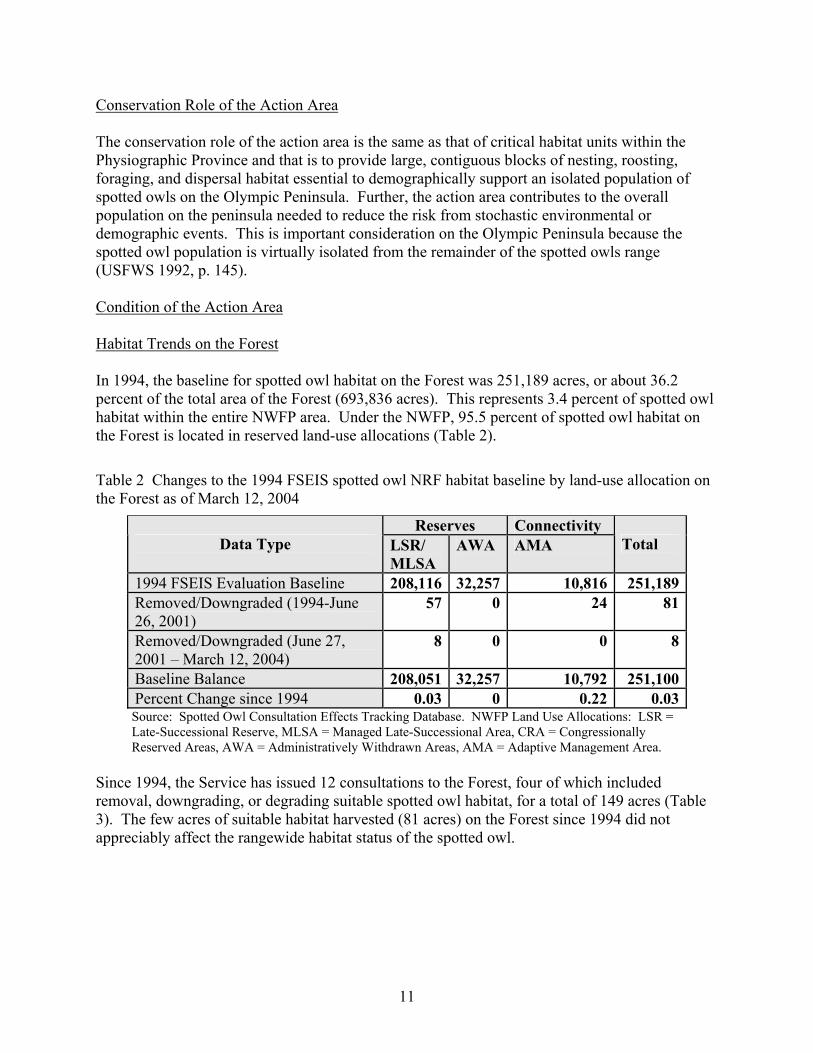
Conservation Role of the Action Area The conservation role of the action area is the same as that of critical habitat units within the Physiographic Province and that is to provide large, contiguous blocks of nesting, roosting, foraging, and dispersal habitat essential to demographically support an isolated population of spotted owls on the Olympic Peninsula. Further, the action area contributes to the overall population on the peninsula needed to reduce the risk from stochastic environmental or demographic events. This is important consideration on the Olympic Peninsula because the spotted owl population is virtually isolated from the remainder of the spotted owls range (USFWS 1992, p. 145). Condition of the Action Area Habitat Trends on the Forest In 1994, the baseline for spotted owl habitat on the Forest was 251,189 acres, or about 36.2 percent of the total area of the Forest (693,836 acres). This represents 3.4 percent of spotted owl habitat within the entire NWFP area. Under the NWFP, 95.5 percent of spotted owl habitat on the Forest is located in reserved land-use allocations (Table 2).
Table 2 Changes to the 1994 FSEIS spotted owl NRF habitat baseline by land-use allocation on the Forest as of March 12, 2004
Reserves Connectivity Data Type LSR/
MLSA AWA AMA Total
1994 FSEIS Evaluation Baseline 208,116 32,257 10,816 251,189Removed/Downgraded (1994-June 26, 2001)
57 0 24 81
Removed/Downgraded (June 27, 2001 – March 12, 2004)
8 0 0 8
Baseline Balance 208,051 32,257 10,792 251,100Percent Change since 1994 0.03 0 0.22 0.03Source: Spotted Owl Consultation Effects Tracking Database. NWFP Land Use Allocations: LSR = Late-Successional Reserve, MLSA = Managed Late-Successional Area, CRA = Congressionally Reserved Areas, AWA = Administratively Withdrawn Areas, AMA = Adaptive Management Area.
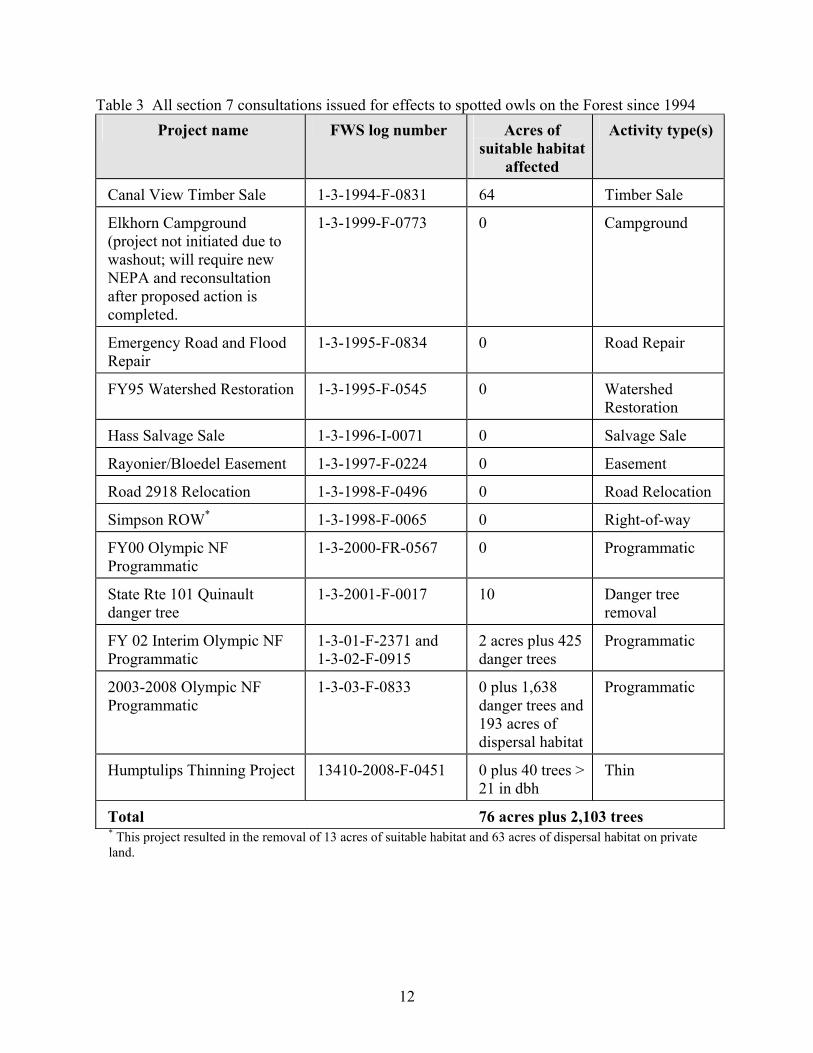
Since 1994, the Service has issued 12 consultations to the Forest, four of which included removal, downgrading, or degrading suitable spotted owl habitat, for a total of 149 acres (Table 3). The few acres of suitable habitat harvested (81 acres) on the Forest since 1994 did not appreciably affect the rangewide habitat status of the spotted owl.
12
Table 3 All section 7 consultations issued for effects to spotted owls on the Forest since 1994 Project name FWS log number Acres of
suitable habitat affected
Activity type(s)
Canal View Timber Sale 1-3-1994-F-0831 64 Timber Sale
Elkhorn Campground (project not initiated due to washout; will require new NEPA and reconsultation after proposed action is completed.
1-3-1999-F-0773 0 Campground
Emergency Road and Flood Repair
1-3-1995-F-0834 0 Road Repair
FY95 Watershed Restoration 1-3-1995-F-0545 0 Watershed Restoration
Hass Salvage Sale 1-3-1996-I-0071 0 Salvage Sale
Rayonier/Bloedel Easement 1-3-1997-F-0224 0 Easement
Road 2918 Relocation 1-3-1998-F-0496 0 Road Relocation
Simpson ROW* 1-3-1998-F-0065 0 Right-of-way
FY00 Olympic NF Programmatic
1-3-2000-FR-0567 0 Programmatic
State Rte 101 Quinault danger tree
1-3-2001-F-0017 10 Danger tree removal
FY 02 Interim Olympic NF Programmatic
1-3-01-F-2371 and 1-3-02-F-0915
2 acres plus 425 danger trees
Programmatic
2003-2008 Olympic NF Programmatic
1-3-03-F-0833 0 plus 1,638 danger trees and 193 acres of dispersal habitat
Programmatic
Humptulips Thinning Project 13410-2008-F-0451 0 plus 40 trees > 21 in dbh
Thin
Total 76 acres plus 2,103 trees * This project resulted in the removal of 13 acres of suitable habitat and 63 acres of dispersal habitat on private land.

13
Connectivity on the Forest Connectivity relative to the 1994 baseline condition was virtually unaffected by consulted-on projects 1994 to the present. A total of 81 acres of suitable habitat was authorized for removal/downgrading (0.03 percent of total suitable owl habitat on Forest). Of this, 57 acres (0.02 percent of all suitable spotted owl habitat) were affected within LSR/Managed Late-Successional Areas as noted above and 24 acres (0.01 percent of all suitable habitat) were affected within Adaptive Management Areas. No dispersal habitat was authorized for removal. The 1996 joint agency consultation (the Park, the Forest, and the Service; Ref. no. 1-3-96-F-0371) covered removal of as many as 350 trees and harassment of spotted owl associated with 59,295 acres of habitat annually associated with restoration, maintenance, and rescue activities during 1996 to 1998. The actual figures for the Park for these effects for the three years were 20, 10, and 15 trees and 61,000, 82,006, and 97,493 acres, respectively. The 2002 Forest Interim Programmatic Biological Opinion authorized the removal of up to 425 danger trees and 2 acres throughout the Forest. Based on the small amount of habitat loss and disturbance that has occurred since 1994, connectivity between the Forest and the Park has not substantially changed since 1994. Threats to the Spotted Owl Threats to the Olympic Peninsula spotted owl population include relatively low numbers of spotted owls, province isolation, and the vulnerability to natural disasters (wind and fire). There is a significant threat to habitat from large-scale windstorms in the western portion of the peninsula and the threat of wildfire in the eastern portion. These threats to habitat create a risk to spotted owl population stability. The recovery strategy is to alleviate these long-term threats to the population by protecting a large proportion of existing spotted owl pairs and reestablishing connections to spotted owl populations in the Washington Cascades and northwestern Oregon. The entire Olympic Peninsula is considered an area of special management emphasis (USDI 1994, p. 144). Barred Owls in the Forest Currently, there is little barred owl information for the Forest. The scant information available suggests that the barred owl’s continued expansion into the range of the spotted owl and their increasing numbers may pose a serious threat to the spotted owl on the Peninsula. In the Park, Gremel (2003, p. 4) reported that occupancy rates of spotted owl sites are decreasing while barred owl detections at most of these spotted owl sites are increasing. Also, he detected no nesting at any of his monitored spotted owl sites on the Peninsula, while he detected barred owls reproduced successfully at four of these sites, fledging at least five juveniles. Gremel (2003, p. 2) reports that there is evidence that the barred owl is now excluding the spotted owl from many areas of the Forest where it was once found. Gremel found that when barred owls invaded spotted owl territories, the spotted owls tended to shift their activity more than 4,000 ft laterally. Spotted owls on the east side of the Peninsula also shifted their activity 386 ft (mean) higher in elevation, while spotted owls on the west side were more likely to keep the same elevation. These movements were significant (P < 0.05) compared to those spotted
14
owls territories where barred owls were not detected. The result of these elevational shifts is that spotted owls sites now occur at an average of 2,495 ft, an increase of over 500 ft from the first year of monitoring in 1992. Spotted owls sites lower than approximately 1,400 ft in elevation along the east side of the Olympic Peninsula are generally unoccupied, and barred owls typically are present at these sites. Gremel (2003, p.1) suggests that this movement of spotted owls away from barred owl activity implies that some portion of the “suitable” spotted owl habitat in the Park is now unavailable to spotted owls. Climate Change Climate change, and the related warming of global climate, has been well documented in the scientific literature. Evidence includes increases in average air and ocean temperatures, widespread melting of snow and glaciers, and rising sea level. Given the increasing certainty that climate change is occurring and is accelerating, we can no longer assume that climate conditions in the future will resemble those in the past. Further, increased vulnerability to catastrophic wildfires may occur as climate change alters the structure and distribution of forests. Observations of the direct and indirect effects of global climate change include changes in species ranges and a wide array of environmental trends, including disturbances in the balance of forest insect pests.
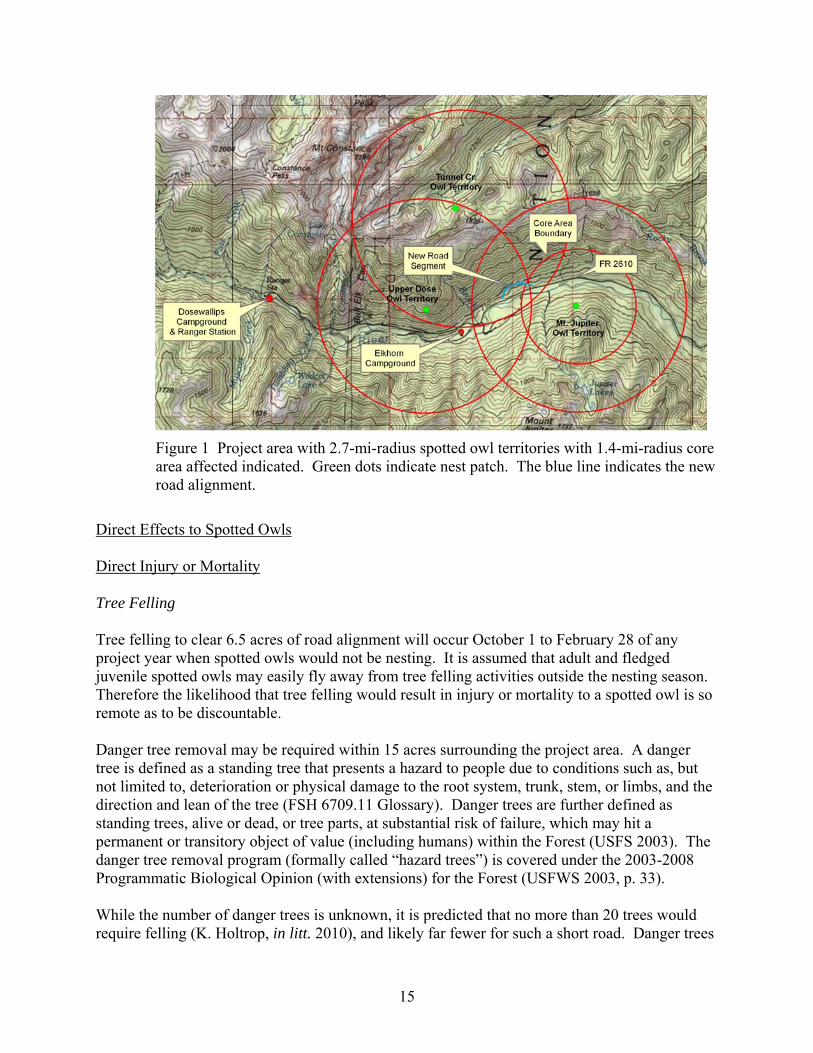
Increased occurrences of fire and/or insect damage could decrease potential suitable spotted owl habitat, which would put added importance on the remaining stands that contain suitable spotted owl habitat or potential habitat in the future, such as younger stands that are managed to become suitable habitat. Removal of habitat, such as in the proposed action, increases the risk to the species, albeit to a small degree. EFFECTS OF THE ACTION - Spotted Owls This section evaluates the overall effects of the proposed action with respect to the conservation needs of the spotted owl within the action area, the physiographic province, and rangewide. The section 7 implementing regulations define “effects of the action” as “the direct and indirect effects of an action on the species together with the effects of other activities that are interrelated or interdependent with that action, that will be added to the environmental baseline” (50 C.F.R. 402.02). “Indirect effects” are those that are caused by the proposed action and are later in time, but are still reasonably certain to occur. The action area is overlapped by three spotted owl homeranges. Two home ranges are historic sites while a third homerange is a computer-generated homerange as a result of the Northern Spotted Owl Occupancy Map (NSOOM) analysis (USFWS et al. 2008) (See Figure 1).
15
Figure 1 Project area with 2.7-mi-radius spotted owl territories with 1.4-mi-radius core area affected indicated. Green dots indicate nest patch. The blue line indicates the new road alignment.
Direct Effects to Spotted Owls Direct Injury or Mortality Tree Felling Tree felling to clear 6.5 acres of road alignment will occur October 1 to February 28 of any project year when spotted owls would not be nesting. It is assumed that adult and fledged juvenile spotted owls may easily fly away from tree felling activities outside the nesting season. Therefore the likelihood that tree felling would result in injury or mortality to a spotted owl is so remote as to be discountable. Danger tree removal may be required within 15 acres surrounding the project area. A danger tree is defined as a standing tree that presents a hazard to people due to conditions such as, but not limited to, deterioration or physical damage to the root system, trunk, stem, or limbs, and the direction and lean of the tree (FSH 6709.11 Glossary). Danger trees are further defined as standing trees, alive or dead, or tree parts, at substantial risk of failure, which may hit a permanent or transitory object of value (including humans) within the Forest (USFS 2003). The danger tree removal program (formally called “hazard trees”) is covered under the 2003-2008 Programmatic Biological Opinion (with extensions) for the Forest (USFWS 2003, p. 33). While the number of danger trees is unknown, it is predicted that no more than 20 trees would require felling (K. Holtrop, in litt. 2010), and likely far fewer for such a short road. Danger trees

16
will be felled during initial road corridor clearing to the maximum extent practicable. It is assumed that like other trees that will be felled, danger trees will be felled to minimize damage to “late-successional forests.” Therefore, the likelihood of injury or mortality to a spotted owl as a result of danger tree clearing is so low that it would be discountable. There is a possibility that danger trees that were overlooked during initial road corridor clearing, or trees originally identified as healthy trees may develop into a danger trees. These danger trees must be felled during road construction, and thus possibly during the early nesting season. It is expected that no more than three danger trees per year (no more than 9 total danger trees) will be felled during any nesting season during the life of the project. The probability that danger trees would contain nesting spotted owls is low. Disturbance from alignment tree felling before the nesting season and road building activities during the nesting season would likely discourage nesting attempts in the project area. Further, other high quality nesting habitat exists nearby. Therefore, the likelihood of direct injury or mortality to adults, nestlings, or eggs as a result of felling danger trees during the nesting season is so low that it would be discountable. Helicopter Use A large helicopter, such as a Boeing Vertol 107 may be used to transport felled trees. Expected timing of helicopter flights would be soon after felling outside the entire nesting season (March 1 to September 30). Expected duration of helicopter flights would not exceed 5 consecutive days and likely span the entire daily work window from 2 hr after sunrise to 2 hr before sunset. Flights to and from the road alignment would exceed 1,000 ft above ground level to minimize noise exposure and helicopter propeller-generated wind (prop wash) to adjacent habitat. The only area expected to be exposed to prop wash is the 6.5 acres that will be cleared. Prop wash is not expected to propagate significantly into adjacent trees. It is expected that any spotted owls using the area will avoid the area when road alignment trees are initially felled and again when helicopter operations begin. Given these factors, the likelihood that spotted owls will be exposed to prop wash is so low as to be discountable. Exposure of Adults and Juveniles to Disturbance Spotted owls are susceptible to disturbance during the early breeding season. Road building activities that require the use of chainsaws, heavy equipment, helicopters, and blasting all introduce increased levels of sound, and thus disturbance, into the action area. The Service previously completed an analysis of potential disturbance (visual and sound) from common management activities to spotted owls (USFWS 2003, pp. 264-285). In that analysis, the Service concluded that behaviors indicating potentially significant disruptions to normal behavior are flushing from an active nest and aborted feedings to young. These determinations and the associated injury threshold distances are based on research by Delaney et al. (1999, p. 68) who documented that Mexican spotted owls (Strix occidentalis lucida) flushed from their roosts when chainsaws were operated within a distance of 197 ft (60 m). Delaney et al. (1999, p. 68) found that Mexican spotted owls, during both the nesting season and the non-nesting season, did not

17
flush from helicopter noise unless the noise was at least 92 dBA. Noises as low as of 92-95 dBA can cause spotted owls to flush, so we set the sound-only injury threshold at 92 dBA. Based on the findings of Delaney et al. (1999), we assume that spotted owls may be susceptible to disturbance during the early breeding season. Consequently, the Service considers activities using heavy equipment, chainsaws, aircraft or blasting during the early breeding season (March 1 to July 15) to have the potential to significantly disrupt spotted owl breeding, feeding or sheltering. Sound generating activities that occur during the later half of the spotted owl breeding season (July 16 to Sept. 30) would not be likely to disrupt nesting spotted owls. After July 16, juvenile spotted owlets are no longer completely dependent upon the adults and are able to thermoregulate, fly, and forage on their own thereby reducing their susceptibility to disturbance-related effects. Helicopter Use The San Dimas Technology and Development Center (Simonson 2009, Results Chapter, p. 7), in San Dimas, California (San Dimas) was contracted by the Olympic National Forest to analyze sound levels of two helicopters often used for logging in Washington and Oregon which included the Vertol 107. San Dimas found that the noise from this helicopter reached 92 dBA at 450 ft (97.5 C.I). The Forest used the 450 ft distance from the 6.5 acre polygon from which logs will be transported to calculate the 62 acres of suitable habitat that will be exposed to elevated helicopter noise. Helicopter flights will occur outside the nesting season. It is expected that any spotted owls using the area will temporarily avoid the work area when road alignment trees are initially felled and again when helicopter operations begin. Therefore, the degree that helicopter use will disrupt normal behavior would be immeasurable and would therefore be insignificant. Heavy Equipment Heavy equipment would be used both during initial tree clearing and road construction throughout the construction period. In a previous analysis, the Service determined that the injury threshold distance for heavy equipment (using 92 dBA for injury threshold) was 35 yd (USFWS 2003, pp. 264-285). For the proposed action, we expect heavy equipment to include such machinery as bulldozers, graders, trackhoes, and backhoes. Using GIS, the Forest mapped a 35 yd buffer zone for the proposed road alignment and found the total area of sound exposure from heavy equipment to be 22 acres, 16 acres of which are suitable habitat. However, other loud machinery will be required to complete the proposed action that exceeds these threshold contours. The loudest of these includes pile drivers. Using information available to the Service, we found that pile drivers can create 92 dBA at 88 yd (FHWA 2010). Using geographic information system (GIS), the Service calculated that 52 acres, 38 acres of which are suitable habitat, will be exposed to disturbance from pile driving during the nesting season. Long-term monitoring in the Park indicates that the general location of individual spotted owl territories is fairly stable, but the site center (i.e. nest tree) can shift from year to year. Some site

18
centers that Park personnel monitor are more than 2 kilometers (km) from their original site locations (Gremel 2007, p. 11). For the purposes of analysis for the proposed action, we used the core area as the area as the possible extent in which a spotted owl pair may shift their nest tree from year to year. Because the Mt. Jupiter homerange has not been surveyed in many years, and considering spotted owl nest fidelity, we must assume that there is a reasonable probability that a nesting spotted owl pair may be exposed to disturbance from the proposed action. Disturbance to a nesting spotted owl pair during the nesting season would result in a significant disruption of essential behaviors. Blasting Blasting may be used to complete the proposed action and will likely occur during the nesting season. Mitigation measures will be employed to minimize noise exposure to spotted owls. These may include backfilling blast holes with granular material and covering blast areas with rubber blasting mats and/or soil overburden to attenuate blasting noise. Injury threshold distances for blasting used in past consultations identified a maximum disturbance threshold distance for the spotted owl as 1 mi for loads under 2 lb. This distance was used as a default value due to a lack of empirical data. However, the following blasting information, including that specific to the proposed action, was obtained from Federal Highway Administration (FHWA) (E. Carlsen, FHWA, pers. comm. 2009) and leads us to the following assumptions:
1) Baseline sound levels for the prescribed blast load and landscape position is predicted at 126 dBA1 at 50 ft2.
2) Sound attenuation from the use of rubber blast mats or 4 buckets of soil overburden amounts to 10 dBA within 33 ft for charges similar to what will be used for the proposed action.
3) Natural sound attenuation levels occur at a rate of 5 dBA per 100 ft of vegetated landscape, up to 10 dBA maximum.
4) There will be a general attenuation rate of 7.5 dBA per doubling of distance over "soft" sites (sites that contain vegetation).
Calculating sound levels using the aforementioned mitigation measures and sound attenuation rates yields no more than 126 dBA at 50 ft (or 92 dBA at 182 ft [60.6 yd]). Blasts using these attenuation techniques have been described and a low rumble and not the sharp report that is typically associated with blasting (E. Carlsen, pers. comm. 2009). Therefore we assume that a spotted owl response to attenuated blasting will be no different than other noise generators. Since the distance at which blasts reach the 92 dBA contour is less than that of heavy equipment described above, we do not expect any additional acreage in sound disturbance exposure.
1 It is assumed that this value includes 2 standard deviations. 2 It is possible to ensure blasts do not exceed a prescribed sound level by specifying within contracts required limits of peak particle velocity, overblast pressure, and other parameters.

19
Chainsaw Use Chainsaws would be used to clear 6.5 acres of suitable spotted owl nesting, roosting, and foraging habitat for the new road alignment. Forest clearing will occur between October 1 and February 28, outside the nesting season. Since tree cutting will occur outside the nesting season, only adults and fledged young will be exposed to chainsaw noise and could easily fly away from the disturbance. This response would not significantly disrupt normal behavior. Danger trees will also be felled during initial tree clearing. Areas within 100 ft of the top of the bank cut or the toe of fill will be cleared of danger trees. Since danger tree cutting will occur outside the nesting season, only adults and fledged young will be exposed to chainsaw noise and could easily fly away from the disturbance. This response would not represent a significant disruption of normal behavior. Therefore, the amount of disturbance from all chainsaw use outside the nesting season would be so low as to be insignificant. Additional danger trees may be identified after road construction has begun. These will require felling trees during the nesting season, and possibly during the early nesting season. Up to 3 trees per year may require felling during the nesting season. From the Service’s sound response analysis (USFWS 2003, pp. 264-285), it was determined that 92 dBA of sound from chainsaw use would extend 65 yd (135 ft) from the source. However, the 92 dBA contour for pile drivers and the resultant area of disturbance exposure overshadows that for chainsaws. Therefore, the Service will lump the chainsaw disturbance area with the heavy equipment disturbance area. Nonetheless, spotted owls will experience a significant disruption of essential behaviors during the construction period due to chainsaw use. However, the effect of chainsaw use will not change the effects to the single nesting spotted owl pair that would be exposed to disturbance from the proposed action. Indirect Effects to Spotted Owls Indirect effects are defined as those effects that are caused by, or will result from, the proposed action at a later time, but still reasonably certain to occur (50 CFR 402.02). The proposed action will result in the loss of 6.5 acres of suitable nesting, roosting, and foraging habitat. The new alignment will create a new edge in the forest and re-expose 5 mi of road and 2 campgrounds to increased human use. After the project has been completed, any additional and future danger tree removal will be considered road maintenance under the existing programmatic biological opinion. Effects to Historic Spotted Owl Activity Centers and Home Range Circles Timber harvest can affect spotted owls by reducing the total amount of NRF habitat within a spotted owl's home range. The result may be that the owls continue to persist at the territory, but marginal habitat conditions in the territory may compromise the spotted owl's ability to survive and successfully reproduce at that site. This is the basis for the Service’s incidental take thresholds for the loss of NRF habitat within a spotted owl home range (USFWS in litt. 1990, USFWS 1995).
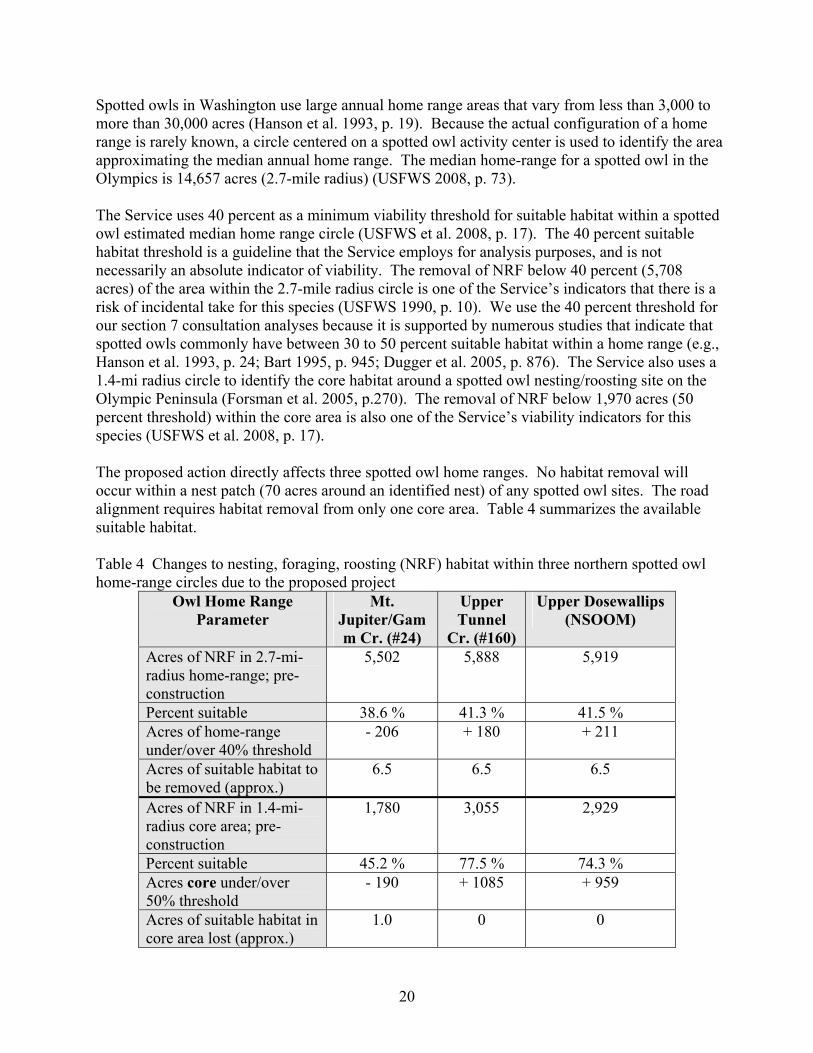
20
Spotted owls in Washington use large annual home range areas that vary from less than 3,000 to more than 30,000 acres (Hanson et al. 1993, p. 19). Because the actual configuration of a home range is rarely known, a circle centered on a spotted owl activity center is used to identify the area approximating the median annual home range. The median home-range for a spotted owl in the Olympics is 14,657 acres (2.7-mile radius) (USFWS 2008, p. 73). The Service uses 40 percent as a minimum viability threshold for suitable habitat within a spotted owl estimated median home range circle (USFWS et al. 2008, p. 17). The 40 percent suitable habitat threshold is a guideline that the Service employs for analysis purposes, and is not necessarily an absolute indicator of viability. The removal of NRF below 40 percent (5,708 acres) of the area within the 2.7-mile radius circle is one of the Service’s indicators that there is a risk of incidental take for this species (USFWS 1990, p. 10). We use the 40 percent threshold for our section 7 consultation analyses because it is supported by numerous studies that indicate that spotted owls commonly have between 30 to 50 percent suitable habitat within a home range (e.g., Hanson et al. 1993, p. 24; Bart 1995, p. 945; Dugger et al. 2005, p. 876). The Service also uses a 1.4-mi radius circle to identify the core habitat around a spotted owl nesting/roosting site on the Olympic Peninsula (Forsman et al. 2005, p.270). The removal of NRF below 1,970 acres (50 percent threshold) within the core area is also one of the Service’s viability indicators for this species (USFWS et al. 2008, p. 17). The proposed action directly affects three spotted owl home ranges. No habitat removal will occur within a nest patch (70 acres around an identified nest) of any spotted owl sites. The road alignment requires habitat removal from only one core area. Table 4 summarizes the available suitable habitat. Table 4 Changes to nesting, foraging, roosting (NRF) habitat within three northern spotted owl home-range circles due to the proposed project
Owl Home Range Parameter
Mt. Jupiter/Gamm Cr. (#24)
Upper Tunnel
Cr. (#160)
Upper Dosewallips (NSOOM)
Acres of NRF in 2.7-mi-radius home-range; pre-construction
5,502 5,888
5,919
Percent suitable 38.6 % 41.3 % 41.5 % Acres of home-range under/over 40% threshold
- 206 + 180 + 211
Acres of suitable habitat to be removed (approx.)
6.5 6.5 6.5
Acres of NRF in 1.4-mi-radius core area; pre-construction
1,780 3,055
2,929
Percent suitable 45.2 % 77.5 % 74.3 % Acres core under/over 50% threshold
- 190 + 1085 + 959
Acres of suitable habitat in core area lost (approx.)
1.0 0 0
21
Mt. Jupiter The proposed action will remove habitat from the home range and core areas. The loss of 6.5 acres of suitable from the homerange and of which 1.0 acre of suitable habitat will be removed from the core area are likely to adversely affect spotted owls. Because both the core and home-range are below threshold levels for suitable habitat, the proposed action would also result in take. The loss of foraging habitat within the 1.4-mi-radius core area reduces prey availability to the spotted owls during their critical summer nesting period, when they are most dependant upon the core area for foraging (Forsman et al. 1984, p. 21). This habitat loss will likely impair essential foraging behavior, especially when core habitat is below the 50 percent threshold. Due to the limited number of acres that will be removed (6.5) from the territory and that initial tree felling will occur outside the nesting season, we do not expect that the spotted owls would abandon their nesting attempt, or that the nesting attempt would fail as a direct result of the proposed action. However, reduced foraging habitat at the core area scale could indirectly effect juvenile owl development through missed feedings or delayed development, which creates a potential for reduced fitness of individual owlets for dispersal away from the nest site in the fall. Death by starvation during dispersal is common for juvenile spotted owls (Forsman et al. 2002, p. 18). Upper Tunnel Cr. The proposed action will remove habitat from the home range but will not result in a reduction that will fall below the 50 percent suitable habitat threshold (adverse effects). No core habitat will be removed. Therefore, the proposed action will adversely affect spotted owls but take is not anticipated. Dosewallips NSOOM Territory The proposed action will remove habitat from the home range but will not result in a reduction that will fall below the 50 percent suitable habitat threshold (adverse effects). No core habitat will be removed. Therefore, the proposed action will adversely affect spotted owls but take is not anticipated. Nest Tree Loss Tree felling will not occur within any known nest patches. In the unlikely event that spotted owls have established nest trees within the action area, tree felling would occur outside the nesting season. Further, spotted owl pairs on the Olympic Peninsula use different nest trees within their territory over subsequent years (Gremel 2007, p. 8), and most spotted owl territories have numerous potential nest trees. Spotted owls have been known to use the same nest stand even after their nest tree had fallen due to wind, fire or decay. Therefore, we assume that the loss of a nest tree outside the nesting season would result in the pair selecting another nest tree within the same territory, without a significant disruption of nesting behavior. The effects of nest tree loss would be so small as to be insignificant.

22
New Edge Effect The removal of 6.5 acres of forest will create a new forest edge. Spotted owls nesting near the forest edges created by tree harvest are expected to be exposed to windthrown trees and changes in microclimate. Windthrow New forest edges often increase windthrow. Increased windthrow may result in adverse effects to suitable spotted owl habitat by downing and/or damaging suitable nest trees. During the nesting season, nesting spotted owls could be injured or killed by falling trees. However, trees that pose a threat of falling and injuring workers or equipment (danger trees) would be removed during the initial road alignment clearing during the non-nesting season. This lessens the occurrence of trees with the potential to be windthrown. Further, the Forest expects no more than three danger trees will need to be felled each year during the nesting season further lessening the potential for windthrow. Therefore, the loss of suitable habitat due to windthrow is so remote as to be discountable. Further, the potential for windthrow trees to strike spotted owl nests is so remote as to be discountable. Microclimate New forest edges often influence the microclimate within the adjacent forest which could affect nesting spotted owls. However, the road surface will be narrow (about 14 ft) and the cleared corridor somewhat wider, depending on slope and road design, but not substantially so. The corridor will also be short, about 0.8 mi long. Due to the small dimensions of the new road corridor, the effect of a new forest edge on spotted owl habitat microclimate would be so small as to be insignificant. Highway Noise There is an increasing body of evidence supporting the existence of substantial disturbance to roadside resident wildlife from traffic. This includes noise, visual disturbance from passing vehicles, and the risk of collision with cars and trucks. Traffic noise can create acoustic interference (or masking) which reduces the distance over which acoustic signals such as song can be detected. Traffic noise could hamper detection of song by conspecifics, making it more difficult for birds to establish and maintain territories, attract mates and maintain pair bonds, and possibly leading to reduced breeding success in noisy roadside habitats (Parris and Schneider 2008). Most of the new research on this issue has been on smaller species of birds (Order: Passeriformes) whose territories are often small (1 to 5 ha). By contrast, spotted owl territories are very large (about 14,000 acres), thus reducing the significance of sound from traffic affecting a small proportion of their territory. Based on recent Service analysis (USFWS 2003, pp. 264-285) of the potential for injury associated with disturbance to spotted owls, we estimated a combined sight- and sound-injury threshold distance for different noise generating activities using the sound-only injury threshold of 92 dBA. Most vehicles do not reach this sound

23
threshold at any distance. Further, vehicular speeds would be modest due to the road’s narrow width and many curves (posted vehicle speeds would be 25 mph). Slower speeds would not generate very loud traffic noise. It is unlikely that spotted owls would be exposed to sound levels that would create a significant disruption of nesting behaviors. Therefore the response of spotted owls to increased disturbance within suitable habitat adjacent to the new road alignment, 5 mi of FSR 2610, and two campgrounds would be so small as to be insignificant. Vehicle-Spotted Owl Collisions Spotted owls are most active at night while hunting. Vehicles-spotted owl collisions would be unlikely because few vehicles travel these roads at night. Further, vehicular speeds would be modest due to the road’s narrow width and many curves (posted vehicle speeds would be 25 mph). Slower speeds would decrease the potential for vehicle-spotted owl collisions by allowing an owl enough time for evasive maneuvers. Finally, vehicle traffic is usually light on this road. The noise from one vehicle would be less likely to mask the approach of another. Considering all these circumstances, the likelihood that reconnecting the FSR 2610 will cause vehicle-spotted owl mortality is so small as to be discountable. Road Maintenance Future forest activities that would likely occur relative to the proposed action, as with any road, would include road maintenance and danger tree removal. The 5-year Programmatic Biological Opinion (USDI 2003, p. 34) authorizes the removal of up to 300 potential nest trees (at least 21 in dbh) per year as danger trees, and 2,200 mi of road maintenance per year over the entire Forest over the life of the 2003-2008 Programmatic Biological Opinion (with extensions). This equates to one tree less than 36 inch dbh per 0.5 mi of road. Future road maintenance is outside the analysis of this Opinion and will not be addressed further here. Summary of Proposed Action Effects on the Spotted Owl Three spotted owl homeranges overlap the action area: two are historic and one is a computer-generated homerange as a result of the NSOOM analysis. We do not expect exposure of spotted owls in the action area to direct injury or mortality. We do expect spotted owls will be exposed to the effects of disturbance and habitat removal. Spotted owls will be exposed to helicopter noise outside the nesting season, but we determined that the effects would be insignificant. However, noise created by heavy equipment, including pile driving, that will be used to construct the new road alignment during the nesting season will expose spotted owls to disturbance. We calculated that 38 acres of suitable spotted owl habitat will be exposed to heavy equipment noise of 92 dBA, and above. Also, blasting will occur along the east end of the road during the nesting season. However, blasting using modern attenuations measures would not exceed sound levels of pile driving. Chainsaw use during the nesting season would also not exceed sound levels of pile driving. We established that individual spotted owl territories can shift from year to year and can exceed 2 km from their original site locations. Therefore, we used the 1.4 mi radius core area as the possible extent in which a spotted owl pair may shift their nest. Because road construction

24
disturbance will occur during the nesting season and within a core area, there is a likelihood that the proposed action would significantly disrupt essential behaviors to a single spotted owl breeding pair associated with the Mt. Jupiter homerange. The new road alignment will remove 6.5 acres of high quality suitable spotted owl habitat within the outer core of three spotted owl homeranges. Of the total 6.5 acres of suitable habitat that will be removed, about 1 acre occurs in the Mt. Jupiter core area (1.4-mi radius circle), the only core area affected. This home range is below the 40 percent threshold for suitable habitat (38.6 percent) while the core area is below the 50 percent threshold for suitable habitat (45.2 percent). The removal of suitable habitat below the 40 percent threshold for the homerange and below the 50 percent threshold for the core area are the Service’s viability indicators for the species. Because the Mt. Jupiter territory is below the suitable habitat thresholds for both the homerange and the core area, the loss of 6.5 acres of suitable habitat will adversely affect spotted owls and will result in take of the nesting pair. Reduced foraging habitat at the core area scale could indirectly effect juvenile owl development through missed feedings or delayed development, which creates a potential for reduced fitness of individual owlets for dispersal away from the nest site in the fall. The effect of the proposed action on the Upper Tunnel Creek and the Dosewallips NSOOM territory will result in adverse effects to spotted owls, but take is not anticipated. Because habitat within the two homeranges will be reduced slightly (6.5 acres), we expect spotted owls will continue to persist and potentially reproduce in these territory after the proposed action is completed. Bart and Forsman (1992, p. 98) found that spotted owls in some landscapes were capable of reproducing in areas with as little as 20 percent suitable habitat within the home range. However, habitat loss within the home range will increases the potential for negative competitive interactions with barred owls (Strix varia) (USFWS 2008, p. 34, pp. 65-68). Also, the effects of nest tree loss outside the nesting season, the new forest edge including the potential of windthrow and microclimate change, highway noise, and vehicle-spotted owl collisions would all be insignificant or discountable to the spotted owl. The effects of the proposed action will result in adverse effects to three nesting pair of spotted owls due to habitat loss. However, take will only occur within the Mt. Jupiter homerange. The proposed action will result in significant disruption of normal behaviors from disturbance and habitat loss. The proposed action will result in the take of one breeding pair of spotted owls associated with the Mt. Jupiter homerange. However, the proposed action is not likely to appreciably reduce the likelihood of survival and recovery of the spotted owl in the wild at the Province level or rangewide by reducing the species numbers, reproduction, or distribution. See Table 5 for a summary of the effects of the proposed action on spotted owls.

25
Table 5 Summary of the effects of the proposed action on spotted owls
STATUS OF NORTHERN SPOTTED OWL CRITICAL HABITAT Please refer to Appendix 2 for an updated account of the status of spotted owl critical habitat rangewide. STATUS OF NORTHERN SPOTTED OWL CRITICAL HABITAT - OLYMPIC PENINSULA PHYSIOGRAPHIC PROVINCE Physiographic Province Critical Habitat Trends Current Condition Included in this Province are CHUs WA-43 through WA-52, consecutively, encompassing Clallam, Jefferson, Mason, and Grays Harbor counties. Almost all the acreage of these 10 CHUs occurs within the Forest or 387,295 acres of the total 398,743 acres, or 96.1 percent (Table 6) (USFWS 2004, p. 35). All of the CHUs in the Province are intended to serve as a single, large interactive unit for the interior of the Olympic Peninsula.
Proposed Action Activity
Seasonal Timing Outside nesting =O Inside nesting = I
Amount In Acres
Discountable/ Insignificant
Adverse Effects
Direct Effects Tree Felling O 6.5 X Helicopter Prop Wash O 6.5 X Danger Tree Felling O 15 X Heavy Equipment Disturbance
I 38 X
Blasting Disturbance I Overshadowed by heavy
equipment
X
Chainsaw Disturbance I Overshadowed by heavy
equipment
X
Indirect Effects Habitat Loss (home-range)
O 6.5 X
Nest Loss/Relocation O ---- X Windthrow Change I ---- X Microclimate Change I ---- X Highway Noise I ---- X Vehicle-Spotted Owl collisions
I ---- X
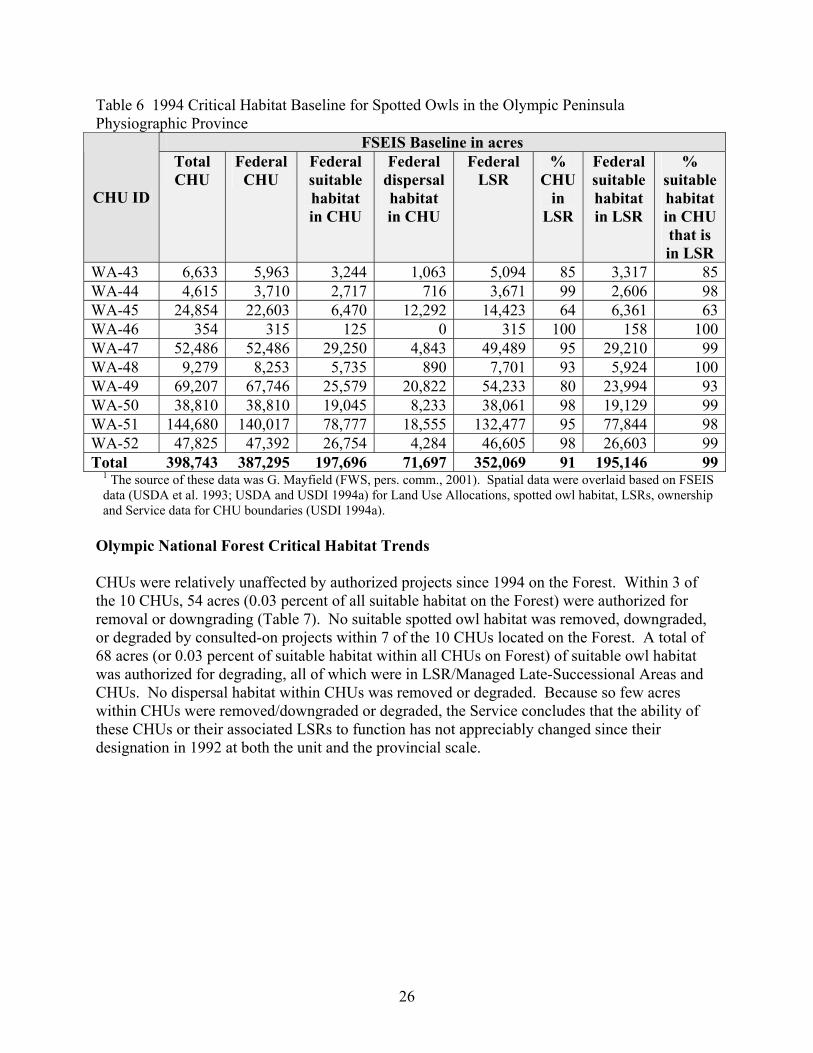
26
Table 6 1994 Critical Habitat Baseline for Spotted Owls in the Olympic Peninsula Physiographic Province
FSEIS Baseline in acres
CHU ID
Total CHU
Federal CHU
Federal suitable habitat in CHU
Federal dispersal habitat in CHU
Federal LSR
% CHU
in LSR
Federal suitable habitat in LSR
% suitable habitat in CHU that is in LSR
WA-43 6,633 5,963 3,244 1,063 5,094 85 3,317 85WA-44 4,615 3,710 2,717 716 3,671 99 2,606 98WA-45 24,854 22,603 6,470 12,292 14,423 64 6,361 63WA-46 354 315 125 0 315 100 158 100WA-47 52,486 52,486 29,250 4,843 49,489 95 29,210 99WA-48 9,279 8,253 5,735 890 7,701 93 5,924 100WA-49 69,207 67,746 25,579 20,822 54,233 80 23,994 93WA-50 38,810 38,810 19,045 8,233 38,061 98 19,129 99WA-51 144,680 140,017 78,777 18,555 132,477 95 77,844 98WA-52 47,825 47,392 26,754 4,284 46,605 98 26,603 99Total 398,743 387,295 197,696 71,697 352,069 91 195,146 99
1 The source of these data was G. Mayfield (FWS, pers. comm., 2001). Spatial data were overlaid based on FSEIS data (USDA et al. 1993; USDA and USDI 1994a) for Land Use Allocations, spotted owl habitat, LSRs, ownership and Service data for CHU boundaries (USDI 1994a).
Olympic National Forest Critical Habitat Trends CHUs were relatively unaffected by authorized projects since 1994 on the Forest. Within 3 of the 10 CHUs, 54 acres (0.03 percent of all suitable habitat on the Forest) were authorized for removal or downgrading (Table 7). No suitable spotted owl habitat was removed, downgraded, or degraded by consulted-on projects within 7 of the 10 CHUs located on the Forest. A total of 68 acres (or 0.03 percent of suitable habitat within all CHUs on Forest) of suitable owl habitat was authorized for degrading, all of which were in LSR/Managed Late-Successional Areas and CHUs. No dispersal habitat within CHUs was removed or degraded. Because so few acres within CHUs were removed/downgraded or degraded, the Service concludes that the ability of these CHUs or their associated LSRs to function has not appreciably changed since their designation in 1992 at both the unit and the provincial scale.
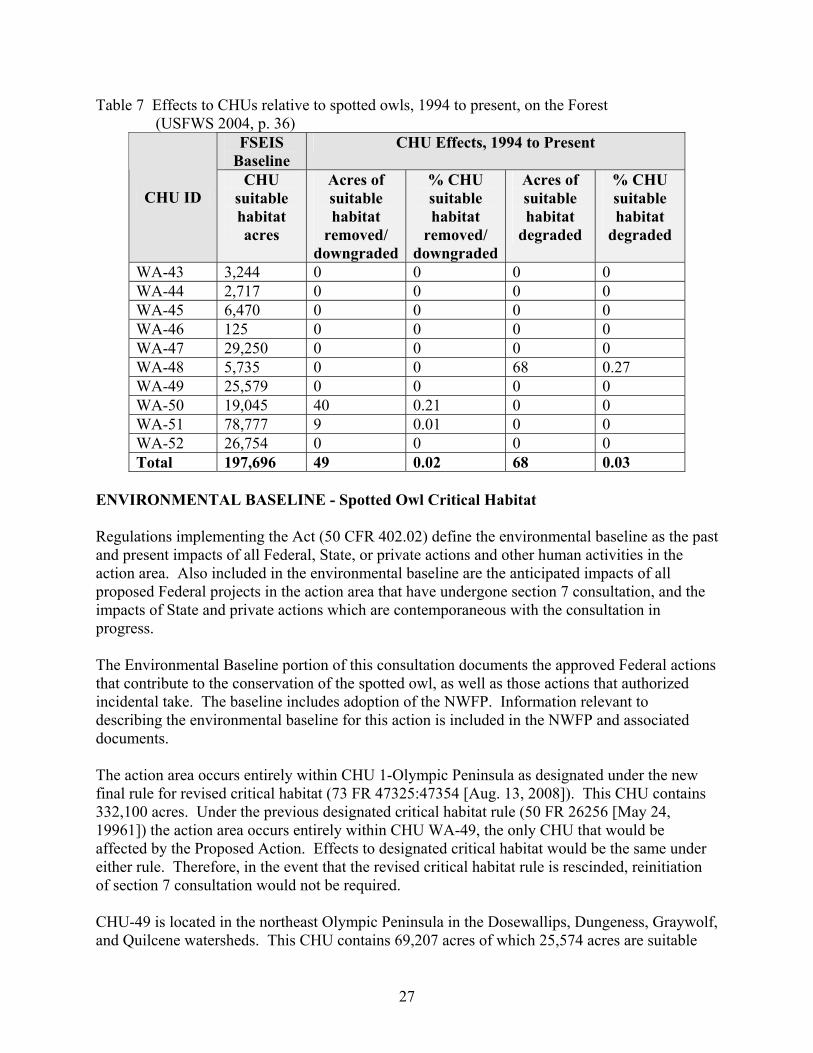
27
Table 7 Effects to CHUs relative to spotted owls, 1994 to present, on the Forest (USFWS 2004, p. 36)
FSEIS Baseline
CHU Effects, 1994 to Present
CHU ID CHU
suitable habitat acres
Acres of suitable habitat
removed/ downgraded
% CHU suitable habitat
removed/ downgraded
Acres of suitable habitat
degraded
% CHU suitable habitat
degraded
WA-43 3,244 0 0 0 0 WA-44 2,717 0 0 0 0 WA-45 6,470 0 0 0 0 WA-46 125 0 0 0 0 WA-47 29,250 0 0 0 0 WA-48 5,735 0 0 68 0.27 WA-49 25,579 0 0 0 0 WA-50 19,045 40 0.21 0 0 WA-51 78,777 9 0.01 0 0 WA-52 26,754 0 0 0 0 Total 197,696 49 0.02 68 0.03
ENVIRONMENTAL BASELINE - Spotted Owl Critical Habitat Regulations implementing the Act (50 CFR 402.02) define the environmental baseline as the past and present impacts of all Federal, State, or private actions and other human activities in the action area. Also included in the environmental baseline are the anticipated impacts of all proposed Federal projects in the action area that have undergone section 7 consultation, and the impacts of State and private actions which are contemporaneous with the consultation in progress. The Environmental Baseline portion of this consultation documents the approved Federal actions that contribute to the conservation of the spotted owl, as well as those actions that authorized incidental take. The baseline includes adoption of the NWFP. Information relevant to describing the environmental baseline for this action is included in the NWFP and associated documents. The action area occurs entirely within CHU 1-Olympic Peninsula as designated under the new final rule for revised critical habitat (73 FR 47325:47354 [Aug. 13, 2008]). This CHU contains 332,100 acres. Under the previous designated critical habitat rule (50 FR 26256 [May 24, 19961]) the action area occurs entirely within CHU WA-49, the only CHU that would be affected by the Proposed Action. Effects to designated critical habitat would be the same under either rule. Therefore, in the event that the revised critical habitat rule is rescinded, reinitiation of section 7 consultation would not be required. CHU-49 is located in the northeast Olympic Peninsula in the Dosewallips, Dungeness, Graywolf, and Quilcene watersheds. This CHU contains 69,207 acres of which 25,574 acres are suitable
28
habitat. The Proposed Action would occur in the southern portion of the CHU. Since 1994, the Service has authorized the removal of 5 acres of NRF habitat in this CHU, thus the current baseline for CHU is 25,574 acres of NRF habitat. However, these figures may be inaccurate due to the Constance Fire of 2009. This fire occurred within both the Park and the Forest and burned a total of 440 acres. The fire reached Constance Creek and Bull Elk Creek which is within CHU WA-09. The total acreage of suitable habitat destroyed, and how much of that occurred on the Forest has not yet been determined (Gremmel 2010). Conservation Role of the Critical Habitat
The function of all of the CHUs in the Olympic Peninsula Province is to provide large, contiguous blocks of nesting, roosting, foraging, and dispersal habitat essential to demographically support an isolated population of spotted owls on the Olympic Peninsula. CHU-49 was designated with the expectation that it should support clusters of over 137 owl pairs by providing large contiguous blocks of nesting, roosting, foraging, and dispersal habitat (M. Tehan, in litt. June 8, 1992, p. 4). Condition of the Critical Habitat
Spotted owl habitat within the action area varies in quality from late successional forests with multiple layers, large trees, downed logs, and snags that provide spotted owl nesting, roosting, and foraging habitat, to riparian forests that may provide roosting opportunities, to single canopy forest, which may only function as spotted owl dispersal habitat (USFS 2009, p. 16). The current consultation baseline for the CHU is 69,207 acres, less than 40 percent of which is suitable habitat and 30 percent is dispersal habitat (USFS 2009. p. 18). EFFECTS OF THE ACTION - Spotted Owl Critical Habitat Effects to the1992 Spotted Owl Critical Habitat Designation The Service originally designated critical habitat for the spotted owl in 1992. The 1992 designation was superseded by the 2008 critical habitat designation. For various reasons, the Service has formally requested that the 2008 critical habitat designation be remanded back to the 1992 designation. This voluntary remand has not been approved by a Federal court, and the 2008 designation remains in place. However, because the current designation may revert back to the former 1992 designation, we also considered the project effects to the 1992 critical habitat designation. Project effects to the 2008 critical habitat designation are discussed later in this document. The Proposed Action will create 4,224 linear feet (0.8 mi) of new road within CHU WA-49 and would result in a permanent loss of 6.5 acres of NRF habitat, or less than 0.03 percent loss of suitable habitat in the CHU (Table 8).

29
Table 8 Spotted owl critical habitat unit overlaying the action area (USFS 2003)
Suitable Habitat Acres Critical Habitat Unit
Total Acres Pre Construction
Post Construction
Net Loss Acres
Percent Change Suitable
Total Percent Change
CHU WA-49 69,207 27,574 27,568 6.5 0.03 0.009 Primary constituent elements are the physical and biological features of critical habitat essential to a species' conservation. Primary constituent elements identified in the spotted owl critical habitat final rule include those physical and biological features that support nesting, roosting, foraging, and dispersal (57 FR 1796-1838 [Jan. 15, 1992]). The proposed action will directly affect 6.5 acres of suitable spotted habitat by clearing it for the new road alignment. The proposed action would adversely affect critical habitat due to the removal of primary constituent elements that currently could provide nesting, roosting, and foraging habitat for spotted owls. However, the removal 6.5 acres of suitable habitat for the new road alignment would not preclude spotted owls from using this stand. Effects to Spotted Owl Nesting, Roosting, and Foraging Habitat within CHU WA-49 The amount of habitat loss and degradation will be small. The loss of 6.5 acres of suitable habitat represents a loss of less than 1 percent (0.03) of the CHU suitable habitat acres, and far less in the action area and will reduce suitable habitat within CHU WA-49 to 25,567 acres. This contributes to an additive loss of 11.5 acres (less than 1 percent) of the suitable habitat within CHU WA-49 since 1994. In addition, danger tree removal will occur within 15 acres of critical habitat that surrounds the road clearing. However, the effect of removing less than 29 trees will be so small that the effect to the CHU will be insignificant. The Service does not expect the proposed action will significantly affect the functional ability of the critical habitat unit to provide for spotted owl nesting, roosting, foraging. Effects to Spotted Owl Dispersal and Habitat Connectivity Due to the small amount of suitable spotted owl habitat that will be removed as a result of the proposed action, the Service does not expect the proposed action will have an appreciable effect to dispersal or connectivity within the action area or the CHU. CHU dispersal and habitat connectivity would be maintained. Effects to the Olympic Peninsula Province Since 1994, there has been 54 acres of spotted owl critical habitat authorized for removal from the Forest. Implementation of the proposed action will increase that figure to 60.5 acres and decrease the suitable habitat within the CHU network on the Forest from 197,642 acres to 197,635 acres. This represents a total loss of less than 1 percent (0.004) of the critical habitat on the Forest since 1994. Due to these small changes, the Service does not believe the proposed action would diminish the ability to attain the critical habitat goals in the CHUs at a Province

30
level for providing well-distributed NRF and dispersal habitats, nor would it appreciably reduce the ability of the CHU or critical habitat within the Province to function as intended. Effects to the 2008 Spotted Owl Critical Habitat - Olympic Peninsula Unit The Olympic Peninsula CHU consists of approximately 332,100 acres, and includes approximately 149,090 acres of suitable spotted owl habitat (Table 9). The Olympic CHU is entirely located within lands administered by the Olympic National Forest (73 FR 47325:47354 [Aug. 13, 2008]). There are three subunits within this CHU which correlate to managed owl conservation areas identified in the spotted owl recovery plan (73 FR 47325:47326 [Aug. 13, 2008]). The CHUs form a habitat network designed to support stable and well-distributed populations of spotted owls over time and allow for movement of spotted owls across the landscape (USFWS 2008, p.13). Primary constituent elements are the physical and biological features of critical habitat essential to a species' conservation. The primary constituent elements identified in the spotted owl critical habitat final rule include forest types that support the spotted owl across its geographic range when they occur in concert with: a) nesting, roosting, foraging, and/or dispersal habitat; or b) lands capable of developing one or more of these habitats in the future (73 FR 47347-47348 [Aug. 13, 2008]). Table 9 Spotted owl critical habitat unit overlaying the action area
(USFS 2009) Suitable Habitat Acres Critical
Habitat Unit Total Acres
Pre Construction
Post Construction
Net Loss Acres
Percent Change Suitable
Total Percent Change
Olympic Peninsula
332,100 149,090 149,083 6.5 0.004 0.002
The effects of the proposed action to critical habitat under the 2008 designation would be nearly the same as under the 1992 designation. The proposed action would adversely affect critical habitat due to removal of primary constituent elements. However, the removal of 6.5 acres for the new road alignment would not preclude spotted owls from using the stand. The loss of 6.5 acres of suitable habitat represents a smaller loss (0.004 percent) than under the 1992 critical designation for the CHU. The additive loss of 6.5 acres of suitable habitat for the Olympic Peninsula CHU would not diminish the ability to attain critical habitat goals at the Province level. If the critical habitat designation is formally remanded to the 1992 designation, there will be no need to reinitiate consultation to address project effects to CHU WA-49.
31
STATUS OF THE SPECIES - Marbled Murrelet Refer to Appendix 3 for an updated account of murrelets rangewide. Murrelet Habitat and Population in the Conservation Zone The largest population of murrelets in the States of Washington, Oregon, and California is found in Zone 1 (Huff et al. 2003, p. 18). Zone 1, encompassing the Puget Sound in northwest Washington, contains 1,081,190 total acres; 800,857 acres are Federal, 88,016 aces are Washington Department of Natural Resources (WDNR), 191,460 acres are other non-Federal, and 857 acres are Tribal lands (USFWS 1997b). Zone 1 contains approximately 125,782 acres of suitable murrelet habitat (USFS 2000). Zone 1 also contains the largest murrelet populations in the species’ listed range, and supports an estimated 30 percent of the murrelets in the coterminous United States (Miller et al. 2008, pp 53-54). Surrounding the available suitable nesting habitat on the Forest is the largest contiguous area of potential murrelet nesting habitat remaining in the lower 48 States which is within Olympic National Park. The Park is characterized by uniform, high-quality habitat. The rate of occupancy is high, and does not appear to be related to how developed the sites are, the number of platforms per tree, or distance to marine waters (USFWS 2003, p. 43). Washington Department of Fish and Wildlife, in partnership with Federal and State researchers, participated in a program to estimate a more precise marbled murrelet population size and trends since 2000. This monitoring program uses annual at-sea surveys of adult birds on the water. Line transects occur within 8 km of the Washington, Oregon, and northern California coastline in the area of the Northwest Forest Plan to estimate population trends within all Zones. The 2003 population estimate for Zone 1 is 6,985 (SE 0.45) (Falxa et al. 2009, p. 12). Falxa et al. (2009, p. 17) used at-sea data to report an estimated annual decline for Zone 1 to be between 4.2 and 7.9 percent (SE 3.0 and 2.5 respectively)3. This is the highest level of decline of any Zone. Also, the juvenile to adult ratio derived from at-sea survey efforts in Zone 1 is 0.09. These low juvenile to adult ratios infer there is insufficient juvenile recruitment to sustain a murrelet population in Zone 1. ENVIRONMENTAL BASELINE - Marbled Murrelet Regulations implementing the Act (50 CFR 402.02) define the environmental baseline as the past and present impacts of all Federal, State, or private actions and other human activities in the action area. Also included in the environmental baseline are the anticipated impacts of all proposed Federal projects in the action area that have undergone section 7 consultation, and the impacts of State and private actions which are contemporaneous with the consultation in progress.
3 The two estimates for population decline reflect inclusion and exclusion of 2008 data, respectively. This was done because the regression analysis can be sensitive to a single year of data that is above or below the regression line.

32
The Environmental Baseline portion of this consultation documents the approved Federal actions that contribute to the conservation of the murrelet, as well as those actions that authorized incidental take. The baseline includes adoption of the NWFP. Information relevant to describing the environmental baseline for this action is included in the NWFP and associated documents.
Distribution and Population Trends Olympic Peninsula Murrelets occur within all major drainages in the Forest and the Park. Murrelet surveys were conducted in the late 1980s and 1990s by the Forest, the Park, and the Washington Department of Fish and Wildlife in limited areas on the Olympic Peninsula. More extensive surveys were conducted using the Pacific Seabird Group protocols between 1992 and 1999. On the Forest, surveys were conducted primarily in response to proposed activities. In addition, between 1993 through 1995, a watershed-level survey effort was conducted in the Big Quilcene River watershed, which lies north of the Dosewallips watershed. Nonetheless, large portions of the Forest remain unsurveyed. A breeding ecology study conducted on the Olympic Peninsula between 2004 and 2008 using radio telemetry found14 nest sites. The most recent data indicate that there are 538 recorded sites of murrelet occupied behavior on the Forest while the Park had 251 (USFS 2009, pp. 26-27). Status of the Species in the Action Area While there are few records of murrelets occupancy in the watershed, most of the Dosewallips watershed remains unsurveyed. Of those records, none occur within the Forest. Protocol-level surveys have not been conducted in the action area to determine if suitable nesting habitat is occupied. However, surveys in 1995 documented murrelets 2.7 mi away within the Big Quilcene River watershed (USFS 2009, p. 28). More recently, radar studies conducted by Cooper et al. (2001) detected murrelets at the mouth of the Dosewallips watershed, about 8.8 mi from the action area (River Mile 10.75). While it is not possible to reliably extract from those data the actual number of sites or individuals within the action area, it is reasonable to assume a high likelihood that murrelets may also occupy suitable habitat in the action area. Raphael et al. (2002, p. 336) showed a strong correlation between the amount of old-growth habitat and murrelet detections on the Olympic Peninsula. In addition to these surveys, surveys conducted in 1999 and 2000 found murrelet occupancy at the Dosewallips Campground within the Park about 4 mi west of the action area (USFS 2009, p. 28). In 2005, a murrelet nest was located using radio tracking on the Park about 8 mi upstream from the action area (Bloxton and Raphael 2009, p.5). Field visits by the Service and the Forest determined the action area contains high quality nesting habitat. The Service defines suitable habitat as stands with trees that contain platforms. Platforms are structures that can support nesting and are limbs greater or equal to 4 inches in diameter and greater or equal to 33 ft above the ground. Other important attributes of platforms are nearby branches that occur above (for vertical cover) and to the side (horizontal cover) of nest platforms that provides weather and visual protection to the nest. A suitable stand also has

33
at least two platforms per acre. Flight access to likely nest sites is good due to openings created by the Dosewallips River. Also, the action area is within 10 mi of possible foraging habitat within the Hood Canal. Finally, evidence suggests murrelets have a high fidelity to nesting areas, most likely at the watershed scale (Nelson 1997, p. 20). While there is currently no method to extract from those data the actual number of nest sites or individuals, or the population trend in the action area, it is reasonable to assume a high likelihood that murrelets may also occupy suitable habitat in the action area. Conservation Role of the Action Area The Marbled Murrelet Recovery Plan (USFWS 1997a, p. 119) outlines the objectives necessary to recover and delist the murrelet. These objectives include 1) stabilizing and increasing the population, 2) providing for a reasonable likelihood of continued existence, and 3) gathering the necessary information to develop specific delisting criteria. In order to stabilize and increase the murrelet population, the Recovery Plan focuses on protecting adequate nesting habitat by maintaining and protecting occupied habitat and minimizing the loss of unoccupied but suitable habitat. Most recovery actions are rangewide and include 1) maintaining occupied nesting habitat, 2) maintaining suitable habitat in larger blocks while maintaining current north/south and east/west distribution of nesting habitat, 3) maintaining and enhancing buffer habitats surrounding occupied habitat, and others. The Recovery Plan calls for protecting terrestrial habitat essential for murrelet recovery which includes any suitable habitat in Late-Successional Reserve located in Zone 1 (USFWS 1997a, p. 131). No conservation role specific to the action area level has been identified. Conservation Needs of the Murrelet in the Action Area The conservation needs of the species within the action area include 1) protection of nesting habitat by maintaining and protecting occupied habitat, and 2) minimizing the loss of unoccupied but suitable habitat (USFWS 1997a, p. 119). The action area lies entirely within the North Hood Canal LSR (RW-105). This LSR contains 42,324 acres, 46 percent (19,469 acres) of which is suitable habitat for the murrelet. Since the proposed action occurs entirely within LSR allocation under the NWFP, the Forest's conservation emphasis is on protection and enhancement of late successional and old-growth forest ecosystem conditions which serve as habitat for late-successional and old-growth related species, including the murrelet. Although the conservation needs of the species are addressed within the larger conservation framework established for the murrelet in the NWFP, the species' needs are also supported by non-Federal land management. The primary focus of this conservation framework is to provide well-distributed blocks of nesting habitat for breeding murrelet pairs to improve murrelet distribution within the Zone. Historical and Current Threats to Murrelet Habitat Past activities that caused a reduction of old growth and late-successional forests in the Dosewallips watershed include forest fire, timber harvest, road construction, residential development, agriculture, and the development of the Elkhorn Campground and National Park facilities.

34
Areas of human recreation attract corvids due to an abundance of discarded and dropped food. Corvids are known nest predators of murrelets. Nest predation appears to be the major cause of nest failure for murrelets (Nelson and Hamer 1995, p. 89; McShane et al. 2004, p. 4-109; Peery et al. 2004a, p. 1095). The Forest provided the Service some visitor use information for the Elkhorn campground. Hikers and bicyclists routinely use the campground and use is high (Susan Piper, pers. comm. 2010). However, this facility is scheduled to be decommissioned in the future. The Park also provided the Service some visitor-use information on the Dosewallips Campground. Trail-head registration documents how many people walk the washout bypass trail and the 5 mi of road to reach the trailhead. It is assumed that some of these people may spend the night at the campground before hiking into the wilderness. Before the washout, about 1,400 people registered in 2001. In 2002, that number fell by about half. In 2007, the number of registered hikers reached about 3,000. It has also been reported that the Dosewallips itself has become a popular destination for day hikers. Park employees report that most weekends during good weather, between 15 and 40 cars are parked below the washout and that a crowd of up to 100 campers have been observed using the campground. This level of use of the campground has resulted in trash removal problems. Trash removal has been sporadic and requires the use of a motorcycle, and volunteers (Tucker, pers. comm. 2010). A total of 10,838 acres of regeneration forest harvest occurred in the Dosewallips watershed on all ownerships from the 1920s to the 1990s (USFS 1999). There are about 116 mi of roads being used and maintained in the Dosewallips watershed. Since the 1800s, seven fires burned a total of 19,700 acres. Limited forest harvest has occurred in the action area. Forest salvage in occurred in 1976 and thinning occurred in 1984 and in a portion of the action area. The action area occurs within a stand estimated to be 509 years old (USFS 2009, p. 14). About 1,700 acres occur in this age stand. Other forests over 200 years old occur in the surrounding area. However, the amount of low elevational forests (lower than 4,000 ft) over 400 years old is very limited in the watershed. The amount of such old forests in the Dosewallips 6th field watershed on the Forest is 1,784, or 7.8 percent of the watershed. Fire remains a threat to the watershed (USFS 2009, p. 13) and to the critical habitat within the action area. This threat is likely to increase, along with insect infestation, and other climate-change related consequences. Condition of the Action Area The action area is within late successional forests containing large trees with platform branches suitable for murrelet nesting. Flight access to potential murrelet nest sites is good, being close to the Dosewallips River. The forest stand contains trees of various sizes creating a multi-layered canopy, including large trees characteristic of suitable murrelet habitat. It is considered high quality habitat containing numerous large-diameter tall trees, some up to 80 inches in diameter-at-breast-height.

35
EFFECTS OF THE ACTION – Marbled Murrelet This section evaluates the overall effects of the proposed action with respect to the conservation needs of the murrelet within the action area. In accordance with the Service’s Endangered Species Consultation Handbook (USFWS and NMFS 1998, p. 4-36), a “jeopardy analysis” of impacts to a species as the result of a specific project can be made at the “recovery unit” scale rather than over the entire species’ listed range. For the murrelet, the individual recovery unit is the Conservation Zone (USFWS 1997a, p. 115). In this analysis, we address Zone 1. To isolate stressors, the proposed action was deconstructed based upon the activities proposed in the BA. Stressors were considered to be any physical, chemical, or biological influence resulting directly or indirectly from the project and co-occurring with murrelets in the action area. Stressors that are likely to adversely affect murrelet habitat use, reproduction, or survival are addressed below. Murrelet response to stressors co-occurring spatially and temporally with the species in the action area was characterized as sub-lethal (behavioral) or lethal using the best available science from published and unpublished reports, and other relevant data available to the Service. To complete the analysis, we reconstructed the proposed action and described the overall consequences of the lethal and sub-lethal effects in relation to the survival and recovery needs of the murrelet in Conservation Zone 1, and rangewide. This section analyzes the potential adverse effects of the proposed action on murrelets through: 1) direct injury from tree-felling; 2) disturbance from human-generated noise and visual stimuli; 3) the permanent loss of 6.5 acres of forested habitat and associated potential nest trees; 4) increased threat of corvid predation; 5) damage to nests due to windthrow; 6) degradation in the quality of suitable habitat because of microclimate changes; 7) increased baseline disturbance due to road noise; 8) risk of nest predation at Elkhorn and Dosewallips Campgrounds, 9) vehicle-murrelet collisions, and 10) a reduction in the amount of suitable habitat in the LSR. Exposure to Effects It is reasonable to assume that there is a high likelihood that murrelets use the action area for nesting given the following:
1) Suitable habitat exists within the action area.
2) Radar studies conducted by Cooper et al. (2001) detected murrelets at the mouth of the Dosewallips watershed, about 8.8 miles from the action area (River Mile 10.75).
3) Radar studies conducted by Raphael et al. (2002) detected up to 70 murrelets flying up the watershed.
4) Surveys in 1995 documented murrelets 2.7 mi away within the Big Quilcene River watershed (USFS 2009, p. 28).
5) Evidence suggests that murrelets have a high fidelity to nesting areas for many years, most likely at the watershed scale.
36
Thus, there is a high likelihood that incubating adult murrelets and nestlings in the action area will be exposed to project-induced effects during project implementation. The probability and consequence of murrelet exposure to various proposed action stressors is addressed below. Direct Effects to Murrelets Direct Injury or Mortality - Tree Felling Direct injury or mortality would only occur if murrelets were nesting within trees scheduled for felling or nesting within a tree immediately adjacent to, and within striking distance of a tree scheduled for felling. All road corridor tree felling and most danger tree felling would occur from October 1 to February 28 of any project year when murrelets would not be nesting. Therefore, murrelets would not be exposed to injury or mortality from road corridor tree felling. Danger trees will be felled during initial road corridor clearing to the maximum extent practicable. However, the possibility exists that danger trees were overlooked during initial road corridor clearing, or that trees originally identified as healthy trees develop into danger trees. These would be felled during road construction, and thus the nesting season. It is expected that no more than three danger trees per year (no more than nine total danger trees) would require felling during any nesting season during the life of the project. The probability that a danger tree would contain nesting murrelets is low. Disturbance from forest clearing before the nesting season may discourage prospecting murrelets from nesting in the project area. Disturbance from road building may also discourage murrelets from nesting in the project area. Further, other high quality nesting habitat exists nearby. Finally, the Forest included a conservation measure to survey danger trees and trees immediately adjacent to danger trees with potential nesting structure before felling during the nesting season. This would further reduce the likelihood of injury or mortality to murrelets. Therefore, the likelihood of direct injury or mortality to adults, nestlings, or eggs as a result of felling danger trees during the nesting season is so low that it would be discountable. Exposure of Adults and Juveniles at the Nest to Disturbance The Service previously completed an analysis of potential disturbance (visual and sound) from common management activities to murrelets (USFWS 2003, pp. 264-285). In that analysis, the Service concluded that murrelets exposed to sounds exceeding 92 decibels during the early nesting season (April 1 to August 5) could result in significant disruption of nesting behaviors. These behaviors and their consequences are described below. Flushing of an adult or juvenile murrelet from the nest site or a perch site in the immediate vicinity of the nest and creates a likelihood of injury or mortality. Adults that are flushed off nests are at increased risk to predation. Flushing exposes the adult and chicks to any predator in the vicinity when they would otherwise be motionless and cryptic on the nest. This is presumed to be the most important consequence of flushing (Awbrey and Bowles 1990, p. 32). Flushing is the common behavioral response measure utilized in raptor

37
research to indicate a high-level of disturbance (Awbrey and Bowles 1990, p. 5; Brown 1990, p. 592; Stalmaster and Kaiser 1997, p. 1312). Adults that are flushed off nests by predators often abandon the nest (Nelson and Hamer 1995a, p. 94). Further, the flushing of an adult would result in the egg being exposed to predation and/or the egg cooling until it is nonviable. Finally, a flushed adult increases the chances of an egg spilling out of the nest. Aborted feeding(s) of a nestling, in which the adult abandons the feeding attempt and must return to foraging habitat to obtain new prey. Hull et al. (2001, p. 1036) report that murrelets spend 0.3 hr to 3.5 hr per day (mean 1.2±0.7 hours per day) commuting to nests during the breeding season. They estimate roughly 30 days are spent for incubation and 28 days for chick rearing, totaling 58 days for the breeding period. During chick rearing, adults return to feed young between one and eight times daily, with an average of only 2.2 feedings per day (average between findings of Nelson and Hamer 1995b, p. 62 and Hull et al. 2001. p. 1039). Typically, an aborted feeding represents a significant disruption of normal behavior patterns. The adult must then return to foraging habitat, capture another prey item and return to the nest for prey delivery. Since adults average 2.2 round-trip feeding attempts per day during the breeding season, a single unsuccessful trip can constitute about a 50 percent reduction in that day’s feeding effort, depending on whether the adult returns to foraging habitat for another feeding attempt. Both of these scenarios can be considered a significant disruption of normal behavior as they cost the adult both energy and time that may have been spent on other life-sustaining activities such as foraging.
Multiple delayed feeding attempts, in which adult delivery of food to the nestling is delayed multiple times, either within a single day, or across multiple days, due to human-caused disturbance at or near the nest site. Nelson and Hamer (1995b, p. 66) state that murrelet chicks grow rapidly compared to most alcids, gaining 5 to 15 grams per day during the first 9 days after hatching. The average daily increase for the first 9 days of murrelet neonate development is 10.9 percent, while the average daily increase for the next 16 days is 2.2 percent (Simons 1980, p. 5). With such a fast growth rate and a low average number of daily feedings, it is reasonable to assume that a few missed feedings may have substantial consequences for chicks. We have established possible murrelet responses to noise disturbance as a result of the proposed action that may lead to significant disruption of normal behaviors. To complete this analysis, we must analyze the likelihood and severity of these responses given the amount and duration of sound exposure for the quantity of occupied habitat in the action area. We address these topics in the section below.
38
Expected Exposure of Marbled Murrelets to Sound Disturbance While tree removal activities including helicopter flights will occur outside the nesting season, noise-generating activities would occur within the action area during the entire murrelet nesting season and include motorized tools, chainsaws, rock drills, bulldozers and other heavy equipment, and blasting. The loudest activity during the nesting season will be pile driving. Disturbance from Heavy Equipment and Blasting Heavy equipment would be used for road construction throughout the construction period and thus occur during the early nesting season. In a previous analysis, the Service determined that the injury threshold distance for heavy equipment (using 92 dBA for injury threshold) was 35 yd (USFWS 2003, pp. 264-285). For the proposed action, we expect heavy machinery to include such machinery as bulldozers, graders, trackhoes, back hoes, and pile drivers. Using information available to the office, we found that pile drivers can create 92 dBA at 88 yd. Using GIS, the Service calculated that 52 acres, 38 acres of which are suitable habitat, will be exposed to disturbance from pile driving during the nesting season. We also analyzed sound exposure and response from blasting for spotted owls (p. 24). Calculating sound levels using the aforementioned mitigation measures and sound attenuation rates yields no more than 126 dBA at 50 ft (or 92 dBA at 182 ft [60.6 yd]). Since the distance at which blasts reach the 92 dBA contour is less than that of heavy equipment described above, we do not expect any additional acreage in sound exposure disturbance. Therefore, murrelets within these 38 acres of suitable habitat are likely to experience a significant disruption of normal behaviors during the construction period due to operation of heavy equipment and blasting. Murrelet responses to heavy equipment and blasting are discussed below. Chainsaw Use Chainsaws would be used to clear 6.5 acres of suitable murrelet habitat for the new road alignment. Forest clearing will occur between October 1 and February 28, outside the nesting season. Danger trees will also be felled during initial tree clearing. Areas within 100 ft of the top of the bank cut or the toe of fill will be cleared of danger trees. Since danger tree cutting will occur outside the nesting season, no murrelets would be exposed to chainsaw noise. Additional danger trees may be identified after road construction has begun. These will require felling trees during the nesting season, and possibly during the early nesting season. Up to 3 trees per year may require felling during the nesting season. From the Service’s sound response analysis (USFWS 2003, pp. 264-285), it was determined that 92 dBA of sound from chainsaw use would extend 65 yd (135 ft) from the source. Based on this analysis, we calculated that 2.7 acres of forest habitat would be exposed to chainsaw noise at 92 dBA or above. However, it is unknown where these danger trees will occur and whether they are bunched or dispersed. Thus, it is difficult to calculate the total area of impact. Since the disturbance approximates that of blasting, the Service will lump the chainsaw disturbance area with the blasting area. Nonetheless, murrelets will experience a significant disruption of normal behaviors during the construction period due to chainsaw use.
39
Marbled Murrelet Response to Sound Exposure Flushing of an adult or juvenile from the nest Some authors report adults murrelets appear to adapt readily to human-generated disturbance and will remain on the nest during different types of on-the-ground activity. However murrelets will still flush in response to certain activities (Long and Ralph 1998, p. 19). The use of heavy equipment, some blasting, and very limited chainsaw use will occur during the early and late nesting season. While murrelets may become habituated to minor disturbance, it is unlikely that murrelets will habituate to noise caused by construction with heavy equipment and some blasting due to the intensity and duration of the noise. In spite of the conservation measures, there is the likelihood that an adult will flush from a nest in response to project noise and expose itself and eggs or chicks to predation. This represents a significant disruption of normal behaviors. Chicks typically show little or no reaction to human-generated disturbances such aircraft flying overhead, distant blasting, or rifle reports (Long and Ralph 1998, p. 19). Therefore, the probability of a chick flushing from a nest or otherwise being disturbed as a result of the proposed action during the entire construction season in response to the proposed action is so remote as to be discountable. Aborted Feedings In Washington, incubation was estimated to begin April 26 and end July 30 while the nesting period begins May 26 and ends August 27 (Hamer and Nelson 1995, p. 55). Hatchlings appear to be brooded by an adult for 1 to 2 days and are then left alone at the nest for the remainder of the rearing period, except during feedings (Nelson and Hamer 1995b, p. 60). Both parents feed the chick, which receives one to eight meals per day. Most meals are delivered early in the morning while about a third is delivered at dusk (Nelson 1997a, p. 18). However, some meals are delivered during the day (Nelson and Hamer 1995b, p. 61). Considering road construction will last two full nesting seasons and include blasting, it is likely there will be an aborting feeding in response heavy machinery noise, blasting, and limited chainsaw use in spite of the 2 hr sunrise/sunset conservation measure during the nesting season. This would represent a significant disruption of normal behavioral patterns. Multiple delayed feeding attempts Considering road construction will last two full nesting seasons and include blasting, there is a likelihood of multiple delayed feeding attempts in response heavy machinery noise, blasting, and limited chainsaw use in spite of the 2 hr sunrise/sunset conservation measure. This would represent a significant disruption of normal behavioral patterns. Indirect Effects to Individual Marbled Murrelets
Indirect effects are defined as those effects that are caused by, or will result from, the proposed action at a later time, but still reasonably certain to occur (50 CFR 402.02). The indirect effects to murrelets include loss of suitable habitat, edge effect (such as nest predation exposure,

40
windthrow and microclimate changes), an increase to forest baseline noise from traffic, increased nest predation at Elkhorn and Dosewallips Campgrounds, and possible vehicle-murrelet collision.
Habitat Loss The proposed action will result in the loss of 6.5 acres within a single patch of suitable murrelet nesting habitat for the new road alignment. Over 200 trees will be removed, many with large diameters and platforms. Loss of 6.5 acres associated with road construction is expected to adversely affect murrelets by reducing the available nesting habitat within the action area. Loss of individual large trees within stands of suitable habitat results in an adverse degradation of the nesting habitat due to the loss of potential nesting platforms and loss of forest canopy cover in the areas affected. The loss of 6.5 acres of suitable nesting habitat will not significantly reduce patch size due to the amount of surrounding habitat. We therefore do not expect effects of reduced patch size to result in fewer nesting attempts or the eventual abandonment of the site. Displaced Nesting We expect the loss of 6.5 acres of suitable nesting habitat will displace returning murrelets attempting to nest. We reviewed available literature on nesting fidelity in an attempt to predict how returning murrelets will respond to the loss of nesting habitat in the breeding seasons following nest tree removal. Several authors report nest site fidelity in murrelets, which is consistent with that of other adult alcids where birds return to previously occupied, but recently destroyed nest sites for two or more years (Divoky and Horton 1995, p. 86; Nettleship and Birkhead 1985 in Nelson 1997). Nelson and Peck (1995) report murrelets returning to the same forest stands in successive years. Divoky and Horton (1996, p. 86) documented murrelets returning the same forest stands for a minimum of 20 years in northern California, 18 years in central California, 7 years in Oregon, and 3 years in Washington. Nelson and Peck (1995) reported murrelets use of the same nest platform or tree in subsequent years, although not necessarily by the same pair or individual (N = 7 nests). There are more than 15 records of murrelets returning to the same tree, 6 of these to the same platform. However, individual nest cups are not reused in consecutive years (Nelson 1997). Nest site fidelity has adaptive benefits. A long-lived species can increase breeding success and lifetime fitness. It can reduce potential reproductive effort by increasing the chances of breeding with the previous year’s mate, eliminating or reducing the need to locate a new suitable nest site each year, and allowing the development of familiarity with the surrounding environment (Divoky and Horton 1995, p. 83). Site fidelity also has important implications in how murrelets respond to habitat loss and the reestablishment of breeding areas when habitat has been altered. Evidence suggests the fidelity murrelets exhibit to a previously used breeding area or site should be related to the rate and magnitude of habitat destruction (Divoky and Horton 1995, p. 83). The ability of breeding murrelets to prospect for new nest sites is well documented. Prospecting involves pairs and individuals flying near and landing on tree limbs in the early spring and midsummer. Non-breeding murrelets and subadults may also participate in this activity during
41
the midsummer. Murrelets also visit nesting areas during the winter and may select nest sites during this time (several authors in Nelson 1997). We expect the murrelets that may nest within the action area to also prospect and thus have familiarity with the area around their nest site, including potential alternative nest sites. Murrelets displaced from using established nest trees may disrupt normal murrelet breeding behaviors. The potential effects of this disruption include a delay in the onset of breeding, nest site abandonment, or failed breeding due to increased predation risk at a marginal nesting location (Divoky and Horton 1995, p. 83; Raphael et al. 2002, p. 232). Each of these outcomes has the potential to reduce the nesting success for individual breeding pairs, and could ultimately result in the reduced recruitment of juvenile birds into the local population (Raphael et al. 2002, pp. 231-233). However, the watershed and the stand contain sufficient suitable habitat for the relocation of nesting murrelets. We expect adverse effects from the loss of 6.5 acres of high quality nesting habitat, which will result in the reduction in nest site availability. However, we anticipate that murrelets returning to the action area in subsequent nesting seasons will locate new nest sites in nearby suitable habitat and would not experience a significant delay in re-nesting. We do not expect permanent murrelet displacement from the action area as a result of the proposed action. Edge Effect The removal of these trees for the new road alignment will increase edge effects. As defined, edge effect refers to the phenomenon in some habitat settings where predators are more effective at preying upon breeding birds nesting near habitat edges. Predators attracted by the habitat edge can lower nest success, rendering habitat nesting conditions less suitable along habitat edges. Further, murrelets nesting near forest edges created by tree harvest are expected to be exposed to increased risk of tree windthrow and changes in microclimate. Nest Predation By far the greatest threat to murrelets from habitat loss and fragmentation is the increased level of nest predation risk associated with forest edges (McShane et al. 2004, p. 4-109). Nest predation appears to be the major cause of nest failure for murrelets (Nelson and Hamer 1995, p. 89; McShane et al. 2004, p. 4-109; Peery et al. 2004a, p. 1095). Raphael et al. (2002, p. 231) report that nest failure and predation was highest within 50 meters (m) (164 ft) from an edge, especially in areas close to human activity. Steller’s jays (Cyanocitta stelleri) and common ravens (Corvus corvax) are known predators of murrelet nests (Nelson and Hamer 1995, p. 65; Peery et al. 2004a, p. 1095; Hebert and Golightly 2007, p. 221) while gray jays (Perisoreus canadensis) are suspected predators (Nelson 1997, p. 14). Malt and Lank (2009, p. 1284) found that Steller’s jays were abundant at “hard-edged sites” (as are found with road and clear cut edges and with the proposed action) and are rare at “natural-edged sites” (as are found adjacent to river corridors). There is some evidence that mammals such as Douglas squirrels (Tamiasciurus douglasii) and northern flying squirrels (Glaucomys sabrinus) and forest deer mice (Peromyscus spp.) have the ability to depredate
42
murrelet nests. However, predation on an active murrelet nest by mammalian predators has not yet been observed (Malt and Lank 2009, p. 1284). Predation rates are influenced mainly by habitat stand size, habitat quality, nest placement (on the edge of a stand vs. the interior of a stand), and proximity of the stand to human activity centers. Malt and Lank (2009, p. 1278) found that nests in hard edges had 2.5 times the probability of avian predators disturbance relative to nests in adjacent interiors of stands without the influence of human activity centers. The original roadway within the action area likely created some edge effect in adjacent forests. The new road alignment will be shifted to the north of the original road up to about 130 ft (at the apex). Based on the findings of Malt and Lank (2009), and Raphael et al. (2002), we assume that the suitable habitat within 50 m of the new road alignment will also be exposed to a high level of predation risk due to their high contrast edges. Using GIS, the Service calculated the amount of new forest not previously exposed to edge effect and thus nest predation. This shift in the road alignment will expose about an additional 15.5 acres of forest habitat to nest predation. The total number of murrelets nesting in the 15.5 acres where increased predation exposure would occur is unknown. There is no research from which to derive an average murrelet density estimate at the scale of individual nest patches within the action area from which to calculate the number of murrelets affected by predation exposure. Estimates of murrelet densities occur in the literature; however, these data are most appropriate for comparison purposes and only at the watershed level, or larger. Further, murrelet nesting is not evenly distributed within a watershed. Murrelets do not establish home ranges in the forest and territories are not defended which would typically disperse birds in a stand or forest. We have included the following murrelet density discussion to establish a theoretic density of murrelets and not a means to quantify the number of murrelets affected by the proposed action. At the Peninsula level, murrelet densities estimate from radar is 0.005 per ha, or 1 murrelet per 494 acres (average between 10 watersheds at low elevations) (McShane 2004, p. 4-60). In radar studies by Raphael et al. (2002, p. 340) murrelets densities for the Olympic Peninsula averaged more than 1 murrelet per 370 acres. In the Dosewallips watershed, the density is 1 murrelet per 530 acres (based on an average mean murrelet radar count of 41.6 murrelets between 1998 and 2000 per 22,021 acres of suitable habitat based on GIS) (Raphael et al, 2002, p. 338). In more recent literature, Peery et al (2004b, pp.350, 352) suggests that approximately 43 percent of the population is likely to be detected by radar (based on the average of non-nesters flying into the forest over 2 years-Table 3). Multiplying Raphael’s earlier figure by 0.43 yields 170 acres of potential nesting habitat per murrelet on the Olympic Peninsula, a figure used by the Washington Department of Natural Resources (Raphael et al. 2008, p. ES-23). This suggests that murrelet density in the Dosewallips watershed, using Raphael et al. 2002 data, would be about 228 acres per murrelet (or one nesting pair per 456 acres). While this density estimate appears low, exposure to nest predation from corvids remains. Due to the high quality of nesting habitat adjacent to the new road alignment, we cannot rule out the possibility of nesting murrelets here. Removing suitable nesting habitat will result in a habitat

43
fragmentation. Research in Oregon (Meyer et al. 2002., p. 110) and in British Columbia (Zharikov et al. 2006, p. 117) indicates that murrelets do not immediately abandon fragmented or degraded habitats. Murrelets are likely to maintain fidelity to their nesting sites as long as the habitat stands retain some suitable nesting structures and the birds are able to successfully nest at the site (Divoky and Horton 1995, pp. 83-84). However, murrelet populations eventually decline in fragmented habitats, most likely as a consequence of increased predation at nest sites along forest edges (Raphael et al. 2002, p. 232; Meyer et al. 2002., p. 110; McShane et al. 2004, p. 4-108). Therefore, the Service must assume that 15.5 acres of suitable habitat adjacent to the road alignment contains nesting murrelets, and would be exposed to nest predators which ultimately could result in reduced juvenile recruitment into the breeding population. There are no data concerning how long nesting murrelets will remain at a nest site if nesting has become unsuccessful due to nest predation. Further, murrelet nesting is “edge neutral” and are neither attracted to, nor repelled by forest edge. Therefore, we must assume reduced nest success and juvenile recruitment for the life the of new road alignment. Windthrow New forest edges often increase windthrow. Increased windthrow often results in adverse effects to suitable murrelet habitat by downing and/or damaging suitable nest trees. During the nesting season, nesting murrelets could be injured or killed by falling trees. However, trees that pose a threat of falling and injuring workers (danger trees) would be removed during the initial road alignment clearing during the non-nesting season. This lessens the occurrence of trees with the potential to be windthrown. Further, the Forest expects about three danger trees will need to be felled during the nesting season each year. This further lessens the potential windthrow. Therefore, the potential for windthrow trees to strike murrelet nests is so remote as to be discountable. Microclimate New forest edges often influence the microclimate within the adjacent forest which could affect nesting murrelets. However, the road surface will be narrow (about 14 ft) and the cleared corridor somewhat wider, depending on slope and road design, but not substantially so. The corridor will also be short, about 0.8 mi long. Due to the small dimensions of the new road corridor, the effect of a new forest edge on spotted owl habitat microclimate would be so small as to be insignificant. Increased Baseline Disturbance-Road Noise Forest Service Road 2610 provides access to the Forest’s Elkhorn Campground, the Olympic National Park’s Dosewallips Campground, the Dosewallips Ranger Station and several trailheads. Since the floods have washed out the road, these facilities have had only stock animal, pedestrian, and bicycler access. Completion of the proposed action will reconnect access to these areas and will bring the concomitant human-generated disturbance to murrelet habitat. This includes vehicular traffic including trucks (some pulling horse trailers), cars, and motorcycles. Our analysis of effects must use the current condition as our baseline.

44
There is an increasing body of evidence supporting the existence of substantial disturbance to roadside resident wildlife from traffic. This includes noise, visual disturbance from passing vehicles, and the risk of collision with cars and trucks. Traffic noise can create acoustic interference (or masking) which reduces the distance over which acoustic signals such as song can be detected. Traffic noise could hamper detection of song by conspecifics, making it more difficult for birds to establish and maintain territories, attract mates and maintain pair bonds, and possibly leading to reduced breeding success in noisy roadside habitats (Parris and Schneider 2008). Based on recent Service analysis (USFWS 2003, pp. 264-285) of the potential for injury associated with disturbance to murrelets, we estimated a combined sight- and sound-injury threshold distance for different noise generating activities using the sound-only injury threshold of 92 dBA. Most vehicles do not reach this sound threshold at any distance. Further, murrelets fly above the canopy until near the nest, where they drop below the canopy before landing near their nest. Since the action area is in an old growth stand, the canopy is very high. Finally, nests are usually near the top third of the tree and at least 65 ft from the ground. It is unlikely that murrelets would be exposed to sound levels that would create a significant disruption of nesting behaviors. Therefore the response of murrelets to increased disturbance within suitable habitat adjacent to the new road alignment, 5 mi of FSR 2610, and two campgrounds would be so small as to be insignificant. Risk of Nest Predation at the Elkhorn and Dosewallips Campgrounds Areas of human recreation attract corvids due to an abundance of discarded and dropped food. A study by Neatherlin (2002, p. 39) found crows (common crows–Corvus brachyrhynchos—and Northwestern crows–Corvus caurinus), common ravens (Corvus corax), and Steller’s jays (Cyanocitta stelleri), exploited anthropogenic food sources when nesting within 1 km of human settlement and recreation and the benefits to crows that nested near humans (within 1 km) was “extreme—annual reproduction doubled and annual survivorship was 97.8 percent.” Nesters more than 5 km from human settlement and recreation had reduced reproduction—about half the annual survivorship. The Forest provided the Service some visitor use information for the Elkhorn campground. Hikers and bicyclists routinely use the campground and use is high (Susan Piper, pers. comm. 2010). The Park also provided the Service some visitor-use information on the Dosewallips Campground. Trail-head registration documents how many people walk the washout bypass trail and the 5 mi of road to reach the trailhead. It is assumed that some of these people may spend the night at the campground before hiking into the wilderness. Before the washout, about 1,400 people registered in 2001. In 2002, that number fell by about half. In 2007, the number of registered hikers reached about 3,000. It has also been reported that the Dosewallips itself has become a popular destination for day hikers. Park employees report that most weekends during good weather, between 15 and 40 cars are parked below the washout and that a crowd of up to 100 campers have been observed using the campground. This level of use of the campground has resulted in trash removal problems. Trash removal has been sporadic and requires the use of a motorcycle, and volunteers (Tucker, pers. comm. 2010).
45
Completion of the proposed action will change the use of the both campgrounds. Vehicular traffic will bring more people to the campgrounds, including more children, and encourage longer stays. More people and longer stays will result in more garbage generation. However, vehicular access will also allow more frequent access by Park personnel for policing and more frequent garbage removal. While the proposed action will result in more visitors, and more garbage will be generated, we do not anticipate significant changes in the availability of food for corvids. Thus, the proposed action would not substantially increase nest predator density and result in increased exposure of murrelets to predation. The change in nest predation to nesting murrelets would be so small as to be insignificant. Vehicle-Murrelet Collisions New traffic on FSR 2610 may increase vehicle-wildlife collisions. However, murrelets make very few visits to nests during a 24 hr period. Also, nests are usually near the top third of the tree and at least 65 ft from the ground. Flights to and from the nest are usually too high to be exposed to vehicles. Therefore, the probability of vehicle-murrelet collision is so remote as to be discountable. Effects to the Murrelet Population in Conservation Zone 1 There are several factors that limit the magnitude of the project effects to the murrelet population in Zone 1 and are discussed below. Murrelet Reproduction The area where trees will be felled is in a small patch (6.5 acres) located in a large, unfragmented stand in a watershed with much habitat and distant from rural residences. Such stands are considered to be of high quality in terms of their ability to support successfully nesting murrelets, and will continue to support breeding murrelets in the action area. The new edge will expose 15.5 acres of forest to increased predation. However, trees to be felled are adjacent to an existing edge created by the Dosewallips Road. This is less impacting to a forest stand in terms of its integrity and microclimatic conditions than harvest which removes patches of trees deep in the middle of the stand or removing whole stand which would affect the quality of the stand as nesting habitat. Trees harvested in such a linear manner along an existing road will not significantly increase existing nest predation to habitat as a result of edge effects at the Zone scale. Therefore, the proposed action would not be expected to appreciably affect the overall reproduction of murrelets within Zone 1. Murrelet Numbers Murrelet numbers in Zone 1 are higher than other Zones. Considering the relatively small amount of acres affected by the action (22 acres) compared to the size of the Zone and the number of murrelets in the Zone, the proposed action would not be expected to appreciably affect the overall number of murrelets occurring within Zone 1.

46
Murrelet Distribution The impacts associated with the proposed action do not represent a substantial decrease in the amount of suitable habitat in the action area. Therefore, the effects of building a new road alignment are not expected to appreciably affect the existing distribution of murrelets in the action area, the watershed, or the overall distribution of murrelets within Zone 1. Summary of the Proposed Action Effects on the Marbled Murrelet We established that murrelets would not be exposed to direct injury or mortality because tree felling for the new road alignment would occur outside the nesting season. However, nesting murrelets would be exposed to disturbance as a result of noise generated from road building activities, including heavy equipment, blasting, and chainsaws. We expect 38 acres of suitable habitat would be exposed to noise at 92 dBA, and above, primarily from heavy equipment. The expected murrelet response to project created disturbance would be adults flushing from the nest, aborted feedings, and multiple delayed feeding attempts. This represents a significant disruption of essential behaviors. We expect that murrelets displaced from using established nest trees will relocate a new nest will not result in a significant delay in re-nesting. We also do not expect a permanent murrelet displacement from the action area. We expect the removal of 6.5 acres of suitable habitat required for the new road alignment to create a new forest edge. Predators are attracted by edge habitat. Predators are the major cause of nest failure. We calculated that the proposed action will expose 15.5 acres of forest habitat not previously exposed to high rates of predation. This would result in reduced juvenile recruitment into the breeding population for the life of the new road alignment. Forest edge effects including windthrow would be discountable while changes in the microclimate would be insignificant. Increases in road noise would also be insignificant. The increase in risk of nest predation at the Elkhorn and Dosewallips Campgrounds due to project completion would be insignificant. The risk of vehicle-murrelet collisions is discountable. The proposed action will not appreciably affect murrelet reproduction, numbers, or distribution within Zone 1, or rangewide. See Table 10 for a summary of the effects of the proposed action on murrelets.

47
Table 10 Summary of the effects of the proposed action on murrelets Effects of the Activity Proposed Action
Activity Seasonal Timing
Outside nesting =O Inside nesting = I
Amount In Acres Discountable/
Insignificant Adverse Effects
Direct Effects Tree Felling O 6.5 No Effect Helicopter Prop Wash O 6.5 No Effect Danger Tree Felling O 15 No Effect Heavy Equipment Disturbance
I 38 X
Chainsaw Disturbance I Overshadowed by heavy
equipment
X
Blasting Disturbance I Overshadowed by heavy
equipment
X
Indirect Effects Habitat Loss/ Displaced Nesting
I 6.5 X
Nest Predation I 15.5 X Windthrow Change I ---- X Microclimate Change I ---- X Road Noise I ---- X Predation Pressure Change in Campgrounds
I ---- X
Vehicle-Murrelet Collisions
I ---- X
STATUS OF MARBLED MURRELET CRITICAL HABITAT Refer to Appendix 4 for an updated account of murrelet critical habitat rangewide. ENVIRONMENTAL BASELINE - Murrelet Critical Habitat (CHU WA-06a) The total of designated critical murrelet habitat on the Forest is roughly the same as that designated as LSR in the Northwest Forest Plan, or about 411,964 acres. The action area occurs in the North Hood Canal LSR RW-105) and is completely within Zone 1. This LSR encompasses approximately 42,324 acres. About 46 percent of the LSR has been identified as suitable habitat for murrelets. The amount of suitable habitat on the Forest totals 206,512 acres (USFS 2009, p. 20). CHUs on the Forest incorporate almost all blocks of suitable habitat on the Forest (USFS 2009, p. 20). CHUs on the Olympic Peninsula include WA-01 through WA-06. The action area occurs entirely with CHU WA-06a which occurs within Zone 1. Although much of the unit is

48
fragmented, large blocks of late-successional forest are present with this CHU, especially the upper watersheds. CHU WA-06a is 71,600 acres in size. About 40 percent is suitable habitat, or 26,640 acres (USFS 2009, p. 20).
Acres in LSR RW-105
Acres in CHU WA-06a Acres of nesting habitat in the CHU
42,324 71,600 26,640 (40%) Conservation Role of Critical Habitat in the Action Area The designation of critical habitat is only one of several measures available to contribute to the conservation of a listed species. Critical habitat helps focus conservation activities by identifying areas that contain essential habitat features Primary Constituent Elements (PCEs), thus alerting Federal agencies and the public to the importance of an area in the species' conservation. Critical habitat also identifies area that may require special management or protection. The identification of these areas may be helpful in planning federally regulated land use activities. The added emphasis on these areas for conservation of the species may shorten the time needed to achieve recovery (73 FR 26256:26263 [May 24, 1996]). No actions have occurred within the CHU that has resulted in loss of PCEs since 1994. To fulfill the objective of stabilizing murrelet population size, the recovery plan focuses on protecting adequate nesting habitat by maintaining and protecting occupied habitat and minimizing the loss of unoccupied but suitable habitat through several means, including the designation of critical habitat (USFWS 1997a, p. 119). As critical habitat, the action area directly contributes to that role. The murrelets in the action area require: 1) protection of nesting habitat by maintaining and protecting occupied habitat, and 2) minimizing the loss of unoccupied but suitable habitat (USFWS 1997a, p. 119). Since the action area is entirely within LSR allocation under the NWFP, the conservation emphasis is on protection and enhancement of late successional and old-growth forest ecosystems conditions which serve as habitat for late-successional and old-growth related species, including the murrelet. Threats to the CHU are fire, insect infestations, and other climate-change related consequences. No known timber harvest or other habitat-removing activities are planned within the CHU. Condition of the CHU The condition of the CHU is generally good. From descriptions of the Dosewallips watershed, the Forest, and the action area, we can surmise habitat conditions within the CHU. The CHU contains large blocks of late successional forests, low road density (about 0.5 mi per mi2 in the middle watershed), and much of the CHU is in Federal ownership with missions for forest conservation. However, the amount of low elevation forests (less than 4,000 ft) over 400 years old is very limited within the Forest in general.

49
EFFECTS OF THE ACTION - Marbled Murrelet Critical Habitat When the Service evaluates the effect of a proposed action on critical habitat, we analyze the impacts to individual CHUs in light of their overall contribution to the survival and recovery of murrelets in the Zone and the overall range of the murrelet in Washington, Oregon, and California. The proposed action would adversely affect PCE 1 by removing 6.5 acres of mature trees, many of which include trees with platforms that may support nesting. Additional PCE 1 may be adversely affected from the removal of no more than 29 danger trees within 100 ft of the new road alignment, of which an unknown number may have platforms that may support nesting. The proposed action would also adversely affect PCE 2 by removing 6.5 acres of forest with a canopy height of at least one-half a site-potential tree height within 0.5 mi of individual trees with platforms that may support nesting. Additional PCE 2s may be adversely affected from the removal of no more than 29 danger trees (20 danger trees during initial road alignment clearing plus 9 additional danger trees during construction) within 100 ft of the new road alignment. The loss of these adjacent cover trees will incrementally degrade the quality of PCE 1 in the action area. The action area occurs in CHU WA-06a. The CHU contains 71,600 acres, 40 percent (26,640 acres) of which is suitable habitat. The loss 6.5 acres of habitat and the removal of no more than 29 danger trees are small compared to the amount of suitable habitat in the CHU. Given the current condition of critical habitat in the action area and CHU Wa-06a, we do not expect the removal of this habitat would reduce or impair the ability of the CHU to provide for the conservation of the murrelet. EFFECTS OF INTERDEPENDENT AND INTERRELATED ACTIONS - Murrelets and Spotted Owls Another damaged road site occurs about 4 mi west of the action area on Park land. The Park proposes to repair the Dosewallips Road only if the Forest completes the proposed action. The Park will complete Act consultation with the Service. Road repair would consist of removing old road fill material and reconstructing the road prism by using riprap and crushed rock. All construction would occur above the ordinary high water mark of the Dosewallips River. No habitat removal or disturbance during the early nesting season is expected to occur at this time. It is therefore likely that the effects to the spotted owl and murrelet from this interdependent and interrelated action would be insignificant and/or discountable. No other interdependent and interrelated actions in the action area are known at this time. CUMULATIVE EFFECTS Cumulative effects include the effects of future State, Tribal, local, or private actions that are reasonably certain to occur in the action area considered in this Opinion. Future Federal actions that are unrelated to the proposed action are not considered in this section because they require
50
separate consultation pursuant to section 7 of the Act. All future federally permitted actions would require consultation following the implementing regulations of section 7 of the Act. Non-Federal lands do not occur within the action area; therefore, we expect no cumulative effects associated with non-Federal activities on those lands. Climate Change Climate change, and the related warming of global climate, has been well documented in the scientific literature (Bates et al. 2008; ISAB 2007). Evidence includes increases in average air and ocean temperatures, widespread melting of snow and glaciers, and rising sea level. Given the increasing certainty that climate change is occurring and is accelerating (Bates et al. 2008, p. 3; Battin et al. 2007, p. 6720) we can no longer assume that climate conditions in the future will resemble those in the past. Changing climate conditions in the future will likely have effects to murrelets through changes in prey species and their availability in the aquatic environment. Changing climate conditions would affect spotted owl prey to a lesser degree. Increased vulnerability to catastrophic wildfires may occur as climate change alters the structure and distribution of forests. Observations of the direct and indirect effects of global climate change include changes in species ranges and a wide array of environmental trends (Hari et al 2006, p. 24; ISAB 2007, p. iii; Rieman et al. 2007, p. 1552), including disturbances in the balance of forest insect pests. Increased occurrences of fire and/or insect damage could decrease potential suitable murrelet and spotted owl habitat, which would put added importance on the remaining stands that contain suitable murrelet habitat or potential habitat in the future, such as younger stands that are managed to become suitable habitat. Removing trees from critical habitat, such as in the proposed action, interferes with this process, albeit to a small degree. INTEGRATION AND SYNTHESIS In determining whether an action is likely to jeopardize the continued existence of a species, the Service analyzes the effects of the action and the effects of other activities that are interrelated or interdependent with that action, in the context of the environmental baseline. All actions are evaluated against, and added to, the environmental baseline. Spotted Owls Various efforts have addressed the conservation needs of the spotted owl, and have outlined different conservation strategies based on these needs. Each strategy is based upon the reserve design principle that includes a population well distributed across their range, large blocks of contiguous habitat, and blocks located close together with dispersal habitat between blocks. In the Status of the Species and Environmental Baseline sections of this Opinion, we established that spotted owl numbers are declining. Spotted owls in study areas covered by the Olympic Demographic Study were declining at a rate of 4.4 percent annually. The Forest contains 117 owl territories. Three of those territories overlap the action area. Of three territories, only one

51
has a core area that overlaps the action area. This territory has a core area below the 50 percent threshold while the home range territory is also below the 40 percent threshold. This territory (Mt. Jupiter) has not been surveyed since 2005 and hasn’t had spotted owl detections since 1996. Another home-range overlaps the action area and has had some spotted owl detections up to 2009. A third NSOOM-computer generated territory overlaps the action area. The proposed road alignment does not occur within core areas of these two home-ranges. Protocol surveys have not been conducted in the action area. It is assumed that the stand in which the proposed action will occur is occupied. We do not expect direct injury or mortality to spotted owls. Most tree felling will occur outside the nesting season when eggs and nestlings will be absent. Adult would likely leave the area due to the disturbance that leads up to tree felling. Danger tree felling during the nesting season poses some risk of direct injury but no more than three trees per year will require felling. All trees will be felled away from suitable habitat to the extent practicable. The likelihood that spotted owls will be exposed to injury is discountable. Any helicopter use for removing felled trees will occur outside the nesting season. However, adult spotted owls may be exposed to helicopter disturbance and prop wash. However, the effects would be temporary. Adult spotted owls are expected to temporarily move from the area of helicopter disturbance. The Service expects disturbance to nesting spotted owls during the early nesting season due to noise from heavy equipment. We anticipate 38 acres of suitable habitat will be exposed to disturbance at 92 dBA or above. Spotted owls within these 38 acres are likely to experience a significant disruption of normal behaviors. We expect spotted owl response to blasting to be similar to other disturbances, including heavy equipment. However, the 92 dBA contour for blasting is less than that for heavy equipment. Therefore, blasting would not increase the area of disturbance exposure. We established that individual spotted owl territories can shift from year to year and can exceed 2 km from their original site locations. Therefore, we used the 1.4 mi radius core area as the possible extent in which a spotted owl pair may shift their nest. Because road construction disturbance will occur during the nesting season and within a core area, there is a likelihood that the proposed action would significantly disrupt essential behaviors to a single spotted owl breeding pair associated with the Mt. Jupiter homerange. The only indirect effect to spotted owls is habitat reduction. Only one spotted owl home-range (Mt. Jupiter) that overlaps the action area is below threshold of suitable habitat in both core area and home range. Therefore, habitat removal from this territory will result in adverse effects with take. For the other home range territories, the proposed action will adversely affect suitable habitat but these homeranges are above minimum suitable habitat thresholds and take is not expected. In summary, we expect the implementation of the proposed action would result in adverse effects to one nesting pair of spotted owls within the Mt. Jupiter homerange due to the proposed action disturbance and the loss of 6.5 acres suitable habitat. We believe this effect would be permanent.

52
However, the proposed action would not be expected to significantly affect the overall number of spotted owls in the Province. The Province contains sufficient high quality habitat. Further, the proposed action is not expected to significantly affect the overall distribution of spotted owls within the Province because the amount of suitable habitat that would be removed is small. Although this action will result in the further degradation and loss of spotted owl habitat, the magnitude and the duration of these effects are limited in scale. Because the effects of the action are limited to a relatively small portion of the species habitat and range, we do not expect the effects of the proposed action to influence spotted owl populations within the Physiographic Province or within the listed coterminous range of the species. We concluded that the adverse effects from the proposed action would not contribute to an appreciable reduction in the likelihood of survival and recovery of the spotted owl in the wild by reducing the numbers, reproduction, or distribution of the species. Spotted Owl Critical Habitat The proposed action will remove 6.5 acres of NRF habitat from CHU WA-49. The loss of 6.5 acres amount to about 0.02 percent loss of suitable habitat acres for the Forest. The Service does not expect the proposed action will significantly affect the functional ability of the critical habitat unit to provide for spotted owl nesting, roosting, or foraging, nor will it appreciably effect dispersal or connectivity within the action area. The loss of 6.5 acres also does not diminish the ability of the CHUs to provide for conservation and recovery of the species and attain critical habitat goals at the Province level. Marbled Murrelets The Marbled Murrelet Recovery Plan outlined a conservation strategy that includes short-term actions and long-term conservation needs for the survival and recovery of the species. Relative to the proposed action, the conservation measures against which we measure the likelihood of the murrelet’s survival and recovery include maintaining and increasing the distribution and quality of suitable nesting habitat while minimizing disturbance and reducing predation. In the Status of the Species and Environmental Baseline sections of this Opinion, we established that murrelet abundance and distribution have been significantly reduced throughout its range. Population trends cannot be derived from current survey data, but have been estimated to be declining in all six Zones (McShane et al. 2004, p. 6-27). The estimated population decline across all conservation zones ranges from 2.0 to 15.8 percent annually (Beissinger 1995, p. 392; McShane et al. 2004, p. 6-28). The proposed action will occur within Zone 1. Compared to other zones, Zone 1 contains the largest murrelet population in the species’ listed range (Huff et al. 2003, p. 18). Zone 1 also has an estimated population decline that is lower than other Zones (Steven R. Beissinger and M.Z. Perry in litt. 2003, p. 10).

53
Much of the late successional forest habitat within Zone 1 has been replaced by development, agriculture, and managed forests. Opportunities for increasing or protecting suitable murrelet habitat are limited, which increases the importance of the remaining habitat in Zone 1. The amount of low-elevational mature forest stands on the Forest is also limited—approximately 47,750 acres, or 7.5 percent of the forest. Therefore, suitable murrelet nesting habitat on the Forest is important to the survival and recovery of the murrelet. We determined that no direct injury or mortality to murrelets would occur. Felling of road corridor trees and most danger trees would occur outside the nesting season. However, as many as three danger trees may require felling each year during the nesting season. Trees with potential for supporting murrelet nesting will be surveyed. Murrelets observed landing in a danger tree that needs to be felled will trigger reinitiation of consultation with the Service prior to felling of the danger tree. For indirect effects to murrelets, we determined that murrelets associated with about 38 acres would be exposed to disturbance during the nesting season. Nesting adults and juveniles adjacent to the road alignment may be exposed to disturbance by the project via sound from heavy equipment and blasting. Helicopter and most chainsaw noise would occur outside the nesting season. For noise disturbance, we determined that there is a likelihood that an adult will flush from a nest and expose itself, an egg, or a chick to predation. The probability that a chick would flush from the nest is so low as to be discountable. There is also a likelihood that the proposed action would result in aborted feedings or multiple delayed feeding attempts by an adult. This would represent a significant disruption of normal behavioral patterns. The proposed action will result in the loss of 6.5 acres of suitable nesting habitat. Any displaced breeding pairs will attempt to find another nest tree within the remaining habitat. We do not expect adverse effects from delays in re-nesting after the loss of suitable nesting habitat. Murrelets returning to the action area in subsequent nesting seasons will locate new nest sites in nearby suitable habitat and would not experience a significant delay in re-nesting. Because nest predation is the greatest threat to murrelets from habitat loss and fragmentation, we determined that murrelets associated with 15.5 acres of forest habitat not previously exposed to edge effect would be adversely affected as a result of the proposed action. Productivity of murrelet nests associated with habitat surrounding the new road alignment is likely to decline due to nest predation. We expect the duration of this effect would be the life of the road realignment. In summary, we determined that murrelets associated with about 38 acres would be exposed to disturbance during the nesting season. We also expect a total of 22 acres of adverse effects as a result of the proposed action due to habitat loss and adjacent habitat degradation due to predation. We believe this effect would be permanent. However, the proposed action would not be expected to significantly affect the overall reproduction of murrelets because only small amount of suitable habitat would be removed, and would occur near existing forest edges. The proposed action would not be expected to significantly affect the overall number of murrelets in the Zone. The Zone contains sufficient high quality habitat because it is unfragmented and distant from rural residences. The Zone also contains more murrelets than other Zones. Further,
54
the proposed action is not expected to significantly affect the overall distribution of murrelets within the Zone because amount of suitable habitat that would be removed is small. Finally, murrelets display high nest site fidelity and will return to the area after completion of the proposed action and re-nest. Thus, we expect murrelets to continue to maintain reproduction in the action area. Although this action will result in the further degradation and loss of murrelet habitat, the magnitude is limited in scale. Because the effects of the action are limited to a relatively small portion of the species habitat and range, we do not expect the effects of the proposed action to influence murrelet populations within Zone 1 or within the listed coterminous range of the species. We conclude that the adverse effects from the proposed action would not contribute to an appreciable reduction in the likelihood of survival and recovery of the murrelet in the wild by reducing the numbers, reproduction, or distribution of the species. Marbled Murrelet Critical Habitat The proposed action would remove 6.5 acres of PCE-1 and PCE-2 by removing all tress for the new road alignment. Additional PCE-1 and PCE-2 may be removed with the felling of no more than 29 danger trees. While the amount of critical habitat that has been lost in the CHU since its listing cannot be accurately calculated, we do not expect the removal of 6.5 acres of critical habitat in this CHU to impair its ability to provide for the conservation of the murrelet. The CHU contains a large amount of suitable habitat (over 26,000 acres) and its condition is generally good with large blocks of late successional forest and low road densities. Therefore, as a result of the proposed action, critical habitat within this Zone and all other Zones would remain functional or retain its current ability to become functional to meet the conservation needs of the species. CONCLUSION After reviewing the current status of the murrelet and spotted owl, the environmental baselines for the species in the action area, the effects of the proposed action on the species, and the cumulative effects, it is the Service’s Biological Opinion that the action, as proposed, is not likely to jeopardize the continued existence of the murrelet or the spotted owl and is not likely to destroy or adversely modify designated critical habitat of either species. This Opinion does not rely on the regulatory definition of “destruction or adverse modification” of critical habitat within 50 CFR 402.02. Instead, we have relied upon the statutory provisions of the Act and the August 6, 2004, Ninth Circuit Court of Appeals decision in Gifford Pinchot Task Force v. U.S. Fish and Wildlife Service (No. 03-35279) to complete the analysis with respect to critical habitat.

55
INCIDENTAL TAKE STATEMENT Section 9 of the Act and Federal regulation pursuant to section 4(d) of the Act prohibit the take of endangered and threatened species, respectively, without special exemption. Take is defined as to harass, harm, pursue, hunt, shoot, wound, kill, trap, capture or collect, or to attempt to engage in any such conduct. Harm is defined by the Service as an act which actually kills or injures wildlife. Such act may include significant habitat modification or degradation where it actually kills or injures wildlife by significantly impairing essential behavior patterns, including breeding, feeding, or sheltering (50 CFR 17.3). Harass is defined by the Service as an intentional or negligent act or omission which creates the likelihood of injury to wildlife by annoying it to such an extent as to significantly disrupt normal behavioral patterns which include, but are not limited to, breeding, feeding, or sheltering (50 CFR 17.3). Incidental take is defined as take that is incidental to, and not the purpose of, the carrying out of an otherwise lawful activity. Under the terms of section 7(b)(4) and section 7(o)(2), taking that is incidental to and not intended as part of the agency action is not considered to be prohibited taking under the Act provided that such taking is in compliance with the terms and conditions of this Incidental Take Statement. The measures described below are non-discretionary, and must be undertaken by the Forest so that they become binding conditions of any grant or permit issued to any applicants, as appropriate, for the exemption in section 7(o)(2) to apply. The Forest has a continuing duty to regulate the activity covered by this incidental take statement. If the Forest 1) fails to assume and implement the terms and conditions or 2) the terms and conditions of the incidental take statement through enforceable terms that are added to the permit or grant document are not adhered to, the protective coverage of section 7(o)(2) may lapse. In order to monitor the impact of incidental take, the Forest must report the progress of the action and its impact on the species to the Service as specified in the incidental take statement [50 CFR 402.14(i)(3)]. AMOUNT OR EXTENT OF TAKE Spotted Owls Harassment (Direct Effects) The Service expects incidental take due to harassment of one breeding pair of spotted owls associated with 38 acres of suitable habitat as a result of the proposed action. Incidental take will occur within the Mt. Jupiter home-range. Nesting adults incubating eggs and feeding chicks during the early nesting season (between March 1 and July 15 of the project year) would be subject to harassment as a result of road construction noise exceeding 92 dBA during the construction period (May through October) for 2 years. Elevated sound levels are expected to significantly disrupt normal behaviors by causing missed feeding(s) or flushing(s) from the nest.

56
Harm (Indirect Effects) The Service also expects the incidental take in the form of harm to one pair of spotted owls associated with the loss of 6.5 acres of NRF habitat. The loss of 6.5 acres from the Mt. Jupiter home-range, currently below threshold for suitable habitat, would impair the spotted owl pair’s ability to survive and successfully reproduce. Murrelets Harassment (Direct Effects) The Service expects incidental take in the form of harassment of all murrelets nesting within 38 acres of suitable habitat as a result of the proposed action. Nesting adults, incubating eggs and feeding chicks during the early nesting season (between April 1 and August 5 of the project year) would be subject to harassment as a result of road construction noise exceeding 92 dBA during the construction period (May through October) for 2 years. Elevated sound levels are expected to significantly disrupt normal behaviors by causing missed feeding(s) or flushing(s) from the nest. Harm (Indirect Effect) The Service expects incidental take in the form of harm of all murrelets nesting within 15.5 acres of suitable habitat adjacent to the new road alignment as a result of the proposed action due to corvid predation associated with a new forest edge. We expect the loss of recruitment of young associated with 15.5 acres for the life of the new road alignment. EFFECT OF THE TAKE - Spotted Owls and Murrelets In the accompanying Opinion, the Service determined that this level of anticipated take is not likely to result in jeopardy to the murrelets or spotted owls or result in the destruction of adverse modification of critical habitat for either species. REASONABLE AND PRUDENT MEASURES The Service believes the following Reasonable and Prudent Measures (RPMs) are necessary and appropriate to minimize the incidental take of spotted owls and murrelets. RPM 1. Minimize adverse effects to spotted owls and murrelets and their habitat. RPM 2. Monitor the nature and extent of activities that are likely to result in incidental take or adversely affect murrelets through habitat impacts. Report the results of such monitoring.
57
TERMS AND CONDITIONS In order to be exempt from the prohibitions of section 9 of the Act, the Forest must comply with the following terms and conditions (T&C), in addition to the conservation measures in the BA listed above, all of which implement the reasonable and prudent measures described above and outline required reporting/monitoring requirements. These T&Cs are non-discretionary. Implement the following T&C to fulfill RPM 1: T&C 1. Minimize the extent and likelihood of effects to spotted owls and murrelets from habitat modification:
1) To the extent practicable, choose a road alignment that requires felling the least number of large diameter trees. Where trees must be removed, choose those with the lowest likelihood for nest platforms and where adjacent trees provide the least amount of cover to trees with possible nest platforms.
2) Minimize the effects of blasting during the spotted owl and murrelet nesting seasons by using customary mitigation techniques. These could include, but are not limited to, soil overburden, blasting mats, and minimum weight charges. Consolidate blasting events temporally to the extent practicable with a goal of avoiding several consecutive days of blasting.
3) As soon as motorized access is established, install animal-proof garbage receptacles at the Elkhorn Campground to ensure that garbage is not available to corvids. Ensure containers are emptied on a schedule that prevents garbage overflow.
Implement the following T&C to fulfill RPM 2: T&C 2. In order to monitor the impacts of the proposed action and the implementation of the RPMs, the Forest shall prepare a report describing the progress of the proposed action, including implementation of the associated terms and conditions, and impacts to the murrelet (50 CFR 402.14(I)(3)). The report shall be submitted to the consulting biologist or branch manager of the Washington State Office on or before January 31, annually until project completion. Electronic correspondence is acceptable for the reporting. The monitoring report shall include the following:
1) Report the number, species, and dbh of all felled trees over 21 inch dbh for the road alignment, including danger trees. Report any evidence of nesting material observed.
2) Report to the extent practicable any non-target “potential nest trees”4 outside the clearing limit that had nesting structures damaged from tree felling. A description of the non-target tree shall include the species, the dbh, and the extent that nesting structures were lost, if any.
4 “Potential nest tree” used here follows the Forest Service definition of trees currently capable of supporting spotted owl and murrelet nesting due to favorable structures such as broken tops, large cavities, or large branches with overhead cover from branches. It does not imply trees currently unable but capable of supporting nesting in the future.

58
3) Inspect danger trees that meet the definition of potential nest trees that were felled during the spotted owl and murrelet nesting seasons. Report the date the potential nest tree was felled, the species, the dbh, the specific location, the extent of nesting structure, and whether the tree contained evidence of spotted owl or murrelet nesting activity, and a description of the nesting evidence, if observed.
4) If blasting was required, report the dates blasting occurred, how many blasts occurred each day, the location of the blast, the size of the charge, the approximate depth the charge was placed, the amount of overburden and/or type of blasting mats used, and any other sound mitigation measures.
5) Design and implement a sound monitoring program for road construction activities that require heavy equipment for which sound data are lacking. The final sound monitoring program will be developed and agreed upon by the Forest and the Service.
The RPMs, with their implementing terms and conditions, are designed to minimize the impact of incidental take from the proposed action. If, during the course of the proposed action, this level of incidental take is exceeded, such incidental take represents new information requiring reinitiation of consultation and review of the reasonable and prudent measures provided. The Forest must immediately provide an explanation of the causes of the taking and review with the Service the need for possible modification of the RPMs. The Service is to be notified within three working days upon locating a dead, injured or sick endangered or threatened species specimen. Initial notification must be made to the nearest U.S. Fish and Wildlife Service Law Enforcement Office. Notification must include the date, time, precise location of the injured animal or carcass, and any other pertinent information. Care should be taken in handling sick or injured specimens to preserve biological materials in the best possible state for later analysis of cause of death, if that occurs. In conjunction with the care of sick or injured endangered or threatened species or preservation of biological materials from a dead animal, the finder has the responsibility to ensure that evidence associated with the specimen is not unnecessarily disturbed. Contact the U.S. Fish and Wildlife Service Law Enforcement Office at (425) 883-8122, or the Services Washington Fish and Wildlife Office at (360) 753-9440.
CONSERVATION RECOMMENDATIONS Section 7(a)(1) of the Act directs Federal agencies to utilize their authorities to further the purposes of the Act by carrying out conservation programs for the benefit of endangered and threatened species. Conservation recommendations are discretionary agency activities to minimize or avoid adverse effects of a proposed action on listed species or critical habitat, to help implement recovery plans, or to develop information. The Service offers the following conservation recommendations to the Forest to promote the recovery of federally listed species and their habitats:
1) Employ all protection measures feasible to retain the largest available snags, trees, and down woody debris for the purpose of increasing the quality of nesting, roosting, and foraging habitat.
59
2) Top or high stump danger trees, where feasible, to retain as much structure as possible. 3) Design and facilitate a corvid monitoring study to better understand and possibly quantify
or qualify the indirect effects of the proposed action on murrelet nests due to corvid predation in cooperation with the Service and other State and Federal agencies and private entities. The goal of such a study is to accurately predict the magnitude of increased corvid predation within new forest edges at a scale of the proposed action.
4) Ensure contractors do not leave garbage at work areas, as that may attract corvids and increase the likelihood of predation on nesting murrelets and/or their chicks.
5) Monitor compliance with all conservation measures described in the project description and submit the results of that monitoring to the Service by January 31 annually until project completion.
6) Ensure availability of visitor outreach information and education that speaks specifically to the effects of predation on murrelets and the role human food plays in attracting predators. While outreach information may currently address food and garbage control for the purpose of aesthetics, attracting nuisance animals such as raccoons, or creating animal dependence on human food, expanding the scope of the reasoning to the potential extirpation of local endangered species may heighten public awareness as to the consequences of their behavior.
In order for the Service to be kept informed of actions minimizing or avoiding adverse effects or benefiting listed species or their habitats, the Service requests notification of the implementation of any conservation recommendations. This report may be in the form of email correspondence to the Level 1 Team.
REINITIATION NOTICE This concludes formal consultation on the action outlined in the request. As provided in 50 CFR 402.16, reinitiation of formal consultation is required where discretionary Federal agency involvement or control over the action has been retained (or is authorized by law) and if: 1) the amount or extent of incidental take is exceeded; 2) new information reveals effects of the agency action that may affect listed species or critical habitat in a manner or to an extent not considered in this Opinion; 3) the agency action is subsequently modified in a manner that causes an effect to the listed species or critical habitat not considered in this Opinion; or 4) a new species is listed or critical habitat designated that may be affected by the action. In instances where the amount or extent of incidental take is exceeded, any operations causing such take must cease pending reinitiation.
60
LITERATURE CITED Awbrey, F.T., and A.E. Bowles. 1990. The effects of aircraft noise and sonic booms on raptors-
a preliminary model and synthesis of the literature on disturbance. U.S. Air Force, Wright-Patterson AFB, Ohio.
Bart, J. 1995. Amount of suitable habitat and viability of northern spotted owls. Conservation Biology 9:943–946.
Bart, J., and E.D. Forsman. 1992. Dependence of northern spotted owls Strix occidentalis caurina on old-growth forests in the western USA. Biological Conservation 62:95-100.
Bates, B., Z.W. Kundzewicz, S. Wu, and J. Palutikof. 2008. Climate change and water. Intergovernmental Panel on Climate Change, Secretariat, Geneva, June, 2008. 210 pp.
Battin, J., M.W. Wiley, M.H. Ruckelshaus, R.N. Palmer, E. Korb, K.K. Bartz, and H. Imaki. 2007. Projected impacts of climate change on salmon habitat restoration. Proceedings of the National Academy of Sciences of the United States of America 104(16):6720-25.
Beissinger, S.R. 1995. Population trends of the marbled murrelet projected from demographic analyses. Pages 385-93. In: Ralph, C.J., G.L. Hunt, M.G. Raphael, and J.F. Piatt (eds). Ecology and conservation of the marbled murrelet. General Technical Report: PSWGTW- 152. Pacific Southwest Experimental Station, U.S. Forest Service, Albany, California. 420 pp.
Beissinger, S.R. and M.Z. Peery. 2003. Rangewide analysis of juvenile ratios from marbled murrelet monitoring programs: Implications for demographic analyses. University of California, Berkeley, CA. 30 pp.
Bloxton, T.D., and M.G. Raphael. 2009. Breeding ecology of the marbled murrelet in Washington State: Five year project summary (2004-2008). Unpublished report. Pacific Northwest Research Station, Olympia, Washington.
Brown, A.L. 1990. Measuring the effect of aircraft noise on sea birds. Environment International 16:587-92.
Carlsen, Elisa. 2009. Environmental Protection Specialist, Federal Highway Administration, Vancouver, Washington. Telephone and Email communications with Mark Hodgkins, Fish and Wildlife Biologist, Washington Fish and Wildlife Office, U.S. Fish and Wildlife Service, Lacey, Washington. Topic: Typical approaches to blasting techniques and conservation measures for small roads, and expected sound levels. December 2, 2009.
Cooper, B.A., M.G. Raphael, and D.Eans Mack. 2001. Radar-based monitoring of marbled murrelets. The Condor 103:210-229.
Delaney, D.K., T.G. Grubb, P. Beier, L.L. Pater, and M.H. Reiser. 1999. Effects of helicopter noise on Mexican spotted owls. Journal of Wildlife Management 63:60-76.

61
Divoky, G.J., and M. Horton. 1995. Breeding and natal dispersal, nest habitat loss and implications for marbled murrelet populations. Pp. 83-87 in: Ralph, C.J., G.L. Hunt, Jr., M.G. Raphael, and L.F. Piatt (tech. eds.), Ecology and conservation of the marbled murrelet. Gen. Tech. Rep. PSW-GTR-152. Albany, California: Pacific Southwest Research Station, USDA Forest Service. 420 pp.
Dugger, K.M., F. Wagner, R.G. Anthony, and G.S. Olson. 2005. The relationship between habitat characteristics and demographic performance of northern spotted owls in southern Oregon. The Condor 107:863–878.
Falxa, G.A., J. Baldwin, D. Lynch, S.K. Nelson, S.L. Miller, S.F. Pearson, M.G. Raphael, C. Strong, T. Bloxton, B. Galleher, B. Hogoboom, M. Lance, and R. Young. 2009. DRAFT Marbled murrelet effectiveness monitoring, Northwest Forest Plan: 2008 summary report. Dated May 28, 2009. 18 pp.
Federal Highway Administration. 2010. Roadway construction noise model user’s guide. www.fhwa.dot.gov/environmental/noise/rcnm/intro.htm. Accessed May 3, 2010.
Forsman, E.D., E.C. Meslow, and H.M. Wight. 1984. Distribution and biology of the spotted owl in Oregon. Wildlife Monographs 87:1-64.
Forsman, E.D., T.J. Kaminsky, J.C. Lewis, K.J. Maurice, and S. S.G. Sovern. 2005. Home range and habitat use of northern spotted owls on the Olympic Peninsula, Washington. Journal of Raptor Research 39(4):365-377.
Gremel, S. 2003. Spotted owl monitoring in Olympic National Park: 2003 annual report. Preliminary report; spotted owl project. April 24, 2003. 15 pp.
Gremel, S. 2007. Spotted owl monitoring in Olympic National Park: 2007 annual report. U.S. Department of the Interior, National Park Service, Olympic National Park, Port Angeles, Washington. 16 pp.
Gremel, S. 2010. Natural Resource Specialist. Telephone conversation with Mark Hodgkins, Fish and Wildlife Biologist, Washington Fish and Wildlife Office, USFWS. Lacey Washington. Discussed the 2009 Constance fire within Olympic National Park and Olympic National Forest. March 31, 2010.
Hamer, T.E. and S.K. Nelson. 1995. Nesting Chronology of the marbled murrelet. In: Ralph, C.J., G.L. Hunt, M.G. Raphael, and J.F. Piatt (eds). Ecology and conservation of the marbled murrelet. U.S. Department of Agriculture Forest Service, Pacific Southwest Research Station, General Technical Report PSW-152, Albany, California. 420 pp.
Hanson, E., D. Hays, L. Hicks, L. Young, and J. Buchanan. 1993. Spotted Owl Habitat in Washington: A report to the Washington Forest Practices Board. Washington Forest Practices Board, Spotted owl Advisory Group. Final Report: December 20, 1993. Olympia, Washington. 116 pp.
62
Hebert, P.N., and R.T. Golightly. 2007. Observations of predation by corvids at a marbled murrelet nest. Journal of Field Ornithology. 78(2):221-24.
Hari, R.E., D.M. Livingstone, R. Siber, P. Burkhardt-Holm, and H. Guttinger. 2006. Consequences of climatic change for water temperature and brown trout populations in Alpine rivers and streams. Global Change Biology 12(1):10-26.
Hicks, L.L., D.R. Herter, and R.J. Early. 2003. Clines in life history characteristics of the spotted owl in Washington. Northwestern Naturalist 84:57-67.
Holtrop, K. 2010. Wildlife Biologist, U.S. Forest Service, Olympia, Washington. Email to Mark Hodgkins, Fish and Wildlife Biologist, Washington Fish and Wildlife Office, U.S. Fish and Wildlife Service, Lacey, Washington. Discussed the approximate number of danger trees requiring removal from forests adjacent to the new road alignment (20 trees). February 19, 2010.
Huff, M.H., P. Jodice, J. Baldwin, S. Miller, R. Young, K. Ostrom, C.J. Ralph, M. Raphael, C. Strong, C. Thompson, and G. Falxa. 2003. Marbled murrelet effectiveness monitoring - Northwest Forest Plan 2002 annual summary report. 27 pp.
Hull, C.L., G.W. Kaiser, C. Lougheed, L. Lougheed, S. Boyd, and F. Cooke. 2001. Intraspecific variation in commuting distance of marbled murrelets (Brachyramphus marmoratus): Ecological and energetic consequences of nesting further inland. The Auk 118(4):1036-46.
ISAB (Independent Scientific Advisory Board). 2007. Climate change impacts on Columbia River Basin Fish and Wildlife. ISAB 2007-2. Northwest Power and Conservation Council, Portland, Oregon, May 11, 2007. 146 pp.
Karen Holtrop. 2010. Wildlife Biologist, U.S. Forest Service, Olympia, Washington. Email conversation with Mark Hodgkins, Fish and Wildlife Biologist, Washington Fish and Wildlife Office, U.S. Fish and Wildlife Service, Lacey, Washington; on February 19, 2010. Topic: Estimation of danger trees that will be removed during the early spotted owl nesting season.
LaHaye, W.S., R.J. Guiterrez, and J.R. Dunk. 2001. Natal dispersion of the spotted owl in southern California: dispersal profile of an insular population. Condor 103:691–700.
Long, L.L., and J.C. Ralph. 1998. Regulation and observations of human disturbance near nesting marbled murrelets. Pacific Southwest Research Station, Arcata, California. 35 pp.
Malt, J.M., and D.B. Lank. 2009. Marbled murrelet nest predation risk in managed forest landscapes: dynamic fragmentation effects at multiple scales. Ecological Applications 19 (5):1274-1287.

63
Miller, S.L., J. Ralph, M.G. Raphael, C. Strong, C. W. Thompson, J. Baldwin, M.H. Huff, and G. A. Falxa. 2008. At-sea monitoring of marbled murrelet population status trend in the Northwest Forest Plan area. In: Northwest Forest Plan—the first 10 years (1994-2003): status and trends of population and nesting habitat for the marbled murrelet. M.H. Huff, M.G. Raphael, S.L. Miller, S.K. Nelson and J. Baldwin, eds. General Technical Report PNW-GTR-650. May 2006.
McShane, C., T.E. Hamer, H.R. Carter, R.C. Swartzman, V.L. Friesen, D.G. Ainley, K. Nelson, A.E. Burger, L.B. Spear, T. Mohagen, R. Martin, L. Henkel, K. Prindle, C. Strong, and J. Keany. 2004. Evaluation reports for the 5-year status review of the marbled murrelet in Washington, Oregon, and California. EDAW, Inc., Seattle, Washington. 370 pp.
Meyer, C.B., S.L. Miller, and C.J. Ralph. 2002. Multi-scale landscape and seascape patterns associated with marbled murrelet nesting areas on the U.S. west coast. Landscape Ecology 17:95-115.
Neatherlin, E.A. 2002. Corvid response to human settlement and recre4ation with implications for marbled murrelets. Masters Thesis. University of Washington, Seattle, Washington. 80 pp.
Nelson, S.K. and T.E. Hamer. 1995a. Nest success and the effects of predation on marbled murrelets. Pages 89-97. In: Ralph, C.J., G.L. Hunt, M.G. Raphael, and J.F. Piatt (eds). Ecology and conservation of the marbled murrelet. General Technical Report. PSW-GTW-152. Pacific Southwest Experimental Station, U.S. Forest Service, Albany, California. 420 pp.
Nelson, S.K., and T.E. Hamer. 1995b. Nesting biology and behavior of the marbled murrelet. Pages 57-67. In: Ralph, C.J., G.L. Hunt, M.G. Raphael, and J.F. Piatt (eds). Ecology and conservation of the marbled murrelet. General Technical Report. PSW-GTW-152. Pacific Southwest Experimental Station, U.S. Forest Service, Albany, California. 420 pp.
Nelson, S.K. 1997. The birds of North America, No. 276 - Marbled Murrelet (Brachyramphus marmoratus). In: A. Poole and F. Gill (Eds.). The birds of North America: life histories for the 21st century.
Nelson, S.K., and R.W. Peck. 1995. Behavior of marbled murrelets at nine nest sites in Oregon. Northwestern Naturalist 76 (1):43-53.
Parris, K. M., and A. Schneider 2008. Impacts of traffic noise and traffic volume on birds of roadside habitats. Ecology and Society 14(1): 29. [online] URL: http://www.ecologyandsociety.org/vol14/iss1/art29/
Pearson, R.R., and K.B. Livezey. 2003. Distribution, numbers, and site characteristics of spotted owls and barred owls in the Cascade Mountains of Washington. Journal of Raptor Research 37:265–276.
64
Peery, M.Z., S.R. Beissinger, S.H Newman, E.B. Burkett, and T.D Williams. 2004a. Applying the declining population paradigm: diagnosing causes of poor reproduction in the marbled murrelet. Conservation Biology. 18(4):1088-1098.
Peery, M.Z., S.R. Beissinger, S.H Newman, E.B. Burkett, and T.D Williams. 2004b. Individual and temporal variation in inland flight behavior of marbled murrelets: Implications for population monitoring. The Condor 106:344-353
Piper, Susan. 2010. Wildlife, Botany, and Invasive Plant Program Manager, Olympic National Forest, Forest Supervisor Office, Olympia, Washington. Personal communication with Mark Hodgkins, Fish and Wildlife Biologist, Washington Fish and Wildlife Office, U.S. Fish and Wildlife Service, Lacey, Washington. Telephone conversation concerning the current use of the Elkhorn Campground on the Olympic National Forest which is close to the action area. March 29 and 30, 2010.
Raphael, M.G., D.E. Mack, and B.A. Cooper. 2002. Landscape-scale relationships between abundance of marbled murrelets and distribution of nesting habitat. The Condor 104:331-341.
Raphael, M. G., S. K. Nelson, P. Swedeen, M. Ostwald, K. Flotlin, S. Desimone, S. Horton, P. Harrison, D. Prenzlow Escene, and W. Jaross. 2008. Recommendations and supporting analysis of conservation opportunities for the marbled murrelet long-term conservation strategy. Washington State Department of Natural Resources, Olympia, WA. 337 pp.
Rieman, B.E., D. Isaak, S. Adams, D. Horan, D. Nagel, C. Luce, and D. Myers. 2007. Anticipated climate warming effects on bull trout habitats and populations across the interior Columbia River Basin. Transactions of the American Fisheries Society 136(6):1552-65.
Simons, T.R. 1980. Discovery of a ground-nesting marbled murrelet. The Condor 82(1):1-9.
Simonson, B. 2009. Sound measurements of helicopters during logging operations. USDA Forest Service. <http://fsweb/programs/im/sound_measure/helo_indes.shtml>. Accessed April 3, 2009.
Shelmerdine, R. 2010. Geologist, Olympic National Forest, Forest Supervisor Office, Olympia, Washington. Email correspondence with Mark Hodgkins, Fish and Wildlife Biologist, Washington Fish and Wildlife Office, U.S. Fish and Wildlife Service, Lacey, Washington. Topic: preliminary plans for blasting.
Stalmaster, M.V., and J.L. Kaiser. 1997. Flushing responses of wintering bald eagles to military activity. Journal of Wildlife Management 61(4):1307-13.
Tehan, M. 1991. Narratives for the final designation of critical habitat for the northern spotted owl in Washington. Unpublished report. U.S. Fish and Wildlife Service, Portland, Oregon. 25 pp.
65
Tucker, Terry. 2010. Resource Specialist, Olympic National Park, Washington. Telephone conversation with Marc Whisler and Mark Hodgkins, Fish and Wildlife Biologist, Washington Fish and Wildlife Office, U.S. Fish and Wildlife Service, Lacey, Washington. Topic: Visitor use of the Dosewallips Campground. March 23, 2010.
U.S. Department of Agriculture (USDA). 1999. Integrated weed management program and environmental assessment. May 11,1999. USDA Forest Service, Olympic National Forest, Olympia, Washington. 36 pp.
U.S. Department of the Interior (USDI). 1994. Biological Opinion on Alternative 9 (SEIS). In: USDA and USDI 1994. Final supplemental environmental impact statement on management for habitat for late successional and old-growth forest related species within the range of the northern spotted owl. Volume II-Appendices. Appendix G.
U.S. Forest Service (USFS). 1990. Land and resource management plan: Mt. Baker-Snoqualmie National Forest: Final environmental impact statement. USDA, Washington, DC, June 1990.USFS. 2000. Land and resource management plan. Olympic National Forest, Pacific Northwest Region. USDA Forest Service, Olympia, Washington.
USFS. 2009. Biological Assessment for the Dosewallips Washout Project for terrestrial species. October 23, 2009. Olympic National Forest, Olympia, Washington. 47 pp.
USFS, and USBLM (U.S. Bureau of Land Management). 1994. Record of decision for amendments to Forest Service and Bureau of Land Management planning documents within the range of the northern spotted owl; standards and guidelines for management of habitat for late-successional and old-growth forest related species within the range of the northern spotted owl. Portland, Oregon.
USFS, and USDI Bureau of Land Management. 1994. Final supplemental environmental impact statement on management of habitat for late-successional and old-growth forest related species within the range of the northern spotted owl. Portland, Oregon. 2 vols. and appendices.
U.S. Fish and Wildlife Service (USFWS). 1990. Procedures leading to Endangered Species Act compliance for the northern spotted owl. Unpublished agency guidance document. U.S. Fish and Wildlife Service, Region 1. Portland, OR. 35 pp.
USFWS. 1992. Draft final recovery plan for the northern spotted owl. U.S. Fish and Wildlife Service. 2 Volumes. Portland, Oregon.
USFWS. 1995. Biological/conference opinion regarding a proposed amendment to and approval of an implementation agreement for an incidental take permit (PRT-777837) held by the Murray Pacific Corporation for Mineral Tree Farm, Lewis County, Washington (FWS Reference: 1 -3-95-FW-0919; x-ref: 1 -3-95-HCP-SP-004). June 23, 1995.
USFWS. 1997a. Recovery plan for the threatened marbled murrelet (Brachyramphus marmoratus) in Washington, Oregon, and California. Portland, Oregon. 203 pp.

66
USFWS. 1997b. Intra-Service concurrence memorandum and biological opinion on the proposed issuance of an incidental take permit (PRT- 8 1252 1) for spotted owls, marbled murrelets, gray wolves, grizzly bears, bald eagles, peregrine falcons, Aleutian Canada geese, Columbian white-tailed deer, and Oregon silverspot butterflies, and the approval of the implementation agreement for the Washington State Department of Natural Resources Habitat Conservation Plan (FWS Reference: 1-3-96-FW-594; X-Reference: 1 -3-9-HCP- 013).
USFWS. 2003. Biological opinion and letter of concurrence for effects to bald eagles, marbled murrelets, northern spotted owls, bull trout, and designated critical habitat for marbled murrelets and northern spotted owls from Olympic National Forest program of activities for August 5, 2003, to December 31, 2008. Washington Fish and Wildlife Office, U.S. Fish and Wildlife Service, Lacey, Washington.
USFWS. 2004. Estimated trends in suitable habitat for the northern spotted owl (Strix occidentalis caurina) on Federal lands from 1994-2003. For use by: Sustainable Ecosystems Institute for the northern spotted owl 5-year review.
USFWS. 2008. Final Recovery Plan for the Northern Spotted Owl, Strix occidentalis caurina. U.S. Fish and Wildlife Service, Portland, Oregon. xii + 142 pp.
USFWS, US Bureau of Land Management, and US Forest Service. 2008. Methodology for estimating the number of northern spotted owls affected by proposed Federal actions, version 2.0. September 15, 2008. U.S. Fish and Wildlife Service. Oregon Fish and Wildlife Office, Portland Oregon. 34 pp.
USFWS, and National Marine Fisheries Service. 1998. Endangered species consultation handbook: procedures for conducting section 7 consultations and conferences. US Government Printing Office, Washington, DC.
Zharikov, Y., D.B. Lank, F. Huettman, R.W. Bradley, N. Parker, P.P.W. Yen, L.A. McFarlane-Tranquilla, and F. Cooke. 2006. Habitat selection and breeding success in a forest nesting alcid, the marbled murrelet, in two landscapes with different degrees of forest fragmentation. Landscape Ecology 21:107-120.

67
APPENDICES Appendix 1: Status of the Species: Northern Spotted Owl Appendix 2: Status of Critical Habitat: Northern Spotted Owl Appendix 3: Status of the Species: Marbled Murrelet Appendix 4: Status of Critical Habitat: Marbled Murrelet

68
Appendix 1: Status of the Species: Northern Spotted Owl
1
Appendix 1 Status of the Species: Northern Spotted Owl
Legal Status The northern spotted owl (Strix occidentalis caurina) (spotted owl) was listed as federally threatened on June 26, 1990 under the ESA. It was listed due to widespread habitat loss across its entire range and the inadequacy of existing regulatory mechanisms to provide for its conservation (55 FR 26114-26194). Life History Taxonomy The northern spotted owl is one of three subspecies of spotted owls currently recognized by the American Ornithologists’ Union. The taxonomic separation of these three subspecies is supported by genetic (Barrowclough and Gutiérrez 1990; Barrowclough et al. 1999; Haig et al. 2004), morphological (Gutiérrez et al. 1995), and biogeographic information (Barrowclough and Gutiérrez 1990). The distribution of the Mexican subspecies (S. o. lucida) is separate from those of the northern and California (S. o. occidentalis) subspecies (Gutiérrez et al. 1995). Recent studies analyzing mitochondrial DNA sequences (Chi et al. 2004; Gutierrez and Barrowclough 2005; Haig et al. 2004) and microsatellites (Henke et al. 2005) confirmed the validity of the current subspecies designations for northern and California spotted owls. The narrow hybrid zone between these two subspecies, which is located in the southern Cascades and northern Sierra Nevadas, appears to be stable (Gutierrez and Barrowclough 2005). Physical Description The spotted owl is a medium-sized owl, approximately 18-19 in (46-48 cm) in length and approximately 1.1-1.9 lbs (490-850 gm) in weight (Gutiérrez et al. 1995), and is the largest of the three subspecies (Gutiérrez et al. 1995). It is dark brown with a barred tail and white spots on the head and breast, and has dark brown eyes that are surrounded by prominent facial disks. Three age classes can be distinguished on the basis of plumage characteristics (Forsman 1981; Moen et al. 1991). The spotted owl superficially resembles the barred owl (Strix varia), a species with which it occasionally hybridizes (Kelly et al. 2003). Hybrids exhibit characteristics of both species (Hamer et al. 1994). Current and Historical Range The current range and distribution of the spotted owl extends from southern British Columbia through western Washington, Oregon, and California as far south as Marin County (USFWS 1990). The southeastern boundary of its range is the Pit River area of Shasta County, California. The range of the spotted owl is partitioned into 12 physiographic provinces (provinces), based upon recognized landscape subdivisions exhibiting different physical and environmental features (Thomas et al. 1993a). These provinces are distributed across the range as follows:

2
• Four provinces in Washington: Eastern Washington Cascades, Olympic Peninsula, Western Washington Cascades, Western Washington Lowlands
• Five provinces in Oregon: Oregon Coast Range, Willamette Valley, Western Oregon
Cascades, Eastern Oregon Cascades, Oregon Klamath
• Three provinces in California: California Coast, California Klamath, California Cascades The current range of the spotted owl is similar to its historical range where forested habitat still exists. The distribution of habitat is influenced by the natural and human-caused fragmentation of vegetation and natural topography. The spotted owl has been extirpated or is uncommon in certain areas. For instance, there have only been a few nesting pairs in southwestern Washington for a number of years, although they have persisted there for the past decade. Timber harvest activities have eliminated, reduced, or fragmented spotted owl habitat and decreased overall population densities across its range, particularly within the coastal provinces where habitat reduction has been concentrated (Thomas et al. 1993b). Behavior Spotted owls are territorial. However, home ranges of adjacent pairs overlap (Forsman et al. 1984; Solis and Gutiérrez 1990)) suggesting that the area defended is smaller than the area used for foraging. Territorial defense is primarily effected by hooting, barking and whistle type calls. Some spotted owls are not territorial but either remain as residents within the territory of a pair or move among territories (Gutiérrez 1996). These birds are referred to as “floaters.” Floaters have special significance in spotted owl populations because they may buffer the territorial population from decline (Franklin 1992). Little is known about floaters other than that they exist and typically do not respond to calls as vigorously as territorial birds (Gutiérrez 1996). Spotted owls are monogamous and usually form long-term pair bonds. “Divorces” occur but are relatively uncommon. There are no known examples of polygyny in this owl, although associations of three or more birds have been reported (Gutiérrez et al. 1995). Habitat Relationships Home Range Spotted owl home range size varies by province. Home range size generally increases from south to north, which is likely in response to differences in habitat quality (USFWS 1990). Home range size has been linked to habitat type, availability, and abundance of prey (Zabel et al. 1995). Based on available radio-telemetry data (Thomas et al. 1990), the U.S. Fish and Wildlife Service (Service) estimated median annual home range size for the spotted owl by province throughout its range. Because the actual configuration of the home range is rarely known, the estimated home range of a spotted owl pair is represented by a circle centered upon a spotted owl activity center, with an area approximating the provincial median annual home range. For example,
3
estimated home range area varies from 3,340 acres (based on a 1.3-mile radius area) in California to 14,271 acres (based on a 2.7-mile radius circle) in Washington. The Service uses a 0.7-mile radius circle (984 acres) to delineate the area most heavily used (core area) by spotted owls during the nesting season. Variation in the size of the actual core area also varies geographically. For example, spotted owls in northern California focused their activities in core areas that ranged from about 167 to 454 acres, with a mean of about 409 acres; approximately half the area of the 0.7-mile radius circle (Bingham and Noon 1997). Spotted owls maintain smaller home ranges during the breeding season and often dramatically increase their home range size during fall and winter (Forsman et al. 1984; Sisco 1990). Although differences exist in natural stand characteristics that influence provincial home range size, habitat loss and forest fragmentation effectively reduce habitat quality in the home range. A reduction in the amount of suitable habitat reduces spotted owl abundance and nesting success (Bart 1995; Bart and Forsman 1992). Habitat Use Forsman et al. (1984) reported that spotted owls have been observed in the following forest types: Douglas-fir (Pseudotsuga menziesii), western hemlock (Tsuga heterophylla), grand fir (Abies grandis), white fir (Abies concolor), ponderosa pine (Pinus ponderosa), Shasta red fir (Abies magnifica shastensis), mixed evergreen, mixed conifer hardwood (Klamath montane), and redwood (Sequoia sempervirens). In parts of the Oregon Coast Range, spotted owls have been recorded in pure hardwood stands (Glenn et al. 2004). In California, spotted owls are found from near sea level in coastal forests to approximately 6,988 ft (2,130 m) in the Cascades (Gutiérrez 1996). The upper elevation limit at which spotted owls occur decreases gradually with increasing latitude in Oregon and Washington (Lint 2005). In all areas, the upper elevation limit at which spotted owls occur corresponds to the transition to subalpine forest, which is characterized by relatively simple structure and severe winter weather (Gutiérrez 1996). Roost sites selected by spotted owls have more complex vegetation structure than forests generally available to them (Barrows and Barrows 1978; Forsman et al. 1984; Solis and Gutiérrez 1990). These habitats are usually multi-layered forests having high canopy closure and large diameter trees in the overstory. Spotted owls nest almost exclusively in trees. Like roosts, nest sites are found in forests having complex structure dominated by large diameter trees (Forsman et al. 1984; Hershey et al. 1998). Even in forests that have been previously logged, spotted owls select forests having a structure (i.e., larger trees, greater canopy closure) different than forests generally available to them (Buchanan et al. 1995; Folliard 1993; Hershey et al. 1998). Foraging habitat is the most variable of all habitats used by territorial spotted owls (Thomas et al. 1990). Descriptions of foraging habitat have ranged from complex structure (Solis and Gutiérrez 1990) to forests with lower canopy closure and smaller trees than forests containing nests or roosts (Gutiérrez 1996).
4
Dispersal habitat, at a minimum, consists of stands with adequate tree size and canopy closure to provide protection from avian predators and at least minimal foraging opportunities (USFWS 1992). Although Forsman et al. (2002) found that spotted owls could disperse through highly fragmented forest landscapes, the stand-level and landscape-level attributes of forests needed to facilitate successful dispersal have not been thoroughly evaluated (Buchanan 2004). Habitat Selection Spotted owls generally rely on older forested habitats because they contain the structures and characteristics required for nesting, roosting, foraging, and dispersal. These characteristics include the following: 1) a multi-layered, multi-species canopy dominated by large overstory trees, 2) moderate to high canopy closure, 3) a high incidence of trees with large cavities and other types of deformities, especially dwarf mistletoe brooms, 4) numerous large snags, 5) an abundance of large, dead wood on the ground, and 6) open space within and below the upper canopy for spotted owls to fly (Thomas et al. 1990; USFWS 1990). Forested stands with high canopy closure also provide thermal cover (Weathers et al. 2001), as well as protection from predation. Recent landscape-level analyses in portions of the Klamath Province suggest that a mosaic of late-successional habitat interspersed with other vegetation types may benefit spotted owls more than large, homogeneous expanses of older forests (Franklin et al. 2000; Meyer et al. 1998; Zabel et al. 2003). Spotted owls may be found in younger forest stands that have the structural characteristics of older forests or retained structural elements from the previous forest. In redwood forests along the coast range of California, spotted owls may be found in younger forest stands with structural characteristics of older forests (Thomas et al. 1990). However, spotted owls do not generally appear to select for stands of intermediate or younger ages (Solis and Gutiérrez 1990; Thomas et al. 1990). Where spotted owls have been found nesting in young forest, such occurrences have been attributed to the presence of large residual trees with cavities (Buchanan et al. 1993), climatic conditions conducive to the use of platform nests (Forsman and Giese 1997), and/or alternate sources of prey that do not rely on cavities for reproduction (Zabel et al. 1995). In Washington, foraging occurs in nesting and roosting habitat, as well as in coniferous forest with smaller trees and less structural diversity, if prey such as the northern flying squirrel are present (Hanson et al. 1993). In mixed conifer forests of the Eastern Cascade Mountains, Washington, 27 percent of nest sites were in old-growth forests, 57 percent in the understory reinitiation phase of forest stand development, and 17 percent in the stem exclusion phase of forest stand development (Buchanan et al. 1995). In the Western Cascade Mountains, Oregon, 50 percent of spotted owl nests were in late-seral/old-growth stands (greater than 80-years-old) and none were found in stands less than 40-years-old (Irwin et al. 2000). In the Western Washington Cascade Mountains, spotted owls used mature/old forests dominated by trees greater than 20 in (50 cm) diameter-at-breast height with greater than 60 percent canopy closure more often than expected for roosting during the non-breeding season and used young forest trees 8 to 20 in (20 to 50 cm) diameter-at-breast height with greater than 60 percent canopy closure) less often than expected based on availability (Herter et al. 2002).
5
Habitat use is influenced by prey availability. Ward (1990) found that spotted owls foraged in areas that had lower variance in prey densities (prey were more predictable in occurrence) within older forests and near ecotones of old forest and brush seral stages. Zabel et al. (1995) showed that spotted owl home ranges are larger where flying squirrels are the predominant prey and, conversely, are smaller where woodrats (Neotoma spp.) are the predominant prey. Recent landscape-level analyses in portions of Oregon Coast and California Klamath provinces suggest that a mosaic of late-successional habitat interspersed with other seral conditions may benefit spotted owls more than large, homogeneous expanses of older forests (Franklin et al. 2000; Meyer et al. 1998; Zabel et al. 2003). In Oregon Klamath and Western Oregon Cascade provinces, Dugger et al. (2005) found that apparent survival and reproduction was positively associated with the proportion of older forest near the territory center (within 730 meters) (2,395 feet). Survival decreased dramatically when the amount of non-habitat (non-forest areas, sapling stands, etc.) exceeded approximately 50 percent of the home range (Dugger et al. 2005). The authors concluded that they found no support for either a positive or negative direct effect of intermediate-aged forest—that is, all forest stages between sapling and mature, with total canopy cover greater than 40 percent—on either the survival or reproduction of spotted owls. It is unknown how these results were affected by the low habitat fitness potential in their study area, which Dugger et al. (2005) stated was generally much lower than those in Franklin et al. (2000) and Olson et al. (2004), and the low reproductive rate and survival in their study area, which they reported were generally lower than those studied by Anthony et al. (2006). Olson et al. (2004) found that reproductive rates fluctuated biennially and were positively related to the amount of edge between late-seral and mid-seral forests and other habitat classes in the central Oregon Coast Range. Olson et al. (2004) concluded that their results indicate that while mid-seral and late-seral forests are important to spotted owls, a mixture of these forest types with younger forest and non-forest may be best for spotted owl survival and reproduction in their study area. Reproductive Biology Spotted owls exhibit high adult annual survival rates and are relatively long-lived (Anthony et al. 2006). Spotted owls do not typically reach sexual maturity until after two years of age (Miller et al. 1985; Thomas et al. 1990). Adult females lay an average of 2 eggs per clutch with a range of 1 to 4 eggs. Spotted owl pairs do not typically nest every year, nor are nesting pairs successful every year (USFWS 1990). The small clutch size, temporal variability in nesting success, and somewhat delayed maturation all contribute to the relatively low reproductive rate of this species (Gutiérrez 1996). Nest sites are usually located within stands of old-growth and late-successional forest dominated by Douglas-fir (Pseudotsuga menziesii), and they contain structures such as cavities, broken tree tops, or mistletoe (Arceuthobium spp.) brooms (Blakesley et al. 1992; Forsman et al. 1984; LaHaye and Gutiérrez 1999). Spotted owls do not build their own nests. Most nesting occurs within naturally formed cavities in live trees or snags, but abandoned platform nests of the northern goshawk (Accipiter gentilis) and common raven (Corvus corax) have also been used (Buchanan et al. 1993). In general, courtship and nesting behavior begins in February to March with nesting occurring from March to June; however, timing of nesting and fledging varies with latitude and elevation (Forsman et al. 1984). After young fledge from the nest, they depend on

6
their parents until they are able to fly and hunt on their own. Parental care continues post-fledging into September, and sometimes into October (Forsman et al. 1984). During this time the adults may not roost with their young during the day, but they respond to begging vocalizations by bringing food to the young (Forsman et al. 1984). Dispersal Biology Natal dispersal of spotted owls typically occurs in September and October with a few individuals dispersing in November and December (Forsman et al. 2002; Miller et al. 1997). Natal dispersal occurs in stages, with juveniles settling in temporary home ranges between bouts of dispersal (Forsman et al. 2002; Miller et al. 1997). The median natal dispersal distance is about 10 miles for males and 15.5 miles for females (Forsman et al. 2002). Dispersing juvenile spotted owls experience high mortality rates, exceeding 70 percent in some studies (Miller 1989; USFWS 1990). Known or suspected causes of mortality during dispersal include starvation, predation, and accidents (Forsman et al. 2002; Miller 1989; USFWS 1990). Parasitic infection may contribute to these causes of mortality, but the relationship between parasite loads and survival is poorly understood (Forsman et al. 2002; Gutiérrez 1989; Hoberg et al. 1989). Successful dispersal of juvenile spotted owls may depend on their ability to locate unoccupied suitable habitat in close proximity to other occupied sites (LaHaye et al. 2001). There is little evidence that small openings in forest habitat influence the dispersal of spotted owls, but large, non-forested valleys such as the Willamette Valley apparently are barriers to both natal and breeding dispersal (Forsman et al. 2002). The degree to which water bodies, such as the Columbia River and Puget Sound, function as barriers to dispersal is unclear. Analysis of genetic structure of spotted owl populations suggests adequate rates of gene flow may occur across the Puget Trough between the Olympic Mountains and Washington Cascades and across the Columbia River between the Olympic Mountains and the Coast Range of Oregon (Haig et al. 2001). Both telemetry and genetic studies indicate inbreeding is rare. In a study on habitat use by dispersing juvenile spotted owls in the Oregon Coast Range, Klamath and Western Oregon Cascades Provinces (Miller et al. 1997), mature and old-growth forest were used slightly more than expected based on availability during the transient phase and nearly twice its availability during the colonization phase. Closed pole-sapling-sawtimber habitat was used roughly in proportion to availability in both phases; open sapling and clearcuts were used less than expected based on availability during colonization. Breeding dispersal occurs among a small proportion of adult spotted owls; these movements were more frequent among females and unmated individuals (Forsman et al. 2002). Breeding dispersal distances were shorter than natal dispersal distances and also apparently random in direction (Forsman et al. 2002).
7
Food Habits Spotted owls are mostly nocturnal, although they also forage opportunistically during the day (Forsman et al. 1984; Sovern et al. 1994). The composition of the spotted owl’s diet varies geographically and by forest type. Generally, flying squirrels (Glaucomys sabrinus) are the most prominent prey for spotted owls in Douglas-fir and western hemlock (Tsuga heterophylla) forests (Forsman et al. 1984) in Washington and Oregon, while dusky-footed wood rats (Neotoma fuscipes) are a major part of the diet in the Oregon Klamath, California Klamath, and California Coastal provinces (Forsman et al. 2004; Forsman et al. 1984; Forsman et al. 2001; Hamer et al. 2001; Ward et al. 1998). Depending on location, other important prey include deer mice (Peromyscus maniculatus), tree voles (Arborimus longicaudus, A. pomo), red-backed voles (Clethrionomys spp.), gophers (Thomomys spp.), snowshoe hare (Lepus americanus), bushy-tailed wood rats (Neotoma cinerea), birds, and insects, although these species comprise a small portion of the spotted owl diet (Forsman et al. 1984) (Forsman et al. 2004; Hamer et al. 2001; Ward et al. 1998). Other prey species such as the red tree vole (Arborimus longicaudus), red-backed voles (Clethrionomys gapperi), mice, rabbits and hares, birds, and insects) may be seasonally or locally important (reviewed by Courtney et al. 2004). For example, Rosenberg et al. (2003) showed a strong correlation between annual reproductive success of spotted owls (number of young per territory) and abundance of deer mice (Peromyscus maniculatus) (r2 = 0.68), despite the fact they only made up 1.6±0.5 percent of the biomass consumed. However, it is unclear if the causative factor behind this correlation was prey abundance or a synergistic response to weather (Rosenberg et al. 2003). Ward (1990) also noted that mice were more abundant in areas selected for foraging by owls. Nonetheless, spotted owls deliver larger prey to the nest and eat smaller food items to reduce foraging energy costs; therefore, the importance of smaller prey items, like Peromyscus, in the spotted owl diet should not be underestimated (Forsman et al. 2004; Forsman et al. 1984; Forsman et al. 2001). Population Dynamics The spotted owl is relatively long-lived, has a long reproductive life span, invests significantly in parental care, and exhibits high adult survivorship relative to other North American owls (Forsman et al. 1984; Gutiérrez et al. 1995). The spotted owl’s long reproductive life span allows for some eventual recruitment of offspring, even if recruitment does not occur each year (Franklin et al. 2000). Annual variation in population parameters for spotted owls has been linked to environmental influences at various life history stages (Franklin et al. 2000). In coniferous forests, mean fledgling production of the California spotted owl (Strix occidentalis occidentalis), a closely related subspecies, was higher when minimum spring temperatures were higher (North et al. 2000), a relationship that may be a function of increased prey availability. Across their range, spotted owls have previously shown an unexplained pattern of alternating years of high and low reproduction, with highest reproduction occurring during even-numbered years (e.g., Franklin et al. 1999). Annual variation in breeding may be related to weather (i.e., temperature and
8
precipitation) (Forsman et al. 1996; Wagner et al. 1996; Zabel et al. 1996) and fluctuation in prey abundance (Zabel et al. 1996). A variety of factors may regulate spotted owl population levels. These factors may be density-dependent (e.g., habitat quality, habitat abundance) or density-independent (e.g., climate). Interactions may occur among factors. For example, as habitat quality decreases, density-independent factors may have more influence on survival and reproduction, which tends to increase variation in the rate of growth (Franklin et al. 2000). Specifically, weather could have increased negative effects on spotted owl fitness for those owls occurring in relatively lower quality habitat (Franklin et al. 2000). A consequence of this pattern is that at some point, lower habitat quality may cause the population to be unregulated (have negative growth) and decline to extinction (Franklin et al. 2000). Olson et al. (2005) used open population modeling of site occupancy that incorporated imperfect and variable detectability of spotted owls and allowed modeling of temporal variation in site occupancy, extinction, and colonization probabilities (at the site scale). The authors found that visit detection probabilities average less than 0.70 and were highly variable among study years and among their three study areas in Oregon. Pair site occupancy probabilities declined greatly on one study area and slightly on the other two areas. However, for all owls, including singles and pairs, site occupancy was mostly stable through time. Barred owl presence had a negative effect on these parameters (see barred owl discussion in the New Threats section below). However, there was enough temporal and spatial variability in detection rates to indicate that more visits would be needed in some years and in some areas, especially if establishing pair occupancy was the primary goal. Threats Reasons for Listing The spotted owl was listed as threatened throughout its range “due to loss and adverse modification of suitable habitat as a result of timber harvesting and exacerbated by catastrophic events such as fire, volcanic eruption, and wind storms” (55 FR 26114-26194). More specifically, significant threats to the spotted owl included the following: 1) low populations, 2) declining populations, 3) limited habitat, 4) declining habitat, 5) distribution of habitat or populations, 6) isolation of provinces, 7) predation and competition, 8) lack of coordinated conservation measures; and (9) vulnerability to natural disturbance (57 FR 1796-1838). These threats were characterized for each province as severe, moderate, low, or unknown. Declining habitat was recognized as a severe or moderate threat to the spotted owl in all 12 provinces, isolation of provinces within 11 provinces, and declining populations in 10 provinces. Consequently, these three factors represented the greatest concern range-wide to the conservation of the spotted owl. Limited habitat was considered a severe or moderate threat in nine provinces, and low populations a severe or moderate concern in eight provinces, suggesting that these factors are a concern throughout the majority of the range. Vulnerability to natural disturbances was rated as low in five provinces.
9
The degree to which predation and competition might pose a threat to the spotted owl was unknown in more provinces than any of the other threats, indicating a need for additional information. Few empirical studies exist to confirm that habitat fragmentation contributes to increased levels of predation on spotted owls (Courtney et al. 2004). However, great horned owls (Bubo virginianus), an effective predator on spotted owls, are closely associated with fragmented forests, openings, and clearcuts (Johnson 1992; Laidig and Dobkin 1995). As mature forests are harvested, great horned owls may colonize fragmented forests, thereby increasing spotted owl vulnerability to predation. New Threats The Service conducted a 5-year review of the spotted owl in 1994 (USFWS 2004), for which the Service prepared a scientific evaluation of the status of the spotted owl (Courtney et al. 2004). An analysis was conducted assessing how the threats described in 1990 might have changed by 2004. Some of the key threats identified in 2004 are:
• “Although we are certain that current harvest effects are reduced, and that past harvest is also probably having a reduced effect now as compared to 1990, we are still unable to fully evaluate the current levels of threat posed by harvest because of the potential for lag effects…In their questionnaire responses…6 of 8 panel member identified past habitat loss due to timber harvest as a current threat, but only 4 viewed current harvest as a present threat” (Courtney et al. 2004: 11-7).
• “Currently the primary source of habitat loss is catastrophic wildfire, although the total
amount of habitat affected by wildfires has been small (a total of 2.3% of the range-wide habitat base over a 10-year period)” (Courtney et al. 2004:11-8).
• “Although the panel had strong differences of opinion on the conclusiveness of some of
the evidence suggesting [barred owl] displacement of [spotted owls], and the mechanisms by which this might be occurring, there was no disagreement that [barred owls] represented an operational threat. In the questionnaire, all 8 panel members identified [barred owls] as a current threat, and also expressed concern about future trends in [barred owl] populations.” (Courtney et al. 2004:11-8)
Barred Owls With its recent expansion to as far south as Marin County, California (Gutiérrez et al. 2004), the barred owl’s range now completely overlaps that of the spotted owl. Barred owls may be competing with spotted owls for prey (Hamer et al. 2001) or habitat (Dunbar et al. 1991; Hamer et al. 1989; Herter and Hicks 2000; Pearson and Livezey 2003). In addition, barred owls physically attack spotted owls (Pearson and Livezey 2003), and circumstantial evidence strongly indicated that a barred owl killed a spotted owl (Leskiw and Gutiérrez 1998). Evidence that barred owls are causing negative effects on spotted owls is largely indirect, based primarily on retrospective examination of long-term data collected on spotted owls (Kelly et al. 2003; Olson et al. 2005; Pearson and Livezey 2003). It is widely believed, but not conclusively confirmed, that the two species of owls are competing for resources. However, given that the presence of

10
barred owls has been identified as a negative effect while using methods designed to detect a different species (spotted owls), it seems safe to presume that the effects are stronger than estimated. Because there has been no research to quantitatively evaluate the strength of different types of competitive interactions, such as resource partitioning and competitive interference, the particular mechanism by which the two owl species may be competing is unknown. Barred owls were initially thought to be more closely associated with early successional forests than spotted owls, based on studies conducted on the west slope of the Cascades in Washington (Hamer 1988; Iverson 1993). However, recent studies conducted in the Pacific Northwest show that barred owls frequently use mature and old-growth forests (Gremel 2005; Pearson and Livezey 2003; Schmidt 2006). In the fire prone forests of eastern Washington, a telemetry study conducted on barred owls showed that barred owl home ranges were located on lower slopes or valley bottoms, in closed canopy, mature, Douglas-fir forest, while spotted owl sites were located on mid-elevation areas with southern or western exposure, characterized by closed canopy, mature, ponderosa pine or Douglas-fir forest (Singleton et al. 2005). The only study comparing spotted owl and barred owl food habits in the Pacific Northwest indicated that barred owl diets overlap strongly (76 percent) with spotted owl diets (Hamer et al. 2001). However, barred owl diets are more diverse than spotted owl diets and include species associated with riparian and other moist habitats, along with more terrestrial and diurnal species (Hamer et al. 2001). The presence of barred owls has been reported to reduce spotted owl detectability, site occupancy, reproduction, and survival. Olson et al. (2005) found that the presence of barred owls had a significant negative effect on the detectability of spotted owls, and that the magnitude of this effect did not vary among years. The occupancy of historical territories by spotted owls in Washington and Oregon was significantly lower (p < 0.001) after barred owls were detected within 0.8 kilometer (0.5 miles) of the territory center but was “only marginally lower” (p = 0.06) if barred owls were located more than 0.8 kilometer (0.5 miles) from the spotted owl territory center (Kelly et al. 2003:51). Pearson and Livezey (2003) found that there were significantly more barred owl site-centers in unoccupied spotted owl circles than occupied spotted owl circles (centered on historical spotted owl site-centers) with radii of 0.8 kilometer (0.5 miles) (p = 0.001), 1.6 kilometer (1 mile) (p = 0.049), and 2.9 kilometer (1.8 miles) (p = 0.005) in Gifford Pinchot National Forest. In Olympic National Park, Gremel (2005) found a significant decline (p = 0.01) in spotted owl pair occupancy at sites where barred owls had been detected, while pair occupancy remained stable at spotted owl sites without barred owls. Olson et al. (2005) found that the annual probability that a spotted owl territory would be occupied by a pair of spotted owls after barred owls were detected at the site declined by 5 percent in the HJ Andrews study area, 12 percent in the Coast Range study area, and 15 percent in the Tyee study area. Olson et al. (2004) found that the presence of barred owls had a significant negative effect on the reproduction of spotted owls in the central Coast Range of Oregon (in the Roseburg study area). The conclusion that barred owls had no significant effect on the reproduction of spotted owls in one study (Iverson 2004) was unfounded because of small sample sizes (Livezey 2005). It is likely that all of the above analyses underestimated the effects of barred owls on the reproduction

11
of spotted owls because spotted owls often cannot be relocated after they are displaced by barred owls (E. Forsman,pers. �omm.., cited in USFWS 2008). Anthony et al. (2006) found significant evidence for negative effects of barred owls on apparent survival of spotted owls in two of 14 study areas (Olympic and Wenatchee). They attributed the equivocal results for most of their study areas to the coarse nature of their barred owl covariate. In a recent analysis of more than 9,000 banded spotted owls throughout their range, only 47 hybrids were detected (Kelly and Forsman 2004). Consequently, hybridization with the barred owl is considered to be “an interesting biological phenomenon that is probably inconsequential, compared with the real threat—direct competition between the two species for food and space” (Kelly and Forsman 2004:808). The preponderance of evidence suggests that barred owls are exacerbating the spotted owl population decline, particularly in Washington, portions of Oregon, and the northern coast of California (Gutiérrez et al. 2004; Olson et al. 2005). There is no evidence that the increasing trend in barred owls has stabilized in any portion of the spotted owl’s range in the western United States, and “there are no grounds for optimistic views suggesting that barred owl impacts on spotted owls have been already fully realized” (Gutiérrez et al. 2004:7-38). Wildfire Studies indicate that the effects of wildfire on spotted owls and their habitat are variable, depending on fire intensity, severity and size. Within the fire-adapted forests of the spotted owl’s range, spotted owls likely have adapted to withstand fires of variable sizes and severities. Bond et al. (2002) examined the demography of the three spotted owl subspecies after wildfires, in which wildfire burned through spotted owl nest and roost sites in varying degrees of severity. Post-fire demography parameters for the three subspecies were similar or better than long-term demographic parameters for each of the three subspecies in those same areas (Bond et al. 2002). In a preliminary study conducted by Anthony and Andrews (2004) in the Oregon Klamath Province, their sample of spotted owls appeared to be using a variety of habitats within the area of the Timbered Rock fire, including areas where burning had been moderate. In 1994, the Hatchery Complex fire burned 17,603 hectares in the Wenatchee National Forest in Washington’s eastern Cascades, affecting six spotted owl activity centers (Gaines et al. 1997). Spotted owl habitat within a 2.9-kilometer (1.8-mile) radius of the activity centers was reduced by 8 to 45 percent (mean = 31 percent) as a result of the direct effects of the fire and by 10 to 85 percent (mean = 55 percent) as a result of delayed mortality of fire-damaged trees and insects. Direct mortality of spotted owls was assumed to have occurred at one site, and spotted owls were present at only one of the six sites 1 year after the fire. In 1994, two wildfires burned in the Yakama Indian Reservation in Washington’s eastern Cascades, affecting the home ranges of two radio-tagged spotted owls (King et al. 1997). Although the amount of home ranges burned was not quantified, spotted owls were observed using areas that burned at low and medium intensities. No direct mortality of spotted owls was observed, even though thick smoke covered several spotted owl site-centers for a week. It appears that, at least in the short term, spotted owls may be resilient to the effects of wildfire—a process with which they have evolved. More research is needed to further understand the relationship between fire and spotted owl habitat use.

12
At the time of listing there was recognition that large-scale wildfire posed a threat to the spotted owl and its habitat (USFWS 1990). New information suggests fire may be more of a threat than previously thought. In particular, the rate of habitat loss in the relatively dry East Cascades and Klamath provinces has been greater than expected (see “Habitat Trends” below). Moeur et al. (2005) suggested that 12 percent of late-successional forest rangewide would likely be negatively impacted by wildfire during the first 5 decades of the Northwest Forest Plan. Currently, the overall total amount of habitat affected by wildfires has been relatively small (Lint 2005). It may be possible to influence through silvicultural management how fire prone forests will burn and the extent of the fire when it occurs. Silvicultural management of forest fuels are currently being implemented throughout the spotted owl’s range, in an attempt to reduce the levels of fuels that have accumulated during nearly 100 years of effective fire suppression. However, our ability to protect spotted owl habitat and viable populations of spotted owls from large fires through risk-reduction endeavors is uncertain (Courtney et al. 2004). The NWFP recognized wildfire as an inherent part of managing spotted owl habitat in certain portions of the range. The distribution and size of reserve blocks as part of the NWFP design may help mitigate the risks associated with large-scale fire (Lint 2005). West Nile Virus West Nile Virus (WNV) has killed millions of wild birds in North America since it arrived in 1999 (Caffrey 2003; Marra et al. 2004; McLean et al. 2001). Mosquitoes are the primary carriers (vectors) of the virus that causes encephalitis in humans, horses, and birds. Mammalian prey may also play a role in spreading WNV among predators, like spotted owls. Owls and other predators of mice can contract the disease by eating infected prey (Garmendia et al. 2000; Komar et al. 2001). Recent tests of tree squirrels, including flying squirrels, from Los Angeles County, California, found over 70 percent were positive for WNV (R. Carney, Personal Communication, 2004, as cited in Courtney et al. 2004). One captive spotted owl in Ontario, Canada, is known to have contracted WNV and died. Health officials expect that WNV will eventually spread throughout the range of the spotted owl (Courtney et al. 2004), but it is unknown how WNV will ultimately affect owl populations. Susceptibility to infection and mortality rates of infected individuals vary among bird species, even within groups (Courtney et al. 2004). Owls appear to be quite susceptible. For example, breeding screech owls (Megascops asio) in Ohio experienced 100 percent mortality (T. Grubb, Personal Communication, as cited in Courtney et al. 2004). Barred owls, in contrast, showed lower susceptibility (B. Hunter, Personal Communication, as cited in Courtney et al. 2004). Some level of innate resistance may occur (Fitzgerald et al. 2003), which could explain observations in several species of markedly lower mortality in the second year of exposure to WNV (Caffrey and Peterson 2003). Wild birds also develop resistance to WNV through immune responses (Deubel et al. 2001). The effects of WNV on bird populations at a regional scale have not been large, even for susceptible species (Caffrey and Peterson 2003), perhaps due to the short-term (a few years) and patchy distribution of mortality (K. McGowan, pers. comm., cited in Courtney et al. 2004) or annual changes in vector abundance and distribution. Courtney et al. (2004) offer competing propositions for the likely outcome of spotted owl populations being infected by WNV. One proposition is that spotted owls can tolerate severe, short-term population reductions due to WNV, because spotted owl populations are widely
13
distributed and number in the several hundreds to thousands. An alternative proposition is that WNV will cause unsustainable mortality, due to the frequency and/or magnitude of infection, thereby resulting in long-term population declines and extirpation from parts of the spotted owl’s current range. Habitat restoration for spotted owls will take decades to be realized. As such, it is too early to evaluate the long-term effectiveness of conservation efforts under the NWFP (USFWS 2004). Thus far, no mortality in wild, spotted owls has been recorded from WNV (Courtney et al. 2004). However, the potential threats to the spotted owl, like WNV, may not respond to or be affected by habitat management or improvement (USFWS 2004) including conservation efforts under the NWFP. Sudden Oak Death Sudden oak death was recently identified as a potential threat to the spotted owl (Courtney et al. 2004). This disease is caused by the fungus-like pathogen, Phytopthora ramorum, that was recently introduced from Europe and is rapidly spreading in northern California. At the present time, sudden oak death is found in natural stands from Monterey to Humboldt Counties, California, and has reached epidemic proportions in oak (Quercus spp.) and tanoak (Lithocarpus densiflorus) forests along approximately 186 mi (300 km) of the central and northern California coast (Rizzo et al. 2002). It has also been found near Brookings, Oregon, killing tanoak and causing dieback of closely associated wild rhododendron (Rhododendron spp.) and evergreen huckleberry (Vaccinium ovatum) (Goheen et al. 2002). It has been found in several different forest types and at elevations from sea level to over 2625 ft (800 m). Sudden oak death poses a threat of uncertain proportion because of its potential impact on forest dynamics and alteration of key prey and spotted owl habitat components (e.g., hardwood trees – canopy closure and nest tree mortality); especially in the southern portion of the spotted owl’s range (Courtney et al. 2004). However, uncertainty about the likely scale of habitat effects and the potential for management to address the additive effects of sudden oak death on habitat availability mediated against placing too much weight on this factor in the Service’s Five-Year Review Evaluation of the spotted owl (USFWS 2004). Inbreeding Depression, Genetic Isolation, and Reduced Genetic Diversity Inbreeding and other genetic problems due to small population sizes were not considered an imminent threat to the spotted owl at the time of listing. Recent studies show no indication of reduced genetic variation and past bottlenecks in Washington, Oregon, or California (Barrowclough et al. 1999; Haig et al. 2004; Henke et al. 2005). However, in Canada, the breeding population is estimated to be less than 33 pairs and annual population decline may be as high as 35 percent (Harestad et al. 2004). Canadian populations may be more adversely affected by issues related to small population size including inbreeding depression, genetic isolation, and reduced genetic diversity (Courtney et al. 2004). Low and persistently declining populations throughout the northern portion of the species range (see “Population Trends” below) may be at increased risk of losing genetic diversity. Climate change Climate change, a potential additional threat to spotted owl populations, is not explicitly addressed in the NWFP. Climate change could have direct and indirect impacts on spotted owls

14
and their prey. However, the emphasis on maintenance of seral stage complexity and related biological diversity in Matrix Lands under the NWFP should contribute to the resiliency of the Federal forest landscape related to impacts of climate change (Courtney et al. 2004). Based upon a global meta-analysis of climate change data, Parmesan and Yohe (2003) discussed several potential implications of global climate change to biological systems, including terrestrial plants and animals. Results indicated that 62 percent of species exhibited trends indicative of advancement of spring conditions. In bird species, climate change trends were manifested in earlier nesting activities. Because the spotted owl exhibits a limited tolerance to heat relative to other bird species (Weathers et al. 2001), subtle changes in climate have the potential to affect spotted owls. However, the specific impacts to the species are unknown. Disturbance-Related Effects The effects of noise on NSOs are largely unknown, and whether noise is a concern has been a controversial issue. The effect of noise on birds is extremely difficult to determine due to the inability of most studies to quantify one or more of the following variables: 1) timing of the disturbance in relation to nesting chronology; 2) type, frequency, and proximity of human disturbance; 3) clutch size; 4) health of individual birds; 5) food supply; and 6) outcome of previous interactions between birds and humans (Knight and Skagen 1988). Additional factors that confound the issue of disturbance include the individual bird’s tolerance level, ambient sound levels, physical parameters of sound and how it reacts with topographic characteristics and vegetation, and differences in how species perceive noise. Although information specific to behavioral responses of NSOs to disturbance is limited, research indicates that recreational activity can cause Mexican spotted owls (S. o. lucida) to vacate otherwise suitable habitat (Swarthout and Steidl 2001) and helicopter overflights can reduce prey delivery rates to nests (Delaney et al. 1999). Additional effects from disturbance, including altered foraging behavior and decreases in nest attendance and reproductive success, have been reported for other raptors (Andersen et al. 1989; McGarigal et al. 1991; White and Thurow 1985). Spotted owls may also respond physiologically to a disturbance without exhibiting a significant behavioral response. In response to environmental stressors, vertebrates secrete stress hormones called corticosteroids (Campbell 1990). Although these hormones are essential for survival, extended periods with elevated stress hormone levels may have negative effects on reproductive function, disease resistance, or physical condition (Carsia and Harvey 2000; Sapolsky et al. ). In avian species, the secretion of corticosterone is the primary non-specific stress response (Carsia and Harvey 2000). The quantity of this hormone in feces can be used as a measure of physiological stress (Wasser et al. 1997). Recent studies of fecal corticosterone levels of spotted owls indicate that low intensity noise of short duration and minimal repetition does not elicit a physiological stress response (Tempel and Gutiérrez 2003; Tempel and Gutiérrez 2004). However, prolonged activities, such as those associated with timber harvest, may increase fecal corticosterone levels depending on their proximity to spotted owl core areas (Tempel and Gutiérrez 2004; Wasser et al. 1997) .

15
Conservation Needs of the Spotted Owl Based on the above assessment of threats, the spotted owl has the following habitat-specific and habitat-independent conservation (i.e., survival and recovery) needs (adapted from Courtney et al. 2004): Habitat-specific Needs 1. Large blocks of suitable habitat to support clusters or local population centers of spotted owls
(e.g., 15 to 20 breeding pairs) throughout the owl’s range; 2. Suitable habitat conditions and spacing between local spotted owl populations throughout its
range to facilitate survival and movement; 3. Suitable habitat distributed across a variety of ecological conditions within the spotted owl’s
range to reduce risk of local or widespread extirpation; 4. A coordinated, adaptive management effort to reduce the loss of habitat due to catastrophic
wildfire throughout the spotted owl’s range, and a monitoring program to clarify whether these risk reduction methods are effective and to determine how owls use habitat treated to reduce fuels; and
5. In areas of significant population decline, sustain the full range of survival and recovery
options for this species in light of significant uncertainty. Habitat-independent Needs 1. A coordinated, research and adaptive management effort to better understand and manage
competitive interactions between spotted and barred owls; and
a. Monitoring to better understand the risk that West Nile Virus and sudden oak death pose to spotted owls and, for West Nile Virus, research into methods that may reduce the likelihood or severity of outbreaks in spotted owl populations.
Conservation Strategy Since 1990, various efforts have addressed the conservation needs of the spotted owl and attempted to formulate conservation strategies based upon these needs. The various efforts began with the Interagency Scientific Committee’s Conservation Strategy (Thomas et al. 1990). The efforts continued with the designation of critical habitat (57 FR 1796-1838, the Draft Recovery Plan (USFWS 1992); the Scientific Analysis Team report (Thomas et al. 1993a); and the report of the Forest Ecosystem Management Assessment Team (Thomas et al. 1993b). The efforts culminated with the NWFP (USFS and USBLM 1994b). Each conservation strategy was based upon the reserve design principles first articulated in the Interagency Scientific Committee’s report, which are summarized as follows:

16
• Species that are well distributed across their range are less prone to extinction than species confined to small portions of their range.
• Large blocks of habitat, containing multiple pairs of the species, are superior to small
blocks of habitat with only one to a few pairs.
• Blocks of habitat that are close together are better than blocks far apart. Habitat that occurs in contiguous blocks is better than habitat that is more fragmented.
• Habitat between blocks is more effective as dispersal habitat if it resembles suitable
habitat. Conservation and Recovery Efforts on Federal Lands The NWFP is the current conservation strategy for the spotted owl on Federal lands. It is designed around the conservation needs of the spotted owl and based upon the designation of a variety of land-use allocations whose objectives are either to provide for population clusters (i.e., demographic support) or to maintain connectivity between population clusters. Several land-use allocations are intended to contribute primarily to supporting population clusters: Late-Successional Reserves, Managed Late-Successional Areas, Congressionally Reserved Areas, Managed Pair Areas, and Reserve Pair Areas. The remaining land-use allocations (Matrix, Adaptive Management Areas, Riparian Reserves, Connectivity Blocks, and Administratively Withdrawn Areas) provide connectivity between habitat blocks intended for demographic support. The range-wide system of Late-Successional Reserves set up under the NWFP captures the variety of ecological conditions within the 12 different provinces to which spotted owls are adapted. This design reduces the potential for extinction due to large catastrophic events in a single province. Multiple, large Late-Successional Reserves in each province reduce the potential that spotted owls will be extirpated in any individual province and reduce the potential that large wildfires or other events will eliminate all habitat within a Late-Successional Reserve. In addition, Late-Successional Reserves are generally arranged and spaced so that spotted owls may disperse to two or more adjacent Late-Successional Reserves. This network of reserves reduces the likelihood that catastrophic events will impact habitat connectivity and population dynamics within and between provinces. FEMAT scientists predicted that spotted owl populations would decline in the Matrix over time, while populations were expected to stabilize and eventually increase within Late-Successional Reserves, as habitat conditions improve over the next 50 to 100 years (Thomas et al. 1993b) (USFS and USBLM 1994a; USFS and USBLM 1994b). Based on the results of the first decade of monitoring, the NWFP’s authors cannot determine if the declining population trend will be reversed because not enough time has passed to provide the necessary measure of certainty (Lint 2005). However, the results from the first decade of monitoring do not provide any reason to depart from the objective of habitat maintenance and restoration as described under the NWFP (Lint 2005). Other stressors that operate in intact suitable habitat, such as barred owls (already in action) and WNV (yet to occur) may complicate the conservation of the spotted owl. Recent

17
reports about the status of the spotted owl offer few management recommendations to deal with the emerging threats. The arrangement and distribution and resilience of the NWFP land use allocation system may prove to be the most appropriate strategy in responding to these unexpected challenges (Courtney et al. 2004). Under the NWFP, the agencies involved (Service, U.S. Forest Service, Bureau of Land Management, and the National Park Service) anticipated a decline of spotted owl populations during the first decade of implementation. Recent reports (Anthony et al. 2006; Courtney et al. 2004) identified greater than expected spotted owl declines in Washington and northern portions of Oregon, and more stationary populations in southern Oregon and northern California. The reports did not find a direct correlation between habitat conditions and changes in vital rates of spotted owls at the meta-population scale. However, at the territory scale, there is evidence of negative effects to spotted owl fitness due to reduced habitat quantity and quality. Also, there is no evidence to suggest that dispersal habitat is currently limiting (Courtney et al. 2004; Lint 2005). Even with the population decline, Courtney et al (2004) noted that there is little reason to doubt the effectiveness of the core principles underpinning the NWFP conservation strategy. The current scientific information, including information showing spotted owl population declines, indicates that the spotted owl continues to meet the definition of a threatened species (USFWS 2004). That is, populations are still relatively numerous over most of its historic range, which suggests that the threat of extinction is not imminent, and that the subspecies is not endangered; even though, in the northern part of its range population trend estimates are showing a decline. Northern Spotted Owl Recovery Plan In May, 2008, the Service published the 2008 Final Recovery Plan for the Northern Spotted Owl (USFWS 2008). The recovery plan identifies that competition with barred owls, ongoing loss of suitable habitat as a result of timber harvest and catastrophic fire, and loss of amount and distribution of suitable habitat as a result of past activities and disturbances are the most important range-wide threats to the spotted owl (USFWS 2008). To address these threats, the present recovery strategy has the following three essential elements: barred owl control, dry-forest landscape management strategy, and managed owl conservation areas (MOCAs) (USFWS 2008). The recovery plan lists recovery actions that address research of the competition between spotted and barred owls, experimental control of barred owls to better understand the impact the species is having on spotted owls, and, if recommended by research, management of barred owls (USFWS 2008). The foundation of the plan for managing forest habitat in the western Provinces of Washington and Oregon is the MOCA network on Federal lands, which are intended to support stable and well-distributed populations of spotted owls over time and allow for movement of spotted owls across the network (USFWS 2008). On the fire-dominated east side of the Cascade Mountains in Washington and Oregon, and the California Cascades, the dry-forest habitat management strategy is intended to maintain spotted owl habitat in an environment of frequent natural disturbances (USFWS 2008). Additionally, the recovery plan identifies Conservation Support Areas (CSAs) in Washington, the west side of the Cascades in Oregon, and in California.

18
The CSAs are located on private, State, and Federal lands and are expected to support the MOCA network and the dry-forest landscape management approach (USFWS 2008). In addition, the recovery plan recommends a research and monitoring program be implemented to track progress toward recovery, inform changes in recovery strategy by a process of adaptive management, and ultimately determine when delisting is appropriate (USFWS 2008). The three primary elements of this program include 1) the monitoring of spotted owl population trends, 2) an inventory of spotted owl distribution, and 3) a comprehensive program of barred owl research and monitoring (USFWS 2008). The recovery plan estimates that recovery of the spotted owl could be achieved in approximately 30 years (USFWS 2008). Conservation Efforts on Non-Federal Lands FEMAT noted that limited Federal ownership in some areas constrained the ability to form an extensive reserve network to meet conservation needs of the spotted owl. Thus, non-Federal lands were determined to be an important contribution to the range-wide goal of achieving conservation and recovery of the spotted owl. The Service’s main expectations for private lands are for their contributions to demographic support (pair or cluster protection) and/or connectivity with lands. In addition, timber harvest within each state is governed by rules that may provide protection of spotted owls and/or their habitat to varying degrees. There are 16 current or completed Habitat Conservation Plans (HCPs) with incidental take permits issued for spotted owls, eight in Washington, four in Oregon, and four in California. They range in size from 40 acres to over 1.6 million acres, though not all acres are included in the mitigation for spotted owls. In total, the HCPs cover approximately 2.9 million of the 32 million acres of non-Federal forestlands in the range of the spotted owl. Most HCPs are fairly long in duration, though they range from only five years up to 100 years. While each HCP is unique, there are several general approaches to mitigation of incidental take of spotted owls, including: 1) reserves of various sizes, some associated with adjacent Federal reserves, 2) forest harvest that maintains or develops suitable habitat, 3) forest management that maintains or develops dispersal habitat, and 4) deferral of harvest near specific sites. Individual HCPs may employ one or more of these mitigation measures. Similarly the conservation objectives of individual HCPs vary from specified numbers of breeding spotted owls, with specified levels of reproductive success, to management objectives for nesting/roosting/foraging habitat or dispersal habitat (Courtney et al. 2004). Washington In 1996, the Washington Forest Practices Board adopted rules (WFPB 1996) that would “contribute to conserving the spotted owl and its habitat on non-Federal lands” based on recommendations from a Science Advisory Group which identified important non-Federal lands and recommended roles for those lands in spotted owl conservation (Buchanan et al. 1994; Hanson et al. 1993). The 1996 rules designated 10 Spotted Owl Special Emphasis Areas (SOSEAs) in Washington that comprise over 1.5 million acres of State and private lands where owl protections on non-Federal lands would be emphasized. At all sites within SOSEAs, any proposed harvest of suitable spotted owl habitat within a territorial owl circle is considered a “Class-IV special” and would trigger State Environmental Policy Act (SEPA) review. Within SOSEAs, all suitable habitat within 0.7 mile of spotted owl activity centers, and 40 percent of

19
suitable habitat within the provincial median home range circle surrounding an occupied activity center is generally protected from timber harvest. Proposed harvest that would reduce habitat amounts below these levels are considered to have a significant probable adverse affect on the environment with respect to SEPA. If a determination of significance is made, preparation of a SEPA Environmental Impact Statement is required prior to proceeding. If a determination of non-significance or mitigated determination of non-significance is reached, the action can proceed without further environmental assessment. Until recently, these habitat protections could be lifted if a spotted owl activity center was determined to be unoccupied (Buchanan and Sweeden 2005). In 2005, the Forest Practices Board adopted emergency rules to further protect suitable habitat in spotted owl circles within SOSEAs (WFPB 2005). Under the 1996 Washington Forest Practices Rules, suitable spotted owl habitat located on non-Federal lands outside of owl management circles or located outside of a SOSEA boundary was not protected from timber harvest, unless the habitat was protected by an approved HCP. Spotted owl-related HCPs in Washington cover over 1.92 million acres and generally provide both demographic and connectivity support as recommended in the 1992 draft spotted owl recovery plan (USFWS 1992). Oregon The Oregon Forest Practices Act provides for protection of 70-acre core areas around known spotted owl nest sites, but does not provide for protection of spotted owl habitat beyond these areas (ODF 2006). In general, no large-scale spotted owl habitat protection strategy or mechanism currently exists for non-Federal lands in Oregon. The four spotted owl-related HCPs currently in effect in Oregon cover over 300,000 acres of non-Federal lands. These HCP’s have provided, and will continue to provide, some nesting habitat and connectivity over the next few decades. California In 1990, the California Forest Practice Rules, which govern timber harvest on private lands, were amended to require surveys for spotted owls in suitable habitat and to provide protection around activity centers (CDF 2005). Under the California Forest Practices Rules, no timber harvest plan can be approved if it is likely to result in incidental take of federally listed species, unless authorized by a Federal HCP. The California Department of Fish and Game initially reviewed all timber harvest plans to ensure that take was not likely to occur; the Service took over that review function in 2000. Several large industrial owners operate under Spotted Owl Management Plans that have been reviewed by the Service; the plans specify basic measures for spotted owl protection. Four HCPs authorizing take of spotted owls have been approved covering over 669,000 acres of non-Federal lands. Implementation of these HCPs has provided, and will continue to provide, for spotted owl demographic and connectivity support to NWFP lands. Current Condition of the Spotted Owl The current condition of a species incorporates the effects of all past human and natural activities or events that have led to the present-day status of the species and its habitat (USFWS and NMFS 1998).

20
Range-wide Habitat Trends Habitat Trends The Service has used information provided by the U.S. Forest Service, Bureau of Land Management, and National Park Service to update the habitat baseline conditions on Federal lands for spotted owls on several occasions since the spotted owl was listed in 1990. The estimate of 7.4 million acres used for the NWFP in 1994 (USFS and USBLM 1994b) was determined to be representative of the general amount of spotted owl habitat on these lands. This baseline was used to track relative changes over time in subsequent analyses. In 2005, a new map depicting suitable spotted owl habitat throughout their range was produced as a result of the NWFP’s effectiveness monitoring program (Lint 2005). However, the spatial resolution of this new habitat map currently makes it unsuitable for tracking habitat effects at the scale of individual projects. The Service is evaluating the map for future use in tracking habitat trends. Additionally, there are no reliable estimates of spotted owl habitat on other land ownerships; consequently, acres that have undergone ESA section 7 consultation can be tracked, but not evaluated in the context of change with respect to a reference condition on non-Federal lands. The production of the NWFP monitoring program habitat map does, however, provide an opportunity for future evaluations of trends in non-Federal habitat. Range-wide Analysis 1994 – 2001 In 2001, the Service conducted an assessment of habitat baseline conditions, the first since implementation of the NWFP (USFWS 2001). This range-wide evaluation of habitat, compared to the Final Supplemental Environmental Impact Statement, was necessary to determine if the rate of potential change to spotted owl habitat was consistent with the change anticipated in the NWFP. In particular, the Service considered habitat effects that were documented through the ESA section 7 consultation process since 1994. In general, the analytical framework of these consultations focused on the reserve and connectivity goals established by the NWFP land-use allocations (USFS and USBLM 1994b), with effects expressed in terms of changes in suitable spotted owl habitat within those land-use allocations. The Service determined that actions and effects were consistent with the expectations for implementation of the NWFP from 1994 to June, 2001 (USFWS 2001). During the 2001 assessment, the Service developed an intranet database for compiling and tracking habitat losses anticipated through ESA section 7 consultations and other habitat effects (e.g., wildfire effects, though this data is incomplete). Information in the database is updated with each new consultation across the range of the species. The total acres of habitat loss changes over time as additional consultations are completed. As projects are implemented, Federal agencies report the actual acres implemented, and in some cases, the implemented acres are substantially less than the acres that were analyzed in the consultation. The Service uses these reports to update the database and add or subtract habitat acres. For each ESA section 7 consultation, the Service uses the current information in the consultation database to track the effects across the range of the spotted owl and update the information on the status of the spotted owl. As a result, the acres from ESA section consultation reported in this Opinion may vary from previous consultations due to updated information in the consultation database. Copies of

21
the summary tables from the database used for this Opinion are filed in the administrative record for this Opinion. Range-wide Analysis 1994 – Present (February 26, 2008). This section updates the information considered in U.S. Fish and Wildlife Service (2001), relying particularly on information in documents the Service produced pursuant to section 7 of the Act and information provided by NWFP agencies on habitat loss resulting from natural events (e.g., fires, windthrow, insect and disease). In 1994, about 7.4 million acres of suitable spotted owl habitat were estimated to exist on Federal lands managed under the NWFP. As of August 6, 2009, the Service had consulted on the proposed removal of approximately 222,619 acres (Table 1) or 3 percent of 7.4 million acres (Table 2) of spotted owl suitable habitat on Federal lands. Of the total Federal acres consulted on for removal, approximately 189,727 acres or 2.5 percent of 7.4 million acres of spotted owl habitat were removed as a result of timber harvest. These changes in suitable spotted owl habitat are consistent with the expectations for implementation of the NWFP (USFS and USBLM 1994b). April 13, 2004 marked the start of the second decade of the NWFP. Decade specific baselines and summaries of effects by State, physiographic province and land use function from proposed management activities and natural events are not provided here, but can be calculated using the Service’s Consultation Effects Tracking system. Habitat loss from Federal lands due to management activities has varied among the individual provinces with most of the impacts concentrated within the Non-Reserve relative to the Reserve land-use allocations (Table 2). When habitat loss is evaluated as a proportion of the affected acres range-wide, the most pronounced losses have occurred within Oregon (83%), especially within its Klamath Mountains (43%) and Cascades (East and West) (40%) Provinces, followed by much smaller habitat losses in Washington (10%) and California (7%) (Table 2). From 1994 through August 6, 2009, habitat lost due to natural events was estimated at approximately 167,894 acres range-wide (Table 2). About two-thirds of this loss was attributed to the Biscuit Fire that burned over 500,000 acres in southwest Oregon (Rogue River basin) and northern California in 2002. This fire resulted in a loss of approximately 113,451 acres of spotted owl habitat, including habitat within five LSRs (Table 2). Approximately 18,630 acres of spotted owl habitat were lost due to the B&B Complex and Davis Fires in the East Cascades Province of Oregon (Table 2). When habitat loss from natural events and timber harvest is evaluated as a proportion of provincial baselines, the Oregon Klamath Mountains (25%), Cascades East (7.8%), and the California Cascades (5.4%) all have proportional losses greater than the range-wide mean (5.3%) (Table 2). Because there is no comprehensive spotted owl habitat baseline for non-Federal lands, there is little available information regarding spotted owl habitat trends on non-Federal lands. Yet, we do know that internal Service consultations conducted since 1992 have documented the eventual loss of 405,770 acres (Table 1) of habitat on non-Federal lands. Most of these losses have yet to be realized because they are part of large-scale, long-term HCPs. Combining effects on Federal

22
and non-Federal lands, the Service had consulted on the proposed removal of approximately 642,803 acres of spotted owl habitat range-wide, resulting from all management activities, as of August 6, 2009 (Table 1).

23
Table 1. Changes to NRF1 habitat acres from activities subject to ESA section 7 consultations and other causes range-wide from May 1994 to present (August 6, 2009).
ESA Section 7 Consultation Habitat Changes2 Other Habitat Changes3Northwest Forest Plan
Group/Ownership Removed/ Downgraded Degraded
Removed/ Downgraded Degraded
Bureau of Land Management 100,215 56,166 760 0 Forest Service 114,665 471,008 36,911 5,481National Park Service 3,916 4,855 3 0 Multi-agency4 3,823 23,314 130,220 0
Federal - Northwest
Forest Plan
NWFP Subtotal 222,619 555,343 167,894 5,481Bureau of Indian Affairs and Tribes 109,881 28,398 2,398 0 Habitat Conservation Plans 295,889 14,430 0 0
Other Management
and Conservation
Plans (OMCP)
OMCP Subtotal 405,770 42,828 2,398 0 Other Federal Agencies & Lands5 241 466 28 70 Other Public & Private Lands6 14,173 880 30,240 20,949 TOTAL Changes 642,803 599,517 200,560 26,500Source: Tables A and B from the Service Northern Spotted Owl Consultation Effects Tracker (web application and database) Aug. 6, 2009. 1 Nesting, roosting, foraging habitat. In California, suitable habitat is divided into two components; nesting – roosting (NR) habitat, and foraging (F) habitat. The NR component most closely resembles NRF habitat in Oregon and Washington. Due to differences in reporting methods, effects to suitable habitat compiled in this, and all subsequent tables include effects for nesting, roosting, and foraging (NRF) for 1994-June 6, 2001. After June 26, 2001, suitable habitat includes NRF for Washington and Oregon but only nesting and roosting (NR) for California. 2 Includes both effects reported by U.S. Fish and Wildlife Service (2001) and subsequent effects compiled in the Northern Spotted Owl Consultation Effects Tracker (web application and database). 3 Includes effects to NRF habitat (as documented through technical assistance) resulting from wildfires (not from suppression efforts), insect and disease outbreaks, and other natural causes, private timber harvest, and land exchanges not associated with consultation. 4 The ‘Multi-agency’ grouping is used to lump a variety of NWFP mixed agency or admin unit consultations that were reported together prior to June 26, 2001, and cannot be separated out. 5 Includes lands that are owned or managed by other Federal agencies not included in the NWFP. 6 Includes lands not covered by Habitat Conservation Plans that are owned or managed by states, counties, municipalities, and private entities. Effects that occurred on private lands from right-of-way permits across U.S. Forest Service and Bureau of Land Management lands are included.

24
Table 2. Aggregate results of all adjusted, suitable habitat (NRF1) acres affected by ESA section 7 consultation for the spotted owl; baseline and summary of effects by state, physiographic province, and land use function from 1994 to present for lands managed under the NWFP (August 6, 2009).
Evaluation Baseline2 Habitat Removed/Downgraded3
Physiographic Province4
Reserves5 Non-Reserves6 Total Reserves5 Non-Reserves6
Habitat Loss to Natural Events7
Total
% ProvincialBaseline Affected
% Range-wideAffected
WA Olympic Peninsula 548,483 11,734 560,217 867 24 299 1,190 -0.21% 0.30% Eastern Cascades 506,340 200,509 706,849 4219 5,748 5,754 15,721 -2.22% 4.03% Western Cascades 864,683 247,797 1,112,480 1,681 10,804 0 12,485 -1.12% 3.20% Western Lowlands 0 0 0 0 0 0 0 -0.00% 0.00%OR Coast Range 422,387 94,190 516,577 730 3,863 66 4,659 -0.90% 1.19% Klamath Mountains 448,509 337,080 785,589 23,402 71,479 101,676 196,557 -25.02% 50.33% Cascades East 247,624 196,035 443,659 2,343 12,758 19,547 34,648 -7.81% 8.87% Cascades West 1,012,426 1,034,046 2,046,472 4,020 64,683 24,583 93,286 -4.56% 23.89% Willamette Valley 593 5,065 5,658 0 0 0 0 -0.00% 0.00%CA Coast 47,566 3,928 51,494 455 69 100 624 -1.21% 0.16% Cascades 61,852 26,385 88,237 0 4,808 0 4,808 -5.45% 1.23% Klamath 734,103 345,763 1,079,866 1,492 9,174 15,869 26,535 -2.46% 6.79%Total 4,894,566 2,502,532 7,397,098 39,209 183,410 167,894 390,513 -5.28% 100.00%
Source: Table B from the Service Northern Spotted Owl Consultation Effects Tracker (web application and database) August 6, 2009. 1 Nesting, roosting, foraging habitat. In California, suitable habitat is divided into two components; nesting – roosting (NR) habitat, and foraging (F) habitat. The NR component most closely resembles NRF habitat in Oregon and Washington. Due to differences in reporting methods, effects to suitable habitat compiled in this, and all subsequent tables include effects for nesting, roosting, and foraging (NRF) for 1994-June 26, 2001. After June 26, 2001, suitable habitat includes NRF for Washington and Oregon but only nesting and roosting (NR) for California. 2 1994 FSEIS baseline (USFS and USBLM 1994a). 3 Includes both effects reported by USFWS (2001) and subsequent effects compiled in the Northern Spotted Owl Consultation Effects Tracking System (web application and database). 4 Defined by the NWFP as the twelve physiographic provinces, as presented in Figure 3 and 4-1 on page 3 and 4-16 of the Final Supplemental Environmental Impact Statement. 5 Land-use allocations intended to provide large blocks of habitat to support clusters of breeding pairs. 6 Land-use allocations intended to provide habitat to support movement of spotted owls among reserves. 7 Acres estimated from various database fields and other GIS databases.

25
Other Habitat Trend Assessments In 2005, the Washington Department of Wildlife released the report, “An Assessment of Spotted Owl Habitat on Non-Federal Lands in Washington between 1996 and 2004” (Pierce et al. 2005). This study estimates the amount of spotted owl habitat in 2004 on lands affected by state and private forest practices. The study area is a subset of the total Washington forest practice lands, and statistically-based estimates of existing habitat and habitat loss due to fire and timber harvest are provided. In the 3.2-million acre study area, Pierce et al. (2005) estimated there was 816,000 acres of suitable spotted owl habitat in 2004, or about 25 percent of their study area. Based on their results, Pierce and others (2005) estimated there were less than 2.8 million acres of spotted owl habitat in Washington on all ownerships in 2004. Most of the suitable owl habitat in 2004 (56%) occurred on Federal lands, and lesser amounts were present on state-local lands (21%), private lands (22%) and tribal lands (1%). Most of the harvested spotted owl habitat was on private (77%) and state-local (15%) lands. A total of 172,000 acres of timber harvest occurred in the 3.2 million-acre study area, including harvest of 56,400 acres of suitable spotted owl habitat. This represented a loss of about 6 percent of the owl habitat in the study area distributed across all ownerships (Pierce et al. 2005). Approximately 77 percent of the harvested habitat occurred on private lands and about 15 percent occurred on State lands. Pierce and others (2005) also evaluated suitable habitat levels in 450 spotted owl management circles (based on the provincial annual median spotted owl home range). Across their study area, they found that owl circles averaged about 26 percent suitable habitat in the circle across all landscapes. Values in the study ranged from an average of 7 percent in southwest Washington to an average of 31 percent in the east Cascades, suggesting that many owl territories in Washington are significantly below the 40 percent suitable habitat threshold used by the State as a viability indicator for spotted owl territories (Pierce et al. 2005). Moeur et al. (2005) estimated an increase of approximately 1.25 to 1.5 million acres of medium and large older forest (greater than 20 inches dbh, single and multi-storied canopies) on Federal lands in the Northwest Forest Plan area between 1994 and 2003. The increase occurred primarily in the lower end of the diameter range for older forest. The net area in the greater than 30 inch dbh size class increased by only an estimated 102,000 to 127,000 acres. The estimates were based on change-detection layers for losses due to harvest and fire and remeasured inventory plot data for increases due to ingrowth. Transition into and out of medium and large older forest over the 10-year period was extrapolated from inventory plot data on a subset of Forest Service land types and applied to all Federal lands. Because size class and general canopy layer descriptions do not necessarily account for the complex forest structure often associated with spotted owl habitat, the significance of these acres to spotted owl conservation remains unknown. Spotted Owl Numbers, Distribution, and Reproduction Trends There are no estimates of the historical population size and distribution of spotted owls, although they are believed to have inhabited most old-growth forests throughout the Pacific Northwest prior to modern settlement (mid-1800s), including northwestern California (USFWS 1989). The final rule listing the spotted owl as threatened (55 FR 26114-26194), estimated that approximately 90 percent of the roughly 2,000 known spotted owl breeding pairs were located on federally managed lands, 1.4 percent on State lands, and 6.2 percent on private lands; the
26
percent of spotted owls on private lands in northern California was slightly higher (Forsman et al. 1984; Thomas et al. 1990; USFWS 1989). At the time the NWFP was initiated (July 1, 1994), there were 5,431 known locations of, or site centers of spotted owl pairs or resident singles: 851 sites (16 percent) in Washington, 2,893 (53 percent) in Oregon, and 1,687 (31 percent) in California (60 FR 9484-9495). By June 2004, the number of territorial spotted owl sites recognized by Washington Department of Fish and Wildlife was 1,044 (Buchanan and Sweeden 2005). The actual number of currently occupied spotted owl locations across the range is unknown because many areas remain unsurveyed (57 FR 1796-1838)(Thomas et al. 1993a). In addition, many historical sites are no longer occupied because spotted owls have been displaced by barred owls, timber harvest, or severe fires, and it is possible that some new sites have been established due to reduced timber harvest on Federal lands since 1994. The number of owl locations reported in 60 FR 9484-9495 represents the cumulative number of locations recorded in the three states at that time, and does not represent a population estimate. Because existing survey coverage and effort are insufficient to produce reliable range-wide estimates of population size, researchers use other indices, such as demographic data, to evaluate trends in spotted owl populations. Analysis of demographic data can provide an estimate of the rate and direction of population growth [i.e., lambda (λ)]. A λ of 1.0 indicates a stationary population (i.e., neither increasing nor decreasing), a λ less than 1.0 indicates a declining population, and a λ greater than 1.0 indicates a growing population. Demographic data, derived from studies initiated as early as 1985, have been analyzed periodically (Anderson and Burnham 1992; Anthony et al. 2006; Burnham et al. 1994; Forsman et al. 1996) to estimate trends in the populations of the spotted owl. In January 2004, Anthony et al. (2006) completed two meta-analyses that modeled rates of population change [i.e., lambda (λ)], for up to 18 years using the re-parameterized Jolly-Seber method (Λrjs). One meta-analysis modeled all 13 long-term study areas excluding the Marin study area (Table 3), while the other modeled the eight study areas that are part of the effectiveness monitoring program of the NWFP (Anthony et al. 2006). Data were analyzed separately for individual study areas, as well as across all study areas in a meta-analysis.

27
Table 3. Spotted owl demographic study areas (adapted from Anthony et al. 2004). Area Fecundity Survival λRJS Population Change
Wenatchee Declining Declining 0.917 Declining Cle Elum Declining Declining? 0.938 Declining Rainier Stable Declining 0.896 Declining Olympic Stable Declining 0.956 Declining Coast Ranges Declining? Stable 0.968 Declining HJ Andrews Stable? Stable 0.978 Declining Warm Springs Stable Stable 0.908 Declining Tyee Increasing Stable 1.005 Stationary Klamath Stable Stable 0.997 Stationary S. Cascades Declining Stable 0.974 Stationary NW California Declining Declining 0.985 Declining? Hoopa Increasing Stable 0.98 Stationary Simpson Declining Stable 0.97 Declining Marin Stable Stable NA NA Point estimates of Λrjs ranged from 0.896 to 1.005 for the 13 long-term study areas, and in all study areas but one—the Tyee study area—these estimates were less than 1.0 (Anthony et al. 2006) (Table 3). There was strong evidence that populations in the Wenatchee, Cle Elum, Warm Springs, and Simpson study areas decreased during the period of study. There also was evidence that populations in the Rainier, Olympic, Oregon Coast Range, and HJ Andrews study areas were decreasing. The precision of the Λrjs estimates for Rainier and Olympic study areas was poor and not sufficient to detect a statistically significant difference from 1.00; however, the estimate of Λrjs for the Rainier study area (0.896) was the lowest of all of the areas. Populations in the Tyee, Klamath, South Oregon Cascades, Northwest California, and Hoopa study areas appeared to be stationary during the study, but there was some evidence that the spotted owl population in the Northwest California study area was decreasing (Λrjs = 0.959 to 1.011). The weighted mean Λrjs for all of the study areas was 0.963 (standard error [SE] = 0.009, 95 percent confidence interval [CI] = 0.945 to 0.981), suggesting that populations over all of the study areas decreased by about 3.7 percent per year from 1985 to 2003. Anthony et al. (2006) explains that the indication populations were declining was based on the fact that the 95 percent confidence intervals around the estimate of the mean lambda did not overlap 1.0 (stable) or barely included 1.0. The mean Λrjs for the eight demographic monitoring areas that are part of the effectiveness monitoring program of the NWFP was 0.976 (SE = 0.007, 95 percent CI = 0.962 to 0.990), and the mean Λrjs for the other five study areas was 0.942 (SE = 0.016, 95 percent CI = 0.910 to 0.974), yielding average declines of 2.4 and 5.8 percent per year, respectively. These data suggest that demographic rates for spotted owl populations on Federal lands were better than elsewhere; however, both the interspersion of non-Federal land in study areas, and the likelihood that spotted owls use habitat on multiple ownerships in some demography study landscapes, confound this comparison.

28
The number of populations that declined and the rate at which they have declined are noteworthy, particularly the precipitous declines in the Wenatchee, Cle Elum, and Rainier study areas in Washington and the Warm Springs study area in Oregon. Estimates of population declines in these areas ranged from 40 to 60 percent during the study period of 1990 to 2003 (Anthony et al. 2006). Decreases in apparent adult survival rates were an important factor contributing to decreasing population trends. Survival rates decreased over time in five of the 14 study areas: four study areas in Washington, which showed the sharpest declines, and one study area in the California Klamath Province of northwest California (Anthony et al. 2006). In Oregon, there were no time trends in apparent survival for four of six study areas, and remaining areas had weak, non-linear trends. In California, three study areas showed no trend and one showed a significant linear decrease (Anthony et al. 2006). Like the trends in annual rate of population change, trends in the rate of adult survival showed clear decreases in some areas but not in others. Loehle et al. (2005a) sampled a small portion of the range of the species and questioned the accuracy of lambda estimates computed in Anthony et al. (Anthony et al. 2004, subsequently published as Anthony et al. 2006), suggesting that the estimates were biased low by 3 to 4 percentage points. Loehle et al. (2005a) contended the lambda estimates in Anthony et al. (2004) did not accurately account for spotted owl emigration. Therefore, more of the spotted owl demography study areas would have a lambda closer to 1.0, a stationary population. Loehle et al. then published an erratum (Loehle et al. 2005b) acknowledging that the more recent analysis methods used in Anthony et al. (2006) did not cause them concern regarding potentially miscalculated permanent emigration rates. Subsequently, Franklin et al. (2006) published a comment indicating the Loehle et al. (2005a) survival estimates were inappropriate for comparison because they introduced a positive bias to the measure of population change, were not valid for evaluating bias, and their study areas were too different from the demography study areas to allow for comparison. There are few spotted owls remaining in British Columbia. Chutter et al. (2004) suggested immediate action was required to improve the likelihood of recovering the spotted owl population in British Columbia. In 2007, personnel in British Columbia captured and brought into captivity the remaining 16 known wild spotted owls. Prior to initiating the captive-breeding program, the population of spotted owls in Canada was declining by as much as 35 percent per year (Chutter et al. 2004). The amount of previous interaction between spotted owls in Canada and the United States is unknown (Chutter et al. 2004).

29
LITERATURE CITED
Andersen, D.E., O. Rongstad, and W.R. Mytton. 1989. Response of nesting red-tailed hawks to helicopter overflights. The Condor 9(2):296-99.
Anderson, D.R. and K.P. Burnham. 1992. Demographic analysis of northern spotted owl populations. Pages 319-28. In: Draft final recovery plan for the northern spotted owl. U.S. Fish and Wildlife Service, Portland, OR.
Anthony, R.G. and L.S. Andrews. 2004. Summary Report: Winter habitat use by spotted owls on USDI Bureau of Land Management Medford District Lands within the boundaries of the Timbered Rock Fire. Oregon Cooperative Wildlife Research Unit, Oregon State University, Corvallis, OR, 29 pp.
Anthony, R.G., E.D. Forsman, A.B. Franklin, D.R. Anderson, K.P. Burnham, G.C. White, C.J. Schwarz, J. Nichols, J.E. Hines, G.S. Olson, S.H. Ackers, S. Andrews, B.L. Biswell, P.C. Carlson, L.V. Diller, K.M. Dugger, K.E. Fehring, T.L. Fleming, R.P. Gerhardt, S.A. Gremel, R.J. Gutiérrez, P.J. Happe, D.R. Herter, J.M. Higley, R.B. Horn, L.L. Irwin, P.J. Loschl, J.A. Reid, and S.G. Sovern. 2004. Status and trends in demography of northern spotted owls, 1985-2003. Portland, Oregon, September 2004, 179 pp.
Anthony, R.G., E.D. Forsman, A.B. Franklin, D.R. Anderson, K.P. Burnham, G.C. White, C.J. Schwarz, J. Nichols, J.E. Hines, G.S. Olson, S.H. Ackers, S. Andrews, B.L. Biswell, P.C. Carlson, L.V. Diller, K.M. Dugger, K.E. Fehring, T.L. Fleming, R.P. Gerhardt, S.A. Gremel, R.J. Gutiérrez, P.J. Happe, D.R. Herter, J.M. Higley, R.B. Horn, L.L. Irwin, P.J. Loschl, J.A. Reid, and S.G. Sovern. 2006. Status and trends in demography of northern spotted owls, 1985-2003. Wildlife Monographs 163:2-68.
Barrowclough, G.F. and R.J. Gutiérrez. 1990. Genetic variation and differentiation in the spotted owl. Auk 107:737-44.
Barrowclough, G.F., R.J. Gutiérrez, and J.G. Groth. 1999. Phylogeography of spotted owl (Strix occidentalis) populations based on mitochondrial DNA sequences; gene flow, genetic structure, and a novel biogeographic pattern. Evolution 53(3):919-31.
Barrows, C.W. and K. Barrows. 1978. Roost characteristics and behavioral thermoregulation in the spotted owl. Western Birds 9(1):1-8.
Bart, J. 1995. Amount of suitable habitat and viability of northern spotted owls. Conservation Biology 9(4):943-46.
Bart, J. and E.D. Forsman. 1992. Dependence of northern spotted owls Strix occidentalis caurina on old-growth forests in the western USA. Biological Conservation 62:95-100.

30
Bingham, B.B. and B.R. Noon. 1997. Mitigation of habitat “take”: Application to habitat conservation planning. Conservation Biology 11(1):127-38.
Blakesley, J.A., A.B. Franklin, and R.J. Gutiérrez. 1992. Spotted owl roost and nest site selection in northwestern California. Journal of Wildlife Management 56(2):388-92.
Bond, M.L., R.J. Gutiérrez, A.B. Franklin, W.S. LaHaye, C.A. May, and M.E. Seamans. 2002. Short-term effects of wildfires on spotted owl survival, site fidelity, mate fidelity, and reproductive success. Wildlife Society Bulletin 30(4):1022-28.
Buchanan, J.B. 2004. In My Opinion: Managing habitat for dispersing northern spotted owls-are the current management strategies adequate? Wildlife Society Bulletin 32(4):1333-45.
Buchanan, J.B., E. Hanson, D. Hays, and L. Young. 1994. An evaluation of the Washington Forest Practices Board Wildlife Committee preferred alternative for a spotted owl protection rule. Washington Forest Practices Board Spotted Owl Scientific Advisory Group, Olympia, WA, July 1994.
Buchanan, J.B., L.L. Irwin, and E.L. McCutchen. 1993. Characteristics of spotted owl nest trees in the Wenatchee National Forest. Journal of Raptor Research 27(1):1-7.
Buchanan, J.B., L.L. Irwin, and E.L. McCutchen. 1995. Within-stand nest site selection by spotted owls in the eastern Washington Cascades. Journal of Wildlife Management 59(2):301-10.
Buchanan, J.B. and P. Sweeden. 2005. Final briefing report to the Washington State Forest Practices Board regarding spotted owl status and forest practices rules. Washington Department of Fish and Wildlife, Olympia, WA, August 2005, 85 pp.
Burnham, K.P., D.R. Anderson, and G.C. White. 1994. Estimation of vital rates of the northern spotted owl. 26 pp.
Caffrey, C. 2003. Determining impacts of West Nile Virus on crows and other birds. American Birds (103rd Count) 57:12-13.
Caffrey, C. and C.C. Peterson. 2003. West Nile Virus may not be a conservation issue in northeastern United States. American Birds (103rd Count) 57:14-21.
Campbell, N.A. 1990. Adrenal glands. Pages 923-26. In: Biology, 2nd ed. Benjamin/Cummings Publishing Company, Inc., Redwood City, CA.
31
Carsia, R.V. and S. Harvey. 2000. Adrenals. Pages 489-500 & 517-518. In: Whittow, G.C. (ed). Sturkie's Avian Physiology, 5th ed. Academy Press, San Diego, CA.
CDF (California Department of Forestry) and Fire Protection. 2005. California Forest Practices Rules: 2001. Title 14, California code of regulations, chapters 4, 4.5, and 10. Sacramento, California, January 2005, 285 pp.
Chi, T., A. Henke, C. Brinegar, and J. Smith. 2004. Mitochondrial DNA analysis of northern spotted owl and California spotted owl populations. San Jose, CA, May 13, 2004, 4 pp.
Chutter, M.J., I. Blackburn, D. Bonin, J. Buchanan, B. Costanzo, D. Cunnington, A. Harestad, T. Hayes, D. Heppner, L. Kiss, J. Surgenor, W. Wall, L. Waterhouse, and L. Williams. 2004. Recovery strategy for the northern spotted owl (Strix occidentalis caurina) in British Columbia. BC Ministry of Environment, Victoria, BC, 74 pp.
Courtney, S.P., J.A. Blakesley, R.E. Bilby, M.L. Cody, J.P. Dumbacher, R.C. Fleischer, A.B. Franklin, J.F. Franklin, R.J. Gutiérrez, J.M. Marzluff, and L. Sztukowski. 2004. Scientific evaluation of the status of the northern spotted owl. Sustainable Ecosystems Institute, Portland, Oregon.
Delaney, D.K., T.G. Grubb, P. Beier, L.L. Pater, and M.H. Reiser. 1999. Effects of helicopter noise on Mexican spotted owls. Journal of Wildlife Management 63(1):60-76.
Deubel, V., L. Fiette, P. Gounon, M.T. Drouet, H. Khun, M. Huerre, C. Banet, M. Malkinson, and P. Despres. 2001. Variations in biological features of West Nile viruses. Annals of the New York Academy of Sciences 951:195-206.
Dugger, K.M., F. Wagner, R.G. Anthony, and G.S. Olson. 2005. The relationship between habitat characteristics and demographic performance of northern spotted owls in southern Oregon. The Condor 107:863-78.
Dunbar, D.L., B.P. Booth, E.D. Forsman, A.E. Hetherington, and D.J. Wilson. 1991. Status of the spotted owl, Strix occidentalis, and barred owl, Strix varia, in southwestern British Columbia. Canadian Field Naturalist 105:464-68.
Fitzgerald, S.D., J.S. Patterson, M. Kiupel, H.A. Simmons, S.D. Grimes, C.F. Sarver, R.M. Fulton, B.A. Fulton, B.A. Steficek, T.M. Cooley, J.P. Massey, and J.G. Sikarskie. 2003. Clinical and pathological features of West Nile Virus infection in native North American owls (family Strigidae). Avian Diseases 47:602-10.
Folliard, L. 1993. Nest site characteristics of northern spotted owls in managed forest of northwest California. Master of Science. University of Idaho, Moscow, Idaho.

32
Forsman, E.D. 1981. Molt of the spotted owl. Auk 98:735-42.
Forsman, E.D., R.G. Anthony, J.A. Reid, P.J. Loschl, S.G. Sovern, M. Taylor, B.L. Biswell, A. Ellingson, E.C. Meslow, G.S. Miller, K.A. Swindle, J.A. Thrailkill, F.F. Wagner, and D.E. Seaman. 2002. Natal and breeding dispersal of northern spotted owls. Wildlife Monographs 149(1):35.
Forsman, E.D., R.G. Anthony, E.C. Meslow, and C.J. Zabel. 2004. Diets and foraging behavior of northern spotted owls in Oregon. Journal of Raptor Research 38(3):214-30.
Forsman, E.D., S. DeStefano, and M.G. Raphael. 1996. Demography of the northern spotted owl, Studies in Avian Biology No. 17 ed. Cooper Ornithological Society, Lawrence, Kansas. 122 pp.
Forsman, E.D. and A.R. Giese. 1997. Nests of northern spotted owls on the Olympic Peninsula, Washington. The Wilson Bulletin 109(1):28-41.
Forsman, E.D., E.C. Meslow, and H.M. Wight. 1984. Distribution and biology of the spotted owl in Oregon. Wildlife Monographs 87:1-64.
Forsman, E.D., I.A. Otto, S.G. Sovern, M. Taylor, D.W. Hays, H. Allen, S.L. Roberts, and D.E. Seaman. 2001. Spatial and temporal variation in diets of spotted owls in Washington. Journal of Raptor Research 35(2):141-50.
Franklin, A.B., D.R. Anderson, R.J. Gutiérrez, and K.P. Burnham. 2000. Climate, habitat quality, and fitness in northern spotted owl populations in northwestern California. Ecological Monographs 70(4):539-90.
Franklin, A.B., J.D. Nichols, R.G. Anthony, K.P. Burnham, G.C. White, E.D. Forsman, and D.R. Anderson. 2006. Comment on "Are survival rates for northern spotted owls biased?". Canadian Journal of Zoology 84:1375-79.
Franklin, A.B. 1992. Population regulation in northern spotted owls: theoretical implications for management. Pages 815-27. In: McCullough, D.R. and R.H. Barrett (eds). Wildlife 2001: Populations. Elsevier Applied Sciences, London, England.
Franklin, A.B., K.P. Burnham, G.C. White, and R.J. Anthony. 1999. Range-wide status and trends in northern spotted owl populations. Colorado Cooperative Fish and Wildlife Research Unit, Fort Collins, CO and Oregon Cooperative Fish and Wildlife Research Unit, Corvallis, Oregon, April 12, 1999, 71 pp.

33
Gaines, W.L., R.A. Strand, and S.D. Piper. 1997. Effects of the Hatchery Complex Fires on northern spotted owls in the eastern Washington Cascades. Pages 123-29. In: Greenlee, J.M., ed. Proceedings of the First Conference on Fire Effects on Rare and Endangered Species and Habitats, November 13-16, 1995, International Association of Wildland Fire, Coeur d'Alene, Idaho.
Garmendia, A.E., H.J. Van Kruiningen, R.A. French, J.F. Anderson, T.G. Andreadis, A. Kumar, and A.B. West. 2000. Recovery and identification of West Nile virus from a hawk in winter. Journal of Clinical Microbiology 38(8):3110-11.
Glenn, E.M., M.C. Hansen, and R.G. Anthony. 2004. Spotted owl home-range and habitat use in young forests of western Oregon. Journal of Wildlife Management 68(1):33-50.
Goheen, E.M., E.M. Hansen, A. Kanaskie, M.G. Williams, N. Oserbauer, and W. Sutton. 2002. Sudden oak death caused by Phytophthora ramorum in Oregon. Plant Disease 86(4):440-44.
Gremel, S.A. 2005. Factors controlling distribution and demography of northern spotted owls in a reserved landscape. M.S. Thesis. University of Washington,
Gutiérrez, R.J. 1989. Hematozoa from the spotted owl. Journal of Wildlife Disease 25(4):614-18.
Gutiérrez, R.J. 1996. Biology and distribution of the northern spotted owl. Pages 2-5. In: Forsman, E.D., S. DeStefano, M.G. Raphael, and R.J. Gutiérrez (eds). Demography of the northern spotted owl, Studies in Avian Biology No. 17 ed. Cooper Ornithological Society.
Gutierrez, R.J. and G. Barrowclough. 2005. Redefining the distributional boundaries of the northern and California spotted owls: implications for conservation. The Condor 107.
Gutiérrez, R.J., M.B. Cody, S. Courtney, and D. Kennedy. 2004. Assessment of the potential threat of the northern barred owl. Pages 7-1- 7-52. In: Courtney, S.P. (ed). Scientific evaluation of the status of the northern spotted owl. Sustainable Ecosystems Institute, Portland, OR.
Gutiérrez, R.J., A.B. Franklin, and W.S. LaHaye. 1995. Spotted owl (Strix occidentalis). Pages 1-28. In: Poole, A. and F. Gill (eds). The birds of North America no. 179. The Academy of Natural Sciences and The American Ornithologists' Union, Washington, D.C.
Haig, S.M., T.D. Mullins, E.D. Forsman, P. Trail, and L. Wennerberg. 2004. Genetic identification of spotted owls, barred owls, and their hybrids: legal implications of hybrid identity. Conservation Biology 18:1347-57.
34
Haig, S.M., R.S. Wagner, E.D. Forsman, and T.D. Mullins. 2001. Geographic variation and genetic structure in spotted owls. Conservation Genetics 2(1):25-40.
Hamer, T.E. 1988. Home range size of the northern barred owl and northern spotted owl in western Washington. Masters of Science - Department of Biology. Western Washington University, Bellingham, WA.
Hamer, T.E., E.D. Forsman, A.D. Fuchs, and M.L. Walters. 1994. Hybridization between barred and spotted owls. Auk 111(2):487-92.
Hamer, T.E., D.L. Hays, C.M. Senger, and E.D. Forsman. 2001. Diets of northern barred owls and northern spotted owls in an area of sympatry. Journal of Raptor Research 35(3):221-27.
Hamer, T.E., S.G. Seim, and K.R. Dixon. 1989. Northern spotted owl and northern barred owl habitat use and home range size in Washington: Preliminary Report. Washington Department of Wildlife, Olympia, WA, November 1989, 65 pp.
Hanson, E., D. Hays, L. Hicks, L. Young, and J. Buchanan. 1993. Spotted Owl Habitat in Washington: A Report to the Washington Forest Practices Board. Washington Forest Practices Board Spotted Owl Scientific Advisory Group, Olympia, WA, December 20, 1993.
Harestad, A., J. Hobbs, and I. Blackburn. 2004. Précis of the northern spotted owl in British Columbia. Pages 12-14. In: Zimmerman, K., K. Welstead, E. Williams, and J. Turner, eds. Northern spotted owl workshop proceedings, Forrex Series, 14,January 21-22, 2004, Vancouver, BC. 14 pp.
Henke, A.L., T.Y. Chi, J. Smith, and C. Brinegar. 2005. Microsatellite analysis of northern and California spotted owls in California. Conservation Genetics Laboratory, Department of Biological Sciences, San Jose State University, San Jose, CA, 19 pp.
Hershey, K.T., E.C. Meslow, and F.L. Ramsey. 1998. Characteristics of forests at spotted owl nest sites in the Pacific Northwest. Journal of Wildlife Management 62(4):1398-410.
Herter, D.R., L.L. Hicks, H.C. Stabins, J.J. Millspaugh, A.J. Stabins, and L.D. Melampy. 2002. Roost site characteristics of northern spotted owls in the nonbreeding season in central Washington. Forest Science 48(2):437-46.
Herter, D.R. and L.L. Hicks. 2000. Barred owl and spotted owl populations and habitat in the central Cascade Range of Washington. Journal of Raptor Research 34(4):279-86.
35
Hoberg, E.P., G.S. Miller, E. Wallner-Pendleton, and O.R. Hedstrom. 1989. Helminth parasites of northern spotted owls (Strix occidentalis caurina) from Oregon. Journal of Wildlife Disease 25(2):246-51.
Irwin, L.L., D.F. Rock, and G.P. Miller. 2000. Stand structures used by northern spotted owls in managed forests. Journal of Raptor Research 34(3):175-86.
Iverson, W.F. 2004. Reproductive success of spotted owls sympatric with barred owls in western Washington. Journal of Raptor Research 38(1):88-91.
Iverson, W.F. 1993. Is the barred owl displacing the spotted owl in western Washington? M.S. Thesis. Western Washington University,
Johnson, D.H. 1992. Spotted owls, great horned owls, and forest fragmentation in the central Oregon Cascades. M.S. Thesis. Oregon State University, Corvallis, OR.
Kelly, E.G., E.D. Forsman, and R.G. Anthony. 2003. Are barred owls replacing spotted owls? The Condor 105:45-53.
Kelly, E.G. and E.D. Forsman. 2004. Recent records of hybridization between barred owls (Strix varia) and northern spotted owls (S. occidentalis caurina). Auk 121(3):806-10.
King, G.M., K.R. Bevis, M.A. Rowe, and E.E. Hanson. 1997. Spotted owl use of habitat impacted by 1994 fires on the Yakama Indian Reservation: Three years post fire. Yakama Indian Nation, Toppenish, WA.
Knight, R.L. and S.K. Skagen. 1988. Effects of recreational disturbance on birds of prey: A review. Pages 355-59. In: Southwest Raptor Management Symposium Workshop.
Komar, N., N.A. Panella, J.E. Burns, S.W. Dusza, T.M. Mascarenhas, and T.O. Talbot. 2001. Serologic evidence for West Nile virus infection in birds in the New York City vicinity during an outbreak in 1999. Emerging Infectious Diseases 7(4):621-25.
LaHaye, W.S. and R.J. Gutiérrez. 1999. Nest sites and nesting habitat of the northern spotted owl in northwestern California. The Condor 101(324):330.
LaHaye, W.S., R.J. Gutiérrez, and J.R. Dunk. 2001. Natal Dispersion of the Spotted Owl in Southern California: Dispersal Profile of an Insular Population. The Condor 103:691-700.
Laidig, K.J. and D.S. Dobkin. 1995. Spatial overlap and habitat association of Barred Owls and Great Horned Owls in southern New Jersey. Journal of Raptor Research 29(3):151-57.

36
Leskiw, T. and R.J. Gutiérrez. 1998. Possible predation of a spotted owl by a barred owl. Western Birds 29:225-26.
Lint, J. 2005. Northwest Forest Plan - The first 10 years (1994-2003): Status and trends of northern spotted owl populations and habitat. General Technical Report PNW-GTR-648. USDA Forest Service, Pacific Northwest Research Station, Portland, Oregon, September 2005.
Livezey, K.B. 2005. Iverson (2004) on spotted owls and barred owls: Comments on methods and conclusions. Journal of Raptor Research 39(1):102-03.
Loehle, C., L.L. Irwin, D. Rock, and S. Rock. 2005a. Are survival rates for northern spotted owls biased? Canadian Journal of Zoology 83:1386-90.
Loehle, C., L.L. Irwin, D. Rock, and S. Rock. 2005b. Erratum: Are survival rates for northern spotted owls biased? Canadian Journal of Zoology 84:141.
Marra, P.P., S. Griffing, C. Caffrey, A.M. Kilpatrick, R. McLean, C. Brand, E. Saito, A.P. Dupuis, L. Kramer, and R. Novak. 2004. West Nile Virus and Wildlife. BioScience 54(5):393-402.
McGarigal, K., R.G. Anthony, and F.B. Isaacs. 1991. Interactions of humans and bald eagles on the Columbia River estuary. Wildlife Monographs 115:1-47.
McLean, R.G., S.R. Ubico, S.E. Docherty, W.R. Hansen, L. Sileo, and T.S. McNamara. 2001. West Nile Virus Transmission and Ecology in Birds. Annals of the New York Academy of Sciences 951(4):54-57.
Meyer, J.S., L.L. Irwin, and M.S. Boyce. 1998. Influence of habitat abundance and fragmentation on northern spotted owls in western Oregon. Wildlife Monographs 139:1-51.
Miller, G.S. 1989. Dispersal of juvenile spotted owls in western Oregon. M.S. Thesis. Oregon State University, Corvallis, OR.
Miller, G.S., S.K. Nelson, and W.C. Wright. 1985. Two-year-old female spotted owl breeds successfully. Western Birds 16:69-73.
Miller, G.S., R.J. Small, and E.C. Meslow. 1997. Habitat selection by spotted owls during natal dispersal in western Oregon. Journal of Wildlife Management 61(1):140-50.
Moen, C.A., A.B. Franklin, and R.J. Gutiérrez. 1991. Age determination of subadult northern spotted owls in northwest California. Wildlife Society Bulletin 19:489-93.

37
Moeur, M., T.A. Spies, M.A. Hemstrom, J.R. Martin, J. Alegria, J. Browning, J. Cissel, W.B. Cohen, T.E. Demeo, S. Healey, and R. Warbington. 2005. Northwest Forest Plan - The first 10 years (1994-2003): Status and trend of late-successional and old-growth forest. General Technical Report PNW-GTR-646. USDA, Forest Services, Pacific Northwest Research Station, 142 pp.
North, M.P., G. Steger, R. Denton, G. Eberlein, T. Munton, and K. Johnson. 2000. Association of weather and nest-site structure with reproductive success in California spotted owls. Journal of Wildlife Management 64(3):797-807.
ODF (Oregon Department of Forestry). 2006. Oregon Department of Forestry Forest Practice Administrative Rules and Forest Practices Act. 93 pp.
Olson, G.S., R.G. Anthony, E.D. Forsman, S.H. Ackers, P.J. Loschl, J.A. Reid, K.M. Dugger, E.M. Glenn, and W.J. Ripple. 2005. Modeling of site occupancy dynamics for northern spotted owls, with emphasis on the effects of barred owls. Journal of Wildlife Management 69(3):918-32.
Olson, G.S., E.M. Glenn, R.G. Anthony, E.D. Forsman, J.A. Reid, P.J. Loschl, and W.J. Ripple. 2004. Modeling demographic performance of northern spotted owls relative to forest habitat in Oregon. Journal of Wildlife Management 68(4):1039-53.
Parmesan, C. and G. Yohe. 2003. A globally coherent fingerprint of climate change impacts across natural systems. Nature 421:37-42.
Pearson, R.R. and K.B. Livezey. 2003. Distribution, numbers, and site characteristics of spotted owls and barred owls in the Cascade Mountains of Washington. Journal of Raptor Research 37(4):265-76.
Pierce, D.J., J.B. Buchanan, B.L. Cosentino, and S. Snyder. 2005. An assessment of spotted owl habitat on non-federal lands in Washington between 1996 and 2004. Wildlife Department of Wildlife, Olympia, WA, 187 pp.
Rizzo, D.M., M. Garbeloto, J.M. Davidson, G.W. Slaughter, and S.T. Koike. 2002. Phytophthora ramorum as the cause of extensive mortality of Quercus spp. and Lithocarpus densiflorus in California. Plant Disease 86:205-14.
Rosenberg, D.K., K.A. Swindle, and R.G. Anthony. 2003. Influence of prey abundance on northern spotted owl reproductive success in western Oregon. Canadian Journal of Zoology 81:1715-25.

38
Sapolsky, R.M., L.M. Romero, and A.U. Munck. How do glucocorticoids influence stress responses? Integrating permissive, suppressive, stimulatory, and preparative actions. Endocrine Review 21(1):55-89.
Schmidt, K. 2006. Northern Spotted Owl Monitoring and Inventory Redwood National and State Parks: 2005 Annual Report. Orick, California, July 17, 2006, 21 pp.
Singleton, P., S. Graham, W. Gaines, and J. Lehmkuhl. 2005. The ecology of barred owls in fire-prone forests: Progress Report. U.S. Department of Agriculture, Wenatchee, Washington, December 2, 2005, 32 pp.
Sisco, C.L. 1990. Seasonal home range and habitat ecology of spotted owls in northwestern California. M.S. Thesis. Humboldt State University, Arcata, CA.
Solis, D.M. and R.J. Gutiérrez. 1990. Summer habitat ecology of northern spotted owls in northwestern California. The Condor 92:739-48.
Sovern, S.G., E.D. Forsman, B.L. Biswell, D.N. Rolph, and M. Taylor. 1994. Diurnal behavior of the spotted owl in Washington. The Condor 96(1):200-02.
Swarthout, E.C.H. and R.J. Steidl. 2001. Flush responses of Mexican spotted owls to recreationists. The Journal of Wildlife Management 65(2):312-17.
Tempel, D.J. and R.J. Gutiérrez. 2003. Fecal corticosterone levels in California spotted owls exposed to low-intensity chainsaw sound. Wildlife Society Bulletin 31(3):1-5.
Tempel, D.J. and R.J. Gutiérrez. 2004. Factors related to fecal corticosterone levels in California spotted owls: Implications for assessing chronic stress. Conservation Biology 18(2):538-47.
Thomas, J.W., M.G. Raphael, R.G. Anthony, E.D. Forsman, A.G. Gunderson, R.S. Holthausen, B.G. Marcot, G.H. Reeves, J.R. Sedell, and D.M. Solis. 1993a. Viability assessments and management considerations for species associated with late-successional and old-growth forests of the Pacific Northwest. U.S. Department of Agriculture, U.S. Forest Service, Portland, OR. 530 pp.
Thomas, J.W., E.D. Forsman, J.B. Lint, E.C. Meslow, B.R. Noon, and J. Verner. 1990. A conservation strategy for the northern spotted owl: A report of the Interagency Scientific Committee to address the conservation of the northern spotted owl. U.S. Department of the Interior, Bureau of Land Management, Fish and Wildlife Service, and National Park Service, Portland, Oregon, May, 1990, 427 pp.

39
Thomas, J.W., M.G. Raphael, R.G. Anthony, E.D. Forsman, A.G. Gunderson, R.S. Holthausen, B.G. Marcot, G.H. Reeves, J.R. Sedell, and D.M. Solis. 1993b. Forest ecosystem management: An ecological, economic, and social assessment. U.S. Department of Agriculture, U.S. Forest Service and the U.S. Department of the Interior, Bureau of Land Management, Portland, OR, 552 pp.
USFS (U.S. Forest Service) and USBLM (U.S. Bureau of Land Management). 1994a. Final Supplemental Environmental Impact Statement on management of habitat for late-successional and old-growth forest related species within the range of the northern spotted owl. Portland, Oregon, 557.
USFS (U.S. Forest Service) and USBLM (U.S. Bureau of Land Management). 1994b. Record of decision for amendments to Forest Service and Bureau of Land Management planning documents within the range of the northern spotted owl; standards and guidelines for management of habitat for late-successional and old-growth forest related species within the range of the northern spotted owl. Portland, Oregon.
USFWS (U.S. Fish and Wildlife Service). 1989. The northern spotted owl; a status review supplement. USDI Fish and Wildlife Service, Portland, Oregon, April 21, 1989.
USFWS (U.S. Fish and Wildlife Service). 1990. The 1990 status review: northern spotted owl: Strix occidentalis caurina. U.S. Fish and Wildlife Service, Portland, Oregon, April 30, 1990, 95 pp.
USFWS (U.S. Fish and Wildlife Service). 1992. Draft final recovery plan for the northern spotted owl. USDI Fish and Wildlife Service, Portland, Oregon, 662 pp.
USFWS (U.S. Fish and Wildlife Service). 2001. A range wide baseline summary and evaluation of data collected through section 7 consultation for the northern spotted owl and its critical habitat: 1994-2001. USDI Fish and Wildlife Service, Portland, Oregon, June 26, 2001, 40 pp.
USFWS (U.S. Fish and Wildlife Service). 2004. Northern spotted owl: Five year review summary and evaluation. USDI Fish and Wildlife, Portland, Oregon, November 15, 2004, 73 pp.
USFWS (U.S. Fish and Wildlife Service). 2008. Final Recovery Plan for the northern spotted owl, Strix occidentalis caurina. U.S Fish and Wildlife, Portland, Oregon, May 13, 2008, 142 pp.
USFWS (U.S. Fish and Wildlife Service) and NMFS (National Marine Fisheries Service). 1998. Endangered Species Consultation Handbook: Procedures for conducting consultation and conference activities under Section 7 of the Endangered Species Act. U.S. GPO:2004-690-278. March 1998.
40
Wagner, F.F., E.C. Meslow, G.M. Bennett, C.J. Larson, S.M. Small, and S. DeStefano. 1996. Demography of northern spotted owls in the southern Cascades and Siskiyou Mountains, Oregon. Pages 67-76. In: Forsman, E.D., S. DeStefano, M.G. Raphael, and R.J. Gutiérrez (eds). Demography of the northern spotted owl. Studies in Avian Biology No.17. Cooper Ornithology Society.
Ward, J.P., R.J. Gutiérrez, and B.R. Noon. 1998. Habitat selection by northern spotted owls: The consequences of prey selection and distribution. The Condor 100:79-92.
Ward, J.W.Jr. 1990. Spotted owl reproduction, diet and prey abundance in northwest California. M.S. Thesis. Humboldt State University, Arcata, CA.
Wasser, S.K., K. Bevis, G. King, and E. Hanson. 1997. Noninvasive physiological measures of disturbance in the northern spotted owl. Conservation Biology 11(4):1019-22.
Weathers, W.W., P.J. Hodum, and J.A. Blakesley. 2001. Thermal ecology and ecological energetics of the California spotted owl. The Condor 103(4):678-90.
WFPB (Washington Forest Practices Board). 1996. Final Environmental Impact Statement on Forest Practices Rule Proposals for northern spotted owl, marbled murrelet, western gray squirrel. Washington Forest Practices Board, Olympia, WA.
WFPB (Washington Forest Practices Board). 2005. Emergency Rule CR 103. Amendment to WAC 2-16-010 "northern spotted owl site center"; WAC 222-16-041(4)(b). November 30, 2005. Washington Forest Practices Board, Olympia, WA.
White, C.M. and T.L. Thurow. 1985. Reproduction of ferruginous hawks exposed to controlled disturbance. The Condor 87:14-22.
Zabel, C.J., J.R. Dunk, H.B. Stauffer, L.M. Roberts, B.S. Mulder, and A. Wright. 2003. Northern spotted owl habitat models for research and management application in California (USA). Ecological Applications 13(4):1027-40.
Zabel, C.J., K.M. McKelvey, and J.P. Ward Jr. 1995. Influence of primary prey on home-range size and habitat-use patterns of northern spotted owls (Strix occidentalis caurina). Canadian Journal of Zoology 73:433-39.
Zabel, C.J., S.E. Salmons, and M. Brown. 1996. Demography of northern spotted owls in southwestern Oregon. Pages 77-82. In: Forsman, E.D., S. DeStefano, M.G. Raphael, and R.J. Gutiérrez (eds). Demography of the northern spotted owl. Studies in Avian Biology No. 17. Cooper Ornithology Society.

69
Appendix 2: Status of the Critical Habitat: Northern Spotted Owl
1
Appendix 2 Status of the Northern Spotted Owl Critical Habitat
This Biological Opinion does not rely on the regulatory definition of “destruction or adverse modification” of critical habitat at 50 CFR 402.02. Instead, we have relied upon the statutory provisions of the Act and the August 6, 2004, Ninth Circuit Court of Appeals decision in Gifford Pinchot Task Force v. U.S. Fish and Wildlife Service (No. 03-35279) to complete the following analysis with respect to critical habitat. Legal Status On January 15, 1992, the Service designated northern spotted owl (spotted owl) critical habitat within 190 critical habitat units (CHUs) which encompassed nearly 6.9 million acres of Federal lands in California, Oregon, and Washington (57 FR 1796-1838). On August 13, 2008, the Service revised spotted owl critical habitat into 29 units, comprised of 174 subunits, on approximately 5,312,300 acres of Federal lands in California, Oregon, and Washington (73 FR 47326-47522). Primary Constituent Elements Primary constituent elements (PCEs) are the physical and biological features of critical habitat essential to a species' conservation. PCEs identified in the spotted owl critical habitat final rule include forest types that support the spotted owl across its geographic range when they occur in concert with a) nesting, roosting, foraging, and/or dispersal habitat, or b) lands capable of developing one or more of these habitats in the future (73 FR 47347-47348). Forests. Forest types that support the spotted owl across its geographic range. These forest types are primarily Sitka spruce, western hemlock, mixed conifer and mixed evergreen, grand fir, Pacific silver fir, Douglas-fir, white fir, Shasta red fir, redwood/Douglas-fir (in coastal California and southwestern Oregon), and the moist end of the ponderosa pine coniferous forests zones at elevations up to approximately 3, 000 ft (914m) near the northern edge of the range and up to approximately 6, 000 ft (1, 828 m) at the southern edge. These forest types may be in early-, mid-, or late-seral stages. This PCE is essential to the conservation of the species because it provides the biotic communities that are known to be necessary for the northern spotted owl. This PCE must occur in concert with at least one of the PCEs below. (73 FR 47347) Nesting, roosting, and foraging habitat. The forest types described above that contain one or more of the habitat types described below to meet the home range needs of territorial pairs of spotted owls throughout the year or that are habitat-capable of developing one or more of these habitat types. (As used in this entry, areas that are ‘‘habitat capable’’ of developing an essential habitat component are those forest types described above, excluding serpentine soil areas, and that provide the requisite ecological conditions (e.g., moisture regime, soils, aspect, slope, potential vegetative community) for growing and sustaining the structural conditions required for that habitat component.) A home range provides the habitat components essential for the survival and successful reproduction of a resident breeding pair of spotted owls. The amount, quality, and configuration of these habitat types required for a home range varies according to

2
local conditions and factors such as the degree of habitat fragmentation, proportion of available nesting habitat, and primary prey species. The core area of the home range is used most intensively and usually includes the nesting area. The remainder of the home range is used for foraging and roosting. The size of home ranges extend from approximately 2, 955 ac (1, 196 ha) in the Oregon Cascades to approximately 14, 271 ac (5, 775 ha) on the Olympic Peninsula of Washington. The size of core areas extends from approximately 500 ac (202 ha) in the southern part of the species’ range to approximately 4, 057 ac (1, 642 ha) in the northern part of the range (73 FR 47347). The three habitat types within the home range of a spotted owl are: Nesting habitat. Nesting habitat is essential to provide structural features for nesting, protection from adverse weather conditions, and cover to reduce predation risks. It includes a moderate to high canopy closure (60 to 80 percent); a multi-layered, multi-species canopy with large (generally greater than 30 inches (in) (76 centimeters (cm) diameter at breast height (dbh)) overstory trees; a high incidence of large trees with various deformities (e.g., large cavities, broken tops, mistletoe infections, and other platforms); large snags; large accumulations of fallen trees and other woody debris on the ground; and sufficient open space below the canopy for northern spotted owls to fly. Patches of nesting habitat, in combination with roosting habitat must be sufficiently large and contiguous to maintain northern spotted owl core areas and home ranges, and must be proximate to foraging habitat. Nesting habitat can also function as roosting, foraging, and dispersal habitat (73 FR 47347). Roosting habitat. Roosting habitat is essential to provide for thermoregulation, shelter, and cover to reduce predation risk while resting or foraging. It differs from nesting habitat in that it need not contain those specific structural features used for nesting (such as trees with cavities, broken tops, and mistletoe platforms), but does contain moderate to high canopy closure (60 to 80 percent); a multi-layered, multi- species canopy; large accumulations of fallen trees and other woody debris on the ground; and open space below the canopy for northern spotted owls to fly. Roosting habitat will also function as foraging and dispersal habitat, but not as nesting habitat due to lack of nesting structures (73 FR 47347). Foraging habitat. Foraging habitat is essential to provide a food supply for survival and reproduction. It contains some roosting habitat attributes but can consist of more open and fragmented forests or, especially in the southern portion of the range where some younger stands may have high prey abundance and structural attributes similar to those of older forests, such as moderate tree density, subcanopy perches at multiple levels, multi-layered vegetation, or residual older trees. Foraging habitat can also function as dispersal habitat (73 FR 47348). Dispersal habitat. Forest types described above that provide one or both of the habitat components described below that are essential to the dispersal of juvenile and non-territorial spotted owls, or that are capable of developing one or both of these components. Dispersal habitat can occur in intervening areas between larger blocks of nesting, foraging, and roosting habitat or within blocks of nesting, roosting, and foraging habitat. Dispersal habitat is essential to maintaining stable populations by supporting transient spotted owls which can fill territorial vacancies when resident spotted owls die or leave their territories, and to providing adequate gene flow across the range of the species (73 FR 47348). The two types of dispersal habitat are:

3
(A) Habitat supporting the transience phase of spotted owl dispersal contains stands with adequate tree size and canopy closure to provide protection from avian predators and minimal foraging opportunities. This may include younger and less diverse forest stands than foraging habitat, such as even-aged, pole-sized stands, but such stands should contain some roosting structures and foraging habitat to allow for temporary resting and feeding during the movement phase. (B) Habitat supporting the colonization phase of spotted owl dispersal is generally equivalent to roosting and foraging habitat described above, although it may be in smaller amounts than that needed to support nesting pairs. The critical habitat designation describes the PCEs essential to support the life history functions of the northern spotted owl in the amount and configuration required for the species’ conservation. Because not all life history functions require all of the PCEs, not all of the critical habitat will contain all of the PCEs. Some units contain all PCEs and support multiple life processes, while some units contain only a portion of the PCEs necessary to support the species’ particular use of that habitat. However, all of the critical habitat units in the designation support at least the first PCE described (forest-type) in conjunction with at least one of the other PCEs described above (73 FR 47348). Conservation Role of Critical Habitat The conservation role of spotted owl critical habitat is to identify those lands that are essential to the recovery of the species that may require special management considerations or protections (73 FR 47344). Generally, the conservation role of spotted owl critical habitat is to support a viable owl population at the rangewide scale by providing a network of functional units within each physiographic province (73 FR 47358). For a wide-ranging species such as the spotted owl, where multiple CHUs are designated, each unit has a provincial and rangewide role in contributing to the conservation of the species. The size and distribution of the CHUs is the based on the “managed owl conservation areas (MOCAs) recommended in the 2008 Final Recovery Plan for the Northern Spotted Owl (USFWS 2008) in the western portion of the species range, and on proposed MOCAs recommended under Option 1 in the Draft Recovery Plan for the Northern Spotted Owl (USFWS 2007) in the eastern portion of the species range (73 FR 47330). The MOCAs comprise a network of both large habitat blocks (capable of supporting 20 or more breeding pairs of owls (MOCA 1s)), and small habitat blocks (capable of supporting up to 19 breeding pairs of owls (MOCA 2s)). The MOCAs (and subsequent CHUs) form a habitat network designed to support stable and well-distributed populations of spotted owls over time and allow for movement of spotted owls across the landscape (USFWS 2008, p. 13). The Federal lands comprising the MOCA network of the final recovery plan include areas of congressionally reserved lands, such as designated wilderness areas; these areas were therefore included in the recovery plan’s assessment that the MOCA network is sufficient to achieve the recovery of the spotted owl. As in the 1992 designation of critical habitat, congressionally-reserved lands such as wilderness areas and national parks are not included within the boundaries of the critical habitat designation. However, the contribution of these congressionally-reserved
4
areas must be considered in any evaluation of the sufficiency of the overall conservation habitat network for the recovery of the spotted owl (73 FR 47328). Current Condition of Critical Habitat Summary of Range-wide Conditions We designated 29 units as critical habitat for the spotted owl on federal lands in Washington, Oregon, and California. These areas encompass over 5.3 million acres. Currently we estimate that approximately 98 percent of these lands are “habitat capable” (i.e., lands that are capable of supporting forest types that spotted owls use). Within the CHUs, many habitat areas are currently fragmented primarily due to past timber harvest, wildfire, disease, and wind-throw. Based on the spotted owl habitat data developed for monitoring the Northwest Forest Plan (Davis and Lint 2005), we estimate that approximately 50 percent of the lands within CHUs currently contain owl habitat (2.6 million acres). Given natural events such as fire, windstorms, and insect damage, not all habitat capable lands in a CHU are likely to be high quality habitat at any one time. However, these lands retain the physical and biological features necessary to allow for the regrowth of the habitat characteristics required by spotted owls and are essential to achieving the area, quality, and configuration of habitat blocks required for recovery of the owl (USFWS 2008, p. 13). Section 7 analyses of activities affecting spotted owl critical habitat consider the effects of proposed actions on the ability of the critical habitat to support a viable spotted owl population at the scale of individual CHUs, the physiographic province, and the rangewide scales (73 FR 47358). Following the revision of critical habitat in August, 2008, the Service has completed section 7 consultations on the removal of approximately 877 acres of suitable spotted owl habitat within critical habitat units in the Oregon Cascades provinces (Table 1). The Service concluded that the effect of this habitat loss is not likely to destroy or adversely modify designated critical habitat.
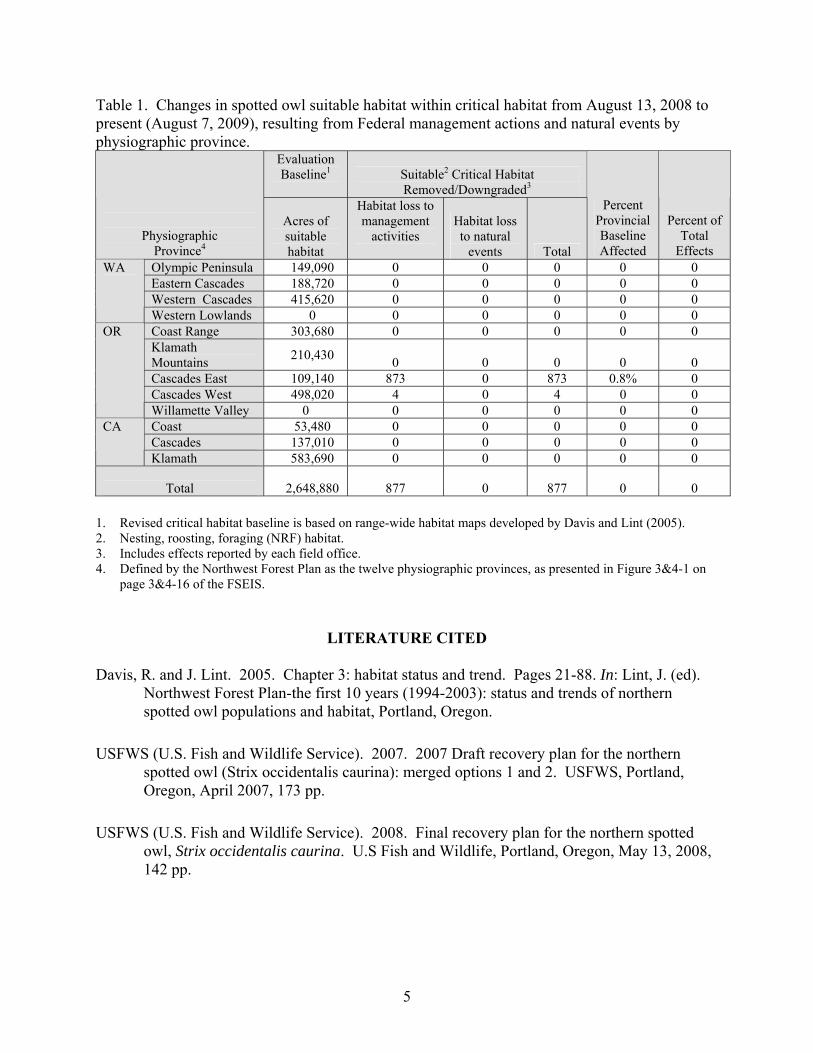
5
Table 1. Changes in spotted owl suitable habitat within critical habitat from August 13, 2008 to present (August 7, 2009), resulting from Federal management actions and natural events by physiographic province.
Evaluation Baseline1
Suitable2 Critical Habitat Removed/Downgraded3
Physiographic
Province4
Acres of suitable habitat
Habitat loss to management
activities
Habitat loss to natural
events Total
Percent Provincial Baseline Affected
Percent of Total
Effects Olympic Peninsula 149,090 0 0 0 0 0 Eastern Cascades 188,720 0 0 0 0 0 Western Cascades 415,620 0 0 0 0 0
WA
Western Lowlands 0 0 0 0 0 0 Coast Range 303,680 0 0 0 0 0 Klamath Mountains 210,430 0 0 0 0 0 Cascades East 109,140 873 0 873 0.8% 0 Cascades West 498,020 4 0 4 0 0
OR
Willamette Valley 0 0 0 0 0 0 Coast 53,480 0 0 0 0 0 Cascades 137,010 0 0 0 0 0
CA
Klamath 583,690 0 0 0 0 0
Total 2,648,880 877 0 877 0 0
1. Revised critical habitat baseline is based on range-wide habitat maps developed by Davis and Lint (2005). 2. Nesting, roosting, foraging (NRF) habitat. 3. Includes effects reported by each field office. 4. Defined by the Northwest Forest Plan as the twelve physiographic provinces, as presented in Figure 3&4-1 on
page 3&4-16 of the FSEIS.
LITERATURE CITED
Davis, R. and J. Lint. 2005. Chapter 3: habitat status and trend. Pages 21-88. In: Lint, J. (ed).
Northwest Forest Plan-the first 10 years (1994-2003): status and trends of northern spotted owl populations and habitat, Portland, Oregon.
USFWS (U.S. Fish and Wildlife Service). 2007. 2007 Draft recovery plan for the northern spotted owl (Strix occidentalis caurina): merged options 1 and 2. USFWS, Portland, Oregon, April 2007, 173 pp.
USFWS (U.S. Fish and Wildlife Service). 2008. Final recovery plan for the northern spotted owl, Strix occidentalis caurina. U.S Fish and Wildlife, Portland, Oregon, May 13, 2008, 142 pp.

70
Appendix 3: Status of the Species: Marbled Murrelet

1
Appendix 3 Status of the Species: Marbled Murrelet
STATUS OF THE SPECIES: Murrelet
Legal Status The murrelet was federally listed as a threatened species in Washington, Oregon, and northern California effective September 28, 1992 (57 FR 45328 [October 1, 1992]). The final rule designating critical habitat for the murrelet (61 FR 26256 [May 24, 1996]) became effective on June 24, 1996. The U.S. Fish and Wildlife Serivce (Service) recently proposed a revision to the 1996 murrelet critical habitat designation (71 FR 44678 [July 31, 2008]). A final rule is expected in 2009. The species’ decline has largely been caused by extensive removal of late-successional and old-growth coastal forests which serve as nesting habitat for murrelets. Additional listing factors included high nest-site predation rates and human-induced mortality in the marine environment from gillnets and oil spills. The Service determined that the California, Oregon, and Washington distinct population segment of the murrelet does not meet the criteria set forth in the Service’s 1996 Distinct Population Segment policy (61 FR 4722 [May 24, 1996]; (Beissinger and Nur 1997 in USFWS 2004). However, the murrelet retains its listing and protected status as a threatened species under the Act until the original 1992 listing decision is revised through formal rule-making procedures, involving public notice and comment. Critical habitat was designated for the murrelet to addresses the objective of stabilizing the population size. To fulfill that objective, the Marbled Murrelet Recovery Plan (USFWS 1997b) (Recovery Plan), focuses on protecting adequate nesting habitat by maintaining and protecting occupied habitat and minimizing the loss of unoccupied but suitable habitat (USFWS 1997b, p. 119). The Recovery Plan identified six Conservation Zones throughout the listed range of the species: Puget Sound (Conservation Zone 1), Western Washington Coast Range (Conservation Zone 2), Oregon Coast Range (Conservation Zone 3), Siskiyou Coast Range (Conservation Zone 4), Mendocino (Conservation Zone 5), and Santa Cruz Mountains (Conservation Zone 6). As explained in the Endangered Species Consultation Handbook (USFWS and NMFS 1998) and clarified for recovery units through Memorandum (USFWS 2006), jeopardy analyses must always consider the effect of proposed actions on the survival and recovery of the listed entity. In the case of the murrelet, the Service’s jeopardy analysis will consider the effect of the action on the long-term viability of the murrelet in its listed range (Washington, Oregon, and northern California), beginning with an analysis of the action’s effect on Conservation Zones 1 and 2 (described below). Conservation Zone 1 Conservation Zone 1 includes all the waters of Puget Sound and most waters of the Strait of Juan de Fuca south of the U.S.-Canadian border and extends inland 50 mi from the Puget Sound, including the north Cascade Mountains and the northern and eastern sections of the Olympic Peninsula. Forest lands in the Puget Trough have been predominately replaced by urban development and the remaining suitable habitat in Zone 1 is typically a considerable distance
2
from the marine environment, lending special importance to nesting habitat close to Puget Sound (USFWS 1997b). Conservation Zone 2 Conservation Zone 2 includes waters within 1.2 mi of the Pacific Ocean shoreline south of the U.S.-Canadian border off Cape Flattery and extends inland to the midpoint of the Olympic Peninsula. In southwest Washington, the Zone extends inland 50 mi from the Pacific Ocean shoreline. Most of the forest lands in the northwestern portion of Zone 2 occur on public (State, county, city, and Federal) lands, while most forest lands in the southwestern portion are privately owned. Extensive timber harvest has occurred throughout Zone 2 in the last century, but the greatest loss of suitable nest habitat is concentrated in the southwest portion of Zone 2 (USFWS 1997b). Thus, murrelet conservation is largely dependent upon Federal lands in northern portion of Zone 2 and non-Federal lands in the southern portion. Life History Murrelets are long-lived seabirds that spend most of their life in the marine environment, but use old-growth forests for nesting. Detailed discussions of the biology and status of the murrelet are presented in the final rule listing the murrelet as threatened (57 FR 45328 [October 1, 1992]), the Recovery Plan, Ecology and Conservation of the Marbled Murrelet (Ralph et al. 1995), the final rule designating murrelet critical habitat (61 FR 26256 [May 24, 1996]), and the Evaluation Report in the 5-Year Status Review of the Marbled Murrelet in Washington, Oregon, and California (McShane et al. 2004). Physical Description The murrelet is taxonomically classified in the family Alcidae (alcids), a family of Pacific seabirds possessing the ability to dive using wing-propulsion. The plumage of this relatively small (9.5 in to 10 in) seabird is identical between males and females, but the plumage of adults changes during the winter and breeding periods providing some distinction between adults and juveniles. Breeding adults have light, mottled brown under-parts below sooty-brown upperparts contrasted with dark bars. Adults in winter plumage have white under-parts extending to below the nape and white scapulars with brown and grey mixed upperparts. The plumage of fledged young is similar to the adult winter plumage (USFWS 1997b). Distribution The range of the murrelet, defined by breeding and wintering areas, extends from the northern terminus of Bristol Bay, Alaska, to the southern terminus of Monterey Bay in central California. The listed portion of the species’ range extends from the Canadian border south to central California. Murrelet abundance and distribution has been significantly reduced in portions of the listed range, and the species has been extirpated from some locations. The areas of greatest concern due to small numbers and fragmented distribution include portions of central California, northwestern Oregon, and southwestern Washington (USFWS 1997b).

3
Reproduction Murrelet breeding is asynchronous and spread over a prolonged season. In Washington, the murrelet breeding season occurs between April 1 and September 15 (Figure 1). Egg laying and incubation occur from late April to early August and chick rearing occurs between late May and late August, with all chicks fledging by early September (Hamer et al. 2003). Murrelets lay a single-egg clutch (Nelson 1997), which may be replaced if egg failure occurs early (Hebert et al. 2003; McFarlane-Tranquilla et al. 2003). However, there is no evidence a second egg is laid after successfully fledging a first chick. Adults typically incubate for a 24-hour period, then exchange duties with their mate at dawn. Hatchlings appear to be brooded by an adult for one to two days and are then left alone at the nest for the remainder of the rearing period, except during feedings. Both parents feed the chick, which receives one to eight meals per day (Nelson 1997). Most meals are delivered early in the morning while about a third of the food deliveries occur at dusk and intermittently throughout the day (Nelson and Hamer 1995b). Chicks fledge 27 to 40 days after hatching. The initial flight of a fledgling appears to occur at dusk and parental care is thought to cease after fledging (Nelson 1997).
0% 10% 20% 30% 40% 50% 60% 70% 80% 90% 100%
Jan
Mar
May
Jul
Sep
Nov
Non-nesting Murrelets in the Marine Environment Nesting Murrelets in the Marine EnvironmentNesting Murrelets in the Terrestrial Environment Murrelets in the Marine Environment (non-nesting period)
Figure 1. The seasonal changes in the relative proportion of breeding and non-breeding murrelets in the marine and terrestrial environments5 within Washington State (Conservation Zones 1 and 2)
5 Demographic estimates were derived from Peery et al. (2004) and nesting chronology was derived from Hamer and Nelson (1995) and Bradley et al. (2004) where April 1 is the beginning of the nesting season, September 15 is the end of the nesting season, and August 6 is the beginning of the late breeding season when an estimated 70 percent of the murrelet chicks have fledged.

4
Vocalization Murrelets are known to vocalize between 480 Hertz and 4.9 kilohertz and have at least 5 distinct call types (Suzanne Sanborn, pers. comm. 2005). Murrelets tend to be more vocal at sea compared to other alcids (Nelson 1997). Individuals of a pair vocalize after surfacing apart from each other, after a disturbance, and during attempts to reunite after being separated (Strachan et al. 1995). MURRELETS IN THE MARINE ENVIRONMENT Murrelets are ususally found within 5 miles (8 kilometers) from shore, and in water less than 60 meters deep (Ainley et al. 1995; Burger 1995; Strachan et al. 1995; Nelson 1997; Day and Nigro 2000; Raphael et al. 2007). In general, birds occur closer to shore in exposed coastal areas and farther offshore in protected coastal areas (Nelson 1997). Courtship, foraging, loafing, molting, and preening occur in marine waters. Beginning in early spring, courtship continues throughout summer with some observations even noted during the winter period (Speckman 1996; Nelson 1997). Observations of courtship occurring in the winter suggest that pair bonds are maintained throughout the year (Speckman 1996; Nelson 1997). Courtship involves bill posturing, swimming together, synchronous diving, vocalizations, and chasing in flights just above the surface of the water. Copulation occurs both inland (in the trees) and at sea (Nelson 1997). Loafing When murrelets are not foraging or attending a nest, they loaf on the water, which includes resting, preening, and other activities during which they appear to drift with the current, or move without direction (Strachan et al. 1995). Strachan et al. (1995) noted that vocalizations occurred during loafing periods, especially during the mid-morning and late afternoon. Molting Murrelets go through two molts each year. The timing of molts varies temporally throughout their range and are likely influenced by prey availability, stress, and reproductive success (Nelson 1997). Adult (after hatch-year) murrelets have two primary plumage types: alternate (breeding) plumage and basic (winter) plumage. The pre-alternate molt occurs from late February to mid-May. This is an incomplete molt during which the birds lose their body feathers but retain their ability to fly (Carter and Stein 1995; Nelson 1997). A complete pre-basic molt occurs from mid-July through December (Carter and Stein 1995; Nelson 1997). During the pre-basic molt, murrelets lose all flight feathers somewhat synchronously and are flightless for up to two months (Nelson 1997). In Washington, there is some indication that the pre-basic molt occurs from mid-July through the end of August (Chris Thompson, pers. comm. 2003). Flocking Strachan et al. (1995) defines a flock as three or more birds in close proximity which maintain that formation when moving. Various observers throughout the range of the murrelet report flocks of highly variable sizes. In the southern portion of the murrelet’s range (California,

5
Oregon, and Washington), flocks rarely contain more than 10 birds. Larger flocks usually occur during the later part of the breeding season and may contain juvenile and subadult birds (Strachan et al. 1995). Aggregations of foraging murrelets are probably related to concentrations of prey. In Washington, murrelets are not generally found in interspecific feeding flocks (Strachan et al. 1995). Strong et al. (in Strachan et al. 1995) observed that murrelets avoid large feeding flocks of other species and presumed that the small size of murrelets may make them vulnerable to kleptoparasitism or predation in mixed species flocks. Strachan et al. (1995) point out that if murrelets are foraging cooperatively, the confusion of a large flock of birds could reduce foraging efficiency. Foraging Behavior Murrelets are wing-propelled pursuit divers that forage both during the day and at night (Carter and Sealy 1986; Gaston and Jones 1998; Henkel et al. 2003; Kuletz 2005). Murrelets typically forage in pairs, but have been observed to forage alone or in groups of three or more (Carter and Sealy 1990; Strachan et al. 1995; Speckman et al. 2003). Strachan et al. (1995) believe pairing enhances foraging success through cooperative foraging techniques. For example, pairs consistently dive together during foraging and often synchronize their dives by swimming towards each other before diving (Carter and Sealy 1990) and resurfacing together on most dives. Strachan et al. (1995) speculate pairs may keep in visual contact underwater. Paired foraging is common throughout the year, even during the incubation period, suggesting that breeding murrelets may temporarily pair up with other foraging individuals (non-mates) (Strachan et al. 1995; Speckman et al. 2003). Murrelets can make substantial changes in foraging sites within the breeding season, but many birds routinely forage in the same general areas and at productive foraging sites, as evidenced by repeated use over a period of time throughout the breeding season (Carter and Sealy 1990; Whitworth et al. 2000; Becker et al. 2001; Hull et al. 2001; Mason et al. 2002; Piatt et al. 2007). Murrelets are also known to forage in freshwater lakes (Nelson 1997). Activity patterns and foraging locations are influenced by biological and physical processes that concentrate prey, such as weather, climate, time of day, season, light intensity, up-wellings, tidal rips, narrow passages between islands, shallow banks, and kelp (Nereocystis spp.) beds (Ainley et al. 1995; Strong et al. 1995; Burger 1995; Speckman 1996; Nelson 1997). Juveniles are generally found closer to shore than adults (Beissinger 1995) and forage without the assistance of adults (Strachan et al. 1995). Kuletz and Piatt (1999) found that in Alaska, juvenile murrelets congregated in kelp beds. Kelp beds are often with productive waters and may provide protection from avian predators (Kuletz and Piatt 1999). McAllister (in litt. in Strachan et al. 1995) found that juveniles were more common within 328 ft of shorelines, particularly, where bull kelp was present. Murrelets usually feed in shallow, near-shore water less than 30m (98 ft) deep (Huff et al. 2006), but are thought to be able to dive up to depths of 47 m (157 ft) (Mathews and Burger 1998). Variation in depth and dive patterns may be related to the effort needed to capture prey. Thick-

6
billed murres (Uria lomvia) and several penguin species exhibit bi-modal foraging behavior in that their dive depths mimic the depth of their prey, which undergo daily vertical migrations in the water column (Croll et al. 1992; Butler and Jones 1997). Jodice and Collopy’s (1999) data suggest murrelets follow this same pattern as they forage for fish that occur throughout the water column but undergo daily vertical migrations (to shallower depths at night and back to deeper depths during the day). Murrelets observed foraging in deeper water likely do so when upwelling, tidal rips, and daily activity patterns concentrate the prey near the surface (Strachan et al. 1995). The duration of dives appears to depend upon age (adults vs. juveniles), water depth, visibility, and depth and availability of prey. Murrelet dive duration ranges from 8 seconds to 115 seconds, although most dives last between 25 and 45 seconds (Thorensen 1989; Jodice and Collopy 1999; Watanuki and Burger 1999; Day and Nigro 2000). Adults and subadults often move away from breeding areas prior to molting and must select areas with predictable prey resources during the flightless period (Carter and Stein 1995; Nelson 1997). During the non-breeding season, murrelets disperse and can be found farther from shore (Strachan et al. 1995). Little is known about marine-habitat preference outside of the breeding season, but use during the early spring and fall is thought to be similar to that preferred during the breeding season (Nelson 1997). During the winter there may be a general shift from exposed outer coasts into more protected waters (Nelson 1997), for example many murrelets breeding on the exposed outer coast of Vancouver Island appear to congregate in the more sheltered waters within the Puget Sound and the Strait of Georgia in fall and winter (Burger 1995). However, in many areas, murrelets remain associated with the inland nesting habitat during the winter months (Carter and Erickson 1992) and throughout the listed range, murrelets do not appear to disperse long distances, indicating they are year-round residents (McShane et al. 2004). Prey Species Throughout their range, murrelets are opportunistic feeders and utilize prey of diverse sizes and species. They feed primarily on fish and invertebrates in marine waters although they have also been detected on rivers and inland lakes (Carter and Sealy 1986); 57 FR 45328 [October 1, 1992]). In general, small schooling fish and large pelagic crustaceans are the main prey items. Pacific sand lance (Ammodytes hexapterus), northern anchovy (Engraulis mordax), immature Pacific herring (Clupea harengus), capelin (Mallotus villosus), Pacific sardine (Sardinops sagax), juvenile rockfishes (Sebastas spp.) and surf smelt (Osmeridae) are the most common fish species taken. Squid (Loligo spp.), euphausiids, mysid shrimp, and large pelagic amphipods are the main invertebrate prey. Murrelets are able to shift their diet throughout the year and over years in response to prey availability (Becker et al. 2007). However, long-term adjustment to less energetically-rich prey resources (such as invertebrates) appears to be partly responsible for poor marbled murrelet reproduction in California (Becker and Beissinger 2006). Breeding adults exercise more specific foraging strategies when feeding chicks, usually carrying a single, relatively large (relative to body size) energy-rich fish to their chicks (Burkett 1995; Nelson 1997), primarily around dawn and dusk (Nelson 1997; Kuletz 2005). Freshwater prey appears to be important to some individuals during several weeks in summer and may facilitate

7
more frequent chick feedings, especially for those that nest far inland (Hobson 1990). Becker et al. (Becker et al. 2007) found murrelet reproductive success in California was strongly correlated with the abundance of mid-trophic level prey (e.g. sand lance, juvenile rockfish) during the breeding and postbreeding seasons. Prey types are not equal in the energy they provide; for example parents delivering fish other than age-1 herring may have to increase deliveries by to up 4.2 times to deliver the same energy value (Kuletz 2005). Therefore, nesting murrelets that are returning to their nest at least once per day must balance the energetic costs of foraging trips with the benefits for themselves and their young. This may result in marbled murrelets preferring to forage in marine areas in close proximity to their nesting habitat. However, if adequate or appropriate foraging resources (i.e., “enough” prey, and/or prey with the optimum nutritional value for themselves or their young) are unavailable in close proximity to their nesting areas, marbled murrelets may be forced to forage at greater distances or to abandon their nests (Huff et al. 2006, p. 20). As a result, the distribution and abundance of prey suitable for feeding chicks may greatly influence the overall foraging behavior and location(s) during the nesting season, may affect reproductive success (Becker et al. 2007), and may significantly affect the energy demand on adults by influencing both the foraging time and number of trips inland required to feed nestlings (Kuletz 2005). Predators At-sea predators include bald eagles (Haliaeetus leucocephalus), peregrine falcons (Falco peregrinus), western gulls (Larus occidentalis), and northern fur seals (Callorhinus ursinus) (McShane et al. 2004). California sea lions (Zalophus californianus), northern sea lions (Eumetopias jubatus), and large fish may occasionally prey on murrelets (Burger 2002). Murrelets in the Terrestrial Environment Murrelets are dependent upon old-growth forests, or forests with an older tree component, for nesting habitat (Ralph et al. 1995; Hamer and Nelson 1995; McShane et al. 2004). Sites occupied by murrelets tend to have a higher proportion of mature forest age-classes than do unoccupied sites (Raphael et al. 1995). Specifically, murrelets prefer high and broad platforms for landing and take-off, and surfaces which will support a nest cup (Hamer and Nelson 1995). The physical condition of a tree appears to be the important factor in determining the tree’s suitability for nesting (Ralph et al. 1995); therefore, presence of old-growth in an area does not assure the stand contains sufficient structures (i.e. platforms) for nesting. In Washington, murrelet nests have been found in conifers, specifically, western hemlock (Tsuga heterophylla), Sitka spruce (Picea sitchensis), Douglas-fir (Pseudotsuga menziesii), and western red cedar (Thuja plicata) (Hamer and Nelson 1995; Hamer and Meekins 1999). Nests have been found in trees as small as 2.6 ft in diameter at breast height on limbs at least 65 ft from the ground and 0.36 ft in diameter (Hamer and Meekins 1999). Murrelet populations may be limited by the availability of suitable nesting habitat. Although no data are available, Ralph et al. (1995) speculate the suitable nesting habitat presently available in Washington, Oregon, and California may be at or near carrying capacity based on: 1) at-sea concentrations of murrelets near suitable nesting habitat during the breeding season, 2) winter

8
visitations to nesting sites, and 3) the limitation of nest sites available in areas with large amounts of habitat removal. Murrelets have been observed visiting nesting habitat during non-breeding periods in Washington, Oregon, and California (Naslund 1993; Nelson 1997) which may indicate adults are defending nesting sites and/or stands (Ralph et al. 1995). Other studies provide further insight to the habitat associations of breeding murrelets, concluding that breeding murrelets displaced by the loss of nesting habitat do not pack in higher densities into remaining habitat (McShane et al. 2004). Thus, murrelets may currently be occupying nesting habitat at or near carrying capacity in highly fragmented areas and/or in areas where a significant portion of the historic nesting habitat has been removed (Ralph et al. 1995). Unoccupied stands containing nesting structures are important to the population for displaced breeders or first-time breeding adults. Even if nesting habitat is at carrying capacity, there will be years when currently occupied stands become unoccupied as a result of temporary disappearance of inhabitants due to death or to irregular breeding (Ralph et al. 1995). Therefore, unoccupied stands will not necessarily indicate that habitat is not limiting or that these stands are not murrelet habitat (Ralph et al. 1995) and important to the species persistence. Radar and audio-visual studies have shown murrelet habitat use is positively associated with the presence and abundance of mature and old-growth forests, large core areas of old-growth, low edge and fragmentation, proximity to the marine environment, total watershed area, and increasing forest age and height (McShane et al. 2004). In California and southern Oregon, areas with abundant numbers of murrelets were farther from roads, occurred more often in parks protected from logging, and were less likely to occupy old-growth habitat if it was isolated (more than 3 miles or 5 km) from other nesting murrelets (Meyer et al. 2002). Meyer et al. (2002) also found at least a few years passed before birds abandoned fragmented forests. Murrelets do not form dense colonies which is atypical of most seabirds. Limited evidence suggests they may form loose colonies or clusters of nests in some cases (Ralph et al. 1995). The reliance of murrelets on cryptic coloration to avoid detection suggests they utilize a wide spacing of nests in order to prevent predators from forming a search image (Ralph et al. 1995). However, active nests have been seen within 328 ft (100 m) of one another in the North Cascades in Washington and within 98 ft (30 m) in Oregon (Kim Nelson, Oregon State University, pers. comm. 2005). Estimates of murrelet nest densities vary depending upon the method of data collection. For example, nest densities estimated using radar range from 0.007 to 0.104 mean nests per acre (0.003 to 0.042 mean nests per ha), while nest densities estimated from tree climbing efforts range from 0.27 to 3.51 mean nests per acre (0.11 to 1.42 mean nests per ha) (Nelson 2005). There is little data available regarding murrelet nest site fidelity because of the difficulty in locating nest sites and observing banded birds attending nests. However, murrelets have been detected in the same nesting stands for many years (at least 20 years in California and 15 years in Washington), suggesting murrelets have a high fidelity to nesting areas, most likely at the watershed scale (Nelson 1997). Use of the same nest platform in successive years as well as multiple nests in the same tree have been documented, although it is not clear whether the

9
repeated use involved the same birds (Nelson and Peck 1995; Divoky and Horton 1995; Nelson 1997; Manley 2000; Hebert et al. 2003). The limited observed fidelity to the same nest depression in consecutive years appears to be lower than for other alcids, but this may be an adaptive behavior in response to high predation rates (Divoky and Horton 1995). Researchers have suggested fidelity to specific or adjacent nesting platforms may be more common in areas where predation is limited or the number of suitable nest sites are fewer because large, old-growth trees are rare (Nelson and Peck 1995; Singer et al. 1995; Manley 1999). Ralph et al. (1995) speculated that the fidelity to nest sites or stands by breeding murrelets may be influenced by the nesting success of previous rearing attempts. Although murrelet nesting behavior in response to failed nest attempts is unknown, nest failures could lead to prospecting for new nest sites or mates. Other alcids have shown an increased likelihood to relocate to a new nest in response to breeding failure (Divoky and Horton 1995). However, murrelets likely remain in the same watershed over time as long as stands are not significantly modified (Ralph et al. 1995). It is unknown whether juveniles disperse from natal breeding habitat (natal dispersal) or return to their natal breeding habitat after reaching breeding age (natal philopatry). Natal dispersal distance can be expected to be as high or higher than other alcids given 1) the reduced extent of the breeding range, 2) the overlap between the wintering and breeding areas, 3) the distance individuals are known to move from breeding areas in the winter, 4) adult attendance of nesting areas during the non-breeding season where, in theory, knowledge of suitable nesting habitat is passed onto prospecting non-breeders, and 5) the 3-year to 5-year duration required for the onset of breeding age allowing non-breeding murrelets to prospect nesting and forage habitat for several years prior to reaching breeding age (Divoky and Horton 1995). Conversely, Swartzman et al. (1997 in McShane et al. 2004)) suggested juvenile dispersal is likely to be low, as it is for other alcid species. Nevertheless, the presence of unoccupied suitable nesting habitat on the landscape may be important for first-time nesters if they disperse away from their natal breeding habitat. Murrelets generally select nests within 37 mi (60 kilometers (km) of marine waters (Miller and Ralph 1995). However, in Washington, occupied habitat has been documented 52 mi (84 km) from the coast and murrelets have been detected up to 70 mi (113 km) from the coast in the southern Cascade Mountains (Evans Mack et al. 2003). When tending active nests during the breeding season (and much of the non-breeding season in southern parts of the range), breeding pairs forage within commuting distance of the nest site. Daily movements between nest sites and foraging areas for breeding murrelets averaged 10 mi in Prince William Sound, Alaska (McShane et al. 2004), 24 mi in Desolation Sound, British Columbia, Canada (Hull et al. 2001), and 48 mi in southeast Alaska. In California, Hebert and Golightly (2003) found the mean extent of north-south distance traveled by breeding adults to be about 46 mi. Murrelet nests have been located at a variety of elevations from sea level to 5,020 ft (Burger 2002). However, most nests have been found below 3,500 ft. In Conservation Zone 1, murrelets have exhibited “occupied” behaviors up to 4,400 ft elevation and have been detected in stands up

10
to 4,900 ft in the north Cascade Mountains (Peter McBride, WDNR, in litt., 2005). On the Olympic Peninsula, survey efforts for nesting murrelets have encountered occupied stands up to 4,000 ft within Conservation Zone 1 and up to 3,500 ft within Conservation Zone 2. Surveys for murrelet nesting at higher elevations on the Olympic Peninsula have not been conducted. However, recent radio-telemetry work detected a murrelet nest at 3,600 ft elevation on the Olympic Peninsula in Conservation Zone 1 (Martin Raphael, USFWS, pers. comm. 2005). Population Status in the Coterminous United States Population Abundance Research on murrelet populations in the early 1990s estimated murrelet abundance in Washington, Oregon, and California at 18,550 to 32,000 (Ralph et al. 1995). However, consistent population survey protocols were not established for murrelets in the coterminous United States until the late 1990s following the development of the marine component of the Environmental Monitoring (EM) Program for the NWFP (Bentivoglio et al. 2002). As a consequence, sampling procedures have differed and thus the survey data collected prior to the EM Program is unsuitable for estimating population trends for the murrelet (McShane et al. 2004). The development of the EM Program unified the various at-sea monitoring efforts within the 5 Conservation Zones encompassed by the NWFP. The highest total population estimate for this area (20,500 +/- 4,600 birds at the 95 percent confidence interval) was in 2004 and the lowest total population estimate (17,400 +/- 4,600 birds at the 95 percent confidence interval) was in 2007 (Gary Falxa, in litt., 2008). The most recent population estimate for Conservation Zone 6 is 400 (+/- 140 birds at the 95 percent confidence interval) (Peery et al. 2008). Population Trend Estimated population trends within each Conservation Zone or for the entire coterminous population are not yet available from the marine survey data. Trend information will eventually be provided through the analysis of marine survey data from the EM Program (Bentivoglio et al. 2002) and from survey data in Conservation Zone 6 once a sufficient number of survey years have been completed. Depending on the desired minimum power (80 or 95 percent), at least 8 to 10 years of successive surveys are required for an overall population estimate and thus detection of an annual decrease, while 7 to 16 years are required for Conservation Zones 1 and 2 (Huff et al. 2003). In the interim, demographic modeling has aided attempts to analyze and predict population trends and extinction probabilities of murrelets. Incorporating important population parameters and species distribution data (Beissinger 1995; Beissinger and Nur 1997 in USFWS 1997b; Cam et al. 2003; McShane et al. 2004), demographic models can provide useful insights into potential population responses from the exposure to environmental pressures and perturbations. However, weak assumptions or inaccurate estimates of population parameters such as survivorship rates,

11
breeding success, and juvenile-to-adult ratios (juvenile ratios), can limit the use of models. Thus, a cautious approach is warranted when forecasting long-term population trends using demographic models. Most of the published demographic models used to estimate murrelet population trends employ Leslie Matrix modeling (McShane et al. 2004). Two other more complex, unpublished models (Akcakaya 1997 and Swartzman et al. 1997 in McShane et al. 2004) evaluate the effect of nest habitat loss on murrelets in Conservation Zone 4 (McShane et al. 2004). McShane et al. (2004) developed a stochastic Leslie Matrix model (termed “Zone Model”) to project population trends in each murrelet Conservation Zone. The Zone Model was developed to integrate available demographic information for a comparative depiction of current expectations of future population trends and probability of extinction in each Conservation Zone (McShane et al. 2004). Table 1 lists rangewide murrelet demographic parameter values from four studies all using Leslie Matrix models. Table 1. Rangewide murrelet demographic parameter values based on four studies all using Leslie Matrix models
Demographic Parameter Beissinger 1995
Beissinger and Nur 1997*
Beissinger and Peery in
litt. 2003
McShane et al. 2004
Juvenile Ratios 0.10367 0.124 or 0.131 0.089 0.02 - 0.09 Annual Fecundity 0.11848 0.124 or 0.131 0.06-0.12 (See nest success) Nest Success 0.16-0.43 0.38 - 0.54 Maturation 3 3 3 2 - 5 Estimated Adult Survivorship 85 % – 90% 85 % – 88 % 82 % - 90 % 83 % – 92 %
*in (USFWS 1997b) Regardless of model preference, the overall results of modeling efforts are in agreement, indicating murrelet abundance is declining (McShane et al. 2004, p. 6-27). The rates of decline are highly sensitive to the assumed adult survival rate used for calculation (Steven R. Beissinger and M. Z. Peery in litt., 2003). The most recent modeling effort using the “Zone Model” (McShane et al. 2004) suggests the murrelet zonal sub-populations are declining at a rate of 3.0 to 6.2 percent per year. Estimates of breeding success are best determined from nest site data, but difficulties in finding nests has led to the use of other methods, such as juvenile ratios and radio-telemetry estimations, each of which have biases. The nest success data presented in Murrelet Table 1 under McShane et al. (2004) was derived primarily from radio telemetry studies; however the nests sampled in these studies were not representative of large areas and specifically did not include Washington or Oregon. In general, telemetry estimates are preferred over juvenile ratios for estimating breeding success due to fewer biases (McShane et al. 2004), but telemetry data are not currently available for Washington or Oregon. Therefore, it is reasonable to expect that juvenile ratios derived from at-sea survey efforts best represent murrelet reproductive success in Washington, Oregon, and California.
12
Beissinger and Peery (Beissinger and Peery, in litt., 2003) performed a comparative analysis using data from 24 bird species to predict the juvenile ratios for murrelets of 0.27 (confidence intervals ranged from 0.15 to 0.65). Demographic models suggest murrelet population stability requires a minimum of 0.18 to 0.28 chicks per pair per year (Beissinger and Nur 1997 in USFWS 1997b). The lower confidence intervals for both the predicted juvenile ratio (0.15) and the stable population juvenile ratio (0.18) are greater than the juvenile ratios observed for any of the Conservation Zones (0.02 to 0.09 chicks per pair) (Beissinger and Nur 1997 in USFWS 1997b; Beissinger and Peery, in litt., 2003). Therefore, the juvenile ratios observed in the Conservation Zones are lower than predicted and are too low to obtain a stable population in any Conservation Zone. This indicates murrelet populations are declining in all Conservation Zones and will continue to decline until reproductive success improves. Demographic modeling, the observed juvenile ratios, and adult survivorship rates suggests that the number of murrelets in Washington, Oregon, and California are too low to sustain a murrelet population. The rate of decline for murrelets throughout the listed range is estimated to be between 2.0 to 15.8 percent (Beissinger and Nur 1997 in USFWS 1997b; McShane et al. 2004). Murrelets in Washington (Conservation Zones 1 and 2) Population estimates Historically, murrelets in Conservation Zones 1 and 2 were “common” (Rathbun 1915 and Miller et al. 1935 in USFWS 1997b), “abundant” (Edson 1908 and Rhoades 1893 in USFWS 1997b), or “numerous” (Miller et al. 1935 in McShane et al. 2004). Conservation Zone 1, encompassing the Puget Sound in northwest Washington, contains one of the larger murrelet populations in the species’ listed range, and supports an estimated 41 percent of the murrelets in the coterminous United States (Huff et al. 2003). The 2007 population estimate (with 95 percent confidence intervals) for Conservation Zone 1 is 7,000 (4,100 – 10,400) and Conservation Zone 2 is 2,500 (1,300 – 3,800) (Falxa, in litt., 2008). In Conservation Zone 2, a higher density of murrelets occurs in the northern portion of the Zone (Huff et al. 2003) where the majority of available nesting habitat occurs. In Conservation Zone 1, higher densities of murrelets occur in the Straits of Juan de Fuca, the San Juan Islands, and the Hood Canal (Huff et al. 2003), which are in proximity to nesting habitat on the Olympic Peninsula and the North Cascade Mountains. Although population numbers in Conservation Zones 1 and 2 are likely declining, the precise rate of decline is unknown. The juvenile ratio derived from at-sea survey efforts in Conservation Zone 1 is 0.09. The juvenile ratios was not collected in Conservation Zone 2; however, the juvenile ratio for Conservation Zone 3 is 0.08. Therefore, it is reasonable to infer that the juvenile ratio for Conservation Zone 2 is likely between 0.08 and 0.09. These low juvenile ratios infer there is insufficient juvenile recruitment to sustain a murrelet population in Conservation Zones 1 and 2. Beissinger and Peery (Beissinger and Peery, in litt., 2003) estimated the rate of decline for Conservation Zone 1 to be between 2.0 to 12.6 percent and between 2.8 to 13.4 percent in Conservation Zone 3. It is likely that the rate of decline in Conservation Zone 2 is similar to that of Conservation Zones 1 and 3.

13
Juvenile ratios in Washington may be skewed by murrelets coming and going to British Columbia. At-sea surveys are timed to occur when the least number of murrelets from British Columbia are expected to be present. However, recent radio-telemetry information indicates 1) murrelets nesting in British Columbia forage in Washington waters during the breeding season (Bloxton and Raphael 2008) and could be counted during at-sea surveys; and 2) adult murrelets foraging in Washington during the early breeding season moved to British Columbia in mid-June and mid-July (Bloxton and Raphael 2008) and would not have been counted during the at-sea surveys. The movements of juvenile murrelets in Washington and southern British Columbia are unclear. Therefore, until further information is obtained regarding murrelet migration between British Columbia and Washington, we will continue to rely on the at-sea derived juvenile ratios to evaluate the population status in Conservation Zones 1 and 2. Habitat Abundance Estimates of the amount of available suitable nesting habitat vary as much as the methods used for estimating murrelet habitat. McShane et al. (2004) estimates murrelet habitat in Washington State at 1,022,695 acres, representing approximately 48 percent of the estimated 2,223,048 acres remaining suitable habitat in the listed range. McShane et al. (2004) caution about making direct comparisons between current and past estimates due to the evolving definition of suitable habitat and methods used to quantify habitat. As part of the ongoing pursuit to improve habitat estimates, information was collected and analyzed by the Service in 2005 resulting in an estimated 751,831 acres in Conservation Zone 1 and 585,821 acres in Conservation Zone 2 (Table 2). Table 2. Estimated acres of suitable nesting habitat for the murrelet managed by the Federal and non-Federal land managers in Conservation Zones 1 and 2
Estimated acres of suitable murrelet habitat by land management category * Conservation Zone
Federal State Private* Tribal Total Puget Sound (Zone 1) 650,937 98,036 2,338 520 751,831 Western Washington Coast Range (Zone 2) 485,574 82,349 9,184 8,714 585,821
Total 1,136,511 180,385 11,522 9,234 1,337,652 *Estimated acres of private land represents occupied habitat. Additional suitable nesting habitat considered unoccupied by nesting murrelets is not included in this estimate.
Estimated acreages of suitable habitat on Federal lands in Table 2 are based on modeling and aerial photo interpretation and likely overestimate the actual acres of suitable murrelet habitat because 1) most acreages are based on models predicting spotted owl nesting habitat which include forested lands that do not have structures suitable for murrelet nesting, and 2) neither modeling or aerial photo interpretation can distinguish microhabitat features, such as nesting platforms or the presence of moss, that are necessary for murrelet nesting. The amount of high quality murrelet nesting habitat available in Washington, defined by the Service as large, old, contiguously forested areas not subject to human influences (e.g., timber harvest or urbanization) is expected to be a small subset of the estimated acreages in Table 2. Murrelets nesting in high-quality nesting habitat are assumed to have a higher nesting success rate than murrelets nesting in fragmented habitat near humans.
14
Other Recent Assessments of Murrelet Habitat in Washington Two recent assessments of murrelet potential nesting habitat were developed for monitoring the Northwest Forest Plan (Raphael et al. 2006). This study provides a provincial-scale analysis of murrelet habitat derived from vegetation base maps, and includes estimates of habitat on State and private lands in Washington for the period of 1994 to 1996. Using vegetation data derived from satellite imagery, Raphael et al. (2006) developed two different approaches to model habitat suitability. The first model, or the Expert Judgment Model, is based on the judgment of an expert panel that used existing forest structure classification criteria (e.g., percent conifer cover, canopy structure, quadratic mean diameter, forest patch size) to classify forests into four classes of habitat suitability, with Class 1 indicating the least suitable habitat and Class 4 indicating the most highly suitable habitat. Raphael et al. (2006) found that across the murrelet range, most habitat-capable land (52 percent) is classified as Class 1 (lowest suitability) habitat and 18 percent is classified as Class 4 (highest suitability) habitat. In Washington, they found that there were approximately 954,200 acres of Class 4 habitat in between 1994 and 1996 (Table 3). However, only 60 percent of known nest sites in their study area were located in Class 4 habitat. The second habitat model developed by Raphael et al. (2006) used the Biomapper Ecological Niche-Factor Analysis model developed by Hirzel et al. (2002). The resulting murrelet habitat suitability maps are based on both the physical and vegetative attributes adjacent to known murrelet occupied polygons or nest locations for each Northwest Forest Plan province. The resulting raster maps are a grid of 269 ft2-cells (25 m2-cells) (0.15 acres per pixel). Each cell in the raster is assigned a value of 0 to 100. Values closer to 100 represent areas that match the murrelet nesting locations while values closer to 0 are likely unsuitable for nesting (Raphael et al. 2006). These maps do not provide absolute habitat estimates, but rather a range of habitat suitability values, which can be interpreted in various ways. Raphael et al. (2006) noted that the results from the Ecological Niche Factor Analysis (ENFA) are not easily compared to results from the Expert Judgment Model because it was not clear what threshold from the habitat suitability ranking to use. Raphael et al. (2006) elected to display habitat suitability scores greater than 60 (HS >60) as a “generous” portrayal of potential nesting habitat and a threshold greater than 80 (HS >80) as a more conservative estimate. In Washington, there were over 2.1 million acres of HS >60 habitat, but only 440,700 acres of HS >80 habitat (Table 3). It is important to note that HS >60 habitat map captures 82 percent of the occupied nests sites in Washington, whereas the HS >80 habitat map only captures 36 percent of the occupied nests in Washington.

15
Table 3. Comparison of different habitat modeling results for the Washington nearshore zone (0 to 40 mi inland or Northwest Forest Plan Murrelet Zone 1)
Murrelet Habitat Model
Habitat Acres on Federal
Reserves (LSRs,
Natl.Parks)
Habitat Acres on Federal,
Non-Reserves (USFS Matrix)
Total Habitat Acres on Federal Lands
Total Habitat Acres on
Non-Federal Lands (City,
State, Private, Tribal)
Total Habitat Acres - All Ownerships
Percent of Total Habitat
Acres on Non-Federal
Lands
Percent of Known
Murrelet Nest Sites in Study Area
Occurring in this Habitat
Classification
ENFA* HS >80 284,300 18,600 302,900 137,800 440,700 31% 36% EJM*
Class 4 659,200 40,700 699,900 254,300 954,200 11% 60% EJM Class 3 and Class
4 770,600 54,700 825,300 535,200 1,360,500 16% 65% ENFA HS >60 927,000 85,300 1,012,300 1,147,100 2,159,400 53% 82%
*ENFA = Ecological Niche Facto Analysis. EJM = Expert Judgment Model. Results were summarized directly from Tables 4 and 5 and Tables 9 and 10 in Raphael et al (2005). All habitat estimates represent 1994-1996 values.
Because the HS >60 model performed best for capturing known murrelet nest sites, Raphael et al. (2006) suggest that the ENFA HS >60 model yields a reasonable estimate of potential murrelet nesting habitat. However, we found that large areas in southwest Washington identified in the HS >60 model likely overestimates the actual suitable habitat in this landscape due to a known lack of old-forest in this landscape. Despite the uncertainties associated with interpreting the various map data developed by Raphael et al. (2006), it is apparent that there is a significant portion of suitable habitat acres located on non-Federal lands in Washington, suggesting that non-Federal lands may play a greater role in the conservation needs of the species than has previously been considered. Using the most conservative criteria developed by Raphael et al. (2006) the amount of high-quality murrelet nesting habitat on non-Federal lands in Washington varies from 11 percent to as high as 31 percent (Table 3). Raphael et al. (2006) note that the spatial accuracy of the map data are limited and that the habitat maps are best used for provincial-scale analysis. Due to potential errors in vegetation mapping and other potential errors, these maps are not appropriate for fine-scale project mapping. Conservation Zone 1 The majority of suitable murrelet habitat in Conservation Zone (Zone) 1 occurs in northwest Washington and is found on Forest Service and National Park Service lands, and to a lesser extent on State lands. The majority of the historic habitat along the eastern and southern shores of the Puget Sound has been replaced by urban development resulting in the remaining suitable habitat further inland from the marine environment (USFWS 1997b).
16
Conservation Zone 2 Murrelet nesting habitat north of Gray’s Harbor in Zone 2 occurs largely on State, Forest Service, National Park Service, and Tribal lands, and to a lesser extent, on private lands. Alternatively, the majority of habitat in the southern portion of Zone 2 occurs primarily on State lands, with a small amount on private lands. Threats Murrelets remain subject to a variety of anthropogenic threats within the upland and marine environment. They also face threats from low population numbers, low immigration rates, high predation rates, and disease. Threats in the Marine Environment Threats to murrelets in the marine environment include declines in prey availability; mortality associated with exposure to oil spills, gill net and other fisheries; contaminants suspended in marine waters; and visual or sound disturbance from recreational or commercial watercrafts (57 FR 45328 [October 1, 1992]; (Ralph et al. 1995; USFWS 1997b; McShane et al. 2004). Activities, such as pile driving and underwater detonations, that result in elevated underwater sound pressure levels may also pose a threat to murrelets. Prey Availability Many fish populations have been depleted due to overfishing, reduction in the amount or quality of spawning habitat, and pollution. As of 2004, only 50 percent of the Puget Sound herring stocks were classified as healthy or moderately healthy, with north Puget Sound’s stock being considered depressed and the Strait of Juan de Fuca’s stocks being classified as critical (WDFW 2005d). Natural mortality in some of these stocks has increased (e.g. the mean estimated annual natural mortality rate for sampled stocks from 1987 through 2003 averaged 71 percent, up from 20 to 40 percent in the late 1970s) (WDFW 2005c). There is currently only one commercial herring fishery which operates primarily in south and central Puget Sound (WDFW 2005b) where herring stocks are healthier. Unfortunately, the decline of some herring stocks may be affecting the forage base for murrelets in Puget Sound. There is limited information available for the coastal herring populations, but these populations appear to have relatively high levels of abundance (WDFW 2005a). There are herring fisheries in Willapa Bay and Grays Harbor, but no direct harvest is allowed in the coastal waters. While there are commercial and recreational fisheries for surf smelt, the amount of harvest does not appear to be impacting the surf smelt stocks (Bargmann 1998). There are no directed commercial fisheries for sand lance (Bargmann 1998). Anchovies are taken commercially within coastal and estuarine waters of Washington. While the current harvest level doesn’t appear to be impacting anchovy stocks, there is no current abundance information (Bargmann 1998).

17
In addition to fishing pressure, oceanographic variation can influence prey availability. While the effects to murrelets from events such as El Niño have not been well documented, El Niño events are thought to reduce overall prey availability and several studies have found that El Niño events can influence the behavior of murrelets (McShane et al. 2004). Even though changes in prey availability may be due to natural and cyclic oceanographic variation, these changes may exacerbate other threats to murrelets in the marine environment. Shoreline development has affected and will continue to effect coastal processes. Shipping, bulkheads, and other shoreline developments have contributed to the reduction in eelgrass beds and other spawning and rearing areas for forage species. Oil Spills Murrelet mortality from oil pollution is a conservation issue in Washington (USFWS 1997b). Most oil spills and chronic oil pollution that can affect murrelets occur in areas of high shipping traffic, such as the Strait of Juan de Fuca and Puget Sound. There have been at least 47 oil spills of 10,000 gal or more in Washington since 1964 (WDOE 2004). However, the number of oil spills has generally declined since passage of the U.S. Oil Pollution Act in 1990. The estimated annual mortality of murrelets from oil spills in Washington has decreased from 3 to 41 birds per year (between 1977 and 1992) to 1 to 2 birds per year (between 1993 and 2003) (McShane et al. 2004). Since the murrelet was listed, the amount of oil tanker and shipping traffic has continued to increase (USFWS 1997b; Burger 2002). Large commercial ships, including oil tankers, cargo ships, fish processing ships, and cruise ships, enter Washington waters more than 7,000 times each year, bound for ports in Puget Sound, British Columbia, Grays Harbor, and the Columbia River (WDOE 2004). Additionally, 4,500 tank-barge transits, 160,000 ferry transits, and military vessel traffic occur in these same waters each year (WDOE 2004). Individually these vessels may carry up to 33 M gal of crude oil or refined petroleum products, but collectively, they carry about 15.1 B gal across Puget Sound waters each year (WDOE 2004). These numbers are expected to increase as the human population and commerce continues to grow. Currently, there are State and Federal requirements for tug escorts of laden oil tankers transiting the waters of Puget Sound east of Dungeness Spit. However, the Federal requirements do not apply to double-hulled tankers and will no longer be in effect once the single-hull tanker phase-out is complete (WDOE 2005). Washington State is considering revising their tug escort requirements (WDOE 2005); however, the current tug escort requirements remain in place until the Washington State Legislature makes a change. The U.S. Coast Guard rated the Dungeness area in the Strait of Juan de Fuca as being in the top five high-risk areas of the United States for being impacted by oil spills (USFWS 2003b). Therefore, even though the threat from oil spills appears to have been reduced since the murrelet was listed, the risk of a catastrophic oil spill remains, and could severely impact adult and/or juvenile murrelets in Conservation Zones 1 and 2.

18
Gillnets Murrelet mortality from gillnet fishing has been considered a conservation issue in Washington (USFWS 1997b; Melvin et al. 1999). Murrelets can also be killed by hooking with fishing lures and entanglement with fishing lines (Carter et al. 1995). There is little information available on murrelet mortality from net fishing prior to the 1990s, although it was known to occur (Carter et al. 1995). In the mid 1990s, a series of fisheries restrictions and changes were implemented to address mortality of all species of seabirds, resulting in a lower mortality rate of murrelets (McShane et al. 2004). Fishing effort has also decreased since the 1980s because of lower catches, fewer fishing vessels, and greater restrictions (McShane et al. 2004), although a regrowth in gill net fishing is likely to occur if salmon stocks increase. In most areas, the threat from gill net fishing has been reduced or eliminated since 1992, but threats to adult and juvenile murrelets are still present in Washington waters due to gill net mortality (McShane et al. 2004). Entanglement in derelict fishing nets, which are nets that have been lost, abandoned or discarded in the marine environment, may also pose a threat. Derelict gear can persist in the environment for decades and poses a threat to marine mammals, seabirds, shellfish, and fish. A recent survey estimated 3,900 derelict nets need to be removed from Puget Sound annually (Northwest Straits Foundation 2007) and each year the number of new derelict nets increases faster than the number removed. Over 50 percent of the derelict nets in Puget Sound occur in waters where murrelet densities are the highest in Washington. Derelict fishing gear also occurs along the Washington coast and the outer Straits of Juan de Fuca. While this high energy environment may reduce the time a derelict net remains suspended compared to a lower energy environment like the inner Puget Sound where gear may persist for years (NRC 2007), the amount of time a derelict net poses a threat to marine species depends on the length and type of the net and cause of entanglement. Marine Contaminants The primary consequence from the exposure of murrelets to contaminants is reproductive impairment. Reproduction can be impacted by food web bioaccumulation of organochlorine pollutants and heavy metals discharged into marine areas where murrelets feed and prey species concentrate (Fry 1995). However, murrelet exposure is likely a rare event because murrelets have widely dispersed foraging areas and they feed extensively on transient juvenile and subadult midwater fish species that are expected to have low pollutant loads (McShane et al. 2004). The greatest exposure risk to murrelets may occur at regular feeding areas near major pollutant sources, such as those found in Puget Sound (McShane et al. 2004). Disturbance In coastal and offshore marine environments, vehicular disturbance (e.g., boats, airplanes, personal watercraft) is known to elicit behavioral responses in murrelets of all age classes (Kuletz 1996; Speckman 1996; Nelson 1997). Aircraft flying at low altitudes and boating activity, in particular motorized watercraft, are known to cause murrelets to dive and are thought to especially affect adults holding fish (Nelson 1997). It is unclear to what extent this kind of disturbance affects the distribution, movements, foraging efficiency, and overall fitness of
19
murrelets. However, it is unlikely this type of disturbance has decreased since 1992 because the shipping traffic and recreational boat use in the Puget Sound and Strait of Juan de Fuca has continued to increase. Marine projects that include seismic exploration, pile driving, detonation of explosives and other activities that generate percussive sounds can expose murrelets to elevated underwater sound pressure levels (SPLs). High underwater SPLs can have adverse physiological and neurological effects on a wide variety of vertebrate species (Yelverton et al. 1973; Yelverton and Richmond 1981; Steevens et al. 1999; Fothergill et al. 2001; Cudahy and Ellison 2002; U.S. Department of Defense 2002; Popper 2003). High underwater SPLs are known to injure and/or kill fish by causing barotraumas (pathologies associated with high sound levels including hemorrhage and rupture of internal organs), as well as causing temporary stunning and alterations in behavior (Turnpenny and Nedwell 1994; Turnpenny et al. 1994; Popper 2003; Hastings and Popper 2005). During monitoring of seabird response to pile driving in Hood Canal, Washington, a pigeon guillemot (Cepphus columba) was observed having difficulty getting airborne after being exposed to underwater sound from impact pile driving (Entranco and Hamer Environmental 2005). In controlled experiments using underwater explosives, rapid change in SPLs caused internal hemorrhaging and mortality in submerged mallard ducks (Anas platyrhnchos) (Yelverton et al. 1973). Risk of injury appears related to the effect of rapid pressure changes, especially on gas filled spaces in the bodies of exposed organisms (Turnpenny et al. 1994). In studies on ducks (Anas spp.) and a variety of mammals, all species exposed to underwater blasts had injuries to gas filled organs including eardrums (Yelverton and Richmond 1981). These studies indicate that similar effects can be expected across taxonomical species groups. Physical injury may not result in immediate mortality. If an animal is injured, death may occur several hours or days later, or injuries may be sublethal. Sublethal injuries can interfere with the ability of an organism to carry out essential life functions such as feeding and predator avoidance. Diving birds are able to detect and alter their behavior based on sound in the underwater environment (Ross et al. 2001) and elevated underwater SPLs may cause murrelets to alter normal behaviors, such as foraging. Disturbance related to elevated underwater SPLs may reduce foraging efficiency resulting in increased energetic costs to all murrelet age classes in the marine environment and may result in fewer deliveries or lower quality food being delivered to nestlings. Threats in the Terrestrial Environment Habitat Extensive harvest of late-successional and old-growth forest was the primary reason for listing the murrelet as threatened. Due primarily to extensive timber cutting over the past 150 years, at least 82 percent of the old-growth forests existing in western Washington and Oregon prior to the 1840s have been harvested (Teensma et al. 1991; Booth 1991; Ripple 1994; Perry 1995). About 10 percent of pre-settlement old-growth forests remain in western Washington (Norse 1990; Booth 1991). Although the Northwest Forest Plan has reduced the rate of habitat loss on Federal lands, the threat of continued loss of suitable nesting habitat remains on Federal and non-Federal
20
lands through timber harvest and natural events such as wildfire, insect outbreaks, and windthrow. Natural disturbance has the potential to affect the amount and quality of murrelet nesting habitat. Wildfire and windthrow result in immediate loss of habitat and can also influence the quality of adjacent habitat. Global warming, combined with long-term fire suppression on Federal lands, may result in higher incidences of stand-replacing fires in the future (McShane et al. 2004). As forest fragmentation increases, the threat of habitat loss due to windthrow is likely to increase. In addition, insects and disease can kill complete stands of habitat and can contribute to hazardous forest fire conditions. Between 1992 and 2003, the loss of suitable murrelet habitat totaled 22,398 acres in Washington, Oregon, and California combined, of which 5,364 acres resulted from timber harvest and 17,034 acres resulted from natural events (McShane et al. 2004). The data presented by McShane represented losses primarily on Federal lands, and did not include data for most private lands within the murrelets’ range. Habitat loss and fragmentation is expected to continue in the near future, but at an uncertain rate (McShane et al. 2004). Raphael et al. (2006) recently completed a change analysis for marbled murrelet habitat on both Federal and non-Federal lands for the period from 1992 to 2003, based on stand disturbance map data developed by Healey et al. (2003). Raphael et al. (2006) estimated that habitat loss ranging from 60,000 acres up to 278,000 acres has occurred across the listed range of the species, with approximately 10 percent of habitat loss occurring on Federal lands, and 90 percent occurring on non-Federal lands. The variation in the acreage estimates provided by Raphael et al. (2006) are dependant upon the habitat model used (Table 3) to evaluate habitat change over time. Gains in suitable nesting habitat are expected to occur on Federal lands over the next 40 to 50 years, but due to the extensive historic habitat loss and the slow replacement rate of murrelets and their habitat, the species is potentially facing a severe reduction in numbers in the coming 20 to 100 years (USFS and USBLM 1994a; Beissinger 2002). In addition to direct habitat removal, forest management practices can fragment murrelet habitat; this reduces the amount and heterogeneous nature of the habitat, reduces the forest patch sizes, reduces the amount of interior or core habitat, increases the amount of forest edge, isolates remaining habitat patches, and creates “sink” habitats (McShane et al. 2004). There are no estimates available for the amount of suitable habitat that has been fragmented or degraded since 1992. However, the ecological consequences of these habitat changes to murrelets can include effects on population viability and size, local or regional extinctions, displacement, fewer nesting attempts, failure to breed, reduced fecundity, reduced nest abundance, lower nest success, increased predation and parasitism rates, crowding in remaining patches, and reductions in adult survival (Raphael et al. 2002). Predation Predation is expected to be the principal factor limiting murrelet reproductive success and nest site selection (Ralph et al. 1995; Nelson and Hamer 1995a). Murrelets are believed to be highly vulnerable to nest predation compared to other alcids and forest nesting birds (Nelson and Hamer 1995a; USFWS 1997b). Murrelets have no protection at nest sites other than the ability to

21
remain hidden. Nelson and Hamer (1995a) hypothesized that small increases in murrelet predation will have deleterious effects on murrelet population viability due to their low reproductive rate (one egg clutches). Known predators of adult murrelets in the forest environment include the peregrine falcon (Falco peregrinus), sharp-shinned hawk (Accipiter striatus), common raven (Corvus corax), northern goshawk (Accipiter gentilis), and bald eagle (Haliaeetus leucocephalus). Common ravens and Stellar’s jays (Cyanocitta stelleri) are known to take both eggs and chicks at the nest, while sharp-shinned hawks have been found to take chicks. Common ravens account for the majority of egg depredation, as they appear to be the only predator capable of flushing incubating or brooding adults from a nest (Nelson and Hamer 1995a). Suspected nest predators include great horned owls (Bubo virginianus), barred owls (Strix varia), Cooper’s hawks (Accipiter cooperi), northwestern crows (Corvus caurinus), American crows (Corvus brachyrhynchos), and gray jays (Perisoreus canadensis) (Nelson and Hamer 1995a; Nelson 1997; Manley 1999). Predation by squirrels and mice has been documented at artificial nests and these animals cannot be discounted as potential predators on eggs and chicks (Luginbuhl et al. 2001; Raphael et al. 2002; Bradley and Marzluff 2003).
Losses of eggs and chicks to avian predators have been determined to be the most important cause of nest failure (Nelson and Hamer 1995a; McShane et al. 2004). The risk of predation by avian predators appears to be highest in complex structured landscapes in proximity to edges and human activity, where many of the corvid (e.g., crows, ravens) species are in high abundance. Predation rates are influenced mainly by habitat stand size, habitat quality, nest placement (on the edge of a stand versus the interior of a stand), and proximity of the stand to human activity centers. The quality of murrelet nest habitat decreases in smaller stands because forest edge increases in relation to the amount of interior forest, while forest stands near human activity centers (less than 0.62 mi or 1 km), regardless of size, are often exposed to a higher density of corvids due to their attraction to human food sources (Marzluff et al. 2000). The loss of nest contents to avian predators increases with habitat fragmentation and an increase in the ratio of forest edge to interior habitat (Nelson and Hamer 1995a; McShane et al. 2004). For example, Nelson and Hamer (1995a) found successful nests were farther from edges (greater than 55 m) and were better concealed than unsuccessful nests. The abundance of several corvid species has increased dramatically in western North America as a result of forest fragmentation, increased agriculture, and urbanization (McShane et al. 2004). It is reasonable to infer that as predator abundance has increased, predation on murrelet chicks and eggs has also increased, and murrelet reproductive success has decreased. It is also reasonable to assume that this trend will not be interrupted or reversed in the near future, as forest fragmentation, agriculture, and urbanization continue to occur. Other Threats Murrelets are subject to additional threats from diseases, genetics, low population numbers, and low immigration rates. To date, inbreeding (mating between close genetic relatives) and/or hybridizing (breeding with a different species or subspecies) have not been identified as threats to murrelet populations. However, as abundance declines, a corresponding decrease in the

22
resilience of the population to disease, inbreeding or hybridization, and other perturbations may occur. Additionally, murrelets are considered to have low recolonization potential because their low immigration rate makes the species slow to recover from local disturbances (McShane et al. 2004). The emergence of fungal, parasitic, bacterial, and viral diseases has affected populations of seabirds in recent years. West Nile virus disease has been reported in California which is known to be lethal to seabirds. While the amount of negative impact this disease may bring is unknown, researchers agree that it is only a matter of time before West Nile virus reaches the Washington seabird population. Effects for murrelets from West Nile virus and other diseases are expected to increase in the near future due to an accumulation of stressors such as oceanic temperature changes, overfishing, and habitat loss (McShane et al. 2004). Murrelets may be sensitive to human-caused disturbance due to their secretive nature and their vulnerability to predation. There are little data concerning the murrelet’s vulnerability to disturbance effects, except anecdotal researcher observations that indicate murrelets typically exhibit a limited, temporary behavioral response (if any) to noise disturbance at nest sites and are able to adapt to auditory stimuli (Long and Ralph 1998; Golightly et al. 2002; Singer et al. 1995 in McShane et al. 2004). In general, responses to auditory stimuli at nests sites have been modifications of posture and on-nest behaviors (Long and Ralph 1998). While the unique breeding biology of the murrelet is not conducive to comparison of the reproductive success of other species, studies on other alcid and seabird species have revealed detrimental effects of disturbance to breeding success and the maintenance of viable populations (Cairns 1980; Pierce and Simons 1986; Piatt et al. 1990; Beale and Monaghan 2004). Research on a variety of other species, including other seabirds, indicate an animal’s response to disturbance follows the same pattern as its response to encountering predators, and anti-predator behavior has a cost to other fitness enhancing activities, such as feeding and parental care (Frid and Dill 2002). Some authors indicate disturbance stimuli can directly affect the behavior of individuals and indirectly affect fitness and population dynamics through increased energetic costs (Carney and Sydeman 1999; Frid and Dill 2002). Responses by murrelet adults and chicks to calls from corvids and other potential predators include no response, alert posturing, aggressive attack, and temporarily leaving a nest (adults only) (McShane et al. 2004). However, the most typical behavior of chicks and adults in response to the presence of a potential predator is to flatten against a tree branch and remain motionless (Nelson and Hamer 1995a; McShane et al. 2004). Therefore, researcher’s anecdotal observations of little or no physical response by murrelets are consistent with the behavior they will exhibit in response to a predator. In addition, there may have been physiological responses researchers cannot account for with visual observations. Corticosterone studies have not been conducted on murrelets, but studies on other avian species indicate chronic high levels of this stress hormone may have negative consequences on reproduction or physical condition (Wasser et al. 1997; Kitaysky et al. 2001; Marra and Holberton 1998 in McShane et al. 2004). Although detecting effects of sub-lethal noise disturbance at the population level is hindered by the breeding biology of the murrelet, the effect of noise disturbance on murrelet fitness and reproductive success should not be completely discounted (McShane et al. 2004). In recently
23
completed analyses, the Service concluded the potential for injury associated with disturbance (visual and sound) to murrelets in the terrestrial environment includes flushing from the nest, aborted feeding, and postponed feedings (USFWS 2003a). These responses by individual murrelets to disturbance stimuli can reduce productivity of the nesting pair, as well as the entire population (USFWS 1997b). Conservation Needs The Recovery Plan outlines the conservation strategy for the species. In the short-term, specific actions necessary to stabilize the population include maintaining occupied habitat, maintaining large blocks of suitable habitat, maintaining and enhancing buffer habitat, decreasing risks of nesting habitat loss due to fire and windthrow, reducing predation, and minimizing disturbance. Long-term conservation needs include increasing productivity (abundance, the ratio of juveniles to adults, and nest success) and population size; increasing the amount (stand size and number of stands), quality, and distribution of suitable nesting habitat; protecting and improving the quality of the marine environment; and reducing or eliminating threats to survivorship by reducing predation in the terrestrial environment and anthropogenic sources of mortality at sea. The Service estimates recovery of the murrelet will require at least 50 years (USFWS 1997b). The Recovery Plan states that four of the six Conservation Zones (Zones) must be functional in order to effectively recover the murrelet in the short- and long-term; that is, to maintain viable populations that are well-distributed. However, based on the new population estimates, it appears only three of the Zones contain relatively robust numbers of murrelets (Zones 1, 3, and 4). Zones 1 and 4 contain the largest number of murrelets compared to the other four Zones. This alone would seem to indicate a better condition there, but areas of concern remain. For example, the population in Zone 4 was impacted when oil spills killed an estimated 10 percent of the population (Bentivoglio et al. 2002; Ford et al. 2002), small oil spills continue to occur in Zone 1, and the juvenile ratios in both of these Zones continue to be too low to establish stable or increasing populations (Beissinger and Peery, in litt., 2003). Murrelets in Zones 3, 5, and 6 have suffered variously from past oil spills which killed a large number of murrelets (Zone 3) (Ford et al. 2001), extremely small population sizes (Zones 5 and 6), and alarmingly low reproductive rates (Zone 6) (Peery et al. 2002). These factors have brought the status of the species to a point where recovery in Zones 5 and 6 may be precluded (Beissinger 2002). The poor status of murrelet populations in the southern Zones emphasizes the importance of supporting murrelet populations in Zones 1 and 2 in order to preserve the opportunity to achieve murrelet recovery objectives. Conservation Strategy Marine Environment Protection of marine habitat is a component of the recovery strategy. The main threat to murrelets in the marine environment is the loss of individuals through death or injury, generally associated with oil spills and gill-net entanglements. The recovery strategy recommends
24
providing protection within marine waters in such a way as to reduce or eliminate murrelet mortality (USFWS 1997b). The recovery strategy specifically recommends protection within all waters of Puget Sound and Strait of Juan de Fuca, and within 1.2 mi of shore along the Pacific Coast from Cape Flattery to Willapa Bay. However, newer information indicates the majority of murrelet activity along the Washington Coast occurs within 5 mi (8 km) of shore (Raphael et al. 2007), suggesting that protections should be extended to encompass this area. Management strategies could include exclusion of vessels, stricter hull requirements, exclusion of net fisheries, or modification of fishing gear. In Washington State, the Washington Fish and Game Commission requires the use of alternative gear (i.e., visual alerts within the upper 7 ft of a multifilament net), prohibits nocturnal and dawn fishing for all non-treaty gill-net fisheries, and closes areas to gill-net fishing in order to reduce by-catch of murrelets. The Olympic Coast National Marine Sanctuary was established in 1994 along the outer Washington coast from Cape Flattery south to approximately the Copalis River and extending between 25 mi and 40 mi offshore. Oil exploration and development are prohibited within this Sanctuary (NOAA 1993). Terrestrial Habitat Management The loss of nesting habitat (old-growth/mature forest) has generally been identified as the primary cause of the murrelet population decline and disappearance across portions of its range (Ralph et al. 1995). Logging, urbanization, and agricultural development have all contributed to the loss of habitat, especially at lower elevations. The recovery strategy for the murrelet is contained within the Marbled Murrelet Recovery Plan (Recovery Plan) (USFWS 1997b) relies heavily on the Northwest Forest Plan (NWFP) to achieve recovery on Federal lands in Washington, Oregon, and California. However, the Recovery Plan also addresses the role of non-Federal lands in recovery, including Habitat Conservation Plans, State forest practices, and lands owned by Native American Tribes. The importance of non-Federal lands in the survival and recovery of murrelets is particularly high in Conservation Zones, where Federal lands, and privately held conservation lands (e.g., The Nature Conservancy Teal Slough, Ellsworth, Washington), within 50 mi of the coastline are sparse, such as the southern half of Conservation Zone 2. Lands considered essential for the recovery of the murrelet within Conservation Zones 1 and 2 are 1) any suitable habitat in a Late Successional Reserve (LSR), 2) all suitable habitat located in the Olympic Adaptive Management Area, 3) large areas of suitable nesting habitat outside of LSRs on Federal lands, such as habitat located in the Olympic National Park, 4) suitable habitat on State lands within 40 mi of the coast, and 5) habitat within occupied murrelet sites on private lands (USFWS 1997b). Northwest Forest Plan When the U.S. Forest Service (USFS) and Bureau of Land Management incorporated the NWFP as the management framework for public lands, a long-term habitat management strategy for murrelets (USFS and USBLM 1994a; USFS and USBLM 1994b) was established. The NWFP
25
instituted pre-project surveys of murrelet habitat in areas planned for timber harvest and the protection of existing habitat at sites determined through surveys to be occupied by murrelets. In the short-term, all known-occupied sites of murrelets occurring on USFS or Bureau of Land Management lands under the NWFP are to be managed as Late Successional Reserves (LSRs). In the long-term, unsuitable or marginally suitable habitat occurring in LSRs will be managed, overall, to develop late-successional forest conditions, thereby providing a larger long-term habitat base into which murrelets may eventually expand. Thus, the NWFP approach offers both short-term and long-term benefits to the murrelet. Over 80 percent of murrelet habitat on Federal lands in Washington occurs within land management allocations that protect the habitat from removal or significant degradation. Scientists predicted implementation of the NWFP would result in an 80 percent likelihood of achieving a well-distributed murrelet population on Federal lands over the next 100 years (USFS and USBLM 1994a). Although the NWFP offers protection of known-occupied murrelet sites, concerns over the lingering effects of the historic widespread removal of suitable habitat will remain until the habitat recovers to late-successional characteristics. Habitat recovery will require over 100 years in many LSRs. Habitat Conservation Plans Four Habitat Conservation Plans (HCP) addressing murrelets in Washington have been completed for private/corporate forest land managers within the range of the murrelet: West Fork Timber Corporation (Murray Pacific Corporation 1993; Murray Pacific Corporation 1995; USFWS 1995) (Mineral Tree Farm HCP); Plum Creek Timber Company (Plum Creek Timber Company, L.P. 1996; USFWS 1996a; Plum Creek Timber Company, L.P. 1999; USFWS 1999) (Cascades HCP; I-90 HCP); Port Blakely Tree Farms, L.P. (Port Blakely Tree Farms, L.P. 1996; USFWS 1996b) (R.B. Eddy Tree Farm HCP); and Simpson Timber Company (Simpson Timber Company 2000; USFWS 2000b) (Olympic Tree Farm HCP). Habitat Conservation Plans have also been completed for two municipal watersheds, City of Tacoma (USFWS 2001; Tacoma Public Utilities 2001) (Green River HCP) and City of Seattle (USFWS 2000a; City of Seattle 2001) (Cedar River HCP), and the Washington Department of Natural Resources (WDNR 1997; USFWS 1997a). The HCPs which address murrelets cover approximately 500,000 acres of non-Federal (private/corporate) lands, over 100,000 acres of municipal watershed, and over 1.6 million acres of State-managed lands. However, only a portion of these lands contain suitable murrelet habitat. The WDNR HCP addresses murrelets in Conservation Zones 1 and 2. All of the others address murrelets in Conservation Zone 1. Most of the murrelet HCPs in Washington employ a consistent approach for murrelets by requiring the majority of habitat to be surveyed prior to timber management. Only poor-quality marginal habitat (with a low likelihood of occupancy) is released for harvest without survey. All known occupied habitat is protected to varying degrees, but a “safe-harbor-like” approach is used to address stands which may be retained as, or develop into, suitable habitat and become occupied in the future. This approach would allow future harvest of habitat which is not currently nesting habitat.

26
Washington State Forest Practices Regulations Under Washington Forest Practices Rules, which apply to all non-Federal lands not covered by an HCP (WFPB 2005), surveys for murrelets are required prior to the harvest of suitable nesting habitat. These criteria vary depending on the location of the stand. For stands found to be occupied or known to be previously occupied, the WDNR makes a decision to issue the permit based upon a significance determination. If a determination of significance is made, preparation of a State Environmental Policy Act Environmental Impact Statement is required prior to proceeding. If a determination of non-significance or mitigated determination of non-significance is reached, the action can proceed without further environmental assessment. Tribal Management The management strategy of the Bureau of Indian Affairs for the murrelet focuses on working with Tribal governments on a government-to-government basis to develop management strategies for reservation lands and trust resources. The Bureau of Indian Affairs’ management strategy typically focus on avoiding harm to murrelets when feasible, to facilitate the trust responsibilities of the United States. However, other factors must be considered. Strategies must foster Tribal self-determination, and must balance the needs of the species and the environmental, economic, and other objectives of Indian Tribes within the range of the murrelet (Renwald 1993). For example, one of the Bureau of Indian Affairs’ main goals for murrelet protection includes assisting Native American Tribes in managing habitat consistent with tribal priorities, reserved Indian rights, and legislative mandates. Summary Demographic modeling results indicate murrelet populations are declining within each Conservation Zone and throughout the listed range. The juvenile to adult ratios observed at sea in the Conservation Zones are too low to obtain a stable population in any Conservation Zone, which indicates murrelet abundance in all Conservation Zones will continue to decline until reproductive success improves. In other words, there is insufficient recruitment of juveniles to sustain a murrelet population in the listed range of the species. Some of the threats to the murrelet population may have been reduced as a result of the species’ listing under the Act, such as the passage of the Oil Pollution Act and implementation of the NWFP. However, no threats have been reversed since listing and in some areas threats, such as predation and West Nile Virus, may be increasing or emerging. Threats continue to contribute to murrelet population declines through adult and juvenile mortality and reduced reproduction. Therefore, given the current status of the species and background risks facing the species, it is reasonable to assume that murrelet populations in Conservation Zones 1 and 2 and throughout the listed range have little resilience to deleterious population-level effects and are at high risk of extirpation. Considering the life history characteristics of the murrelet, with the aggregate effects of inland habitat loss and fragmentation and at-sea mortality, the species’ capability to recover from lethal perturbations at the population or metapopulation (Conservation Zone) scale is extremely low.
27
The low observed reproductive rates make the species highly susceptible to local extirpations when exposed to repeated perturbations at a frequency which exceeds the species’ loss-replacement rate. Also troublesome is the ineffectiveness of recovery efforts at reversing the ongoing lethal consequences in all demographic classes from natural and anthropogenic sources. Despite the relatively long potential life span of adult murrelets, the annual metapopulation replacement rates needed for long-term metapopulation maintenance and stability is currently well below the annual rate of individuals being removed from each metapopulation. As a result, murrelet metapopulations are currently not self-sustaining or self-regulating. Accordingly, the Service concludes the current environmental conditions for murrelets in the coterminous United States appear to be insufficient to support the long-term conservation needs of the species. Although information is not sufficient to determine whether murrelets are nesting at or near the carrying capacity in the remaining nest habitat, activities which degrade the existing conditions of occupied nest habitat or reduce adult survivorship and/or nest success of murrelets will be of greatest consequence to the species. Actions resulting in the further loss of occupied nesting habitat, mortality to breeding adults, eggs, or nestlings will reinforce the current murrelet population decline throughout the coterminous United States.
28
LITERATURE CITED
Ainley, D.G., S.G. Allen, and L.B. Spear. 1995. Offshore occurrence patterns of marbled murrelets in central California. Pages 361-69. In: Ecology and conservation of the marbled murrelet General Technical Report: PSW-GTR-152. Pacific Southwest Experimental Station, U.S. Forest Service, Albany, California. 420 pp.
Bargmann, G. 1998. Forage fish management plan: A Plan for managing the forage fish resources and fisheries of Washington. Olympia, Washington, 66 pp.
Beale, C.M. and P. Monaghan. 2004. Human disturbance: People as predation-free predators? Journal of Applied Ecology 41(7):335-43.
Becker, B.H., S.R. Beissinger, and H.R. Carter. 2001. Effects of oceanographic variation on marbled murrelet diet and habitat selection. University of California at Berkeley, Berkeley, CA.
Becker, B.H. and S.R. Beissinger. 2006. Centennial decline in the trophic level of an endangered seabird after fisheries decline. Conservation Biology 20(2):470-79.
Becker, B.H., M.Z. Peery, and S.R. Beissinger. 2007. Ocean climate and prey availability affect the trophic level and reproductive success of the marbled murrelet, an endangered seabird. Inter-Research Marine Ecology Progress Series 329:267-79.
Beissinger, S.R. 1995. Population trends of the marbled murrelet projected from demographic analyses. Pages 385-93. In: Ralph, C.J., G.L. Hunt, M.G. Raphael, and J.F. Piatt (eds). Ecology and conservation of the marbled murrelet. General Technical Report: PSW-GTW-152. Pacific Southwest Experimental Station, U.S. Forest Service, Albany, California. 420 pp.
Beissinger, S.R. 2002. Analysis of the effects of a 10% reduction of population size on marbled murrelet population dynamics in Northern California. U.S. Fish and Wildlife Service, Arcata, CA, April 5, 2002, 10 pp.
Beissinger, S.R. and M.Z. Peery. 2003. Range-wide analysis of juvenile ratios from marbled murrelet monitoring programs: Implications for demographic analyses. University of California, Berkeley, CA. 30.
Bentivoglio, N., J. Baldwin, P.G.R. Jodice, D. Evans Mack, T. Max, S. Miller, S.K. Nelson, K. Ostrom, C.J. Ralph, M.G. Raphael, C.S. Strong, C.W. Thompson, and R. Wilk. 2002. Northwest Forest Plan marbled murrelet effectiveness monitoring 2000 Annual Report. U.S. Fish and Wildlife Service, Portland, Oregon, 73 pp.

29
Bloxton, T.D. and M.G. Raphael. 2008. Breeding ecology of the marbled murrelet in Washington state: project update 2004-2007. A report to the U.S. Fish and Wildlife Service and U.S. Forest Service, 32 pp.
Booth, D.E. 1991. Estimating pre-logging old-growth in the Pacific Northwest. Journal of Forestry 89(10):25-29.
Bradley, J.E. and J.M. Marzluff. 2003. Rodents as nest predators: Influences on predatory behavior and consequences to nesting birds. Auk 120:1180-87.
Burger, A.E. 1995. Marine distribution, abundance and habitat of marbled murrelets in British Columbia. Pages 295-312. In: Ralph, C.J., G.L. Hunt, M.G. Raphael, and J.F. Piatt (eds). Ecology and conservation of the marbled murrelet. General Technical Report.PSW-GTW-152. Pacific Southwest Experimental Station, U.S. Forest Service, Albany, California. 420 pp.
Burger, A.E. 2002. Conservation assessment of marbled murrelets in British Columbia, a review of biology, populations, habitat associations and conservation. Canadian Wildlife Service, Pacific and Yukon Region, 194 pp.
Burkett, E.E. 1995. Marbled murrelet food habits and prey ecology. Pages 223-46. In: Ralph, C.J., G.L. Hunt, M.G. Raphael, and J.F. Piatt (eds). Ecology and conservation of the marbled murrelet. General Technical Report: PSW-GTW-152. Pacific Southwest Experimental Station, U.S. Forest Service, Albany, California. 420 pp.
Butler, P.J. and D.R. Jones. 1997. Physiology of diving birds and mammals. Physiological Reviews 77(3):837-99.
Cairns, D. 1980. Nesting density, habitat structure and human disturbance as factors in Black Guillemot reproduction. The Wilson Bulletin 92(3):352-61.
Cam, E., L. Lougheed, R. Bradley, and F. Cooke. 2003. Demographic assessment of a marbled murrelet population from capture-recapture data. Conservation Biology 17(4):1118-26.
Carney, K.M. and W.J. Sydeman. 1999. A review of human disturbance effects on nesting colonial waterbirds. Waterbirds 22(1):68-79.
Carter, H.R. and R.A. Erickson. 1992. Status and conservation of the marbled murrelet in California, 1892-1987. Pages 92-108. In: Carter, H.R. and M.L. Morrison (eds). Status and conservation of the marbled murrelet in North America, 5th ed. Western Foundation of Vertebrate Zoology, Camarillo, CA.
30
Carter, H.R., L.C. McAllister, and M.E. Isleib. 1995. Mortality of marbled murrelets in gill nets in North America. Pages 271-83. In: Ralph, C.J., G.L. Hunt, M.G. Raphael, and J.F. Piatt (eds). Ecology and conservation of the marbled murrelet. General Technical Report. PSW-GTW-152. Pacific Southwest Experimental Station, U.S. Forest Service, Albany, California. 420 pp.
Carter, H.R. and S.G. Sealy. 1986. Year-round use of coastal lakes by marbled murrelets. Condor 88(4):473-77.
Carter, H.R. and S.G. Sealy. 1990. Daily foraging behavior of marbled murrelets. Studies in Avian Biology 14:93-102.
Carter, H.R. and J.L. Stein. 1995. Molts and plumages in the annual cycle of the marbled murrelet. Pages 99-109. In: Ralph, C.J., G.L. Hunt, M.G. Raphael, and J.F. Piatt (eds). Ecology and conservation of the marbled murrelet. General Technical Report. PSW-GTW-152. Pacific Southwest Experimental Station, U.S. Forest Service, Albany, California. 420 pp.
City of Seattle. 2001. Final Cedar River Watershed Habitat Conservation Plan for the issuance of a permit to allow incidental take of threatened and endangered species. Seattle, Washington, 1034 pp.
Croll, D.A., A.J. Gaston, A.E. Burger, and D. Konoff. 1992. Foraging behavior and physiological adaptation for diving in think-billed murres. Ecology 73(1):334-56.
Cudahy, E. and W.T. Ellison. 2002. A review of the potential for in vivo tissue damage by exposure to underwater sound. Naval Submarine Research Laboratory, Department of the Navy, Groton, Connecticut, March 12, 2002, 6 pp.
Day, R.H. and D.A. Nigro. 2000. Feeding ecology of Kittlitz's and marbled murrelets in Prince William Sound, Alaska. Waterbirds 23(1):1-14.
Divoky, G.J. and M. Horton. 1995. Breeding and natal dispersal, nest habitat loss and implications for marbled murrelet populations. Pages 83-87. In: Ralph, C.J., G.L. Hunt, M.G. Raphael, and J.F. Piatt (eds). Ecology and conservation of the marbled murrelet. General Technical Report. PSW-GTW-152. Pacific Southwest Experimental Station, U.S. Forest Service, Albany, California. 420 pp.
Entranco, Inc. and Hamer Environmental, L.P. 2005. Marbled Murrelet Hazing Report - SR 104 Hood Canal Bridge east-half replacement and west-half retrofit project. Washington State Department of Transportation, 22 pp + appendices.

31
Evans Mack, D., W.P. Ritchie, S.K. Nelson, E. Kuo-Harrison, P. Harrison, and T.E. Hamer. 2003. Methods for surveying marbled murrelets in forests, a revised protocol for land management and research. Marbled Murrelet Technical Committee, Pacific Seabird Group.
Falxa, G. 2008. Email to Martin Raphael, Lance, Monique, Pearson, Scott, Lynch, Deanna, Falxa, Gary, Nelson, Kim, Huff, Mark, Young, Rich, Bloxton, Thomas D., Bush, Jodi, Tuerler, Bridgette, Brown, Robin, Pereksta, David, Schmidt, Kristin, Flotlin, Kim, Burkett, E., McIver, Bill, Bond, James, Watkins, Jim H., Hoffman, Ken R., Roberts, Lynn M., Bosch, Ray, Hamlin, Robin, Olah, Ryan, Rabot, Theresa, Thomas, Darrin, Roy, Michael, Hensen, Paul, Young, Kristi, and Corbett, Miel, February 1 2008, Re: 2007 results of marbled murrelet at-sea populations surveys.
Ford, R.G., G.K.H. Boor, B.E. Sharp, and J.L. Casey. 2002. Estimates of bird impacts resulting from the M/V Kure/Humboldt Bay oil spill of November 5, 1997. U.S. Fish and Wildlife Service, Sacramento, California, 71 pp.
Ford, R.G., G.K. Himes Boor, and J.C. Ward. 2001. Final Report: Seabird mortality resulting from the M/V New Carissa oil spill incident, February and March 1999. U.S. Fish and Wildlife Service, Portland, OR, 64 pp.
Fothergill, D.M., J.R. Sims, and M.D. Curley. 2001. Recreational scuba diver's aversion to low-frequency underwater sound. Undersea and Hyperbaric Medicine 28(1):9-18.
Frid, A. and L. Dill. 2002. Human-caused disturbance stimuli as a form of predation risk. Conservation Ecology 6(1):1-11.
Fry, D.M. 1995. Pollution and fishing threats to marbled murrelets. Pages 257-60. In: Ralph, C.J., G.L. Hunt, M.G. Raphael, and J.F. Piatt (eds). Ecology and conservation of the marbled murrelet. General Technical Report: PSW-GTW-152. Pacific Southwest Experimental Station, U.S. Forest Service, Albany, California. 420 pp.
Gaston, A.J. and I. Jones. 1998. The Auks Alcidae. Oxford University Press, New York.
Golightly, R.T., P.N. Hebert, and D.L. Orthmeyer. 2002. Evaluation of human-caused disturbance on the breeding success of marbled murrelets (Brachyramphus marmoratus) in Redwood National and State Parks, California. 2001 Progress Report. U.S. Geological Survey, Humboldt State University, Arcata, CA, 61 pp.
Hamer, T.E., S.K. Nelson, and T.J. Mohagen II. 2003. Nesting chronology of the marbled murrelet in North America. Hamer Environmental and Oregon Cooperative Wildlife Research Unit, Portland, OR, February 6, 2003, 22 pp.

32
Hamer, T.E. and D.J. Meekins. 1999. Marbled murrelet nest site selection in relation to habitat characteristics in western Washington. Hamer Environmental, Mount Vernon, WA, 26 pp.
Hamer, T.E. and S.K. Nelson. 1995. Characteristics of marbled murrelet nest trees and nesting stands. Pages 69-82. In: Ralph, C.J., G.L. Hunt, M.G. Raphael, and J.F. Piatt (eds). Ecology and conservation of the marbled murrelet. U.S. Department of Agriculture Forest Service, Pacific Southwest Research Station, General Technical Report PSW-152, Albany, California. 420 pp.
Hastings, M.C. and A.N. Popper. 2005. Effects of sound on fish. Contract No. 43A0139, Task Order, 1. California Department of Transportation, Sacramento, CA, January 28, 2005, 82 pp.
Healey, S., W. Cohen, and M. Lefsky. 2003. Stand-replacing harvests and fires in Washington, 1984-2002. Laboratory for the Application of Remote Sensing in Ecology (LARSE), Pacific Northwest Research Station, U.S. Forest Service, USDA, Corvallis, Oregon.
Hebert, P.N., H.R. Carter, R.T. Golightly, and D.L. Orthmeyer. 2003. Radio-telemetry evidence of re-nesting in the same season by the marbled murrelet. Waterbirds 26(3):261-65.
Hebert, P.N. and R.T. Golightly. 2003. Breeding biology and human-caused disturbance to the nesting of marbled murrelets (Brachyramphus marmoratus) in Northern California, Progress Report 2002. Unpublished Draft Report. Department of Wildlife, Arcata, CA, November 12, 2003.
Henkel, L.A., E.E. Burkett, and J.Y. Takekawa. 2003. At-sea activity and diving behavior of a radio-tagged marbled murrelet in Central California. Waterbirds 26(4).
Hirzel, A.H., J. Hauser, D. Chessel, and N. Perrin. 2002. Ecological-niche factor analysis: How to compute habitat-suitability maps without absence data? Ecology 83(7):2027-36.
Hobson, K.A. 1990. Stable isotope analysis of marbled murrelets: evidence for freshwater feeding and determination of trophic level. The Condor 92:897-903.
Huff, M.H., P. Jodice, J. Baldwin, S. Miller, R. Young, K. Ostrom, C.J. Ralph, M. Raphael, C. Strong, C. Thompson, and G. Falxa. 2003. Marbled murrelet effectiveness monitoring - Northwest Forest Plan 2002 annual summary report. 27 pp.
Huff, M.H., M.G. Raphael, S.L. Miller, S.K. Nelson, and J. Baldwin. 2006. Northwest Forest Plan - The first 10 years (1994-2003): Status and trends of populations and nesting habitat for the marbled murrelet. General Technical Report: PNW-GTR-650. U.S. Department of Agriculture, Forest Service, Portland, Oregon, 149 pp.
33
Hull, C.L., G.W. Kaiser, C. Lougheed, L. Lougheed, S. Boyd, and F. Cooke. 2001. Intraspecific variation in commuting distance of marbled murrelets (Brachyramphus marmoratus): Ecological and energetic consequences of nesting further inland. The Auk 118(4):1036-46.
Jodice, P.G.R. and M.W. Collopy. 1999. Diving and foraging patterns of marbled murrelets (Brachyramphus marmoratus): Testing predictions from optimal-breathing models. Canadian Journal of Zoology 77(9):1409-18.
Kitaysky, A.S., J.C. Wingfield, and J.F. Piatt. 2001. Corticosterone facilitates begging and affects resource allocation in the black-legged kittiwake. Behavioral Ecology 12(5):619-25.
Kuletz, K.J. 1996. Marbled murrelet abundance and breeding activity at Naked Island, Prince William Sound, and Kachemak Bay, Alaska, before and after the Exxon Valdez oil spill. American Fisheries Society Symposium 18:770-84.
Kuletz, K.J. 2005. Foraging behavior and productivity of a non-colonial seabird, the marbled murrelet (Brachyramphus marmoratus), relative to prey and habit. Doctor of Philosphy in the Department of Biology. University of Victoria,
Kuletz, K.J. and J.F. Piatt. 1999. Juvenile marbled murrelet nurseries and the productivity index. The Wilson Bulletin 111(2):257-61.
Long, L.L. and J.C. Ralph. 1998. Regulation and observations of human disturbance near nesting marbled murrelets. Pacific Southwest Research Station, Arcata, California, 35 pp.
Luginbuhl, J.M., J.M. Marzluff, J.E. Bradley, M.G. Raphael, and D.E. Varland. 2001. Corvid survey techniques and the relationship between corvid relative abundance and nest predation. Journal of Field Ornithology 72(4):556-72.
Manley, I.A. 1999. Behavior and habitat selection of marbled murrelets nesting on the sunshine coast. Master of Science in Biological Sciences. Department of Biological Sciences, Simon Fraser University, Burnaby, BC. 1-163.
Manley, I.A. 2000. Radar surveys of marbled murrelets on the northwest coast of Vancouver Island, British Columbia. Ministry of the Environment, Lands, and Parks, Nanaimo, British Columbia, Canada, 44 pp.
Marzluff, J.M., M.G. Raphael, and R. Sallabanks. 2000. Understanding the effects of forest management on avian species. Wildlife Society Bulletin 28(4):1132-43.

34
Mason, A., A.E. Burger, and B. Hansen. 2002. At-sea surveys of marbled murrelets in Clayoquot Sound, 1996-2000. Pages 15-33. In: Burger, A. and T.A. Chatwin (eds). Multi-scale studies of populations, distribution, and habitat associations of marbled murrelets in Clayoquot Sound, British Columbia. Ministry of Water, Land, and Air Protection, Victoria, British Columbia.
Mathews, N.J.C. and A.E. Burger. 1998. Diving depth of a marbled murrelet. Northwestern Naturalist 79(2):70-71.
McBride, P. 2005. Information presented at the Pacific Seabird Group Marbled Murrelet Technical Committee meeting.
McFarlane-Tranquilla, L., B.R. Parker, N. Parker, D. Lank, and F. Cooke. 2003. Replacement laying in marbled murrelets Brachyramphus marmoratus. Marine Ornithology 31:75-81.
McShane, C., T.E. Hamer, H.R. Carter, R.C. Swartzman, V.L. Friesen, D.G. Ainley, K. Nelson, A.E. Burger, L.B. Spear, T. Mohagen, R. Martin, L. Henkel, K. Prindle, C. Strong, and J. Keany. 2004. Evaluation reports for the 5-year status review of the marbled murrelet in Washington, Oregon, and California. EDAW, Inc., Seattle, Washington, 370 pp.
Melvin, E.F., J.K. Parrish, and L.L. Conquest. 1999. Novel tools to reduce seabird by-catch in coastal gillnet fisheries. Conservation Biology 13(6):1386-97.
Meyer, C.B., S.L. Miller, and C.J. Ralph. 2002. Multi-scale landscape and seascape patterns associated with marbled murrelet nesting areas on the U.S. west coast. Landscape Ecology 17(2):95-115.
Miller, S.L. and C.J. Ralph. 1995. Relationship of marbled murrelets with habitat characteristics at inland sites in California. Pages 205-15. In: Ralph, C.J., G.L. Hunt, M.G. Raphael, and J.F. Piatt (eds). Ecology and conservation of the marbled murrelet. General Technical Report: PSW-GTW-152. Pacific Southwest Experimental Station, U.S. Forest Service, Albany, California. 420 pp.
Murray Pacific Corporation. 1993. Habitat Conservation Plan for the northern spotted owl on timberlands owned by the Murray Pacific Corporation, Lewis County, Washington. Beak Consultants Incorporated, Tacoma, WA, 154 pp.
Murray Pacific Corporation. 1995. Amendment to the Habitat Conservation Plan and incidental take permit PRT-777837 for the northern spotted owl on timberlands owned by the Murray Pacific Corporation, Lewis County, Washington. Beak Consultants, Inc., Tacoma, WA, 205 pp.

35
Naslund, N.L. 1993. Why do marbled murrelet attend old-growth forest nesting areas year-round? Auk 110(3):594-602.
Nelson, K. 2005. Note to file on 06/22/05 with Deanna Lynch, U.S. Fish and Wildlife Service, re: marbled murrelet nest densities.
Nelson, S.K. 1997. The birds of North America, No. 276 - marbled murrelet (Brachyramphus marmoratus). Pages 1-32. In: Poole, A. and F. Gill (eds). The birds of North America: Life histories for the 21st century. The Academy of Natural Sciences & The American Ornithologists' Union, Philadelphia, PA; Washington, D.C.
Nelson, S.K. 2005. Surveys for marbled murrelets in potential habitat in the Oregon coast range: draft final report prepared for the trustees council of the New Carissa oil spill and the U.S. Fish and Wildlife Service. Oregon Cooperative Fish and Wildlife Research Unit, Oregon State University, Department of Fisheries and Wildlife, Corvallis, OR, 26 pp.
Nelson, S.K. and T.E. Hamer. 1995a. Nest success and the effects of predation on marbled murrelets. Pages 89-97. In: Ralph, C.J., G.L. Hunt, M.G. Raphael, and J.F. Piatt (eds). Ecology and conservation of the marbled murrelet. General Technical Report. PSW-GTW-152. Pacific Southwest Experimental Station, U.S. Forest Service, Albany, California. 420 pp.
Nelson, S.K. and T.E. Hamer. 1995b. Nesting biology and behavior of the marbled murrelet. Pages 57-67. In: Ralph, C.J., G.L. Hunt, M.G. Raphael, and J.F. Piatt (eds). Ecology and conservation of the marbled murrelet. General Technical Report. PSW-GTW-152. Pacific Southwest Experimental Station, U.S. Forest Service, Albany, California. 420 pp.
Nelson, S.K. and R.W. Peck. 1995. Behavior of marbled murrelets at nine nest sites in Oregon. Northwestern Naturalist 76(1):43-53.
NOAA (National Oceanic and Atmospheric Administration). 1993. Olympic coast national marine sanctuary, final environmental impact statement/management plan. Washington D.C., Volumes I & II pp.
Norse, E.A. 1990. Ancient forests of the Pacific Northwest. Island Press, Washington, D.C. 327 pp.
Northwest Straits Foundation. 2007. Derelict fishing gear priority ranking project. Unpublished report prepared for the Russell Family Foundation.

36
NRC (Natural Resources Consultants, Inc.). 2007. Final report: Olympic coast national marine sanctuary derelict fishing gear removal project. Seattle, Washington, December 28, 2007, 20 pp.
Peery, M.Z., S.R. Beissinger, B.H. Becker, and S.H. Newman. 2002. Marbled murrelet (Brachyramphus marmoratus) demography in central California: 2001 Progress Report. U.S. Fish and Wildlife Service, California State Parks, 21 pp.
Peery, M.Z., L.A. Hall, J.T. Harvey, and L.A. Henkel. 2008. Abundance and productivity of marbled murrelets off central California during the 2008 breeding season. Final Report Submitted to California State Parks, Half Moon Bay, CA, September, 2008, 10 pp.
Perry, D.A. 1995. Status of forest habitat of the marbled murrelet. Pages 381-83. In: Ralph, C.J., G.L. Hunt, M.G. Raphael, and J.F. Piatt (eds). Ecology and conservation of the marbled murrelet. General Technical Report. PSW-GTW-152. Pacific Southwest Experimental Station, U.S. Forest Service, Albany, California. 420 pp.
Piatt, F.F., B.D. Roberts, W.W. Lidster, J.L. Wells, and S.A. Hatch. 1990. Effects of human disturbance on breeding least and crested auklets at St. Lawrence Island, Alaska. Auk 107:342-50.
Piatt, J.F., K.J. Kuletz, A.E. Burger, S.A. Hatch, V.L. Friesen, T.P. Birt, M.L. Arimitsu, G.S. Drew, A.M.A. Harding, and K.S. Bixler. 2007. Status review of the marbled murrelet (Brachyramphus marmoratus) in Alaska and British Columbia. U.S. Geological Survey Open-File Report 2006-1387. 258 pp.
Pierce, D.J. and T.R. Simons. 1986. The influence of human disturbance on tufted puffin breeding success. Auk 103:214-16.
Plum Creek Timber Company, L.P. 1996. Multi-species Habitat Conservation Plan on Forestlands owned by Plum Creek Timber Company, L.P., in the I-90 Corridor of the Central Cascades Mountain Range, Washington. Plum Creek Timber Company, L.P., Seattle, WA. 478 pp.
Plum Creek Timber Company, L.P. 1999. Final description and analysis of modifications to Plum Creek Timber Company's Cascade Habitat Conservation Plan. Plum Creek Timber Company, Seattle, Washington. 100 pp.
Popper, A.N. 2003. Effects of anthropogenic sounds of fishes. Fisheries 28(10):24-31.
Port Blakely Tree Farms, L.P. 1996. Habitat Conservation Plan for the Robert B. Eddy Tree Farm. Port Blakely Tree Farms, L.P., Seattle, Washington. 136 pp.

37
Ralph, C.J., G.L. Hunt, M.G. Raphael, and J.F. Piatt. 1995. Ecology and conservation of the marbled murrelet in North America: An overview. Pages 3-22. In: Ralph, C.J., G.L. Hunt, M.G. Raphael, and J.F. Piatt (eds). Ecology and conservation of the marbled murrelet. General Technical Report. PSW-GTW-152. Pacific Southwest Experimental Station, United States Department of Agriculture, Forest Service, Albany, California. 420 pp.
Raphael, M.G., D. Evans-Mack, J.M. Marzluff, and J.M. Luginbuhl. 2002. Effects of forest fragmentation on populations of the marbled murrelet. Studies in Avian Biology 25:221-35.
Raphael, M.G., G.M. Gelleher, M.H. Huff, S.L. Miller, S.K. Nelson, and R. Young. 2006. Spatially-explicit estimates of potential nesting habitat for the marbled murrelet. Pages 97-146. In: Huff, M. (ed). Northwest forest plan - the first 10 years (1994-2003): status and trend of populations and nesting habitat for the marbled murrelet - general technical report. USDA Forest Service, Portland, Oregon. 50 pp.
Raphael, M.G., J.A. Young, and B.M. Galleher. 1995. A landscape-level analysis of marbled murrelet habitat in Western Washington. Pages 177-89. In: Ralph, C.J., G.L. Hunt, M.G. Raphael, and J.F. Piatt (eds). Ecology and conservation of the marbled murrelet. General Technical Report. PSW-GTW-152. Pacific Southwest Experimental Station, U.S. Forest Service, Albany, California. 420 pp.
Raphael, M. 2005. Email on 06/01/05 to Richard Bigley, Deanna Lynch, and Zach Peery, re: 5/27 Progress Report.
Raphael, M.G., J. Baldwin, G. Falxa, M.H. Huff, M.M. Lance, S. Miller, S.F. Pearson, C.J. Ralph, C. Strong, and C. Thompson. 2007. Regional population monitoring of the marbled murrelet: Field and analytical methods. PNW-GTR-716. U.S. Department of Agriculture Forest Service, Portland, Oregon, May 2007, 70 pp.
Renwald, D. 1993. Letter to the Marbled Murrelet Recovery Team on Bureau of Indian affairs' murrelet strategy. Portland, Oregon, December 1993, 89-92 pp.
Ripple, W.J. 1994. Historic spatial patterns of old forests in western Oregon. Journal of Forestry 92(11):45-49.
Ross, B.P., J. Lien, and R.W. Furness. 2001. Use of underwater payback to reduce the impact of eiders on mussel farms. Journal of Marine Science 58:517-24.
Sanborn, S. 2005. Email on 04/07/05 to Deanna Lynch, re: Mamu calls. U.S. Fish and Wildlife.

38
Simpson Timber Company. 2000. Habitat Conservation Plan: Shelton, Washington Timberlands. Simpson Timber Company, Shelton, WA, 379 pp.
Singer, S.W., D.L. Suddjian, and S.A. Singer. 1995. Fledging, behavior, flight patterns, and forest characteristics at marbled murrelet tree nests in California. Northwestern Naturalist 76:54-62.
Speckman, S.G., J.F. Piatt, and A.M. Springer. 2003. Deciphering the social structure of marbled murrelets from behavioral observations at sea. Waterbirds 26(3):256-74.
Speckman, S.G. 1996. Marbled murrelet distribution and abundance in relation to the marine environment. Master of Science. University of Alaska Fairbanks, Fairbanks, AK. 1-89.
Steevens, C.C., K.L. Russell, M.E. Knafeic, P.F. Smith, E.W. Hopkins, and J.B. Clark. 1999. Noise-induced neurological disturbances in divers exposed to intense water-borne sound: Two case reports. Undersea and Hyperbaric Medicine 26(4):261-65.
Strachan, G., M. McAllister, and C.J. Ralph. 1995. Marbled murrelet at-sea and foraging behavior. Pages 247-53. In: Ralph, C.J., G.L. Hunt, M.G. Raphael, and J.F. Piatt (eds). Ecology and conservation of the marbled murrelet. PSW-GTR-152. U.S. Department of Agriculture, Albany, CA. 420 pp.
Strong, C.S., B.K. Keitt, W.R. McIver, C.J. Palmer, and I. Gaffney. 1995. Distribution and population estimates of marbled murrelets at sea in Oregon during the summers of 1992 and 1993. Pages 339-52. In: Ralph, C.J., G.L. Hunt, M.G. Raphael, and J.F. Piatt (eds). Ecology and conservation of the marbled murrelet. General Technical Report: PSW-GTW-152. Pacific Southwest Experimental Station, U.S. Forest Service, Albany, California. 420 pp.
Tacoma Public Utilities. 2001. Final Environmental Impact Statement and Final Habitat Conservation Plan for a multiple species incidental take permit issued to the Tacoma Water Department, for their Green River water supply and operations and watershed protection activities, King County, Washington. Tacoma, Washington, July 2001.
Teensma, P.D.A., J.T. Rienstra, and M.A. Yeiter. 1991. Preliminary reconstruction and analysis of change in forest stand age classes of the Oregon coast range from 1850 to 1940. Technical Note OR-9. Bureau of Land Management, Salem, OR, 9 pp.
Thompson, C. 2003. Telephone conversation with Emily Teachout, USFWS, regarding marbled murrelet molt period in regard to hazing.
Thorensen, A.C. 1989. Diving times and behavior of pigeon guillemots and marbled murrelets off Rosario Head, Washington. Western Birds 20:33-37.
39
Turnpenny, A. and J. Nedwell. 1994. The effects on marine fish, diving mammals and birds of underwater sound generated by seismic surveys. Fawley Aquatic Research Laboratories Limited, Marine and Freshwater Biology Unit, Southampton, Hampshire, UK, 40 pp.
Turnpenny, A., K.P. Thatcher, R. Wood, and J. Nedwell. 1994. The effects on fish and other marine animals of high-level underwater sound. Report FRR 127/94. Fawley Aquatic Research Laboratory, Ltd., Marine and Freshwater Biology Unit, Southampton, United Kingdom, 35 pp.
U.S. Department of Defense. 2002. Record of Decision for surveillance towed array sensor system low frequency active. Federal Register 67(141):48145-54.
USFS (U.S. Forest Service) and USBLM (U.S. Bureau of Land Management). 1994a. Final Supplemental Environmental Impact Statement on management of habitat for late-successional and old-growth forest related species within the range of the northern spotted owl. Portland, Oregon, 557.
USFS (U.S. Forest Service) and USBLM (U.S. Bureau of Land Management). 1994b. Record of decision for amendments to Forest Service and Bureau of Land Management planning documents within the range of the northern spotted owl; standards and guidelines for management of habitat for late-successional and old-growth forest related species within the range of the northern spotted owl. Portland, Oregon.
USFWS (U.S. Fish and Wildlife Service). 1995. Biological/Conference opinion regarding a proposed amendment to and approval of an implementation agreement for an incidental take permit (PRT-777837) held by the Murray Pacific Corporation for Mineral Tree Farm, Lewis County, Washington (FWS Reference: 1-3-95-FW-0919). June 23, 1995.
USFWS (U.S. Fish and Wildlife Service). 1996a. Intra-Service Biological Opinion on the Proposed Issuance of an Incidental Take Permit (PRT-808398) for Northern Spotted Owls, Marbled Murrelets, Grizzly Bear, Gray Wolf to Plum Creek Timber Company (FWS Reference: 1-3-96-FW-0190) and the Approval of an Unlisted Species Agreement for All Vertebrate Species. June 24, 1996, 125 pp.
USFWS (U.S. Fish and Wildlife Service). 1996b. Intra-Service Biological/Conference Opinion regarding issuance of a section 10(a)(1)(B) Incidental Take Permit (PRT-813744), and approval of Unlisted Species agreements proposed by Port Blakely Tree Farms, L.P. for the Robert B. Eddy Tree Farm, Pacific and Grays Harbor Counties, Washington (FWS Reference: 1-3-96-FW-593). July 16, 1996, 25 pp.
40
USFWS (U.S. Fish and Wildlife Service). 1997a. Intra-FWS concurrence memorandum and biological opinion on the proposed issuance of an incidental take permit (PRT- 812521) for northern spotted owls, marbled murrelets, gray wolves, grizzly bears, bald eagles, peregrine falcons, Aleutian Canada geese, Columbian white-tailed deer, and Oregon silverspot butterflies, and the approval of the implementation agreement for the Washington State Department of Natural Resources Habitat Conservation Plan (FWS Reference: 1-3-96-FW-594).
USFWS (U.S. Fish and Wildlife Service). 1997b. Recovery Plan for the threatened marbled murrelet (Brachyramphus marmoratus) in Washington, Oregon, and California. U.S. Department of the Interior, Portland, Oregon, 1997, 203 pp.
USFWS (U.S. Fish and Wildlife Service). 1999. Biological Opinion, reinitiation of Intra-Service consultation on the modification of Plum Creek's Cascades Habitat Conservation Plan to accommodate the Interstate-90 Land Exchange. Incidental Take Permit (PRT-808398) (FWS Reference: 1-3-00-FR-0245). Western Washington Fish and Wildlife Office, Lacey, WA, 84 pp.
USFWS (U.S. Fish and Wildlife Service). 2000a. Biological and conference opinion for the proposed issuance of a section 10(a)(1)(B) incidental take permit (PRT-TE020907-0) to the City of Seattle (Seattle Public Utility) for the Cedar River Watershed Habitat Conservation Plan. April 19, 2000.
USFWS (U.S. Fish and Wildlife Service). 2000b. Biological and conference opinions for the issuance of an incidental take permit to Simpson Timber Company, Northwest Operations, for Simpson Washington Timberlands Habitat Conservation Plan, in Mason, Grays Harbor and Thurston Counties, Washington (FWS Ref.: 1-3-00-FWF-2098). Western Washington Fish and Wildlife Office, Lacey, WA, October 12, 2000, 162 pp.
USFWS (U.S. Fish and Wildlife Service). 2001. Biological and conference opinions for the issuance of an incidental take permit to the City of Tacoma's Public Utilities Department, Tacoma Water, under the Tacoma Water Green River Watershed Habitat Conservation Plan (FWS Reference: 1-3-01-FWS-0101). PRT-TE-0447757-0. June 29, 2001.
USFWS (U.S. Fish and Wildlife Service). 2003a. Biological opinion and letter of concurrence for effects to bald eagles, marbled murrelets, northern spotted owls, bull trout, and designated critical habitat for marbled murrelets and northern spotted owls from Olympic National Forest program of activities for August 5, 2003, to December 31, 2008. U.S. Department of the Interior, U.S. Fish and Wildlife Service, Lacey, Washington.
USFWS (U.S. Fish and Wildlife Service). 2003b. Biomonitoring of environmental status and trends program, contaminant assessment process, final contaminant assessment process report for Dungeness NWR. 3 pp.
41
USFWS (U.S. Fish and Wildlife Service). 2004. Marbled murrelet 5-year review process: overview. Portland, Oregon, 28 pp.
USFWS (U.S. Fish and Wildlife Service). 2006. Director's memorandum on recovery units and jeopardy determinations under the Endangered Species Act. U.S. Fish and Wildlife Service, March 6, 2006.
USFWS (U.S. Fish and Wildlife Service) and NMFS (National Marine Fisheries Service). 1998. Endangered species consultation handbook: Procedures for conducting consultation and conference activities under Section 7 of the Endangered Species Act. U.S. GPO:2004-690-278. March 1998.
Washington Forest Practices Board (WFPB). 2005. Washington Forest Practices Rules - WAC 222-12-041. Washington Department of Natural Resources Forest Practices Division, Olympia, Washington.
Wasser, S.K., K. Bevis, G. King, and E. Hanson. 1997. Noninvasive physiological measures of disturbance in the northern spotted owl. Conservation Biology 11(4):1019-22.
Watanuki, Y. and A.E. Burger. 1999. Body mass and dive durations in alcids and penguins. Canadian Journal of Zoology 77:1838-42.
WDFW (Washington Department of Fish and Wildlife). 2005a. 2004 Washington state herring stock status report. Washington Department of Fish and Wildlife, Fish Program, Fish Management Division, May 2005.
WDFW (Washington Department of Fish and Wildlife). 2005b. 2004 Washington state herring stock status report. Washington Department of Fish and Wildlife, Fish Program, Fish Management Division, May 2005.
WDFW (Washington Department of Fish and Wildlife). 2005c. 2004 Washington state herring stock status report. Washington Department of Fish and Wildlife, Fish Program, Fish Management Division, May 2005.
WDFW (Washington Department of Fish and Wildlife). 2005d. 2004 Washington state herring stock status report. Washington Department of Fish and Wildlife, Fish Program, Fish Management Division, May 2005.
WDNR (Washington Department of Natural Resources). 1997. Final habitat conservation plan. WDNR, Olympia, Washington, September 1997, 546 pp.
WDOE. 2004. Oil spill prevention works, but needs to be broader. Oil Spill Scene 8(2):1-4. WDOE Publication 04-08-004.

42
WDOE. 2005. Study of tug escorts in Puget Sound. Oil Spill Scene 9(1):1-12. WDOE Publications 05-08-002.
Whitworth, D.L., S.K. Nelson, S.H. Newman, G.B. Van Vliet, and W.P. Smith. 2000. Foraging distances of radio-marked marbled murrelets from inland areas in southeast Alaska. The Condor 102(2):452-56.
Yelverton, J.T. and D.R. Richmond. 1981. Underwater explosion damage risk criteria for fish, birds, and mammals. In: 102nd Meeting of the Acoustical Society of America, 36,November 30 - December 04, Miami Beach, Florida. Department of Biodynamics, Lovelace Biomedical and Environmental Research Institute, Albuquerque, New Mexico. 36 pp.
Yelverton, J.T., D.R. Richmond, R.E. Fletcher, and R.K. Jones. 1973. Safe distances from underwater explosions for mammals and birds. Lovelace Foundation for Medical Education and Research, Albuquerque, NM, September 26, 1973, 64 pp.

71
Appendix 4: Status of the Critical Habitat: Marbled Murrelet

1
Appendix 4 Status of the Critical Habitat: Marbled Murrelet
This Opinion does not rely on the regulatory definition of “destruction or adverse modification” of critical habitat within 50 CFR 402.02. Instead, we have relied upon the statutory provisions of the Act and the August 6, 2004, Ninth Circuit Court of Appeals decision in Gifford Pinchot Task Force v. U.S. Fish and Wildlife Service (No. 03-35279) to complete the following analysis with respect to critical habitat. Critical habitat is defined in section 3(5)(A) of the Act as “the specific area within the geographic area occupied by the species on which are found those physical or biological features essential to the conservation of the species, and that may require special management considerations or protection, and specific areas outside the geographical area occupied by a species at the time it is listed, upon determination that such areas are essential for the conservation of the species.” The Act defines conservation as the procedures necessary to bring about the eventual recovery and delisting of a listed species. Legal Status The final rule designating critical habitat for the murrelet (61 FR 26256 [May 24, 1996]) became effective on June 24, 1996. Critical habitat was designation for the murrelet to addresses the objective of stabilizing population size. The principle factors affecting the murrelet and the main cause of its population decline has been the loss of older forests and associated nest sites and habitat fragmentation (57 FR 45328:45330 [October 1, 1992]). The selection criteria considered in choosing areas for inclusion in murrelet critical habitat included 1) suitable nesting habitat, 2) survey data, 3) proximity to marine foraging habitat, 4) large, contiguous blocks of nesting habitat, 5) opportunities to maintain current distribution, and 6) adequacy of existing protection and management. Primary Constituent Elements Primary constituent elements (PCEs) are the physical and biological features of critical habitat essential to a species' conservation. In the 1996 final rule designating critical habitat for the murrelet (61 FR 26255:26246 [May 24, 1996]), the Service identified two PCEs essential to provide and support suitable nesting habitat for successful reproduction. These are 1) individual trees with potential nesting platforms (PCE 1), and 2) all forested areas, regardless of contiguity, within 0.5 mi of individual trees with potential nesting platforms and a canopy height of at least one-half the site-potential tree height (PCE 2). Areas with just PCE 1, or both PCE 1 and 2 are, by definition, considered to be critical habitat. These PCEs were deemed essential for providing suitable nesting habitat for successful reproduction of the murrelet, and thus its conservation. PCEs require special management considerations.
2
Conservation Role of Critical Habitat In some areas, large blocks of Federal land can provide the necessary contribution for recovery of the species. However, in other areas, Federal ownership is limited and Federal lands alone cannot meet the recovery needs of murrelets to reverse the current population decline and maintain a well-distributed population. Critical habitat helps focus conservation activities by identifying area that contain essential habitat features (PCEs) thus alerting Federal agencies and the public to the importance of an area in the species’ conservation. Critical habitat also identifies area that may require special management or protection (61 FR 26255:26263 [May 24, 1996]). Activities that May Affect PCEs The final rule (61 FR 26255:26271[May 24, 1996]) states that “A variety of ongoing or proposed activities that disturb or remove primary constituent elements may adversely affect, though not necessarily ‘adversely modify’ murrelet critical habitat as that term is used in section 7 consultations. Examples of such activities include 1) forest management activities which greatly reduce stand canopy closure, appreciably alter the stand structure, or reduce the availability of nesting sites, 2) land disturbance activities such as mining, sand and gravel extraction, construction of hydroelectric facilities and road building, and 3) harvest of certain types of commercial forest products (e.g., moss [Bryophyta] and salal [Gaultheria shallon])." Ultimately, actions may alter PCEs if they remove or degrade forest habitat, or prevent or delay future attainment of suitable habitat. Distribution of Critical Habitat The designated CHUs are distributed more or less evenly across the range of the species in Washington and Oregon, and less so in California. At the time of listing, designated critical habitat lands included 695 of the over 807 known-occupied sites on Federal lands, and 218 of the 354 known-occupied sites on non-Federal lands. Sites in Redwood National Park in California had not been entered into the database at the time or listing. Further, the Service did not include the marine environment in critical habitat, but instead relied on other existing regulations for protection of this area. Thirty-two critical habitat units (CHUs) totaling 3,887,800 acres were designated on Federal, state, county, city, and private lands in Washington, Oregon, and California (61 FR 26255:26269[May 24, 1996]) (Table 1). These individual units are coded by the state in which they occur and are individually numbered by unit and sub-unit (e.g., WA-01-a, OR-01-a, CA-01-a). The majority of these CHUs (78 percent) occur on Federal lands. In the selection of CHUs, there was a reliance on lands designated as Late Successional Reserves (LSRs) on Forest Service land. Most LSRs within the range of the murrelet in Washington, Oregon, and California were designated as critical habitat. LSRs, as described in the Northwest Forest Plan, are most likely to develop into large blocks of suitable murrelet nesting habitat given sufficient time.

3
Table 1. Designated critical habitat by state, ownership, and land allocation.
State Ownership Land Allocation Designated Critical Habitat
(hectares)
Designated Critical Habitat (acres)
Congressionally Withdrawn Lands
740 1,800
Late Successional Reserves 485,680 1,200,200
Federal Lands
Federal Total 486,240 1,202,000State Lands 172,720 426,800 Private Lands 1,020 2,500 Non-Federal Total 173,740 429,300
Washington
Non-Federal Lands
Washington’s Overall Total 659,980 1,631,300Federal Lands Late Successional Reserves 541,530 1,338,200
State Lands 70,880 175,100 County Lands 440 1,100
Oregon Non-Federal Lands
Private Lands 350 900 Federal Lands Late Successional Reserves 193,150 477,300
State Lands 71,040 175,500 California (Northern) Non-Federal Lands
Private Lands 16,360 40,400 State Lands 14,080 34,800 County Lands 3,200 8,000 City Lands 400 1,000 Private Lands 1,720 4,200
California (Central)
Non-Federal Lands
Overall Total 1,573,392 3,887,800 Although most of the areas designated as murrelet critical habitat occur on Federal lands, the Service designated selected non-Federal lands that met the selection criteria. These lands occurred in areas where Federal lands were insufficient to provide suitable nesting habitat for the recovery of the species. On non-Federal lands, 21 percent of critical habitat acres occur on state lands, 1.2 percent on private lands, 0.2 percent on county lands, and 0.003 percent on city lands. CHUs do not include non-Federal lands covered by a legally operative incidental take permit for murrelets issued under section 10(a) of the Act (61 FR 26255:26278[May 24, 1996]). Therefore, critical habitat designations were excluded on state lands upon completion of the Habitat Conservation Plans that addresses conservation of the murrelet. State lands in Washington, Oregon and California currently operate under approved Habitat Conservation Plans. Critical Habitat in Washington State Washington contains 11 CHUs that total approximately 1,206,000 acres (Table 1) (excluding 426,800 acres of State land managed under a WDNR HCP). The acreage of land protected by critical habitat and the WDNR (1997) HCP represents 42 percent of critical habitat within the listed range. Each CHU is made up of between two and seven subunits that range from 191 acres to over 100,000 acres in size. Also, CHUs range between 9 to 53 percent potential nesting habitat.
4
In Washington State, there is a clear reliance on Federal lands to fulfill the functions for which critical habitat was designated. Eight CHUs contain exclusively Federal lands while one contains both Federal and private lands. These nine CHUs contain 78 percent of the total acreage of CHUs in Washington State. Critical habitat functions are also met by Federal lands not designated as critical habitat in National Parks, Wilderness Areas, and portions of Forest Service lands designated as Adaptive Management Areas and Matrix lands that were found to be occupied by murrelets. Current Condition of Critical Habitat in Washington The quality of forests occurring within the boundaries of the CHUs ranges from non-habitat (e.g., young plantations) to high-quality habitat (e.g., large blocks of old-growth forest). While significant amounts of high-quality murrelet habitat are present in some of the CHUs, much of the habitat in CHUs, particularly on non-Federal lands, is of lesser quality due to its occurrence in smaller, more fragmented blocks. Some of the highest quality murrelet habitat occurs in National Parks and designated Wilderness Areas where harvest historically has not occurred. Given the high quality of this habitat and reduced threat of habitat loss or modification due to management objectives, designation of critical habitat was deemed unnecessary in National Parks and Wilderness Areas. We estimate that an insignificant amount of critical habitat has been removed or downgraded as a result of section 7 consultations. In Washington, there has been almost no loss of critical habitat due to timber harvest or major fires. The majority of critical habitat loss has been through landslides and blow-down. In Washington, section 7 consultations are based on the amounts of critical habitat addressed in the final rule. The Service is currently in the process of assessing the current condition of murrelet critical habitat in Oregon and California. Summary Murrelet critical habitat was designated in 1996 due to the high rate of nesting habitat loss and fragmentation. The objective of the designation was to stabilize the murrelet population size. Washington contains 11 CHUs and totals 1,204,000 acres, the majority of which is on Federal land. The Service identified two primary constituent elements for the CHU, specifically 1) individual trees with potential nesting platforms, and 2) forested areas within 0.5 mi of individual trees with potential nesting platforms and a canopy height of at least one-half the site-potential tree height. Most of the areas designated as murrelet critical habitat occur on Federal land. The highest quality critical habitat occurs on National Parks and Wilderness areas where harvest historically has not occurred. Designating critical habitat in these areas was deemed unnecessary.
LITERATURE CITED WDNR 1997. Final Habitat Conservation Plan Printed by WDNR, Olympia Washington.
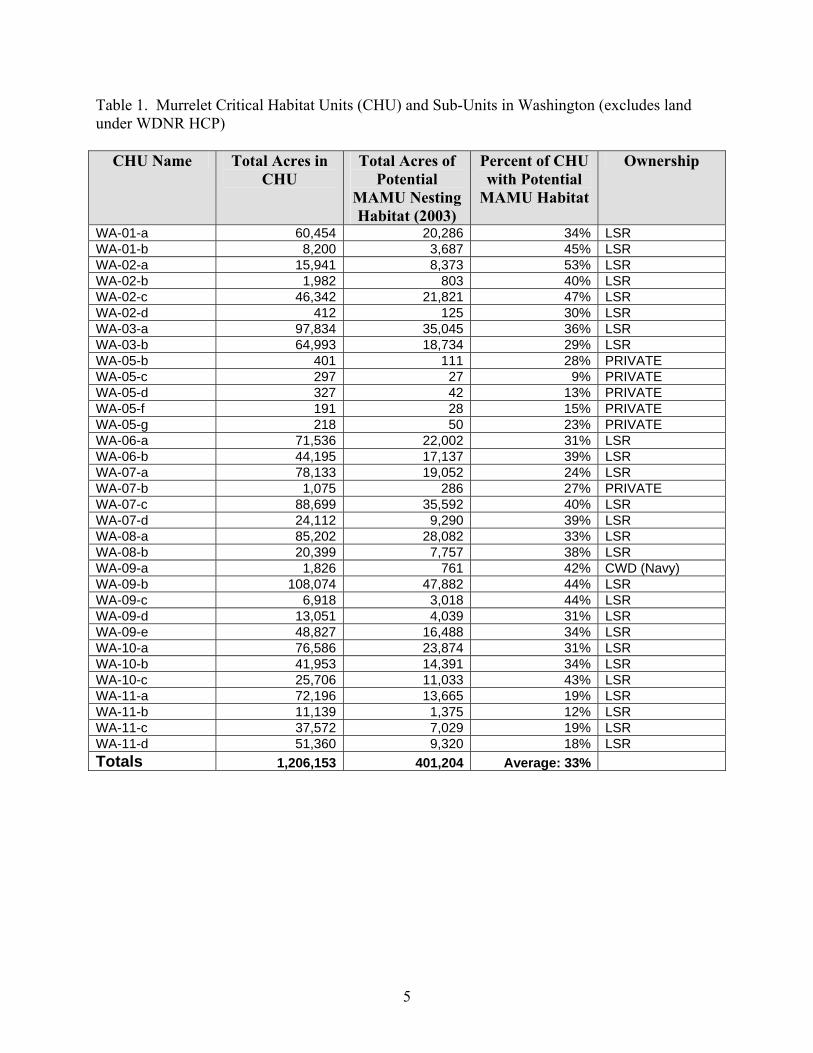
5
Table 1. Murrelet Critical Habitat Units (CHU) and Sub-Units in Washington (excludes land under WDNR HCP)
CHU Name Total Acres in CHU
Total Acres of Potential
MAMU Nesting Habitat (2003)
Percent of CHU with Potential
MAMU Habitat
Ownership
WA-01-a 60,454 20,286 34% LSR WA-01-b 8,200 3,687 45% LSR WA-02-a 15,941 8,373 53% LSR WA-02-b 1,982 803 40% LSR WA-02-c 46,342 21,821 47% LSR WA-02-d 412 125 30% LSR WA-03-a 97,834 35,045 36% LSR WA-03-b 64,993 18,734 29% LSR WA-05-b 401 111 28% PRIVATE WA-05-c 297 27 9% PRIVATE WA-05-d 327 42 13% PRIVATE WA-05-f 191 28 15% PRIVATE WA-05-g 218 50 23% PRIVATE WA-06-a 71,536 22,002 31% LSR WA-06-b 44,195 17,137 39% LSR WA-07-a 78,133 19,052 24% LSR WA-07-b 1,075 286 27% PRIVATE WA-07-c 88,699 35,592 40% LSR WA-07-d 24,112 9,290 39% LSR WA-08-a 85,202 28,082 33% LSR WA-08-b 20,399 7,757 38% LSR WA-09-a 1,826 761 42% CWD (Navy) WA-09-b 108,074 47,882 44% LSR WA-09-c 6,918 3,018 44% LSR WA-09-d 13,051 4,039 31% LSR WA-09-e 48,827 16,488 34% LSR WA-10-a 76,586 23,874 31% LSR WA-10-b 41,953 14,391 34% LSR WA-10-c 25,706 11,033 43% LSR WA-11-a 72,196 13,665 19% LSR WA-11-b 11,139 1,375 12% LSR WA-11-c 37,572 7,029 19% LSR WA-11-d 51,360 9,320 18% LSR Totals 1,206,153 401,204 Average: 33%