
In Partnership with: The ONLY Hospice report including Hospital, SNF & Home Health Info!
63
Texas & New Mexico 2011 State Hospice Organization Report 2009 Medicare Data 1/19/11 In Partnership with: The ONLY Hospice report including Hospital, SNF & Home Health Info!
-
Upload
arlene-chandler -
Category
Documents
-
view
217 -
download
0
Transcript of In Partnership with: The ONLY Hospice report including Hospital, SNF & Home Health Info!

Texas & New Mexico 2011 State Hospice Organization Report
2009 Medicare Data1/19/11
In Partnership with:
The ONLY Hospice report including Hospital, SNF &
Home Health Info!
This is a State Hospice Organization Report completed for the Texas & New Mexico Hospice Organization.
This report is created from the most current 100% publically available data files from CMS, U.S. Census, CDC, and others. It is organized by county-specific information followed service area (i.e., all requested counties), state, and national aggregated information.
Medicare Data Year= 2009.
Questions or comments, please contact:Hospice Analytics, Inc.Cordt T. Kassner, PhD, Principal2355 Rossmere StreetColorado Springs, CO 80919P: 719-209-1237E: [email protected]: www.HospiceAnalytics.com
Texas & New Mexico Hospice Organization2011 State Hospice Organization Report (2009 Medicare Data)
Texas & New Mexico Hospice Organization 2
Suggestions on applying information in this report:1. Understand current trends regarding access to and utilization of hospice
services in your area – and how that compares to state and national trends.
2. How can access to and utilization of hospice services be strengthened in your area and across your state?
3. Using this information, is it possible to identify target populations as a starting place (e.g., target specific diagnoses with low hospice utilization, or outreach to hospital or skilled nursing facility providers caring for dying patients, etc.)?
4. Identify areas of high hospice access and utilization in your state (or perhaps a nearby state) – what can be learned from them? How might partnerships be formed and best practices shared? How can your state hospice organization help?
5. How might this information be used in statewide advocacy, regulatory, and education efforts?
6. What other questions do you have? How can information in the Medicare claims data, cost reports, etc., help provide an evidence-base for decision-making? How can your state hospice organization help?
Texas & New Mexico Hospice Organization 2011 State Hospice Organization Report (2009 Medicare Data)
Texas & New Mexico Hospice Organization 3

Report Sections:
1. State Information2. Who Was Missed?3. County Information4. National Information5. Hospitals, SNFs, and HHAs
Texas & New Mexico Hospice Organization 4

Texas New Mexico
Population 24,782,302 2,009,671
Total Deaths163,758
0.7% of population15,562
0.8% of population
Medicare Beneficiaries 3,051,891 318,375
Medicare Beneficiary Deaths121,653
74% of total deaths11,619
75% of total deaths
Medicare Hospice Patient Admissions79,557
49% of total deaths65% of Medicare deaths
7,78550% of total deaths
67% of Medicare deaths
Medicare Hospice Patient Deaths53,114
32% of total deaths43.7% of Medicare deaths
4,94332% of total deaths
42.5% of Medicare deaths
2009 Demographics & Hospice Utilization
Texas & New Mexico Hospice Organization 5
Texas & New Mexico Hospice Organization 6

Thro
ckm
orto
nG
lassc
ock
McM
ullen
Hem
phill
Cran
eAr
cher
Oldh
amSh
erm
anHa
nsfo
rdHa
llAn
drew
sSh
acke
lford
Rand
allSo
mer
vell
Ster
ling
Potte
rIri
onAr
mst
rong
Fran
klin
Midl
and
Men
ard
Conc
hoJo
hnso
nHu
tchin
son
Collin
gswo
rthM
oore
Deaf
Sm
ithBr
iscoe
Gra
yG
illesp
ieSt
onew
allTa
ylor
Hood
Youn
gSm
ithEc
tor
Willi
amso
nFl
oyd
Wich
itaTo
m G
reen
Falls
Hays
Ellis
Kend
allCa
stro
McL
enna
nEa
stlan
dSw
isher
Trav
isG
regg
0.0%
10.0%
20.0%
30.0%
40.0%
50.0%
60.0%
70.0%
80.0%
90.0%77
.8%
75.0
%75
.0%
74.1
%73
.1%
71.7
%68
.8%
68.8
%65
.9%
65.6
%64
.3%
63.9
%63
.3%
62.7
%62
.5%
62.0
%61
.5%
60.9
%60
.0%
59.5
%59
.1%
58.6
%58
.4%
58.3
%57
.9%
57.8
%57
.6%
57.1
%56
.8%
56.7
%56
.3%
55.6
%55
.2%
54.9
%54
.5%
53.9
%53
.9%
53.8
%53
.2%
52.6
%52
.6%
52.6
%52
.5%
52.3
%52
.3%
52.1
%51
.7%
51.7
%51
.7%
51.4
%
Texas County-Level Hospice Utilization Top 50 Counties (slide 1 of 5) Hospice Utilization= Medicare Hospice Deaths / Medicare Total Deaths
Texas & New Mexico Hospice Organization 7
Clay
Daws
onCa
llaha
nCo
keTa
rrant
Band
era
Kerr
Step
hens
Com
alBo
rden
Robe
rtsUp
shur
Mon
tgom
ery
Runn
elsTi
tus
Hard
inG
oliad
Hend
erso
nCo
ryell
Brow
nHo
ward
Ande
rson
Knox Be
llG
arza
Park
erRu
skCh
erok
eeG
aines
San
Jacin
toPe
cos
Sutto
nBe
xar
Wise
Lam
bDo
nley
Rains Le
eM
ason
Med
inaEr
ath
Faye
tteM
cCull
och
War
dPo
lkFr
eest
one
Jack
Jack
son
Child
ress
Mila
m
43.0%
44.0%
45.0%
46.0%
47.0%
48.0%
49.0%
50.0%
51.0%
52.0%51
.4%
51.4
%51
.3%
51.2
%51
.2%
51.1
%51
.1%
51.1
%50
.9%
50.0
%50
.0%
49.8
%49
.6%
49.5
%49
.5%
49.5
%49
.1%
49.1
%49
.0%
48.9
%48
.9%
48.9
%48
.8%
48.7
%48
.6%
48.4
%48
.4%
48.1
%48
.1%
48.1
%48
.0%
48.0
%47
.9%
47.8
%47
.7%
47.6
%47
.6%
47.5
%47
.5%
47.5
%47
.3%
47.3
%47
.3%
47.1
%47
.0%
46.9
%46
.8%
46.3
%46
.2%
46.1
%
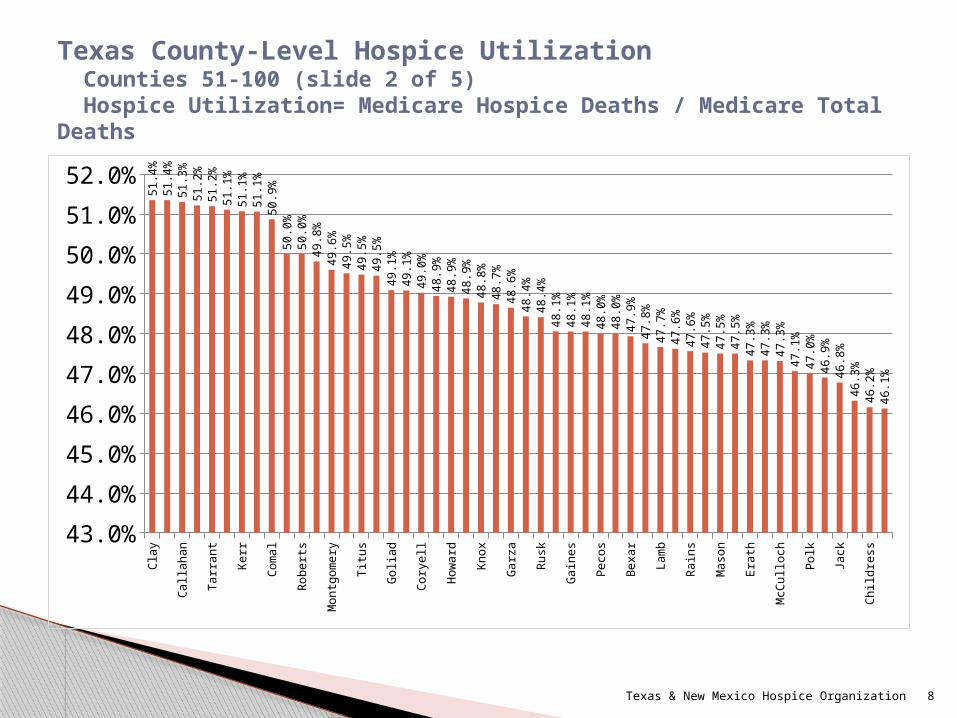
Texas County-Level Hospice Utilization Counties 51-100 (slide 2 of 5) Hospice Utilization= Medicare Hospice Deaths / Medicare Total Deaths
Texas & New Mexico Hospice Organization 8

Mor
risHo
ckley
Van
Zand
tJa
sper
Blan
coKa
ufm
anBa
stro
pO
rang
eG
rays
onPa
nola
Lubb
ock
Hard
eman
Caldw
ellCa
rson
Mills
Limes
tone
Terry
Burn
etCo
llinCo
ttle
Wils
onJe
ffers
onHa
leSa
n Sa
baW
alker
Harri
son
Croc
kett
Schle
icher
Dalla
sJo
nes
Wha
rton
Rock
wall
Dent
onDi
cken
sBr
azor
ia Hill
Hask
ellNo
lanUp
ton
Bosq
ueCo
lorad
oW
illacy
Lam
pasa
sKa
rnes
Cham
bers
Fann
inM
atag
orda
Yoak
umSa
n Pa
tricio
Naco
gdoc
hes37.0%
38.0%
39.0%
40.0%
41.0%
42.0%
43.0%
44.0%
45.0%
46.0%
47.0%45
.8%
45.7
%45
.6%
45.5
%45
.3%
45.2
%45
.1%
45.0
%44
.9%
44.9
%44
.6%
44.2
%44
.1%
44.0
%44
.0%
43.9
%43
.9%
43.9
%43
.8%
43.8
%43
.7%
43.7
%43
.6%
43.5
%43
.5%
43.5
%43
.5%
43.5
%43
.3%
43.2
%43
.2%
43.1
%42
.9%
42.9
%42
.8%
42.3
%42
.1%
42.1
%42
.1%
42.0
%41
.9%
41.8
%41
.5%
41.3
%41
.2%
41.0
%40
.7%
40.4
%40
.4%
40.4
%
Texas County-Level Hospice Utilization Counties 101-150 (slide 3 of 5) Hospice Utilization= Medicare Hospice Deaths / Medicare Total Deaths
Texas & New Mexico Hospice Organization 9
Galv
esto
nW
ashin
gton
Kinn
eyW
heele
rBo
wie
Atas
cosa
Och
iltree Bee
Aran
sas
Hunt
Fort
Bend
Nava
rroLa
vaca
Harri
sNe
wton
Tyler
Mon
tagu
eKi
mble
Baile
ySh
elby
El P
aso
DeW
ittW
ood
Ham
ilton
Mitc
hell
Leon
Liber
tyFi
sher
Wall
erPa
lo Pi
nto
Llano
Vict
oria
Dalla
mW
inkler
Cook
eNu
eces
Parm
erCr
osby
Braz
osCo
man
che
Mot
leyKl
eber
gCa
ssG
uada
lupe
Cam
pDu
val
Foar
dBa
ylor
Mar
ionAn
gelin
a32.0%
33.0%
34.0%
35.0%
36.0%
37.0%
38.0%
39.0%
40.0%
41.0%40
.3%
40.1
%40
.0%
40.0
%40
.0%
39.8
%39
.7%
39.6
%39
.6%
39.4
%39
.3%
39.2
%39
.0%
39.0
%38
.8%
38.8
%38
.7%
38.6
%38
.5%
38.3
%38
.3%
38.2
%38
.2%
38.2
%38
.0%
38.0
%37
.9%
37.7
%37
.7%
37.7
%37
.7%
37.6
%37
.5%
37.5
%37
.4%
37.4
%37
.2%
37.1
%36
.9%
36.9
%36
.8%
36.5
%36
.4%
36.4
%35
.8%
35.7
%35
.7%
35.6
%35
.4%
35.4
%
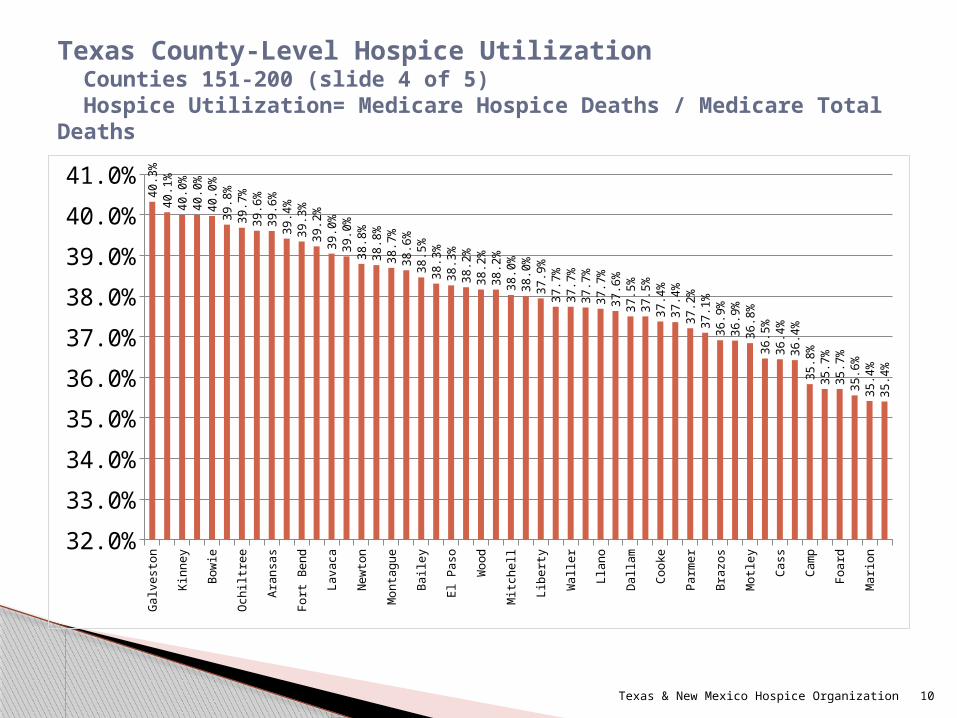
Texas County-Level Hospice Utilization Counties 151-200 (slide 4 of 5) Hospice Utilization= Medicare Hospice Deaths / Medicare Total Deaths
Texas & New Mexico Hospice Organization 10
Refu
gioAu
stin
Real
Gon
zales
Uvald
eCo
leman
Scur
ryW
ilbar
ger
Burle
son
Sabin
eLy
nnRe
d Ri
ver
Coch
ran
Frio
Mar
tinSa
n Au
gust
ineRo
berts
onCa
mer
onCa
lhoun
Live
Oak
Reev
esJim
Hog
gM
adiso
nZa
vala
Trini
tyLip
scom
bG
rimes
Hopk
insHu
dspe
thJim
Well
sBr
ooks
Dim
mit
Kent
Terre
llRe
agan
Edwa
rds
Hous
ton
Val V
erde
Culbe
rson
Hida
lgoLa
mar
Mav
erick
Hartl
eyJe
ff Da
visBr
ewst
erPr
esidi
oDe
ltaLa
Sall
eSt
arr
Web
bZa
pata
Kene
dyKi
ngLo
ving0.0%
5.0%
10.0%
15.0%
20.0%
25.0%
30.0%
35.0%
40.0%35
.2%
35.2
%35
.1%
35.0
%34
.7%
34.6
%34
.6%
34.5
%34
.4%
34.4
%34
.1%
34.0
%33
.3%
33.3
%32
.1%
32.1
%31
.9%
31.0
%31
.0%
30.4
%30
.1%
29.4
%29
.1%
28.8
%28
.4%
28.1
%28
.0%
27.8
%27
.8%
27.6
%25
.9%
25.4
%25
.0%
25.0
%23
.5%
23.3
%22
.9%
22.5
%21
.4%
21.0
%21
.0%
21.0
%20
.0%
20.0
%17
.7%
15.8
%15
.6%
14.7
%14
.2%
9.3%
1.3%
0.0%
0.0%
0.0%
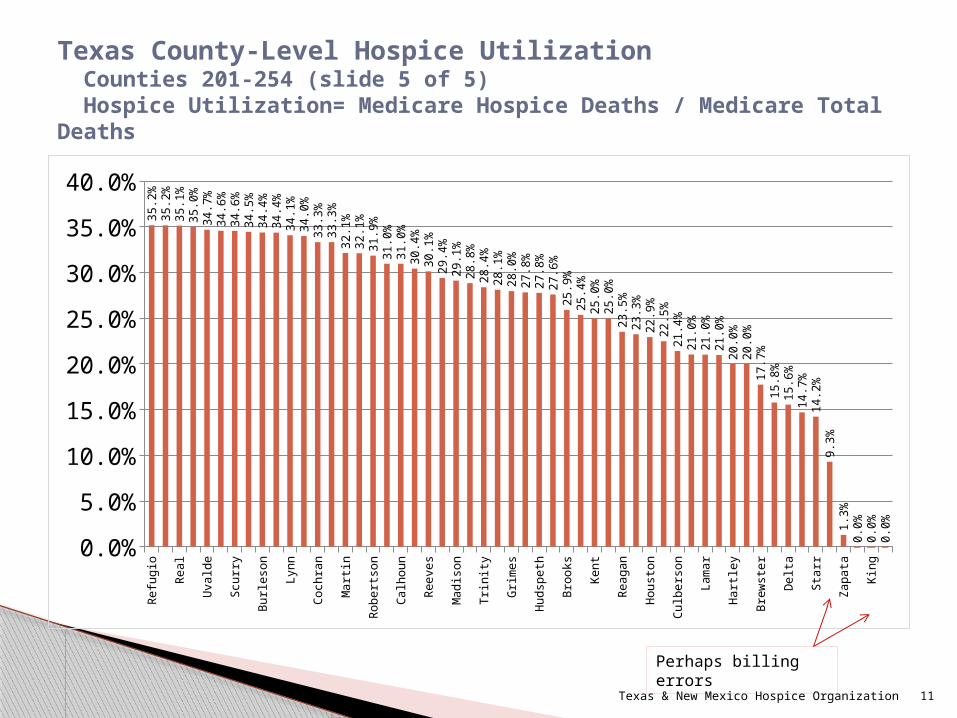
Texas County-Level Hospice Utilization Counties 201-254 (slide 5 of 5) Hospice Utilization= Medicare Hospice Deaths / Medicare Total Deaths
Perhaps billing errors
Texas & New Mexico Hospice Organization 11
Sant
a Fe
Sand
oval
Bern
alillo
Torra
nce
Valen
cia
DeBa
ca Lea
Curry
Roos
evelt
Dona
Ana
Catro
n
Chav
es
Gra
nt
Linco
ln
Eddy
Cibo
la
Luna
Rio
Arrib
a
Hida
lgo
Ote
ro
Qua
y
Gua
dalup
e
Soco
rro
Mor
a
Union
San
Migu
el
Sier
ra
Los
Alam
os
San
Juan
Hard
ing
McK
inley
Taos
Colfa
x0.0%
10.0%
20.0%
30.0%
40.0%
50.0%
60.0%53
.6%
53.4
%
52.2
%
51.9
%
51.5
%
50.0
%
49.7
%
47.7
%
47.4
%
45.2
%
43.5
%
41.8
%
38.5
%
36.3
%
36.2
%
36.2
%
35.6
%
34.6
%
34.1
%
31.5
%
31.5
%
28.9
%
25.2
%
22.6
%
22.6
%
20.3
%
19.4
%
19.0
%
16.9
%
14.3
%
12.7
%
12.6
%
6.3%
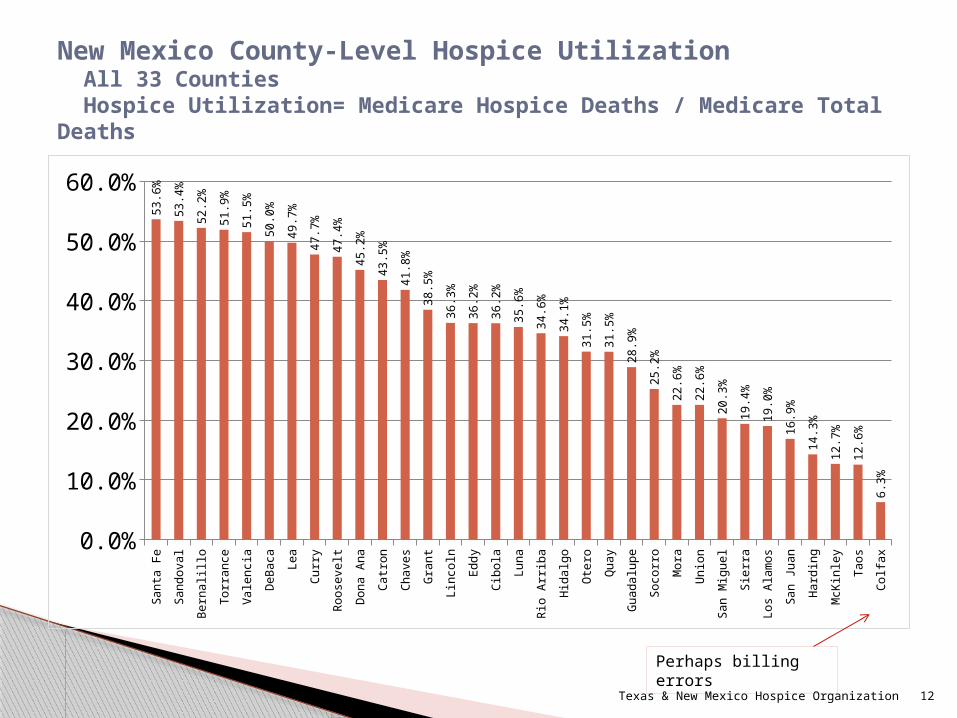
New Mexico County-Level Hospice Utilization All 33 Counties Hospice Utilization= Medicare Hospice Deaths / Medicare Total Deaths
Perhaps billing errors
Texas & New Mexico Hospice Organization 12
Arizon
a 1
Utah 2
Florida
3
Delaware
4
Iowa
5
Oregon
6
Colorad
o 7
Rhode
Islan
d 8
Michiga
n 9
Kansa
s 10
Ohio 1
1
Texas
12
Georgi
a 13
New M
exico
14
Nebras
ka 1
5
Nevad
a 16
Wiscon
sin 1
7
Idaho
18
Missou
ri 19
Minnes
ota 2
0
Nation
al
Washin
gton
21
Penns
lyvan
ia 22
Illinois
23
South
Carolina
24
New Je
rsey
25
New H
amsh
ire 2
6
North C
arolina
27
Maine
28
Louis
iana
29
Alabam
a 30
Massa
chus
etts
31
Californ
ia 32
Conne
cticu
t 33
Indian
a 34
Oklaho
ma 35
Tenne
ssee
36
Marylan
d 37
Montan
a 38
Virginia
39
West V
irginia
40
Arkans
as 4
1
Kentuc
ky 4
2
South
Dakota
43
Mississ
ippi 4
4
Hawaii
45
Distric
t of C
olumbia
46
North D
akota
47
Vermon
t 48
New York
49
Wyoming
50
Alaska
51
0%
10%
20%
30%
40%
50%
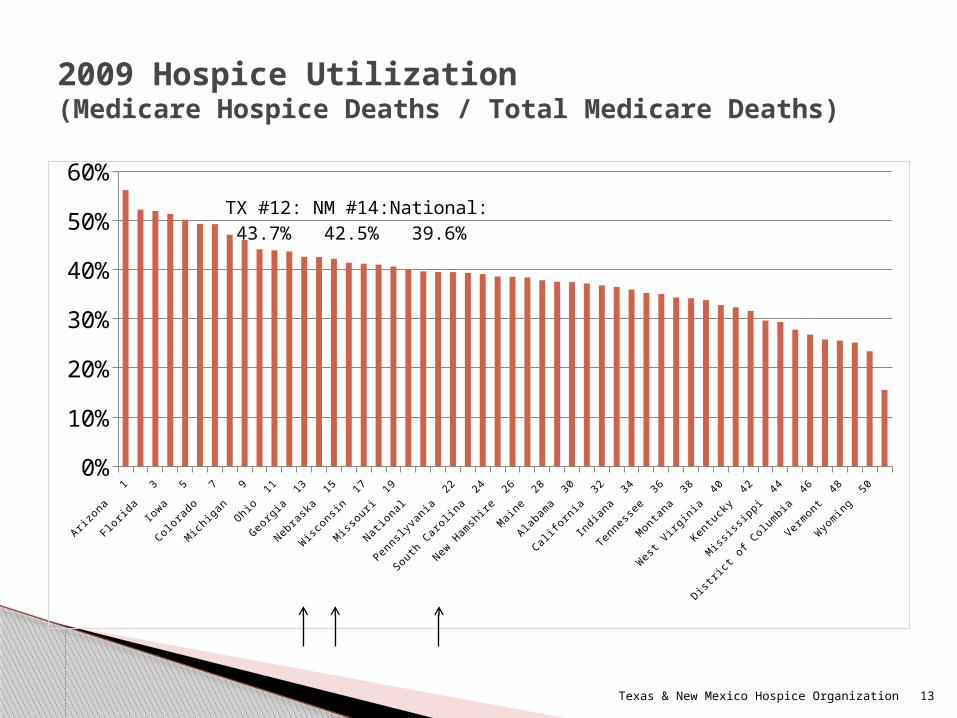
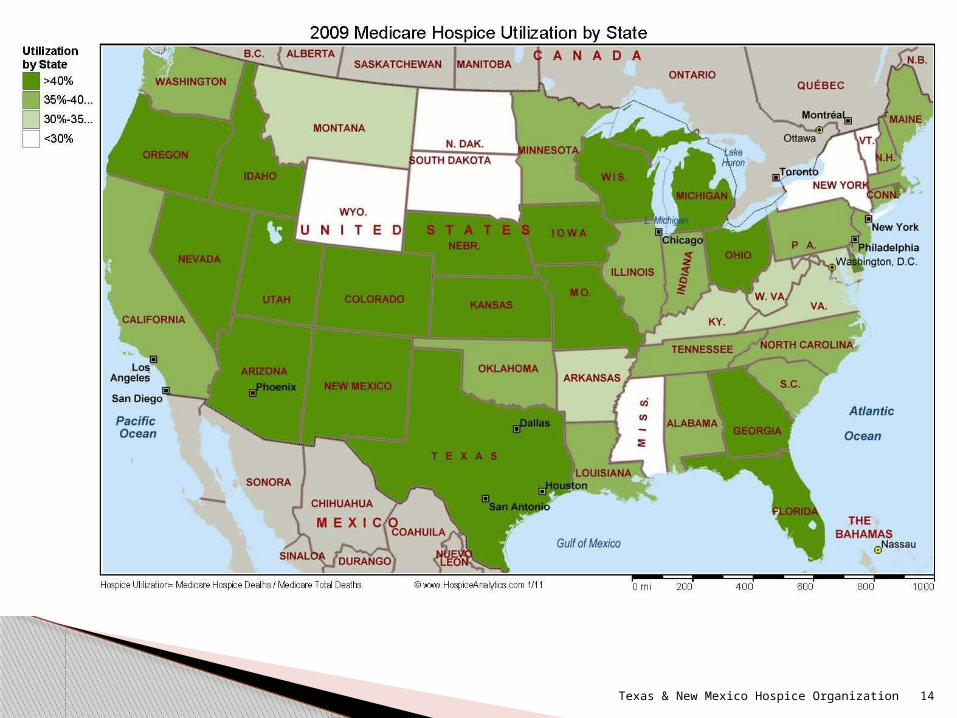
60%TX #12:43.7%
National:39.6%
NM #14:42.5%
2009 Hospice Utilization(Medicare Hospice Deaths / Total Medicare Deaths)
Texas & New Mexico Hospice Organization 13
Texas & New Mexico Hospice Organization 14

2009 Total Hospice PatientsNational= 1,079,676
Florida
1
Californ
ia 2
Texas
3
Penns
ylvan
ia 4
Ohio 5
Michiga
n 6
Illinois
7
New York
8
North C
arolina
9
Georgi
a 10
Arizon
a 11
New Je
rsey
12
Missou
ri 13
Alabam
a 14
Virginia
15
Indian
a 16
Tenne
ssee
17
Massa
chus
etts
18
Wiscon
sin 1
9
South
Carolina
20
Washin
gton
21
Oklaho
ma 22
Louis
iana
23
Oregon
24
Minnes
ota 2
5
Colorad
o 26
Iowa
27
Marylan
d 28
Mississ
ippi 2
9
Kentuc
ky 3
0
Kansa
s 31
Arkans
as 3
2
Conne
cticu
t 33
Utah 3
4
Nevad
a 35
West V
irginia
36
New M
exico
37
Nebras
ka 3
8
Idaho
39
Maine
40
Rhode
Islan
d 41
Delaware
42
New H
amps
hire
43
Montan
a 44
Hawaii
45
South
Dakota
46
North D
akota
47
Vermon
t 48
Distric
t of C
olumbia
49
Wyoming
50
Alaska
51
0
10,000
20,000
30,000
40,000
50,000
60,000
70,000
80,000
90,000
100,000TX #3:79,557
Texas & New Mexico Hospice Organization 15
NM #37:7,875

Texas & New Mexico Hospice Organization 16

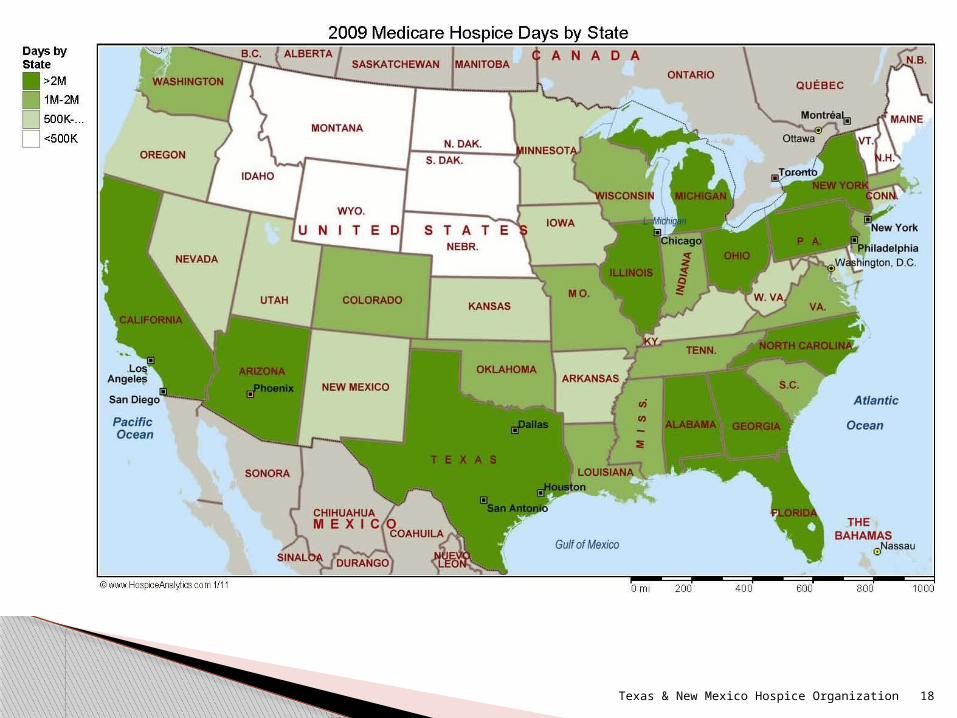
2009 Total Days of Hospice CareNational= 76,724,901 Days
Florida
1
Californ
ia 3
Ohio 5
Michiga
n 7
Arizon
a 9
Illinois
11
Missou
ri 13
Oklaho
ma 15
Virginia
17
Indian
a 19
Wiscon
sin 2
1
Massa
chus
etts
23
Colorad
o 25
Oregon
27
Kansa
s 29
Marylan
d 31
Arkans
as 3
3
West V
irginia
35
Nevad
a 37
Delaware
39
Rhode
Islan
d 41
New H
amps
hire
43
Hawaii
45
North D
akota
47
Vermon
t 49
Alaska
51
0
1,000,000
2,000,000
3,000,000
4,000,000
5,000,000
6,000,000
7,000,000
8,000,000TX #2:
6,391,782
Texas & New Mexico Hospice Organization 17
NM #34:677,755
Texas & New Mexico Hospice Organization 18

Mississ
ippi
1
Alabam
a 3
Delaware
5
South
Carolina
7
Louis
iana
9
Texas
11
Missou
ri 13
Florida
15
North C
arolina
17
Nation
al
Rhode
Islan
d 20
Tenne
ssee
22
Ohio 2
4
Indian
a 26
New Je
rsey
28
Maine
30
Iowa
32
Montan
a 34
Kentuc
ky 3
6
Michiga
n 38
New H
amps
hire
40
Oregon
42
South
Dakota
44
Washin
gton
46
Marylan
d 48
Alaska
50
-
20
40
60
80
100
120
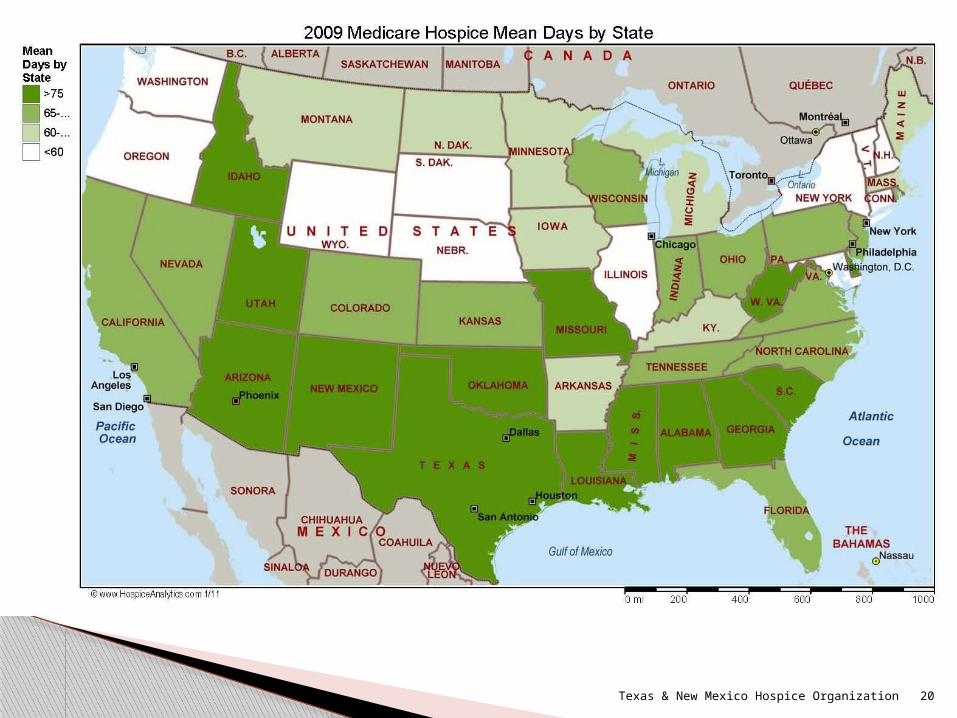
2009 Mean Days / Patient of Hospice Care
TX #11:80
National:71
Texas & New Mexico Hospice Organization 19
NM #6:87
Texas & New Mexico Hospice Organization 20

Mississ
ippi
1
Utah 3
Delaware
5
South
Carolina
7
Arizon
a 9
Georgi
a 11
Missou
ri 13
Texas
15
West V
irginia
17
Montan
a 19
Colorad
o 21
New H
amps
hire
23
Nation
al
Maine
26
Vermon
t 28
Florida
30
North D
akota
32
Tenne
ssee
34
Nevad
a 36
Rhode
Islan
d 38
Kentuc
ky 4
0
Hawaii
42
New Je
rsey
44
Alaska
46
New York
48
Illinois
50
-
10
20
30
40
50
60
2009 Median Days / Patient of Hospice Care
National:24
TX #15:27
Texas & New Mexico Hospice Organization 21
NM #8:36

Texas & New Mexico Hospice Organization 22
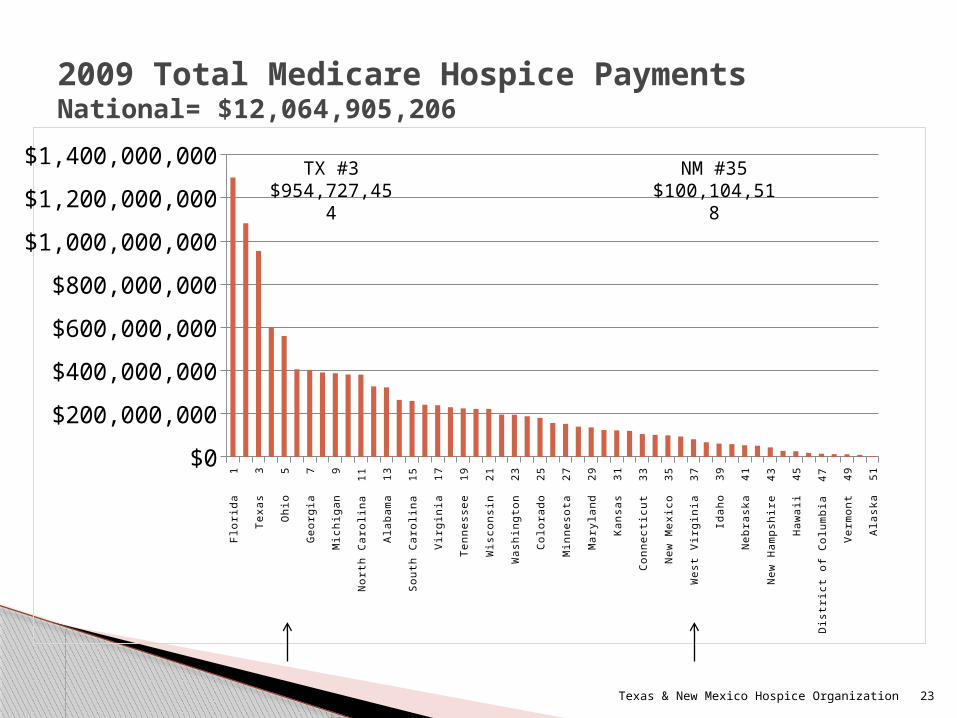
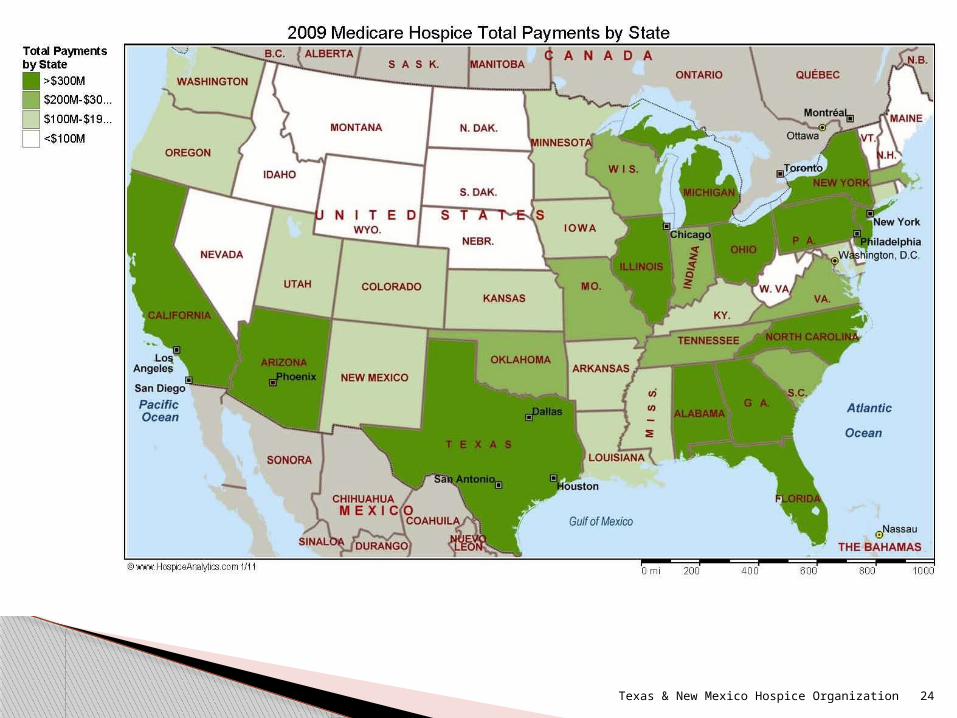
2009 Total Medicare Hospice PaymentsNational= $12,064,905,206
Flor
ida
1C
alifo
rnia
2
Texa
s 3
Penn
sylv
ania
4
Ohi
o 5
Ariz
ona
6G
eorg
ia
7Ill
inoi
s 8
Mic
higa
n 9
New
Yor
k 1
0N
orth
Car
olin
a 1
1N
ew J
erse
y 1
2Al
abam
a 1
3M
isso
uri
14So
uth
Car
olin
a 1
5O
klah
oma
16
Virg
inia
17
Mas
sach
uset
ts 1
8Te
nnes
see
19
Indi
ana
20
Wis
cons
in 2
1Lo
uisi
ana
22
Was
hing
ton
23
Mis
siss
ippi
24
Col
orad
o 2
5O
rego
n 2
6M
inne
sota
27
Iow
a 2
8M
aryl
and
29
Kent
ucky
30
Kans
as 3
1U
tah
32
Con
nect
icut
33
Arka
nsas
34
New
Mex
ico
35
Nev
ada
36
Wes
t Virg
inia
37
Del
awar
e 3
8Id
aho
39
Rho
de Is
land
40
Neb
rask
a 4
1M
aine
42
New
Ham
pshi
re 4
3M
onta
na 4
4H
awai
i 45
Sout
h D
akot
a 4
6D
istri
ct o
f Col
umbi
a 4
7N
orth
Dak
ota
48
Verm
ont
49W
yom
ing
50
Alas
ka 5
1$0
$200,000,000
$400,000,000
$600,000,000
$800,000,000
$1,000,000,000
$1,200,000,000
$1,400,000,000NM #35
$100,104,518
Texas & New Mexico Hospice Organization 23
TX #3$954,727,454
Texas & New Mexico Hospice Organization 24

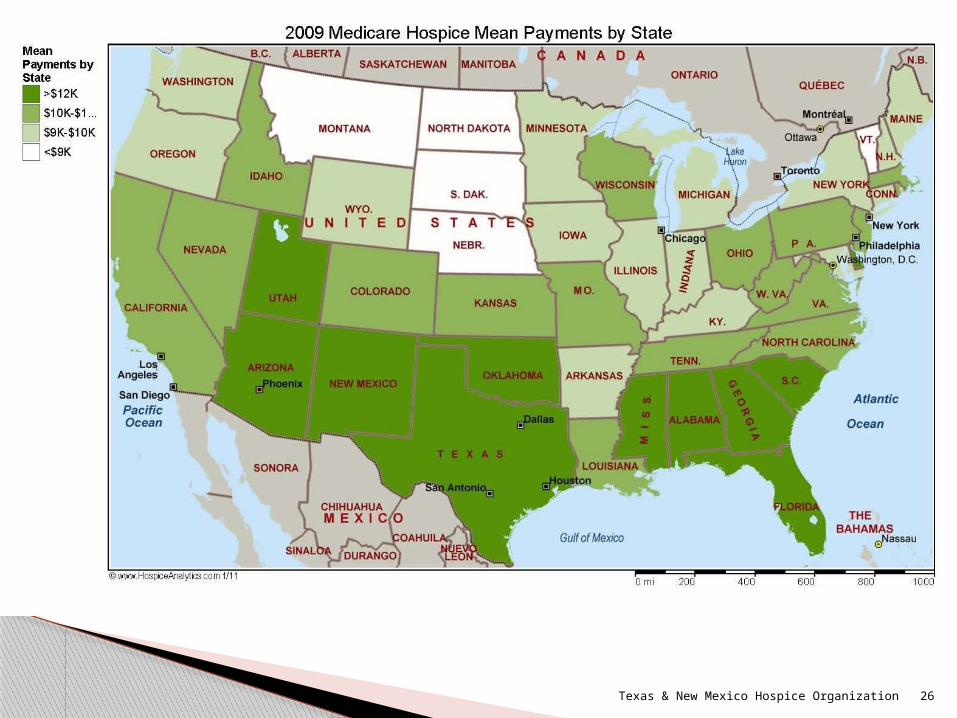
2009 Mean Medicare Hospice Payments / Patient
Del
awar
e 1
Ariz
ona
2M
issi
ssip
pi
3U
tah
4Fl
orid
a 5
Alab
ama
6So
uth
Car
olin
a 7
Okl
ahom
a 8
New
Mex
ico
9G
eorg
ia 1
0Te
xas
11
Rho
de Is
land
12
Cal
iforn
ia 1
3N
evad
a 1
4D
istri
ct o
f Col
umbi
a 1
5C
olor
ado
16
Idah
o 1
7Lo
uisi
ana
18
New
Jer
sey
19
Nor
th C
arol
ina
20
Nat
iona
l
Ohi
o 2
1W
isco
nsin
22
Mas
sach
uset
ts 2
3M
isso
uri
24Vi
rgin
ia 2
5Pe
nnsy
lvan
ia 2
6W
est V
irgin
ia 2
7Ka
nsas
28
Tenn
esse
e 2
9M
aine
30
Indi
ana
31
New
Ham
pshi
re 3
2Ill
inoi
s 3
3W
ashi
ngto
n 3
4C
onne
ctic
ut 3
5N
ew Y
ork
36
Haw
aii
37O
rego
n 3
8M
inne
sota
39
Mic
higa
n 4
0Ar
kans
as 4
1Io
wa
42
Kent
ucky
43
Wyo
min
g 4
4M
aryl
and
45
Verm
ont
46M
onta
na 4
7Al
aska
48
Sout
h D
akot
a 4
9N
ebra
ska
50
Nor
th D
akot
a 5
1$0
$2,000
$4,000
$6,000
$8,000
$10,000
$12,000
$14,000
$16,000National:$11,175
TX #11:$12,001
Texas & New Mexico Hospice Organization 25
NM #9:$12,859
Texas & New Mexico Hospice Organization 26
Wyoming
1
New York
3
Distric
t of C
olumbia
5
South
Dakota
7
Conne
cticu
t 9
Minnes
ota 1
1
Massa
chus
etts
13
North D
akota
15
Washin
gton
17
New Je
rsey
19
Californ
ia 21
Illinois
23
North C
arolina
25
Indian
a 27
Oregon
29
Rhode
Islan
d 30
Penns
ylvan
ia 32
Michiga
n 34
Louis
iana
36
Florida
38
Delaware
40
Idaho
42
South
Carolina
44
Arizon
a 46
Mississ
ippi 4
8
Alabam
a 50
0%
10%
20%
30%
40%
50%
60%
70%
80%
90%
100%
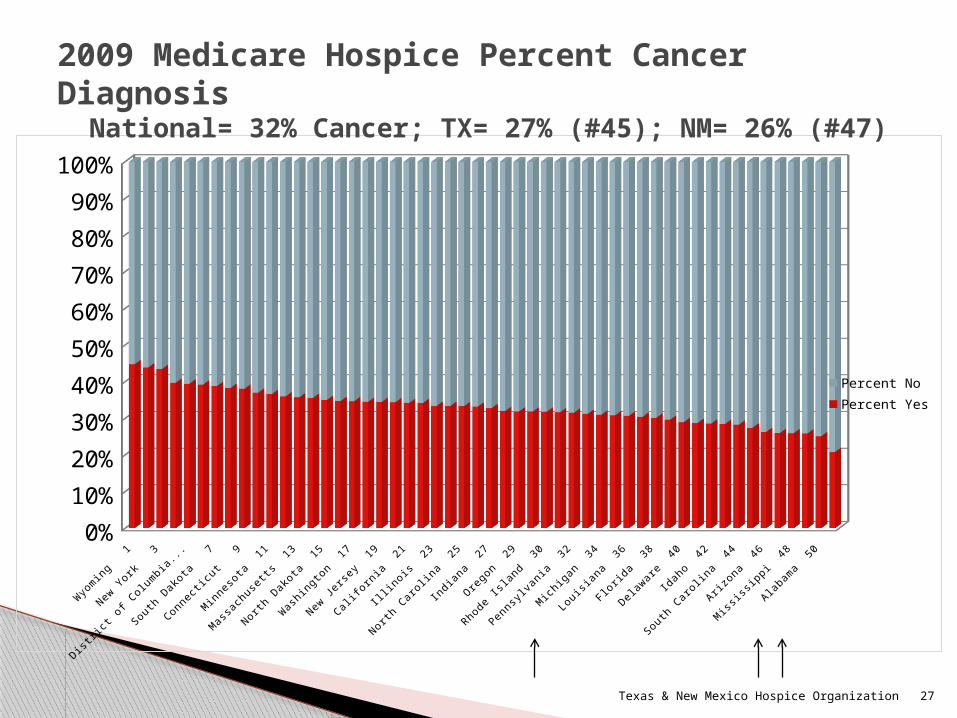
Percent NoPercent Yes
2009 Medicare Hospice Percent Cancer Diagnosis National= 32% Cancer; TX= 27% (#45); NM= 26% (#47)
Texas & New Mexico Hospice Organization 27

Texas & New Mexico Hospice Organization 28
Compare: Texas Compare: New Mexico Compare: National 0%
20%
40%
60%
80%
100%
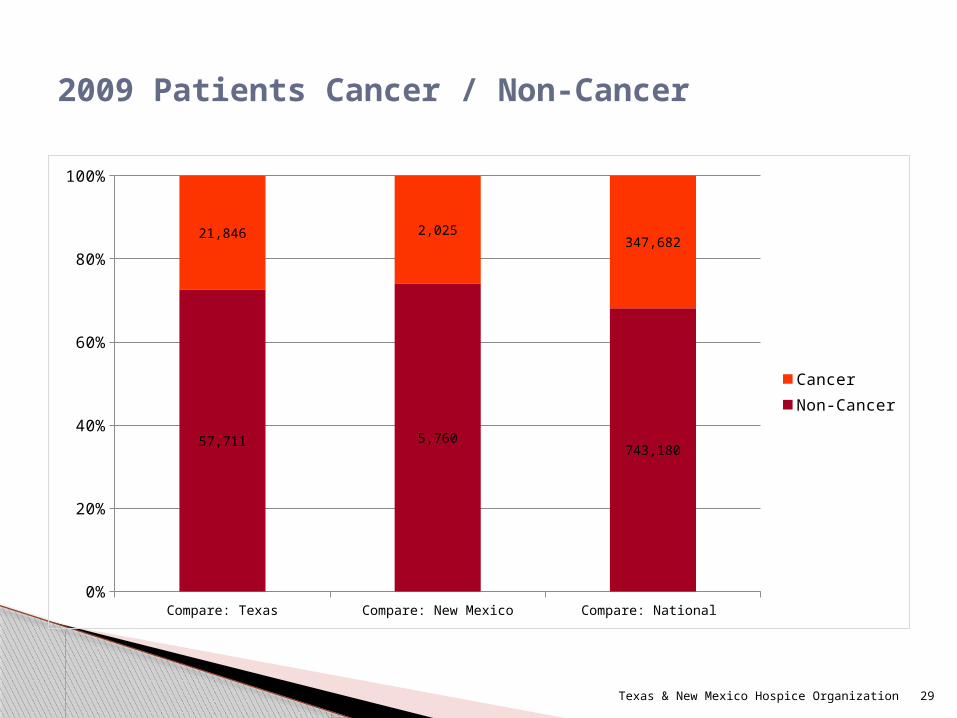
57,711 5,760743,180
21,846 2,025347,682
CancerNon-Cancer
2009 Patients Cancer / Non-Cancer
Texas & New Mexico Hospice Organization 29
Compare: Texas Compare: New Mexico Compare: National 0%
20%
40%
60%
80%
100%
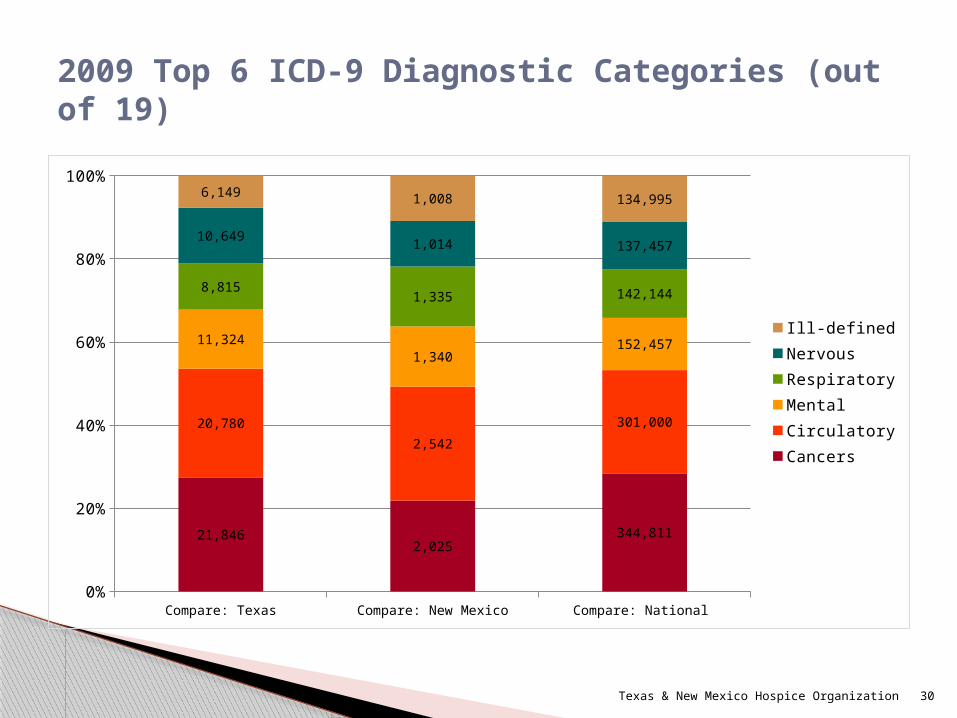
21,8462,025
344,811
20,780
2,542
301,000
11,3241,340
152,457
8,8151,335 142,144
10,6491,014 137,457
6,149 1,008 134,995
Ill-definedNervousRespiratoryMentalCirculatoryCancers
2009 Top 6 ICD-9 Diagnostic Categories (out of 19)
Texas & New Mexico Hospice Organization 30

Compare: Texas Compare: New Mexico Compare: National 0%
20%
40%
60%
80%
100%
53,114 4,943758,473
9,694 1,217131,389
16,749 1,625 201,000
Still PTDC AliveDC Deceased
2009 Patient Status at Discharge
Texas & New Mexico Hospice Organization 31
Compare: Texas Compare: New Mexico Compare: National 0%
20%
40%
60%
80%
100%
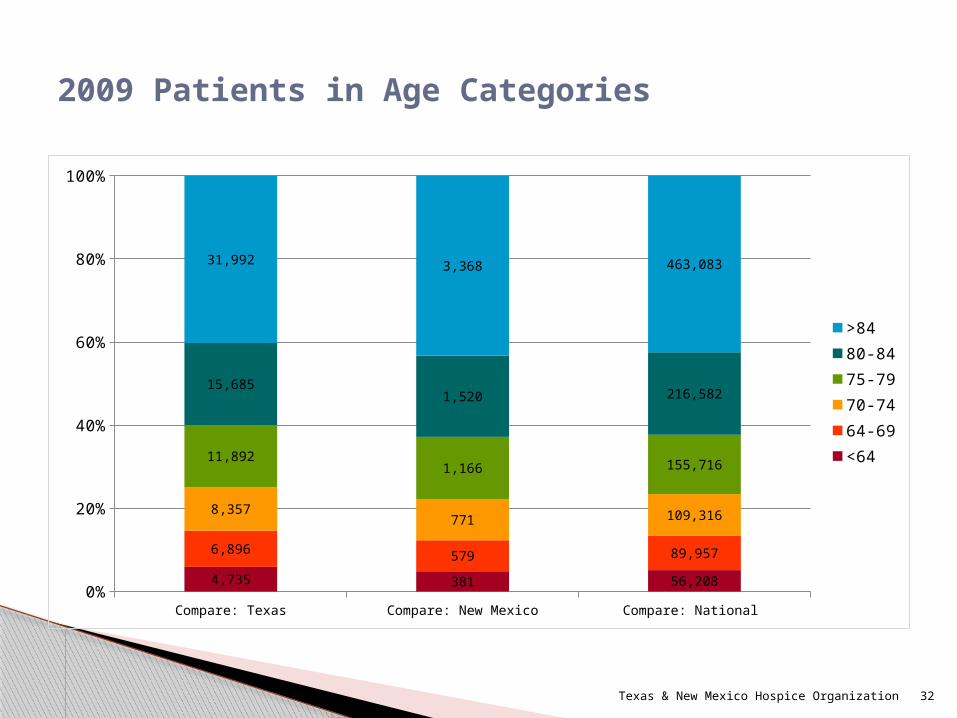
4,735 381 56,208
6,896 579 89,957
8,357771 109,316
11,8921,166 155,716
15,6851,520 216,582
31,992 3,368 463,083
>8480-8475-7970-7464-69<64
2009 Patients in Age Categories
Texas & New Mexico Hospice Organization 32
Compare: Texas Compare: New Mexico Compare: National 0%
20%
40%
60%
80%
100%
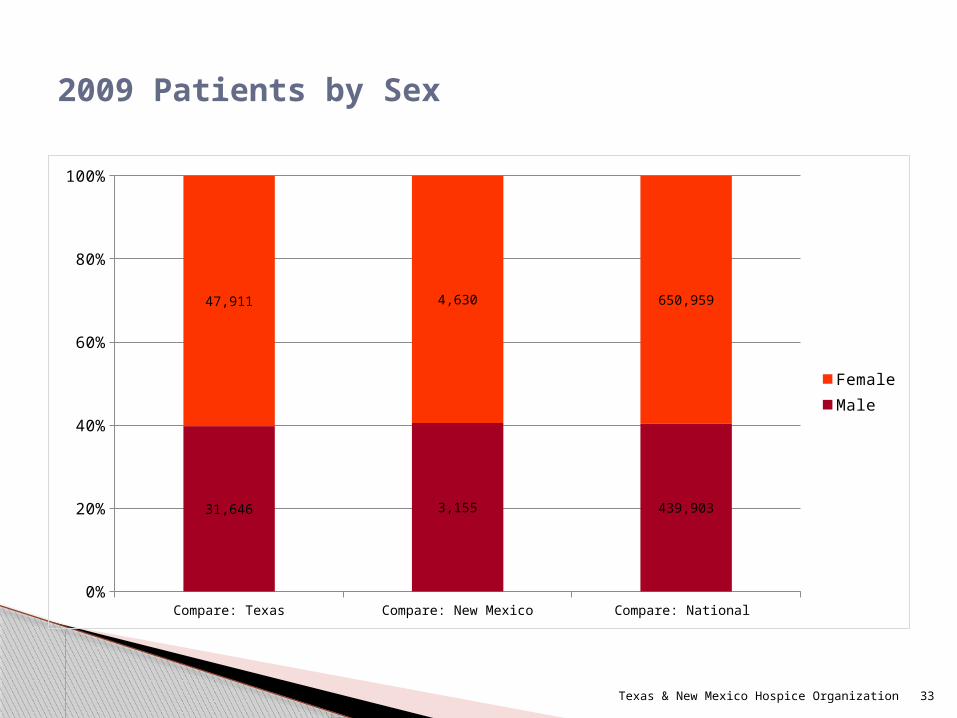
31,646 3,155 439,903
47,911 4,630 650,959
FemaleMale
2009 Patients by Sex
Texas & New Mexico Hospice Organization 33

Compare: Texas Compare: New Mexico Compare: National 80%
85%
90%
95%
100%
67,210
6,736960,848
6,802
118
87,651
4,228
674
20,126
490
17
8,618123
154
3,503583 71 8,343
OtherNorth American NativeAsianHispanicBlackWhite
2009 Patients by Race
Texas & New Mexico Hospice Organization 34

Compare: Texas Compare: New Mexico Compare: National 86%
88%
90%
92%
94%
96%
98%
100%
6,229,903 662,28775,313,071
96,6379,422
1,590,715
11,1251,583 165,40127,895 57 170,279
Cont. Home CareRespite CareGeneral InptRoutine Home Care
2009 Patients by Level of Care (days)
Texas & New Mexico Hospice Organization 35
Compare: Texas Compare: New Mexico Compare: National 0%
10%
20%
30%
40%
50%
60%
70%
80%
90%
100%
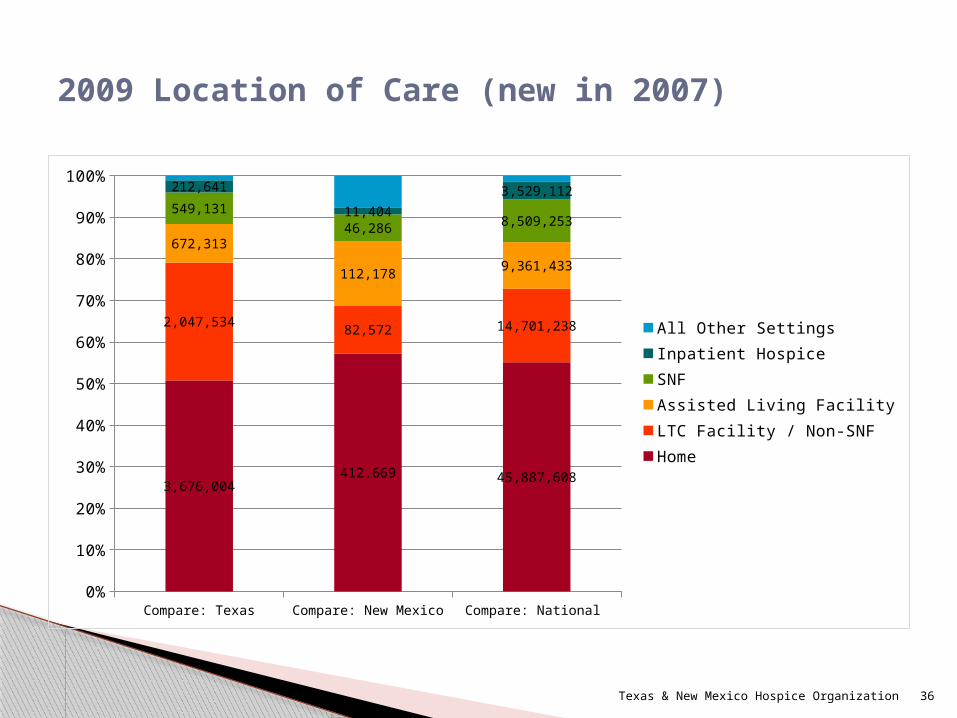
3,676,004412,669 45,887,608
2,047,53482,572 14,701,238
672,313
112,1789,361,433
549,13146,286 8,509,253
212,641
11,404
3,529,112
All Other SettingsInpatient HospiceSNFAssisted Living FacilityLTC Facility / Non-SNFHome
2009 Location of Care (new in 2007)
Texas & New Mexico Hospice Organization 36
Compare: Texas Compare: New Mexico Compare: National 0%
20%
40%
60%
80%
100%
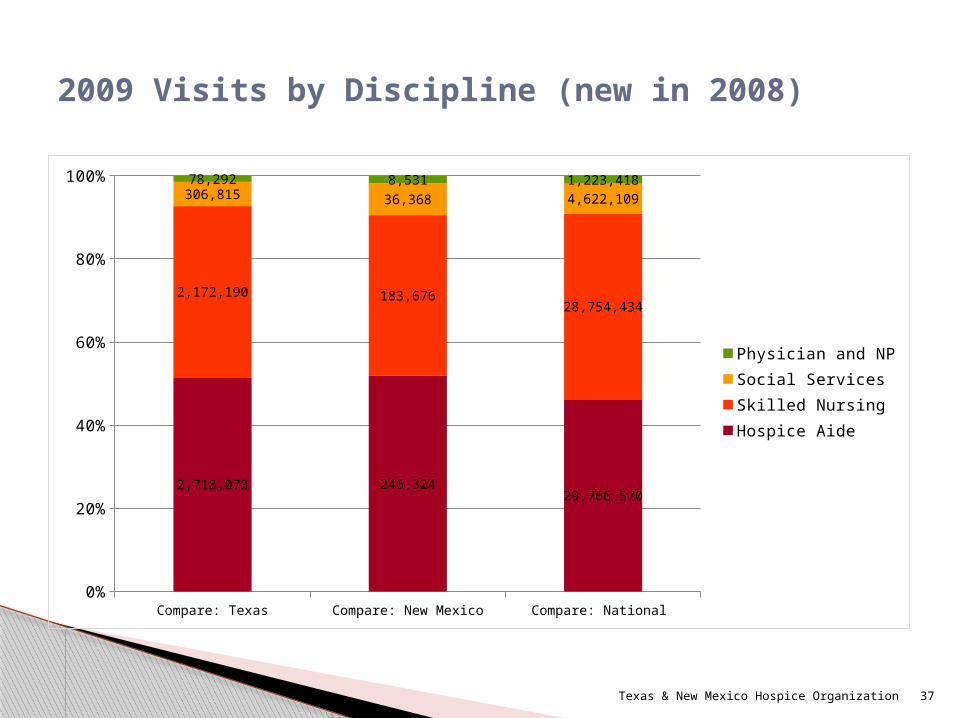
2,718,073 246,32429,766,570
2,172,190 183,67628,754,434
306,815 36,368 4,622,109
78,292 8,531 1,223,418
Physician and NPSocial ServicesSkilled NursingHospice Aide
2009 Visits by Discipline (new in 2008)
Texas & New Mexico Hospice Organization 37
Please refer to the Excel spreadsheet enclosed with this report for additional information.
Also, additional detailed county-level information is available through Market Reports for your hospice provider members.
Additional Information
Texas & New Mexico Hospice Organization 38

Report Sections:
1. State Information2. Who Was Missed?3. County Information4. National Information5. Hospitals, SNFs, and HHAs
Texas & New Mexico Hospice Organization 39
This section highlights what information is available for Medicare beneficiaries who died outside of hospice care.
Who was missed?That is, who died without hospice care?
Texas & New Mexico Hospice Organization 40

County-Specific InformationMedicare
Beneficiaries
Medicare Beneficiaries
Who Died
Medicare Beneficiaries
Who DiedWith Hospice
Medicare Beneficiaries
Who DiedWithout Hospice
Compare: Texas 3,051,891 121,653 53,114 68,539
Compare: New Mexico 318,375 11,619 4,943 6,676
Compare: National 48,753,141 1,936,900 758,475 1,178,425
2009 Counties & Hospice Patients
Texas & New Mexico Hospice Organization 41
Compare: Texas Compare: New Mexico Compare: National 0%
20%
40%
60%
80%
100%
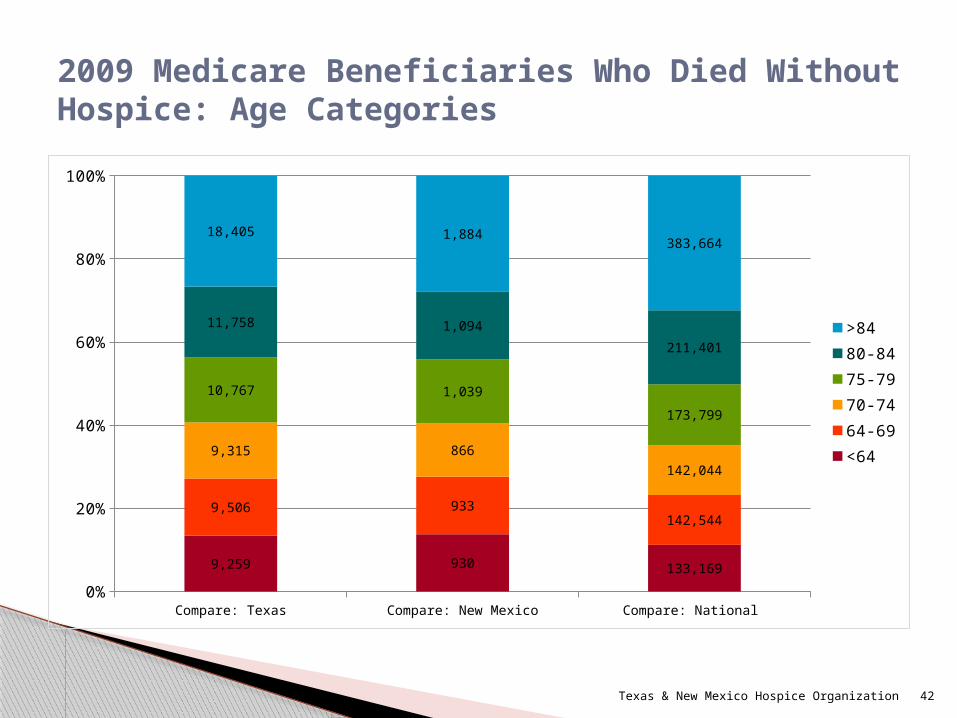
9,259 930 133,169
9,506 933142,544
9,315 866
142,044
10,767 1,039
173,799
11,758 1,094
211,401
18,405 1,884383,664
>8480-8475-7970-7464-69<64
2009 Medicare Beneficiaries Who Died Without Hospice: Age Categories
Texas & New Mexico Hospice Organization 42

Compare: Texas Compare: New Mexico Compare: National 0%
20%
40%
60%
80%
100%
35,265 3,530 586,916
33,745 3,216 599,705
FemaleMale
2009 Medicare Beneficiaries Who Died Without Hospice: Sex
Texas & New Mexico Hospice Organization 43
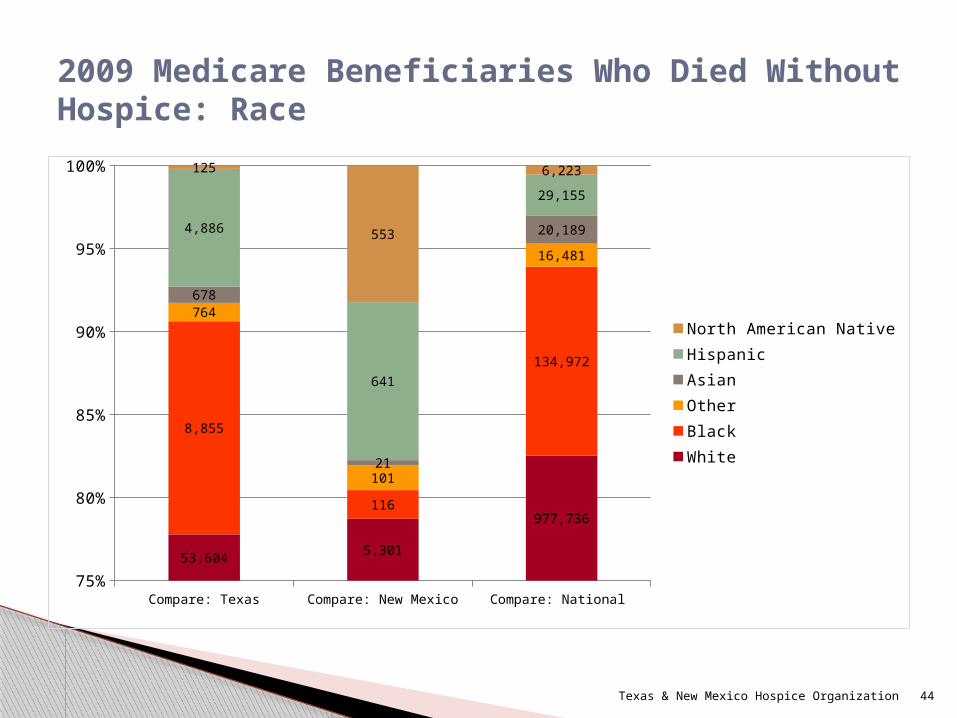
Compare: Texas Compare: New Mexico Compare: National 75%
80%
85%
90%
95%
100%
53,604 5,301
977,736
8,855
116
134,972
764
101
16,481
678
21
20,1894,886
641
29,155
125
553
6,223
North American NativeHispanicAsianOtherBlackWhite
2009 Medicare Beneficiaries Who Died Without Hospice: Race
Texas & New Mexico Hospice Organization 44

Report Sections:
1. State Information2. Who Was Missed?3. County Information4. National Information5. Hospitals, SNFs, and HHAs
Texas & New Mexico Hospice Organization 45
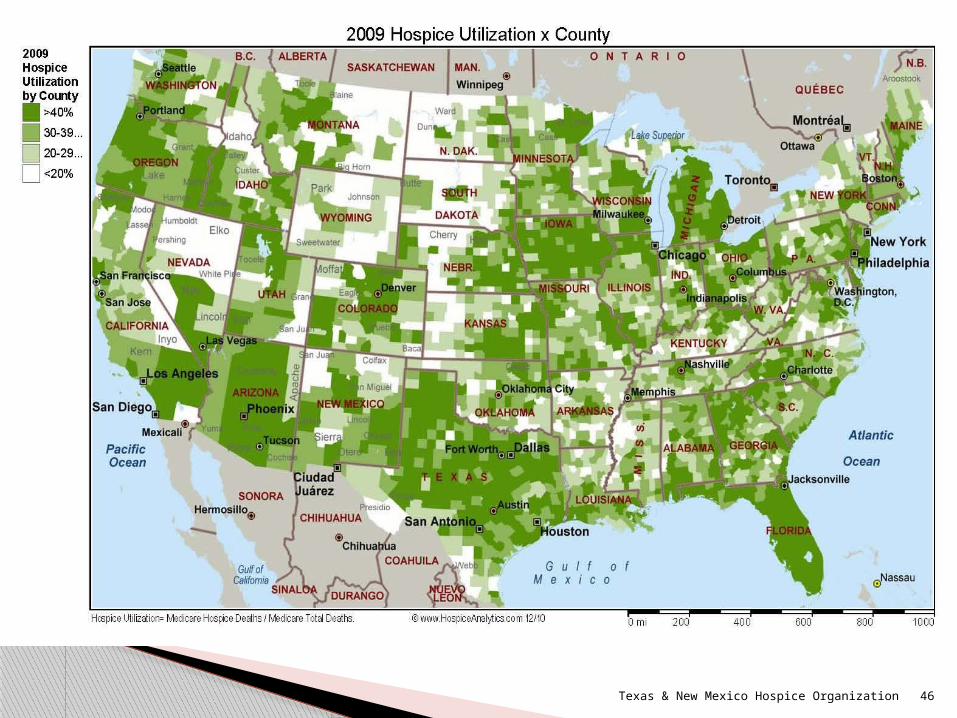
Texas & New Mexico Hospice Organization 46

2009 Demographics & Hospice Utilization
National
Population 307,006,550
Total Deaths2,486,097
0.8% of population
Medicare Beneficiaries 47,645,019
Medicare Beneficiary Deaths1,899,969
76% of total deaths
Medicare Hospice Patients1,079,676
43% of total deaths57% of Medicare deaths
Medicare Hospice Patient Deaths752,943
30% of total deaths39.6% of Medicare deaths
Total Days of Hospice Care 76,724,901 Days
Mean Days / Patient of Hospice Care 71 Days
Median Days / Patient of Hospice Care 24 Days
Total Medicare Hospice Payments $12,064,905,206
Texas & New Mexico Hospice Organization 47
Report Sections:
1. State Information2. Who Was Missed?3. County Information4. National Information5. Hospitals, SNFs, and HHAs
Texas & New Mexico Hospice Organization 48

2009 Summary of Health Care Providers forMedicare Beneficiaries at the End of Life
2009 Settings In Which Medicare Beneficiaries Died – N (%)
CountyTotal
Beneficiary Deaths
Hospice Deaths Hospital Deaths SNF Deaths HHA Deaths Other Deaths
Compare: Texas 121,653 53,114 (44%) 28,836 (24%) 5,421 (4%) 5,006 (4%) 29,276 (24%)
Compare: New Mexico 11,619 4,943 (42%) 2,031 (17%) 445 (4%) 298 (2%) 3,902 (34%)
Compare: National 1,899,969 758,475 (40%) 408,986 (22%) 102,651 (5%) 44,938 (2%) 584,919 (31%)
Texas & New Mexico Hospice Organization 49

The 2009 Medicare Data Was Recently Released:Who Provides Healthcare at the End of Life?
Snapshots
1/19/11
Texas New Mexico National 0%
10%
20%
30%
40%
50%
60%
70%
80%
90%
100%
Hospice 44% Hospice 42% Hospice 40%
Inpt Hospital 24%Inpt Hospital 17% Inpt Hospital 22%
SNF 4%
SNF 4%SNF 5%
Home Health 4%
Home Health 2%Home Health 2%
None of These 24%None of These 34% None of These 31%
Note: Information reflects Medicare beneficiaries only; categories are not mutually exclusive.
Texas & New Mexico Hospice Organization 50
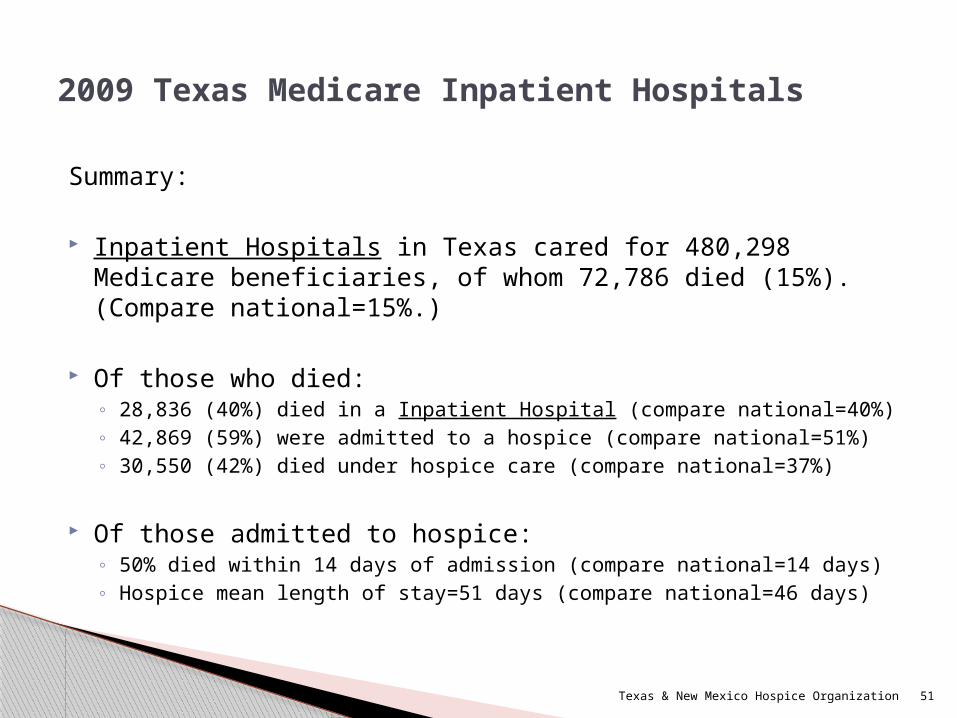
Summary:
Inpatient Hospitals in Texas cared for 480,298 Medicare beneficiaries, of whom 72,786 died (15%). (Compare national=15%.)
Of those who died:◦ 28,836 (40%) died in a Inpatient Hospital (compare national=40%)◦ 42,869 (59%) were admitted to a hospice (compare national=51%)◦ 30,550 (42%) died under hospice care (compare national=37%)
Of those admitted to hospice:◦ 50% died within 14 days of admission (compare national=14 days)◦ Hospice mean length of stay=51 days (compare national=46 days)
2009 Texas Medicare Inpatient Hospitals
Texas & New Mexico Hospice Organization 51

Summary:
Inpatient Hospitals in New Mexico cared for 36,723 Medicare beneficiaries, of whom 5,327 died (14%). (Compare national=15%.)
Of those who died:◦ 2,031 (38%) died in a Inpatient Hospital (compare national=40%)◦ 3,032 (57%) were admitted to a hospice (compare national=51%)◦ 2,034 (38%) died under hospice care (compare national=37%)
Of those admitted to hospice:◦ 50% died within 15 days of admission (compare national=14 days)◦ Hospice mean length of stay=53 days (compare national=46 days)
2009 New Mexico Medicare Inpatient Hospitals
Texas & New Mexico Hospice Organization 52
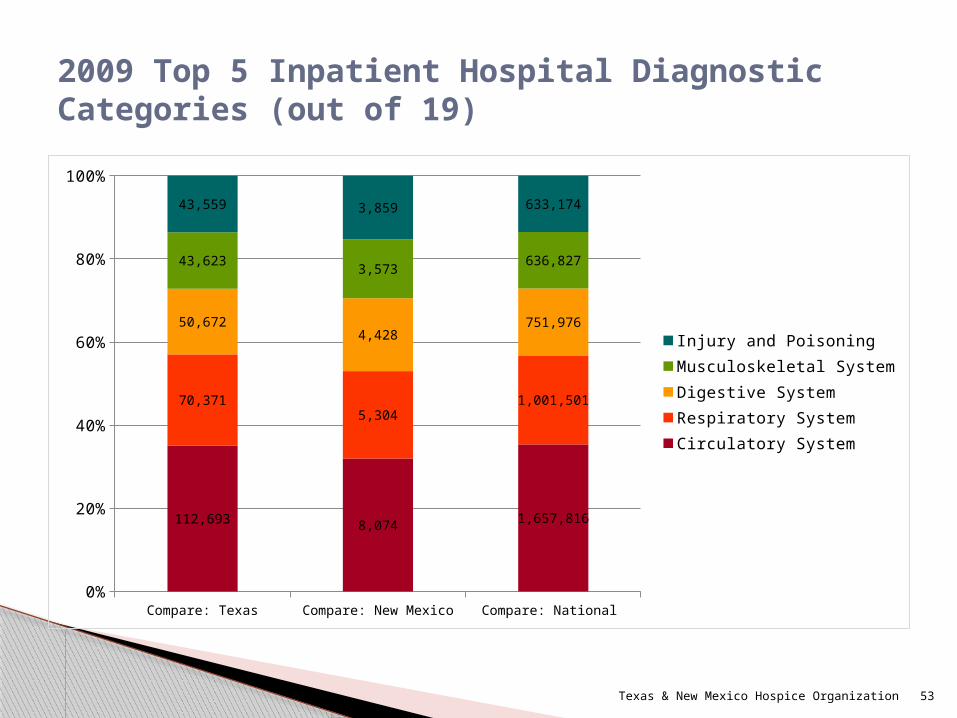
Compare: Texas Compare: New Mexico Compare: National 0%
20%
40%
60%
80%
100%
112,693 8,074 1,657,816
70,3715,304
1,001,501
50,6724,428
751,976
43,6233,573
636,827
43,559 3,859 633,174
Injury and PoisoningMusculoskeletal SystemDigestive SystemRespiratory SystemCirculatory System
2009 Top 5 Inpatient Hospital Diagnostic Categories (out of 19)
Texas & New Mexico Hospice Organization 53
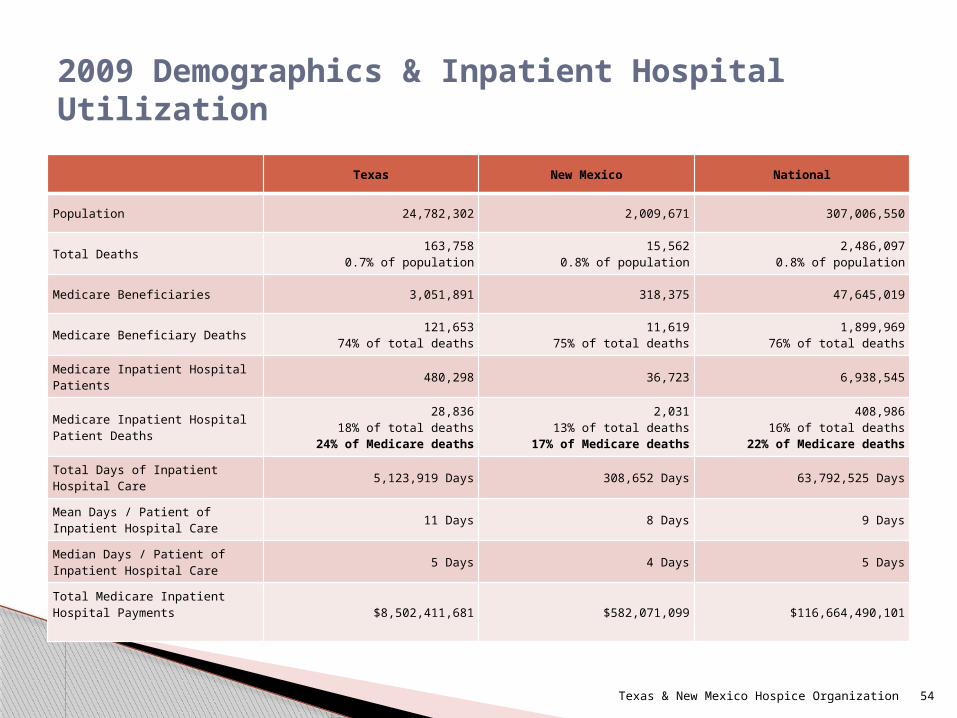
2009 Demographics & Inpatient Hospital Utilization
Texas New Mexico National
Population 24,782,302 2,009,671 307,006,550
Total Deaths163,758
0.7% of population15,562
0.8% of population2,486,097
0.8% of population
Medicare Beneficiaries 3,051,891 318,375 47,645,019
Medicare Beneficiary Deaths121,653
74% of total deaths11,619
75% of total deaths1,899,969
76% of total deaths
Medicare Inpatient Hospital Patients
480,298 36,723 6,938,545
Medicare Inpatient Hospital Patient Deaths
28,83618% of total deaths
24% of Medicare deaths
2,03113% of total deaths
17% of Medicare deaths
408,98616% of total deaths
22% of Medicare deaths
Total Days of Inpatient Hospital Care
5,123,919 Days 308,652 Days 63,792,525 Days
Mean Days / Patient of Inpatient Hospital Care
11 Days 8 Days 9 Days
Median Days / Patient of Inpatient Hospital Care
5 Days 4 Days 5 Days
Total Medicare Inpatient Hospital Payments $8,502,411,681 $582,071,099 $116,664,490,101
Texas & New Mexico Hospice Organization 54
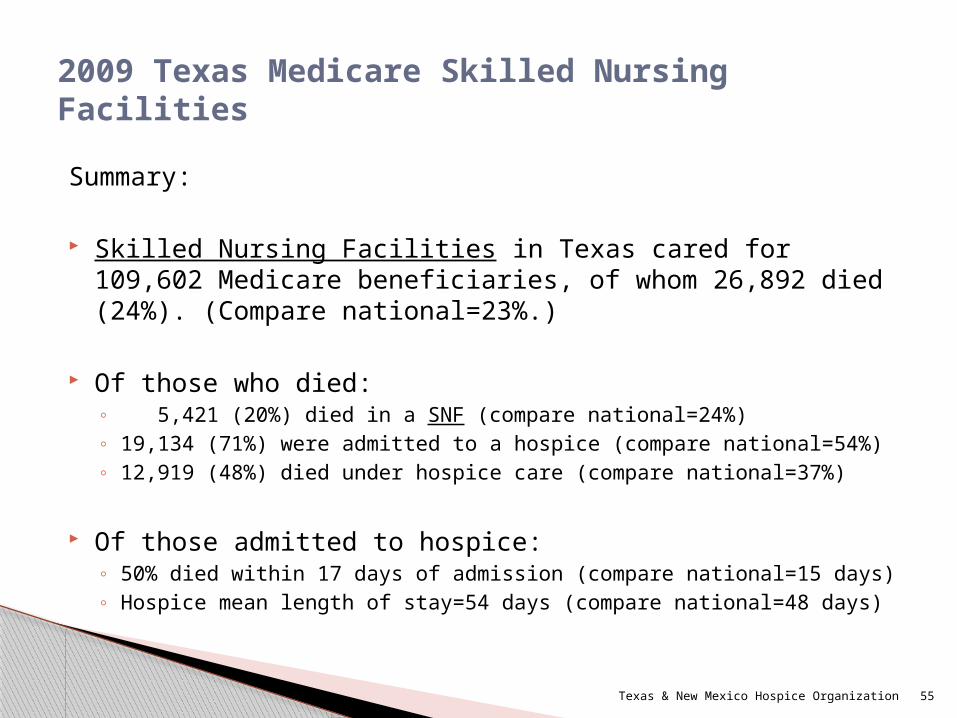
Summary:
Skilled Nursing Facilities in Texas cared for 109,602 Medicare beneficiaries, of whom 26,892 died (24%). (Compare national=23%.)
Of those who died:◦ 5,421 (20%) died in a SNF (compare national=24%)◦ 19,134 (71%) were admitted to a hospice (compare national=54%)◦ 12,919 (48%) died under hospice care (compare national=37%)
Of those admitted to hospice:◦ 50% died within 17 days of admission (compare national=15 days)◦ Hospice mean length of stay=54 days (compare national=48 days)
2009 Texas Medicare Skilled Nursing Facilities
Texas & New Mexico Hospice Organization 55
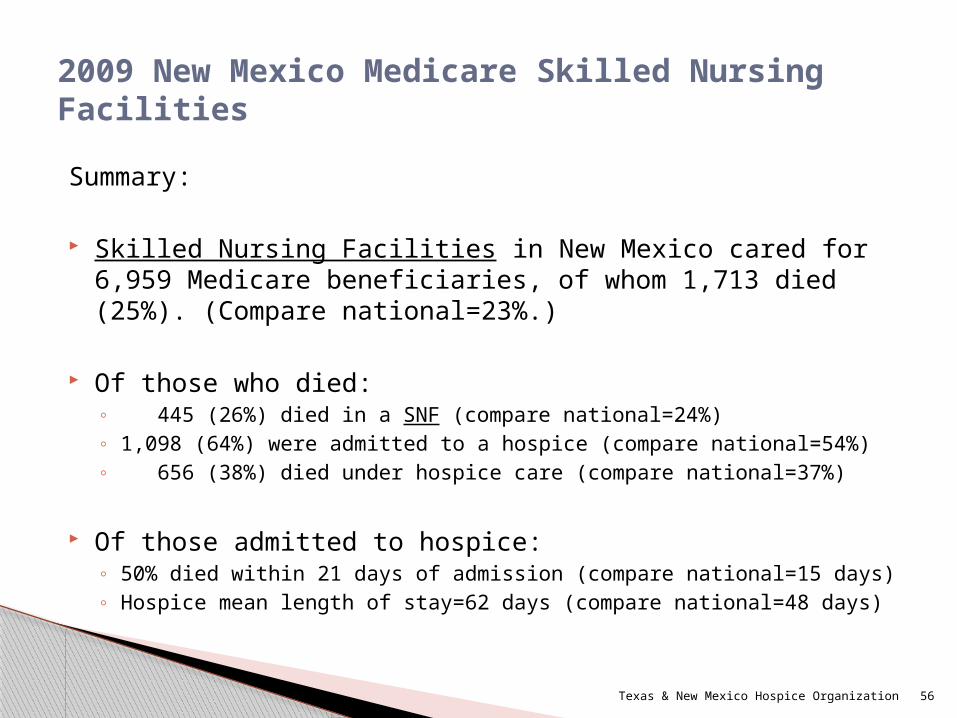
Summary:
Skilled Nursing Facilities in New Mexico cared for 6,959 Medicare beneficiaries, of whom 1,713 died (25%). (Compare national=23%.)
Of those who died:◦ 445 (26%) died in a SNF (compare national=24%)◦ 1,098 (64%) were admitted to a hospice (compare national=54%)◦ 656 (38%) died under hospice care (compare national=37%)
Of those admitted to hospice:◦ 50% died within 21 days of admission (compare national=15 days)◦ Hospice mean length of stay=62 days (compare national=48 days)
2009 New Mexico Medicare Skilled Nursing Facilities
Texas & New Mexico Hospice Organization 56

Compare: Texas Compare: New Mexico Compare: National 0%
20%
40%
60%
80%
100%
21,126 754 279,198
13,309 468 174,535
8,688 389 147,228
12,165 394 144,695
5,673 241 103,291
NervousInjury and PoisoningMusculoskeletalRespiratoryCirculatory
2009 Top 5 SNF Diagnostic Categories (out of 19)
Texas & New Mexico Hospice Organization 57

2009 Demographics & SNF Utilization
Texas New Mexico National
Population 24,782,302 2,009,671 307,006,550
Total Deaths163,758
0.7% of population15,562
0.8% of population2,486,097
0.8% of population
Medicare Beneficiaries 3,051,891 318,375 47,645,019
Medicare Beneficiary Deaths121,653
74% of total deaths11,619
75% of total deaths1,899,969
76% of total deaths
Medicare SNF Patients 109,602 6,959 1,822,074
Medicare SNF Patient Deaths5,421
3% of total deaths4% of Medicare deaths
4453% of total deaths
4% of Medicare deaths
102,6514% of total deaths
5% of Medicare deaths
Total Days of SNF Care 4,702,557 Days 247,453 Days 67,514,523 Days
Mean Days / Patient of SNF Care 31 Days 36 Days 37 Days
Median Days / Patient of SNF Care 43 Days 25 Days 27 Days
Total Medicare SNF Payments$1,521,348,459 $85,174,671 $24,476,518,870
Texas & New Mexico Hospice Organization 58
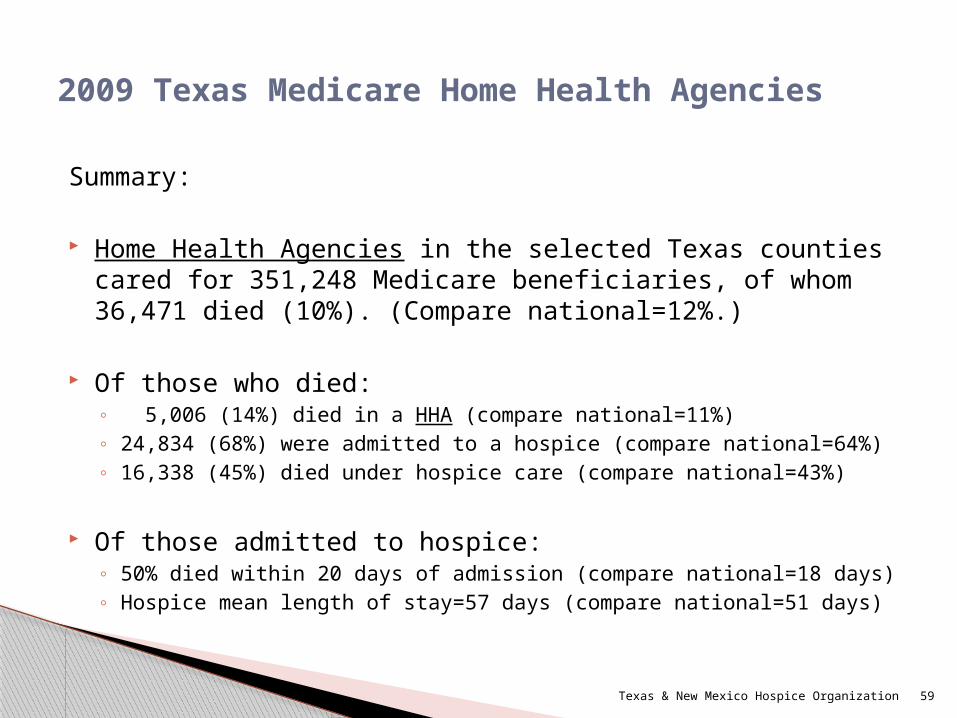
Summary:
Home Health Agencies in the selected Texas counties cared for 351,248 Medicare beneficiaries, of whom 36,471 died (10%). (Compare national=12%.)
Of those who died:◦ 5,006 (14%) died in a HHA (compare national=11%)◦ 24,834 (68%) were admitted to a hospice (compare national=64%)◦ 16,338 (45%) died under hospice care (compare national=43%)
Of those admitted to hospice:◦ 50% died within 20 days of admission (compare national=18 days)◦ Hospice mean length of stay=57 days (compare national=51 days)
2009 Texas Medicare Home Health Agencies
Texas & New Mexico Hospice Organization 59

Summary:
Home Health Agencies in the selected New Mexico counties cared for 16,155 Medicare beneficiaries, of whom 2,167 died (13%). (Compare national=12%.)
Of those who died:◦ 298 (14%) died in a HHA (compare national=11%)◦ 1,620 (75%) were admitted to a hospice (compare national=64%)◦ 972 (45%) died under hospice care (compare national=43%)
Of those admitted to hospice:◦ 50% died within 25 days of admission (compare national=18 days)◦ Hospice mean length of stay=57 days (compare national=51 days)
2009 New Mexico Medicare Home Health Agencies
Texas & New Mexico Hospice Organization 60
Compare: Texas Compare: New Mexico Compare: National 0%
20%
40%
60%
80%
100%
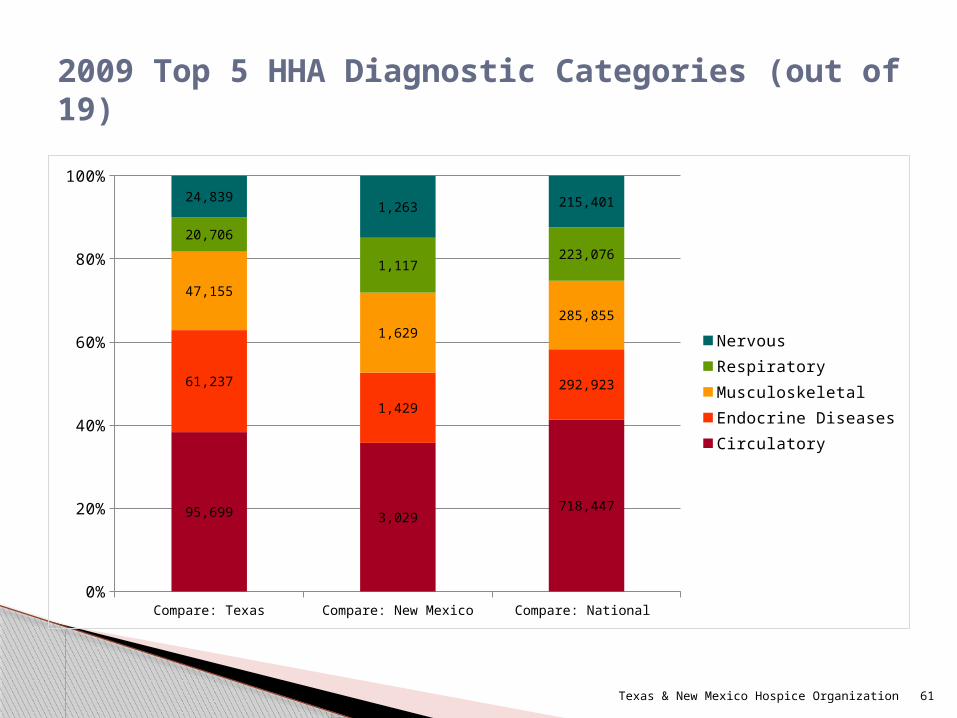
95,699 3,029718,447
61,237
1,429
292,923
47,155
1,629285,855
20,706
1,117223,076
24,8391,263 215,401
NervousRespiratoryMusculoskeletalEndocrine DiseasesCirculatory
2009 Top 5 HHA Diagnostic Categories (out of 19)
Texas & New Mexico Hospice Organization 61
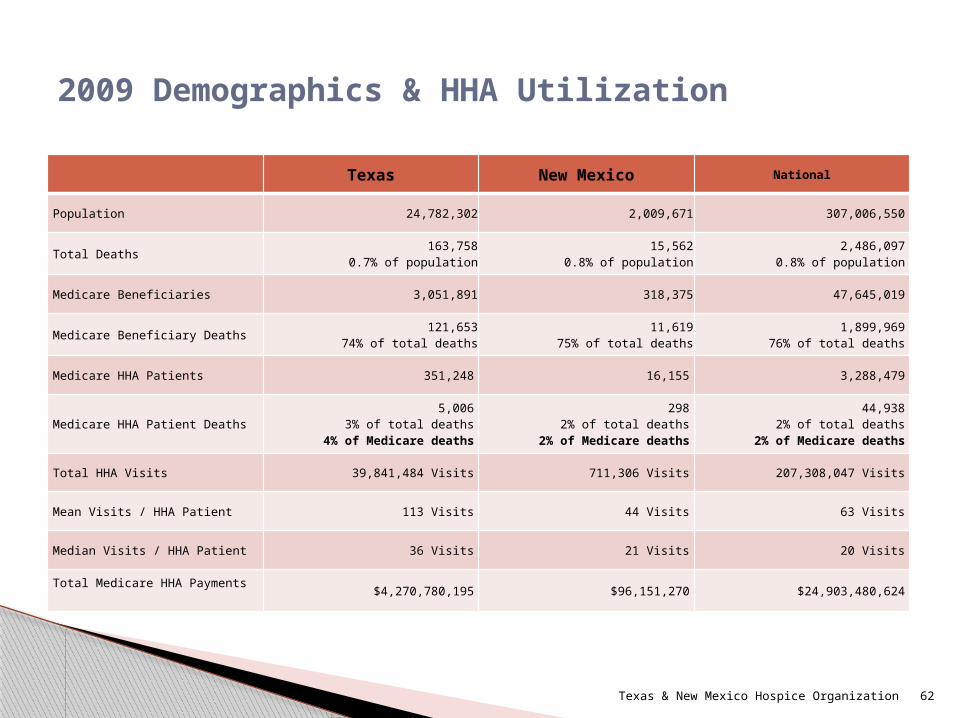
2009 Demographics & HHA Utilization
Texas New Mexico National
Population 24,782,302 2,009,671 307,006,550
Total Deaths163,758
0.7% of population15,562
0.8% of population2,486,097
0.8% of population
Medicare Beneficiaries 3,051,891 318,375 47,645,019
Medicare Beneficiary Deaths121,653
74% of total deaths11,619
75% of total deaths1,899,969
76% of total deaths
Medicare HHA Patients 351,248 16,155 3,288,479
Medicare HHA Patient Deaths5,006
3% of total deaths4% of Medicare deaths
2982% of total deaths
2% of Medicare deaths
44,9382% of total deaths
2% of Medicare deaths
Total HHA Visits 39,841,484 Visits 711,306 Visits 207,308,047 Visits
Mean Visits / HHA Patient 113 Visits 44 Visits 63 Visits
Median Visits / HHA Patient 36 Visits 21 Visits 20 Visits
Total Medicare HHA Payments$4,270,780,195 $96,151,270 $24,903,480,624
Texas & New Mexico Hospice Organization 62

Thank you
Please contact Hospice Analytics with any questions, comments, feedback, or for additional information:
W: www.HospiceAnalytics.comP: 719-209-1237
Texas & New Mexico Hospice Organization 63


![International Partnership Opportunities for Hospice Palliative Care Providers [ADD SPEAKER INFO HERE]](https://static.fdocuments.us/doc/165x107/551afd895503462e578b501d/international-partnership-opportunities-for-hospice-palliative-care-providers-add-speaker-info-here.jpg)


