
In Memory of - Gemological Institute Of America | All … a Ph.D. in 1938. His studies contin-ued at...
84
-
Upload
vuongnguyet -
Category
Documents
-
view
218 -
download
1
Transcript of In Memory of - Gemological Institute Of America | All … a Ph.D. in 1938. His studies contin-ued at...


pg. 21
VOLUME 41, NO. 1Spring 2005
1
2
36
6
20
4
42
52
74
76
78
86
REGULAR FEATURES _____________________Lab NotesDiamond with color possibly affected by the 3H defect • HPHT-treated type IIayellow diamond • Inhomogeneous cape diamond • Irradiated and fracture-filleddiamond • A coated “night glowing pearl” • “Pink fire” quartz • Quartz withunusual surface texture • Sphene cabochon with an unusual natural surface
Gem News InternationalLapidary art at AGTA Design Center, Tucson • Amethyst from Georgia • Amethystand citrine from Namibia • Aquamarine from Colorado • Saturated blue aquamarinefrom Nigeria • Chalcedony chain • Emerald from Xinjiang, China • Gold-in-quartzfrom Mariposa County, California • Iolite from northeastern Brazil • Kyanite widelyavailable in Tucson • “Moonstone” from Morogoro, Tanzania • Faceted pezzottaitefrom Afghanistan • Tanzanite marketing initiatives • Manufactured gold/silver-in-quartz • 10.53 ct diamond from Saskatchewan, Canada • Spiral in aquamarine •“Bamboo” moonstone • Pezzottaite in quartz • Treated-color topaz from Pakistan •Conference reports • Faceted Burmese rubies outside import ban
2005 Gems & Gemology Challenge
Book Reviews
Gemological Abstracts
The Last Page: Fast Facts About Synthetic Diamonds
EDITORIAL _____________In Memory of Dr. Edward J. GübelinAlice S. Keller
The Dr. Edward J. Gübelin Most Valuable Article Award
LETTERS _______________
FEATURE ARTICLES ___________________Treated-Color Pink-to-Red Diamonds from Lucent Diamonds Inc.Wuyi Wang, Christopher P. Smith, Matthew S. Hall, Christopher M. Breeding, and Thomas M. Moses
A report on the gemological properties and identifying characteristics ofthe new treated-color natural diamonds from Lucent Diamonds.
A Gemological Study of a Collection of Chameleon DiamondsThomas Hainschwang, Dusan Simic, Emmanuel Fritsch, Branko Deljanin, Sharrie Woodring, and Nicholas DelRe
Examines a collection of 39 chameleon diamonds and summarizesgemological and spectroscopic means for their identification.
NOTES AND NEW TECHNIQUES ________Coated Pink Diamond—A Cautionary TaleDavid J. F. Evans, David Fisher, and Christopher J. Kelly
Case study of a diamond that was stated to have been HPHT treated, but infact had been coated to change its color to an intense purple-pink.
pg. 52
pg. 48
pg. 7

ems & Gemology mourns the loss of Dr. Edward J.Gübelin, who died March 15, one day shy of his 92ndbirthday. One of the most influential gemologists of
the 20th century, Dr. Gübelin’s work inspired the contempo-rary study of inclusions and establishedtheir significance in gem identification.
Edward Gübelin was born in 1913 inLucerne, Switzerland, to a well-knownfamily of watchmakers. Dr. Gübelinfound his calling early on, when hisfather provided a gemological laboratoryfor his use. He studied mineralogy at theuniversities of Zurich and Vienna, earn-ing a Ph.D. in 1938. His studies contin-ued at the fledgling GIA in Los Angeles,where he graduated as a CertifiedGemologist (then the precursor to theGraduate Gemologist degree) in 1939.
After returning to Switzerland, Dr. Gübelinbegan his famous work on inclusions,painstakingly documenting how internalfeatures can be used to help pinpoint agem’s identity and origin. This researchwas the basis for several G&G articles hewrote during the 1940s, and GIA founder Robert M. Shipleyencouraged the young mineralogist to expand his work into abook. The result was the groundbreaking Inclusions as aMeans of Gemstone Identification (1953), which presentedthe first systematic classification of inclusions.
Numerous books, more than 150 research papers, and evena film (on the rubies of Mogok, Burma) followed, all in astyle that was both scholarly and eloquent. He collaboratedwith John Koivula to write the classic Photoatlas ofInclusions in Gemstones (1986), which contains more than1,400 photomicrographs and is widely considered theauthoritative book on the subject.
Through the last two decades, at an age when most wouldbe content to savor a lifetime of distinguished achievements,Dr. Gübelin never stopped producing. He continued writing,lecturing, and traveling to gem localities all over the world.His last book (with co-author John Koivula) is the totally newPhotoatlas of Inclusions in Gemstones, Vol. 2, scheduled tobe released this year.
Dr. Gübelin’s influence on this journal alone was extraordinary.He contributed as author or reviewer for seven consecutivedecades, beginning in the 1940s. One article, a memorableupdate on peridot from the Red Sea island of Zabargad, was thelead paper of my first issue as editor, the beginning of our 25years of collaboration.
Two years ago, we dedicated our Spring 2003 issue to Dr.Gübelin in celebration of his 90th birthday. We commemoratedthe milestone with a profile of the great gemologist (pp. 1–2)and articles that mirrored his interest in new gem finds and
photomicrography. This issue alsoincluded an article he co-authored onthe rare gem poudretteite from Myanmar(formerly Burma), a land he knew betterthan any other Western gemologist. In agracious letter written shortly after theissue appeared, Dr. Gübelin confided: “I may mention between the two of usthat fame has never been my goal butenthusiasm and love for the science ofgemstones have spurred me on.”
Later in 2003, Dr. Gübelin established afund to support G&G’s annual MostValuable Article award, which had beennamed in his honor in 1997. The interestfrom this fund will be used in perpetuityto reward the winning authors. Writingfrom Lucerne, Dr. Gübelin said he creat-ed the award fund in connection withEaster—“not exactly for merely religious
reasons, but rather because Easter is the feastof hope. With this, though, I am truly combining the hope thatGems & Gemology…will last for many years to come.”
It is with great sorrow that I say good-bye to Edward Gübelin,a good friend as well as a treasured colleague. Like so manyothers, I shall miss his beautiful letters, his depictions of exoticlocales he had visited as exquisite as his description ofdolomite in a Brazilian emerald “besieged by a swarm ofchromite grains.” Yet also like others, I feel every letter, everymeal shared, every conversation was a gift that, like hisimpact on gemology, will truly last forever.
Dr. Gübelin is survived by five daughters, 12 grandchildren,and 11 great-grandchildren. In his honor, GIA has estab-lished the Edward J. Gübelin Research Fund, to perpetuatethe science that he devoted his prodigious energy and intel-lect to establish.
GIA will hold a tribute to Dr. Gübelin at 3:00 pm Saturday,May 21, at its world headquarters in Carlsbad, Calif. For moreinformation or to RSVP, please e-mail [email protected].
Alice S. KellerEditor-in-Chief
EDITORIAL GEMS & GEMOLOGY SPRING 2005 1
G
In Memory of Dr. Edward J. Gübelin

2 MOST VALUABLE ARTICLE AWARD GEMS & GEMOLOGY SPRING 2005
Gems & Gemology is pleased to announce the winners of this year’s Dr. Edward J. Gübelin Most Valuable Article Award, as voted by thejournal’s readers. We extend our sincerest thanks to all the subscribers
who participated in the voting.
The first-place article was “A Foundation for Grading the Overall Cut Qualityof Round Brilliant Cut Diamonds” (Fall 2004), which described the factors thatare important in evaluating the quality of a diamond's cut and introduced thenew GIA diamond cut grading system. Receiving second place was “TheCreation of a Magnificent Suite of Peridot Jewelry: From the Himalayas to FifthAvenue” (Winter 2004), which chronicled the making of a peridot jewelry suite,from the rough mined in Pakistan to the design and manufacture of the ensem-ble by Van Cleef & Arpels. Third place was awarded to “An Updated Chart onthe Characteristics of HPHT-Grown Synthetic Diamonds” (Winter 2004), asummary of the features of synthetic diamonds that are grown at high-pressureand high-temperature (HPHT) conditions.
The authors of these three articles will share cash prizes of $2,000, $1,000, and$500, respectively. Following are brief biographies of the winning authors.
Congratulations also to Dr. Casey Skvorc of Bethesda, Maryland, whose bal-lot was drawn from the many entries to win a five-year subscription to Gems & Gemology.
First PlaceA FOUNDATION FOR GRADING THE OVERALLCUT QUALITY OF ROUND BRILLIANT CUT DIAMONDSThomas M. Moses, Mary L. Johnson, Barak Green, Troy Blodgett, Kim Cino, Ron H. Geurts, Al M. Gilbertson, T. Scott Hemphill, John M. King, Lisa Kornylak, Ilene M.Reinitz, and James E. Shigley
Thomas M. Moses is vice president of Identification and Research at the GIA Gem Laboratory in New York. Mr. Moses, who attended Bowling GreenUniversity, is also an editor of G&G’s Lab Notes section. Mary L. Johnson ismanager of research and development for the GIA Gem Laboratory in Carlsbad,California. Dr. Johnson, a frequent contributor to the journal, received her Ph.D.in mineralogy and crystallography from Harvard University. Barak Green ismanager of communications for the GIA Gem Laboratory. He has written sever-al articles related to diamond cut for trade journals and the Institute website.Mr. Green holds a master's degree in anthropology from the University ofCalifornia, San Diego. Troy Blodgett is a research scientist at GIA and joined theCarlsbad lab in 1998. Dr. Blodgett holds a bachelor's degree in geology-biologyfrom Brown University, and a master's and doctorate in geology and remote sensing from Cornell University. Kim Cino is director of administration for theGIA Gem Laboratory, and project manager of the GIA Diamond Cut GradingT. Scott Hemphill Lisa Kornylak
Troy Blodgett Ron H. Geurts
Left to right: Al M. Gilbertson, Kim Cino, James E. Shigley, Mary L. Johnson, Barak Green
Left to right: John M. King, Ilene M. Reinitz,Thomas M. Moses
MOST VALUABLE ARTICLEDr. Edward J. Gübelin

MOST VALUABLE ARTICLE AWARD GEMS & GEMOLOGY SPRING 2005 3
project. With more than a decade of experience at the Institute, Ms. Cino has ledand managed other notable projects, such as the implementation of theLaboratory Operations and Management System (Horizon) in 1996 and theintroduction of the GIA Diamond Dossier® in 1999. Ron Geurts is Research andDevelopment manager at GIA Antwerp. Mr. Geurts was formerly technicaldirector of the Certificates department of HRD, and for the last decade he hasbeen deeply involved in efforts to implement new technology in the GIA dia-mond grading process. Al Gilbertson is a research associate with GIA Researchin Carlsbad. A noted gemologist and appraiser, Mr. Gilbertson has publishedseveral articles on diamond cut and clarity. T. Scott Hemphill, a GIA researchassociate, has been programming computers for more than 30 years. Mr.Hemphill holds a bachelor's degree in engineering and a master's degree incomputer science from the California Institute of Technology. John M. King islaboratory projects officer at the GIA Gem Laboratory in New York. Mr. Kingreceived his Master of Fine Arts degree from Hunter College, City University ofNew York. With over 20 years of laboratory experience, he frequently writesand lectures on colored diamonds and laboratory grading procedures. LisaKornylak received her G.G. in 1994 and has almost 20 years experience in thejewelry industry. Formerly with GIA Carlsbad, she worked in the GradingLaboratory and then in Research on the diamond cut project. Ilene M. Reinitzis manager of research and development at the GIA Gem Trade Laboratory inNew York. Dr. Reinitz, who holds a Ph.D. in geochemistry from YaleUniversity, has written numerous articles for G&G and other publications.James E. Shigley is director of GIA Research in Carlsbad. Prior to joining theInstitute in 1982, Dr. Shigley received his doctorate in geology from StanfordUniversity. He is the author of numerous articles on diamonds and other gem-stones, and is the editor of the newly published Gems & Gemology in Review:Synthetic Diamonds.
Second PlaceTHE CREATION OF A MAGNIFICENT SUITE OF PERIDOT JEWELRY:FROM THE HIMALAYAS TO FIFTH AVENUERobert E. Kane
Robert E. Kane is president and CEO of Fine Gems International in Helena,Montana, and a member of the G&G Editorial Review Board since 1981. He is aformer director of the Gübelin Gem Lab in Lucerne, Switzerland, and a formermanager of gem identification at GIA's West Coast Gem Trade Laboratory. Withmore than 25 years of gemological experience, Mr. Kane is well known for hismany articles on diamonds, gemstones, and gem identification.
Third PlaceAN UPDATED CHART ON THE CHARACTERISTICS OFHPHT-GROWN SYNTHETIC DIAMONDSJames E. Shigley, Christopher M. Breeding, and Andy Hsi-Tien Shen
James Shigley was profiled in the first-place entry. Christopher M. Breeding is aresearch scientist for the GIA Gem Laboratory in Carlsbad, where he investi-gates origin of color for diamonds and other gemstones. He holds a B.S. in geolo-gy from the College of William & Mary and a Ph.D. in geology from YaleUniversity. Andy Hsi-Tien Shen is a research scientist at the GIA GemLaboratory in Carlsbad. He holds a Ph.D. from Cornell University and has con-ducted research in mineral physics in the United States, Germany, and theUnited Kingdom for more than 15 years.
Christopher M.Breeding
Andy Hsi-Tien Shen
Robert E. Kane

istorically, diamonds in the pink-to-redcolor range have been among the mosthighly prized. In nature, most pink-to-red,
brown, and purple colors (and combinations there-of) in diamond have been attributed to the develop-ment of defect centers caused by shear stress andplastic deformation. These defects, which gemolo-gists describe as colored “graining,” were formedafter the growth of the gem was complete andeither prior to or during the diamond’s ascent tothe earth’s surface (see, e.g., Orlov, 1977; Collins,1982; Fritsch, 1998; Moses et al., 2002). Many ofthe world’s most famous diamonds owe their colorto this mechanism, including such notable stonesas the 0.95 ct Hancock Red, the 5.11 ct MoussaieffRed, the 59.60 ct Steinmetz Pink, and the 128.48 ctStar of the South.
As a result of the prestige and value associatedwith these colors, attempts have been made sinceantiquity to impart a pink-to-red coloration to dia-monds. In the earliest times, topical coatings wereused to achieve this goal; however, such coatingswere not stable and could be readily removed. The
first treatment to induce a more stable hue in thisrange was introduced in the 1950s, when irradiationwith high-energy electrons began to be appliedexperimentally to modify the color of natural dia-monds. On rare occasions, a brownish pink to redhue would result when certain diamonds were irra-diated in this manner and subsequently annealed(Crowningshield, 1959; Crowningshield andReinitz, 1995). It was only significantly later, duringthe mid- to late 1980s, that scientists realized thestones that changed color in this manner were typeIb diamonds, which contain single substitutionalnitrogen impurities (Fritsch, 1998; Shigley et al.,2004). More recently, high pressure/high tempera-ture (HPHT) annealing of type IIa diamonds hasbeen shown to change the color of some brown dia-monds to hues in the purplish pink to brown-pinkrange (Hall and Moses, 2000).
6 LUCENT TREATED-COLOR DIAMONDS GEMS & GEMOLOGY SPRING 2005
H
TREATED-COLOR PINK-TO-REDDIAMONDS FROM
LUCENT DIAMONDS INC. Wuyi Wang, Christopher P. Smith, Matthew S. Hall,
Christopher M. Breeding, and Thomas M. Moses
See end of article for About the Authors and Acknowledgments.GEMS & GEMOLOGY, Vol. 41, No. 1, pp. 6–19.© 2005 Gemological Institute of America
Lucent Diamonds has developed a new treatment process for natural type Ia diamonds that pro-duces colors ranging from pink-purple through red to orangy brown, using a multi-step processthat involves HPHT annealing, irradiation, and low-pressure annealing at relatively lower temper-atures. Those stones that achieve a predominant pink-to-red or purple color are marketed as“Imperial Red Diamonds.” Gemological properties and characteristic spectra are presented for 41diamonds, representing the range of colors produced thus far. These treated-color natural dia-monds can be readily identified by internal graphitization and surface etching seen with magnifi-cation, distinctive color zoning, and reactions to long- and short-wave UV radiation. The color iscaused primarily by the absorption of the (N-V)- center, with further influence from the (N-V)0,H3, H4, and N3 centers. Other characteristic infrared and UV-visible absorption features includethe H1a, H1b, H1c, 6170 cm-1, and, frequently, 594 nm bands. This type of defect combinationis not known in naturally colored diamonds.

The latest entrant into this specialized arena oftreated-color diamonds is Lucent Diamonds Inc., aU.S. corporation based in Denver, Colorado. Thiscompany has specialized in the production of syn-thetic diamonds and the HPHT treatment of naturaland synthetic diamonds since 1995. During the 2004Tucson shows, Lucent Diamonds unveiled a newcolor series of treated-color natural diamonds, whichthey are marketing under the name “Imperial RedDiamonds” (figure 1). The treatment employs a com-plex, multiple-step procedure that is effective withonly certain types of natural diamonds or HPHT-grown synthetic diamonds (A. Grizenko and V. Vins,pers. comms., 2004). Following the show, we contact-ed Lucent Diamonds to borrow samples in the fullrange of colors produced, so they could be examinedand tested. From our study of several of these dia-monds, we determined that a number of standardgemological and spectroscopic features will readilydistinguish these stones as being diamonds of a natu-ral origin (i.e., not synthetic) with treated color.
Lucent Diamonds first began applying this pro-cess to type Ib synthetic diamonds. Subsequently,they experimented with naturally grown diamonds.To date, more than 1,000 natural diamonds have
been treated in this manner, resulting in a dominantpink, red, purple, or brown color appearance.However, diamonds with a dominant brown appear-ance are excluded from the “Imperial Red Diamond”group, so only a small portion of the stones are soldunder that trade name (A. Grizenko, pers. comm.,2005). Continued developments in the pre-screeningof diamonds that can be treated successfully by thisprocess have improved the percentage output ofpink-to-red or purple stones, while they have con-firmed the scarcity of appropriate natural-originstarting material. Mr. Grizenko projects that withina year, they will have achieved a stable production of50 carats of “Imperial” diamonds per month. Giventhe rarity of natural-color intense pink-to-red dia-monds, even such relatively small numbers mayhave a significant impact on the availability of dia-monds in this color range (natural or treated) in thegemstone and jewelry market.
MATERIALS AND METHODS A total of 41 diamonds (see, e.g., figure 2) were pro-vided by Lucent Diamonds for this study. Theyranged from 0.14 to 0.91 ct and are representative of
LUCENT TREATED-COLOR DIAMONDS GEMS & GEMOLOGY SPRING 2005 7
Figure 1. Treated-color“Imperial Red Dia-monds” are being pro-duced by LucentDiamonds of Denver,Colorado. Shown hereare three loose stones(0.15–0.33 ct) and aselection of fine jewelrydemonstrating the possi-bilities of these gems.The ring is set with a1.25 ct diamond, whilethe bracelet and neck-lace feature 0.38 and0.34 ct diamonds, re-spectively. The ring iscourtesy of John AtencioDesigner Jewelry, Den-ver; the bracelet andnecklace are both cour-tesy of Avirom Associ-ates, Boulder, Colorado.Photo © Harold & EricaVan Pelt.

the color range that is currently being produced bythis process (A. Grizenko, pers. comm., 2005).
Color grades were determined by experienced col-ored-diamond color graders using the standard condi-tions and methodology of GIA’s color grading systemfor colored diamonds (King et al., 1994). Internal fea-tures were observed with a standard binocular micro-scope using a variety of lighting techniques.Reactions to ultraviolet radiation were checked in adarkened room with a conventional four-watt combi-nation long-wave (365 nm) and short-wave (254 nm)lamp. All of the stones were also examined using aDiamond Trading Company (DTC) DiamondViewdeep-ultraviolet (<230 nm) luminescence imagingsystem (Welbourn et al., 1996). A handheld spectro-scope was used to view absorption features in the vis-ible range, with the samples at both room tempera-ture and low temperature.
All the samples were also analyzed using severalother spectroscopic techniques. Absorption spectrain the ultraviolet to visible (UV-Vis) range wererecorded with a Thermo-Spectronic Unicam UV500spectrophotometer over the range 250–850 nm with
a sampling interval of 0.1 nm. The samples weremounted in a cryogenic cell and cooled using liquidnitrogen. Infrared absorption spectra were recordedin the mid-infrared (6000–400 cm-1, 1 cm-1 resolu-tion) and near-infrared (up to 11000 cm-1, 4 cm-1
resolution) ranges at room temperature with aThermo-Nicolet Nexus 670 Fourier-transforminfrared (FTIR) spectrometer, equipped with KBrand quartz beam splitters. In collecting absorptionspectra in the near-infrared range, the lower energyside was extended to 2700 cm-1 to cover the three-phonon region of diamond absorption, which—likethe two-phonon region absorption in the middle-infrared region—can be employed to calibrate theabsorption intensity of other defects. A 6¥ beamcondenser focused the incident beam on the sam-ple, and a total of 1,024 scans (per spectrum) werecollected to improve the signal-to-noise ratio.
Low-temperature photoluminescence (PL) spectrawere recorded using a Renishaw 1000 Ramanmicrospectrometer with an Argon-ion laser at twodifferent laser excitations: 488.0 nm (for the range490–850 nm) and 514.5 nm (for the range 517–850nm). PL spectra of 15 stones were also collected usinga Diode laser (780 nm) for the range 782–1000 nm.The samples were cooled by direct immersion in liq-uid nitrogen. Up to three scans were accumulated insome cases to achieve a better signal-to-noise ratio.
RESULTSVisual Appearance. All the samples had an obviouscoloration that ranged from pink/red to purple andbrown, as well as combinations thereof (again, seefigure 2). In the face-up position, all samplesappeared homogeneously colored; however, whenviewed face-down, a few samples revealed subtle tomore distinct uneven coloration (see below). Whencolor graded, the majority of the samples fell withina relatively small area of color space. These are inthe GIA hue ranges of purple-red to orangy red (fig-ure 3), as well as in a rather confined area of toneand saturation.
Microscopic Characteristics. Internal and SurfaceFeatures. A broad range of internal characteristicswere noted, including predominant octahedralgrowth sectors and color zoning, as well as a varietyof natural mineral inclusions. Although these indi-cated that the diamonds had grown naturally (i.e.,were not synthetic), they also showed evidence ofstrong alterations due to treatment in a laboratory.
8 LUCENT TREATED-COLOR DIAMONDS GEMS & GEMOLOGY SPRING 2005
Figure 2. This group of 12 stones (0.14–0.65 ct) repre-sents the range of colors Lucent Diamonds is market-ing as “Imperial Red Diamonds.” These treated-colornatural-origin diamonds have been produced by a newtreatment method, which involves HPHT annealing,irradiation, and low-pressure annealing at relativelylower temperatures. Photo © Harold & Erica Van Pelt.

LUCENT TREATED-COLOR DIAMONDS GEMS & GEMOLOGY SPRING 2005 9
In several of the samples, we observed precipitationof graphite at the interface between euhedral miner-al inclusions and the host diamond, leading to theformation of large dark gray to black inclusions thathad a very coarse surface texture (figure 4). Theeuhedral morphology of these inclusions was com-parable to olivine or garnet, two very commoninclusions in natural diamonds, and was distinctlydifferent from that of metallic inclusions in synthet-ic diamonds. Although the identification of theseinclusions was difficult due to the fact that they arecovered entirely with graphite, their coarse textureand appearance was very distinctive. Some of thegraphitized inclusions were also associated withstress fractures that had a similar texture and appear-ance (figure 5). Cleavages revealed inner surfacesthat had been etched (figure 6), and a few stones dis-played severely etched areas or facets on or adjacentto the girdle that had not been repolished (figure 7).
Strain. Most of the samples showed weak to mod-erately intense strain when they were viewed with
Figure 3. This colorwheel illustrates therange of hues of most ofthe diamonds treated bythe new method. Thesamples examined weregiven the following GIAcolor grades: FancyDeep pink, brownishpink-purple, brown-pink, and pink-brown;Fancy purplish red,brownish purplish red,brownish purple-red,reddish brown, andbrown-red; and FancyDark reddish brown,red-brown, and orangybrown. Brown colors,which depend on thedegree of tone relative tothe saturation of thehue, are not representedin this diagram.
Figure 4. A very coarsely textured graphitization of thediamond surrounding naturally occurring mineralinclusions and along associated stress fractures wascommonly seen in many of the Lucent samples. Thegraphitization was induced by the HPHT treatmentconditions. The morphology of the mineral inclusionsresembles that of olivine or garnet, which occur asinclusions only in natural diamonds; the metallicinclusions seen in many synthetic diamonds have avery different shape and appearance. Photomicrographby C. P. Smith; magnified 62¥.

the microscope between crossed polarizing filters.For the most part, the strain was in banded patternsthat followed the octahedral growth zoning,exhibiting predominantly gray-to-blue interferencecolors (figure 8). A few samples, however, revealedhigher levels of strain that were associated withmottled or “cellular” patterns (figure 9), similar tothe patterns seen in natural-color type Ia pink-to-red or purple diamonds (see, e.g., figure 15 in Kinget al., 2002, p. 140).
Internal Growth Structures and Color Zoning.Some of the most characteristic features of these
diamonds can be seen in their color zoning and itsrelation to the internal growth structures. In thesestones, thick or extended regions of color wereseen to conform to internal growth structures (i.e.,various crystal faces). Visually, this resulted in var-ious color concentrations that were a combinationof straight and angular, including color zoning thatappeared very irregular because of internal regionsthat had a more complex growth history. In addi-tion, typically these color zones exhibited sharp,
10 LUCENT TREATED-COLOR DIAMONDS GEMS & GEMOLOGY SPRING 2005
Figure 7. Small, severely etched areas were present onor near the girdles of several samples, indicating thatthe damage caused by certain phases of the treatmentprocess had not been completely removed by repolish-ing. This kind of coarse etching is unlike what may beencountered when etching takes place in nature.Photomicrograph by C. P. Smith; magnified 50¥.
Figure 8. Most of the samples exhibited relativelyweak to moderately intense strain when viewedbetween crossed polarizing filters. The banded patternshown here follows the octahedral growth planes.This type of strain is not seen in HPHT- or CVD-grown synthetic diamonds, providing additional con-firmation that these Lucent diamonds are naturallygrown. In addition, this type of strain is not typical ofnatural-color type Ia pink-to-red or purple diamonds.Photomicrograph by C. P. Smith; magnified 22¥.
Figure 5. Graphitization was also evident along inter-nal stress fractures. Typically, these stress fracturesdisplayed a narrow, highly reflective fringe along theoutermost extension of the fracture that was probablyinduced by the expansion pressure created when thewalls of the stress fractures converted to graphite.Photomicrograph by C. P. Smith; magnified 58¥.
Figure 6. Cleavages that reached the surface exhibiteddistinct etching along their full extent. Such etching isalso evidence of HPHT treatment. Photomicrographby C. P. Smith; magnified 52¥.

clearly defined color boundaries. Such color zoningis very different from that encountered in natural-color pink-to-red diamonds, where localized colorconcentrations relate to colored “graining” that iscaused by plastic deformation (see Discussion sec-tion below).
The color zoning of the Lucent samples typical-ly ranged from pink to purple-pink and brown to
purple-brown of varying saturation. In a few of thesamples, this color zoning was rather subtle andtypically consisted of more highly saturated pinkzones bordered by less-saturated zones of the samehue (figure 10). In other samples, however, thecolor zoning was much more obvious, consisting ofsaturated zones of pink-to-red color bordered bygrowth sectors that were paler pink to near-color-less (figure 11). A few of the diamonds had all threetypes of color zoning: consisting of regions or
LUCENT TREATED-COLOR DIAMONDS GEMS & GEMOLOGY SPRING 2005 11
Figure 12. A few diamonds contained distinct pink-to-red zones in some areas, with brown and near-color-less zones in others. Photomicrograph by C. P. Smith;magnified 28¥.
Figure 11. In this sample, the color zoning is moreobvious, concentrated within complex, naturallyoccurring growth sectors. Here, saturated pink zonesoccur adjacent to paler pink to near-colorless growthsectors that for the most part follow octahedral crystalfaces. Again, this form of pink-to-red color zoning isdistinctly different from the linear pink-to-red grain-ing that typically extends in only one direction in nat-ural-color diamonds of this hue, Photomicrograph byC. P. Smith; magnified 48¥.
Figure 9. A few of the samples exhibited a higherdegree of strain, in a mottled or “cellular” pattern,similar to that seen in natural-color natural dia-monds in this color range (but not encountered insynthetic diamonds). Photomicrograph by C. P.Smith; magnified 32¥.
Figure 10. All the samples showed characteristic colorzoning that was homogeneous or followed straight toangular growth sectors. In some samples, the zoningwas subtle, occurring as highly saturated and less-sat-urated zones of the same hue. This is distinctly differ-ent from the colored graining evident in natural-colorpink to red, purple, and brown diamonds, which isdue to plastic deformation–related defects.Photomicrograph by C. P. Smith; magnified 40¥.

growth sectors that were saturated pink to purple-pink, brown to purple-brown, and pale pink tonear-colorless (figure 12).
DiamondView Imaging. The luminescence imagesof the stones we examined revealed complexgrowth patterns (figure 13), as expected for naturaldiamonds. An orange-red fluorescence color domi-nated most growth sectors, while some other areaswere orangy yellow to green, blue, or just dark inappearance. The confinement of the strong orangefluorescence to growth sectors was consistent withthe color zoning observations described above.These patterns are a direct reflection of the largevariation in the type and concentration of defects,as well as of the complex growth history, of mostnatural diamonds. Neither the fluorescence northe growth features that are characteristic of syn-thetic diamonds (see, e.g., Wang et al., 2003;Shigley et al., 2004) were observed in these stones,
which confirmed their natural origin. Theobserved patterns are mostly attributed to octahe-dral {111} growth planes.
Visible Luminescence. There are certain defect cen-ters in diamond that yield luminescence to visiblelight (refer to the UV-Vis-NIR Spectroscopy andRaman PL Spectroscopy sections below). Whenthese centers are strong enough, distinctive lumines-cence may be seen in a microscope, a loupe, or evenwith the unaided eye if the stones are viewed with astrong light source. All the stones we examinedexhibited a green luminescence to visible light thatranged from moderate to very strong; it was ratherhomogeneous in some samples, while heavily zonedin others (figure 14). This green luminescence isrelated to H3 emission centered at 503 nm. A strongorange-red luminescence was also seen in all sam-ples. This luminescence relates to (N-V)- emissioncentered at 637 nm and was variable in appearance,
12 LUCENT TREATED-COLOR DIAMONDS GEMS & GEMOLOGY SPRING 2005
Figure 13. DiamondView imagesrevealed that the Lucent treated-color diamonds (0.20–0.91 ct) have acomplex growth history that is verydifferent from that of HPHT- or CVD-grown synthetic diamonds. The dom-inant luminescence was orange-red,although several also exhibited astrong orangy yellow to green hue,while some stones or growth zoneswere blue or inert. Images by W.Wang and C. M. Breeding.

ranging from homogeneous to an alignment withthe internal growth structures. In addition, a fewsamples also displayed zones of yellow lumines-cence attributed to (N-V)0 emission centered at 575nm. When all three luminescence colors were pre-sent in the same stone, they made for a very colorfulimage of the internal growth structures (figure 15),which we had not encountered previously.
Fluorescence. All the samples displayed a distinc-tive, moderate-to-strong, very chalky fluorescencereaction when exposed to either long- or short-waveUV radiation. In general, these diamonds revealedcombinations of yellow, green, and orange fluores-cence on exposure to long-wave UV, although acouple of samples also exhibited blue fluorescence.With close inspection, zoning (often subtle) could beseen between the different colors (figure 16). Toshort-wave UV, these diamonds displayed a ratherconsistent moderate-to-strong orange and yellowfluorescence. In most samples, the orange fluores-cence dominated, and the yellow could be seen inonly certain areas, such as near the culet (figure 17).No phosphorescence was evident in any of the sam-ples following exposure to long- or short-wave UV.
UV-Vis-NIR Spectroscopy. Overall, of the 41stones included in this study, most revealed simi-lar absorption features in the ultraviolet to visibleand near-infrared regions of the spectrum,
although certain variations were noted (figure 18).The most dominant series of bands includedstrong absorptions at 415 nm (N3), 503 nm (H3),575 nm (N-V)0, and 637 nm (N-V)-, which wereevident in all the samples. Of these, the absorp-tion at 637 nm was consistently the most intense.A weak absorption at 496 nm (H4) was recorded
LUCENT TREATED-COLOR DIAMONDS GEMS & GEMOLOGY SPRING 2005 13
Figure 14. Green luminescence to visible light (relatedto the H3 center) was seen in all samples. In mostsamples, this luminescence followed the internalgrowth structures, as with the stepped octahedral zon-ing seen here. In some, however, the green lumines-cence was more evenly distributed throughout.Photomicrograph by C. P. Smith; magnified 35¥.
Figure 15. Strikingly, when exposed to a strong lightsource, several of the samples exhibited all three lumi-nescence colors—green, orange-red, and yellow—pro-ducing a combination of colors unlike any the authorshad seen previously in a natural-color diamond.Photomicrograph by C. P. Smith; magnified 27¥.
Figure 16. This image reveals the typical, chalky long-wave UV fluorescence of the “Imperial” treated-colordiamonds, which results from a combination oforange, yellow, and green fluorescing zones. Such areaction is not seen in natural-color pink-to-red andpurple diamonds. Photomicrograph by C. P. Smith;magnified 10¥.

in most samples (31 total); in only one of thesewas the H4 stronger than the H3. Half the sam-ples had absorption at 594 nm that varied greatlyin intensity from one sample to the next . In mostcases, this band was weak to moderate, but it wasextremely strong in three samples. In those sam-ples where we detected the 594 nm absorption,we also typically recorded a weak 741 nm (GR1)absorption, as well as a weak 805 nm absorption.However, the 805 nm band also occurred in somestones that did not reveal either the 594 nm orGR1 features. Several of the samples that hadboth the 594 nm and GR1 also showed weakabsorptions at 425 and 527 nm; five of theseshowed a very weak absorption at 394 nm (ND1).
When the samples were cooled and viewed witha standard handheld spectroscope, similar featureswere noted, consisting of strong, sharp lines at 415,503, and 637 nm in all the samples, as well as sharp,weak-to-moderate lines at 575 and 594 nm in manyof them.
IR Spectroscopy. All the diamonds we tested provedto be type Ia. The concentrations and relative aggre-gation states of nitrogen varied significantlybetween samples (figure 19). Absorption features at1280 and 1215 cm-1 are attributed to nitrogen in theA-aggregate form (nitrogen atoms in pairs), and
those at 1170 and 1010 cm-1 are attributed to nitro-gen in the form of B-aggregates (four nitrogen atomssurrounding a common vacancy). In general, theconcentration of A-aggregates was significantlyhigher than B-aggregates. This trend held true for allexcept seven of the samples, where the nitrogenwas dominantly in the B-aggregate form. Using aspectral fitting calibration against the two-phononabsorption of diamond, we estimated the totalnitrogen content to range from 23 to 322 ppm. Inaddition, most of the samples displayed weak-to-moderate absorption bands at 3107 and 1405 cm-1,which are related to hydrogen impurities.Interestingly, the samples with nitrogen predomi-nantly in the B-aggregate form also revealed signifi-cantly stronger hydrogen absorption.
A relatively strong absorption at 1450 cm-1
(H1a—an interstitial nitrogen atom; Woods, 1984)and a weak absorption at 1344 cm-1 related to iso-lated nitrogen impurities (type Ib component) wererecorded in all samples. Again using spectral fitting
14 LUCENT TREATED-COLOR DIAMONDS GEMS & GEMOLOGY SPRING 2005
Figure 18. The absorption spectra through the ultravi-olet, visible and near infrared regions show strongabsorption features from several defect centers includ-ing the N3, H3, (N-V)0, and (N-V)-, which are typicalof these treated-color diamonds. These absorption fea-tures combine to produce a transmission “window”in the red region, which is responsible for the pink/redcoloration of these stones. In addition, absorptionswith varying intensities at 394 (ND1), 425, 496 (H4),527, 594, 741 (GR1), and 805 nm were also observedin several of the samples. The upper spectrum is froma 0.40 ct purplish pink diamond, and the lower spec-trum is from a 0.41 ct brown-pink diamond. The spec-tra are offset vertically for clarity.
Figure 17. The reaction to short-wave UV of these dia-monds is also highly indicative of the treatment, dis-playing a consistent moderate-to-strong orange andyellow fluorescence. In most samples, the orange fluo-rescence dominated; the yellow was seen only in cer-tain areas, such as near the culet in this sample.Photomicrograph by C. P. Smith; magnified 10¥.

techniques, we calculated the intensity of the H1aabsorption at around 0.2–1.2 cm-1 and estimatedthe concentration of isolated nitrogen at 3–28 ppm.Another common feature of varying intensity wasthe nitrogen platelet peak at ~1360 cm-1. In thesamples in which this peak was absent or veryweak, two very weak absorptions at 1358 cm-1
(intensity of 0.04 to 0.1 cm-1) and 1355 cm-1 (0.04 to0.1 cm-1) were also evident.
In the near-infrared region (figure 20), the domi-nant features included strong absorptions at 5165cm-1 (H1c) and/or 4935 cm-1 (H1b). The relativeintensity of the H1b to H1c was determined to beproportional to the diamond’s nitrogen aggregationstate (see, e.g., Collins et al., 1986). In those dia-monds that were dominated by A-aggregates, virtu-ally no H1c was detected, whereas the diamondwith B>>A aggregations of nitrogen exhibited amuch stronger H1c absorption than H1b. A moder-ate-to-strong H2 (negatively charged N-V-N center)absorption at ~10125 cm-1 (987.7 nm) was also seen
in all samples, with an intensity that varied from0.05 to 0.6 cm-1 (majority >0.2 cm-1). The intensityof the H2 absorption had a direct correlation to theconcentration of A-aggregates. In one sample, theintensity of the H2 was 0.5 cm-1 correlated to an A-aggregate concentration of 143 ppm. Another sam-ple with an A-aggregate concentration of only 10ppm had an H2 absorption intensity of only 0.1 cm-1.Another sharp, relatively strong absorption wasrecorded at 6170 cm-1 in all the samples tested. Theoccurrence of this absorption in diamond wasreported only very recently (see further commentsbelow; De Weerdt and Anthonis, 2004). To date, nocorrelation is evident between the 6170 cm-1 peakand the presence of H1a, H1b, or H1c.
Raman PL Spectroscopy. Low-temperature photolu-minescence spectra revealed dominant PL bands ofthe same wavelength as the absorption bandsrecorded with the spectrophotometer. In addition tothe strong emissions from the H3, (N-V)0, and (N-V)- centers, we also noted H4 emission at 496 nm ofvariable intensity in all the samples (figure 21). Forthose samples that were nearly pure type IaA, theH4 luminescence was the weakest. At 535 nmanother weak intensity band was also commonlyrecorded. A weak but sharp emission at 588 nm was
LUCENT TREATED-COLOR DIAMONDS GEMS & GEMOLOGY SPRING 2005 15
Figure 19. These representative absorption spectra inthe mid-infrared range illustrate the large variationin nitrogen concentration of these treated-color dia-monds. All of the stones in this study were classifiedas type Ia, and most are dominated by the A-aggre-gate form of nitrogen. However, a few samples (e.g.,black line) contained more B-aggregates than A-aggregates. Also note the relatively strong H1aabsorption at 1450 cm-1, and the weak absorption at1344 cm-1, which is related to isolated nitrogen.Very weak absorptions at 1358 and 1355 cm-1 werealso observed in those samples that had little or noplatelet peak absorption at ~1360 cm-1. The spectraare offset vertically for clarity.
Figure 20. Strong H1c and/or H1b absorption lines, aswell as a sharp peak at 6170 cm-1, are features com-monly seen in the near-infrared absorption spectra ofthese treated-color diamonds. A very strong H1coccurred in another sample, which was dominated bythe B-aggregate form of nitrogen (black curve). A mod-erately strong H2 absorption was observed in all sam-ples. The spectra are offset vertically for clarity.

evident using both the 488 and 514 nm laser excita-tions. This independent 588 nm emission typicallywas superimposed onto the broad side band of 575nm (N-V)0. The 588 nm emission was observed in22 of the samples; the GR1 and 594 nm featureswere also detected in the absorption spectra of thesesame samples.
DISCUSSION The Treatment Method. A recent patent by one ofthe Russian scientists associated with LucentDiamonds describes the methods by which redcolor may be produced in diamonds in a laboratory(Vins, 2004). The technique consists of generatingisolated nitrogen in natural type Ia diamond viaHPHT conditions (6–7 GPa at over 2150°C), fol-lowed by irradiation using a high-energy electronbeam and further annealing in a vacuum at a tem-perature no lower than 1100°C. Based on the resultsof our analyses, it is evident that the Lucent“Imperial” pink to red treated-color diamonds wehave examined have been processed by a similarmethod. This is based on several standard gemologi-cal and spectroscopic features.
First, the severe graphitization and etching seenwith magnification clearly indicate that these dia-monds were exposed to HPHT conditions. In addi-tion, the presence of isolated nitrogen in theinfrared spectrum is consistent with the de-aggrega-tion of nitrogen defects under similar conditions(see, e.g., Fisher and Spits, 2000), although the pres-
ence of isolated nitrogen alone is not proof of HPHTtreatment. Further evidence of irradiation-induceddefects is provided by the 594, 637, and 741 (GR1)absorptions in these type IaAB diamonds with a Ibcomponent. The presence of the H1b and/or H1cbands in the near-infrared region is also consistentwith annealing subsequent to irradiation. When atype Ia irradiated diamond is annealed at around1000°C, the 594 nm center is removed, thus produc-ing H1b and/or H1c lines (Collins, 1982). Alsoimportant is the presence of a much less stabledefect in some of the samples, the ND1, which isremoved at temperatures above 500°C (Zaitsev,2001). When this band occurs in combination withthe 594 nm band as well as H1b and H1c absorp-tions, it is indicative of a multi-step process involv-ing HPHT annealing, irradiation, and relativelylower temperature, low pressure annealing.
In the patent, the overall nitrogen concentrationis described as exceeding 800 ppm. However, duringthe course of our investigation, we determined thatthe total nitrogen concentration in the diamondswe tested was 23–322 ppm.
Characterization of the Samples. The majority ofthe diamonds were darker in tone and higher in sat-uration than the natural-color diamonds we haveencountered in this hue range. However, there weretwo samples—a Fancy Deep pink and a Fancy Deepbrown-pink—that closely resembled the appearanceof natural-color diamonds.
The mineral inclusions we observed with magni-fication identified the diamonds as being naturallygrown. However, the heavily graphitized and etchedfeatures also clearly indicated that these stones hadbeen exposed to high pressure/high temperature(HPHT) processing. The larger, more massive,coarsely textured black to dark gray inclusions wereforeign minerals that experienced severe graphitiza-tion of the diamond at the interface between theincluded crystal and the diamond host. The HPHTconditions were also responsible for the graphitiza-tion along internal fractures and the etchingobserved along surface-reaching cleavages and inthose areas at the surface that were not repolishedfollowing treatment. It is important to note thatgraphitization may take place naturally in diamond;however, such natural inclusions are very differentin appearance from these samples. It also should benoted that, depending on the specific HPHT condi-tions, there may be significantly less graphitizationand etching in some treated samples.
16 LUCENT TREATED-COLOR DIAMONDS GEMS & GEMOLOGY SPRING 2005
Figure 21. Photoluminescence spectra collected usingan Ar-ion laser (488 nm excitation) exhibited strongemissions at 503, 575, and 637 nm. Weak luminescencepeaks were also observed in some samples at 496, 535,and 588 nm. The spectra are offset vertically for clarity.

In type Ia natural diamonds, naturally occurringpink-to-red and purple coloration is clearly associat-ed with zones exhibiting plastic deformation. As aresult, when such stones are viewed betweencrossed polarizing filters, they typically reveal veryhigh levels of strain (see, e.g., figure 15 in King et al.,2002, p. 140). The strain visible in these treated-colorsamples was significantly weaker. In only a few ofthe Lucent samples did the strain levels approachwhat is typical for their natural-color counterparts.
The thick and extended regions of color zoningthat were present in these samples occurred in avariety of straight, angular, and irregular patterns.Such color zoning is very different from that encoun-tered in natural-color pink-to-red diamonds, whichis visible as straight, parallel color zones that extendin only one direction and typically do not have sharpboundaries (see, e.g., Koivula, 2000, p. 92).
The DiamondView imaging accentuates thecomplex growth structure of these natural dia-monds, which involves the development of primari-ly octahedral {111} growth planes. The large varia-tion in fluorescence colors (red, orange, yellow,blue, and green) as well as the dark areas where nofluorescence was evident, is a direct reflection of thespecific type and concentration of defects beforetreatment and the resultant reconfiguration of thedefects by the treatment process. These features aremarkedly different from those of synthetic dia-monds created by HPHT or CVD techniques, andthey confirm the natural origin of these samples(Wang et al., 2003; Shigley et al, 2004).
When illuminated by a strong light source, green(H3) luminescence has been seen in many naturallycolored, as well as artificially colored, diamonds(Fritsch, 1998; Reinitz et al., 2000). (It is oftenreferred to as “transmission luminescence,” thoughthis is not strictly correct.) A weak orange-red lumi-nescence due to N-V centers may be seen in somenatural-color pink diamonds; however, it is morecommonly associated with treated-color pink-to-reddiamonds with moderate to high color saturation(see, e.g., Shigley et al., 2004). Nevertheless, we hadnot previously witnessed the combination of green(H3), orange-red (N-V)-, and yellow (N-V)0 visibleluminescence seen in these treated-color diamonds.Nor have we encountered in natural-color pink-to-red diamonds the strong, chalky orange, green, andyellow fluorescence to long-wave UV that was evi-dent in these treated stones.
The “Imperial” treated-color diamonds in thisstudy owed their color to the absorption of N-V cen-
ters positioned at 575 and 637 nm, with some influ-ence from other absorption features. The introductionof a relatively high concentration of H3/H4 defects,which absorb blue-green light, is essential to generatea pure red hue. If the H3/H4 absorptions are notstrong enough, a distinct purple hue will be devel-oped, as was observed in some of the stones we tested.High concentrations of the A/B form of nitrogen arenecessary to generate H3/H4 defects during treat-ment. Additionally, if the absorption of the N-V cen-ters is not strong enough relative to the absorption ofthe H3 and H4 centers, then brown colors develop.
In contrast, the vast majority of natural-colorpink-to-red diamonds owe their hue to a broadabsorption band centered at approximately 550 nm(e.g., Collins 1982; King et al., 2002; Moses et al.,2002). To date, we are not aware of any reports ofthe artificial introduction of the 550 nm band intype I natural diamonds. We have examined a smallnumber of natural-color pink diamonds that owetheir color to N-V centers. Typically, these dia-monds are rather pale in color and are classified astype IIa. However, we have not observed strong H3or N3 absorption in such diamonds.
The physics responsible for the 588 nm peak vis-ible in the PL spectra of some samples is not fullyunderstood (Zaitsev, 2001). On initial consideration,there seemed to be some correlation between theoccurrence of this peak and the color saturation ofthe diamonds. After further investigation, however,we found that the 588 nm emission may also beobserved in some natural green-yellow diamondsthat have high concentrations of H3 centers.
The 6170 cm-1 absorption in the infrared isanother little-known defect. Its occurrence, reportedin previous publications and the present study, isclosely related to irradiation and annealing, eithernaturally or in the laboratory. De Weerdt andAnthonis (2004) first reported a peak at 6172 cm-1
in a treated diamond and, based on their experi-ments, suggested that it resulted from a complextreatment process. In addition, Hainschwang et al.(in preparation) have correlated a band at 6165 cm-1
to the presence of H1c centers in irradiated andannealed diamonds. In this study of a large set ofsamples, we found no such correlation. However,those samples with the strongest 6170 cm-1 band ingeneral had very weak H1b/H1c bands and relative-ly stronger 594 nm absorption. In unpublished datafrom ongoing research at GIA, we have recorded theoccurrence of this band (with position varyingslightly from 6170 to 6168 cm-1) in a few naturally
LUCENT TREATED-COLOR DIAMONDS GEMS & GEMOLOGY SPRING 2005 17

irradiated diamonds as well. A few of those natural-color stones displayed green radiation stains. Allthese observations indicate that the 6170 cm-1
absorption represents a defect that may be intro-duced via irradiation and annealing processes, eitherin the laboratory or in nature. Consequently, we donot consider the presence of this band as conclusiveof color treatment on its own.
Although we did not perform stability testingper se, we concluded—based on the kinds of defectsobserved and their concentrations—that the colorsproduced by the multiple-step treatment processdescribed here are both stable and permanent tonormal conditions of wear and care. In addition, wedid not detect any residual radioactivity.
IDENTIFYING CHARACTERISTICSA number of standard gemological properties andadvanced analytical features will readily identifythat these stones are naturally grown and their colorhas been artificially induced. The fact that they weregrown in nature can be confirmed by the presence ofcharacteristic mineral inclusions and distinctiveinternal growth structures, as well as by the lack ofthe inclusion features and growth structures typicalof HPHT- and CVD-grown synthetic diamonds.With standard gemological techniques, the artificialcoloration can be identified by the strongly alteredinclusion features in combination with the differ-ences in appearance of the pink-to-purple or browncolor zoning in these samples as compared to thecolored graining in natural-color diamonds. In addi-tion, with a standard handheld spectroscope, the dis-tinctive combination of strong 415, 503, and 637 nmabsorption lines, as well as weak-to-moderate 575and 594 absorption lines, clearly identifies the treat-ed origin of the color. Furthermore, the unique long-and short-wave UV fluorescence reactions are clearindicators that this material has been treated.
The more advanced analytical techniques alsorevealed some interesting identification criteria that
appear to be unique to this process. The occurrenceof trace isolated nitrogen, together with H3 and H2centers, are some of the common features related toHPHT treatment, whereas defects such as H1a,H1b, H1c, (N-V)-, 594 nm, (N-V)0, H3, and H4 com-monly occur in diamonds that have been exposed toradiation. Although these defects may occur in nat-ural-color diamonds, we have not seen a knownnatural-color diamond that has all of these features.The absorption at 6170 cm-1, although not proof,may also suggest color treatment.
CONCLUSIONNaturally colored diamonds in the pink-to-red huerange are some of the most exotic and expensivegemstones. At auction, such diamonds have achievedas much as US$895,000 per carat (Balfour, 2000). As aresult, various forms of treatment have been appliedin attempts to recreate these highly desirable colors.Previously, these ranged from simple topical coatings(e.g., Moses et al., 2004) to move advanced techniquessuch as irradiation of type Ib diamonds(Crowningshield, 1959; Crowningshield and Reinitz,1995) and HPHT annealing of type IIa diamonds (e.g.,De Beers Industrial Diamonds et al., 2001).
Most recently, Lucent Diamonds has intro-duced treated-color pink-to-red natural diamondsinto the marketplace under the trade name“Imperial Red Diamonds.” The Lucent groupbegan developing the technology to produce thesestable colors on a commercial basis toward the endof 2003, and they first offered them for sale in thesummer of 2004. Our investigations confirmed thata combination of treatment techniques, includingHPHT annealing and irradiation, are applied toinduce the coloration in these diamonds, consis-tent with the process described by Vins (2004).They can be readily identified by their distinctiveinclusion features, color zoning, and long- andshort-wave UV fluorescence, as well as by theirunique combination of spectroscopic features.
18 LUCENT TREATED-COLOR DIAMONDS GEMS & GEMOLOGY SPRING 2005
ABOUT THE AUTHORSDr. Wang is research scientist, Mr. Smith is director of identi-fication services, Mr. Hall is manager of analytical researchservices, and Mr. Moses is vice president of identification andresearch at the GIA Gem Laboratory in New York. Dr.Breeding is research scientist at the GIA Gem Laboratory inCarlsbad, California.
ACKNOWLEDGMENTS: The authors are grateful to AlexGrizenko, president of Lucent Diamonds Inc., for supplyingspecimens for this study, and to Dr. Victor Vins, research anddevelopment manager of New Diamonds of Siberia, Novosibirsk,Russia, for many helpful discussions. They also thank John Kingand Joshua Cohn, of the GIA Gem Laboratory in New York, forcareful color grading observations and useful discussions.

LUCENT TREATED-COLOR DIAMONDS GEMS & GEMOLOGY SPRING 2005 19
REFERENCESBalfour I. (2000) Famous Diamonds. Christie, Manson & Woods,
London.Collins A.T. (1982) Colour centres in diamond. Journal of
Gemmology, Vol. 18, No. 1, pp. 37–75.Collins A.T., Davies G., Woods G.S. (1986) Spectroscopic studies
of the H1b and H1c absorption lines in irradiated, annealedtype-Ia diamonds. Journal of Physics C: Solid State Physics,Vol. 19, pp. 3933–3944.
Crowningshield G.R. (1959) Highlights at the Gem Trade Lab inNew York. Gems & Gemology, Vol. 9, No. 9, pp. 268–270.
Crowningshield G.R., Reinitz I. (1995) Gem Trade Lab Notes:Treated-color pink diamond. Gems & Gemology, Vol. 31, No.2, pp. 121–122.
De Beers Industrial Diamonds, Spits R.A., Burns R., Fisher D.(2001) High Temperature/Pressure Color Change of Diamond.International (PCT) patent application WO 01/72404A1, filedApril 2.
De Weerdt F., Anthonis A. (2004) A new defect observed in irra-diated and heat treated type Ia diamonds. The 55th DiamondConference, July 5–7, 2004, Warwick, England, p. 17.
Fisher D., Spits R.A. (2000) Spectroscopic evidence of GE POLHPHT-treated natural type IIa diamonds. Gems & Gemology,Vol. 36, No. 1, pp. 42–49.
Fritsch E. (1998) The color of diamond. In G. E. Harlow, Ed., TheNature of Diamonds, Cambridge University Press, Cambridge,U.K., pp. 23–47.
Hainschwang T., Fritsch E., Notari F., Massi L. (in preparation)The properties of irradiated and annealed diamonds exhibitingan undescribed near-infrared absorption.
Hall M., Moses T. (2000) Gem Trade Lab Notes: Diamond—blueand pink HPHT annealed. Gems & Gemology, Vol. 36, No. 3,pp. 254–255.
King J.M., Moses T.M., Shigley J.E., Liu Y. (1994) Color grading ofcolored diamonds in the GIA Gem Trade Laboratory. Gems& Gemology, Vol. 30, No. 4, pp. 220–242.
King J.M., Shigley J.E., Guhin S.S., Gelb T.H., Hall M. (2002)Characterization and grading of natural-color pink diamonds.Gems & Gemology, Vol. 38, No. 2, pp. 128–147.
Koivula J.I. (2000) The Microworld of Diamonds. GemworldInternational, Northbrook, IL.
Moses T., King J.M., Wang W., Shigley J.E. (2002) A highlyunusual 7.34 carat Fancy Vivid purple diamond. Journal ofGemmology, Vol. 28, No. 1, pp. 7–12.
Moses T., Smith C., Wang W., Hall M. (2004) Topical coating ondiamonds to improve their color: A long history. RapaportDiamond Report, Vol. 27, No. 20, pp. 91–93.
Orlov Yu. L. (1977) The Mineralogy of Diamond. Wiley Inter-science, New York, pp. 128–131.
Reinitz I.M., Buerki P.R., Shigley J.E., McClure S.F., Moses T.M.(2000) Identification of HPHT-treated yellow to green dia-monds. Gems & Gemology, Vol. 36, No. 2, pp. 128–137.
Shigley J.E., McClure S.F., Breeding C.M., Shen A.H.,Muhlmeister S.M. (2004) Lab-grown colored diamonds fromChatham Created Gems. Gems & Gemology, Vol. 40, No. 2,pp. 128–145.
Vins V.G. (2004) The Technique of Production of Fancy RedDiamonds. Russian Federation patent 2237113, filed June 26,2003, issued Sept. 27, 2004. [in Russian]
Wang W., Moses T., Linares R., Hall M., Shigley J.E., Butler, J.(2003) Gem-quality synthetic diamonds grown by a chemicalvapor deposition (CVD) method. Gems & Gemology, Vol. 39,No. 4, pp. 268–283.
Welbourn C.M., Cooper M., Spear P.M. (1996) De Beers naturalversus synthetic diamond verification instruments. Gems &Gemology, Vol. 32, No. 3, pp. 156–169.
Woods G.S. (1984) Infrared absorption studies of the annealing ofirradiated diamonds. Philosophical Magazine B, Vol. 50, pp.673–688.
Zaitsev A.M. (2001) Optical Properties of Diamond. Springer-Verlag, Berlin, 502 pp.

Chameleon diamonds are among the rarest of gem diamonds. This article reports on a unique col-lection of 39 chameleon diamonds ranging from 0.29 to 1.93 ct, which exhibited temporarychanges in color when heated to approximately 150°C and, for some, after prolonged storage inthe dark (i.e., thermochromic and photochromic color changes, respectively). Most changed from“olive” green to brownish yellow or yellow, although some changed from light yellow to a moreintense greenish yellow. The thermochromic and photochromic color change observed in the“olive” green chameleon diamonds is typical of “Classic” chameleons, whereas the solely ther-mochromic change shown by the light yellow group was the “Reverse” of that seen in Classicchameleon diamonds. The Classic and Reverse groups showed different spectroscopic and UV flu-orescence characteristics, but all stones exhibited strong long-lasting phosphorescence after short-wave UV excitation. Hydrogen was identified in all samples by FTIR spectroscopy, and minor Ni-related emissions were detected by photoluminescence spectroscopy in most. Using this combina-tion of reaction to UV radiation and spectroscopic properties, a gemologist can separatechameleon from other green diamonds without unnecessary exposure to heat.
he rarity of chameleon diamonds and theirinterest for the connoisseur are due to theirunusual ability to change color temporarily
when heated to about 150°C (“thermochromism”)or after prolonged storage in the dark (“photochro-ism”; see Fritsch et al., 1995). The stable colorshown by chameleon diamonds is typically grayishyellowish green to grayish greenish yellow(“olive”), while the unstable hue is generally amore intense brownish or orangy yellow to yellow(figures 1 and 2). After heating, the color of achameleon diamond quickly returns to its stablehue. The color change after storage in the dark isusually not as dramatic as that seen on heating.Some of these chameleons have a stable color rem-iniscent of “normal” green diamonds. While thegreen color of these diamonds is caused by expo-sure to radiation (either naturally or in the labora-tory), the mechanism behind chameleon col-oration is not yet well understood. Nevertheless,
chameleons are among the few green diamondsthat can be conclusively identified as natural color,since this behavior cannot be created or enhancedin the laboratory.
Relatively little has been written aboutchameleon diamonds, and the precise definition ofthis behavior is not at all clear. For some membersof the trade, a temporary photochromic colorchange must be present for a diamond to bereferred to as “chameleon”; in contrast, many pub-lications describe chameleon diamonds as havingeither a thermochromic (using rather low anneal-ing temperatures) or photochromic temporary colorchange (Raal, 1969; GIA Diamond Dictionary,1993; Fritsch et al., 1995).
20 CHAMELEON DIAMONDS GEMS & GEMOLOGY SPRING 2005
T
A GEMOLOGICAL STUDY OFA COLLECTION OF
CHAMELEON DIAMONDSThomas Hainschwang, Dusan Simic, Emmanuel Fritsch, Branko Deljanin, Sharrie Woodring, and Nicholas DelRe
See end of article for About the Authors and Acknowledgments.GEMS & GEMOLOGY, Vol. 41, No. 1, pp. 20–35.© 2005 Gemological Institute of America

Chameleon diamonds were first documented in1943 (GIA Diamond Dictionary, 1993), and sincethen they have been described in several briefreports (see, e.g., Chabert and Reinitz, 2000).Extensive research on a single large chameleon dia-mond was published by E. Fritsch and colleagues(1995). Most recently, Shigley et al. (2004) reportedadditional data on chameleon diamonds, includingthe presence of Ni-related emissions detected by
photoluminescence spectroscopy. We believe thepresent article is the first extensive study of a largenumber of chameleon diamond samples; it is partof ongoing research by EGL USA on colored dia-monds in collaboration with other gemological lab-oratories and universities worldwide. Some prelim-inary observations on this collection of chameleondiamonds were published by Deljanin (2004).
MATERIALS AND METHODSThirty-nine chameleon diamonds were included inthis study (as described in table 1 and illustrated infigure 3). Unfortunately, the geographic origins ofthese diamonds are unknown. The stones were pur-chased between 1987 and 2004: 40% were obtainedin India, 30% in Antwerp, and 30% in Tel Aviv. Allthe diamonds were accompanied by grading reportsfrom either GIA or EGL, which stated that, undercertain circumstances, they exhibited a change incolor.
The stable color of the chameleon diamondswas graded by the above laboratories, while theunstable color was described by two of the authors(TH and DS). Luminescence to ultraviolet radiationand phosphorescence were observed with a 4-wattUVP UVGL-25 Mineralight Lamp using 254 nm(short-wave) and 365 nm (long-wave) excitation.Observations between crossed polarizers weremade with a gemological microscope using Leicaoptics at 10–60¥ magnification. Color distributionwas studied with each stone immersed in methy-
CHAMELEON DIAMONDS GEMS & GEMOLOGY SPRING 2005 21
Figure 1. One of themore spectacularchameleon diamondsexamined for this studywas this 1.01 ct marquisediamond, shown atroom temperature (left)and at approximately150°C (right). Photo byT. Hainschwang.
Figure 2. These images show typical colorchanges seen in chameleon diamonds of theClassic (top, 0.83 ct) and Reverse (bottom, 1.09ct) types. The left images show the stable color,while the unstable color is on the right. Photosby T. Hainschwang.

lene iodide. The change in color was observedusing a 6500 K daylight-equivalent light and a hotplate (range of 40–325°C); the temperature duringthe heating process was monitored using a thermo-couple connected to a digital multimeter. The sam-ples were also cooled in liquid nitrogen to monitorpossible color changes induced by low temperature.
We recorded infrared spectra in the range of6000–400 cm-1 on a Nicolet Nexus 670 FTIR spec-trometer, using a diffuse reflectance (DRIFTS) acces-sory as a beam condenser to facilitate the analysis ofsmall faceted stones, with an accumulation of 100scans at a resolution of 2–4 cm-1. We recorded pho-
toluminescence spectra with the diamondsimmersed in liquid nitrogen (T ~~ –196°C), using anAdamas Advantage SAS2000 system equipped witha 532 nm semiconductor laser and an Ocean OpticsSD2000 spectrometer (resolution 1.5 nm) with a2048-element linear silicon CCD-array detector.Vis-NIR spectra in the range of 400–1000 nm werecollected with the SAS2000 system, using the samespectrometer and detector as described above, witha resolution of 1.5 nm and 60–250 sample scans.The measurements were performed using an inte-grating sphere at liquid nitrogen temperature. Also,to monitor changes due to heating, we recorded
22 CHAMELEON DIAMONDS GEMS & GEMOLOGY SPRING 2005
TABLE 1. The 39 chameleon diamonds in this study and their changes in color.
Stone no./ Classic or Magnitude of Grading laba Reverse group color change
1.1/GIA 0.39 ct round Classic Fancy Dark grayish Fancy Intense Stronggreenish yellow orangy yellow
1.2/GIA 0.64 ct marquise Classic Fancy Dark brownish Fancy Deep brownish Stronggreenish yellow orangy yellow
1.3/GIA 0.43 ct marquise Classic Fancy Dark grayish Fancy Deep brownish Strongyellowish green orangy yellow
1.4/EGL 0.63 ct marquise Classic Fancy Deep green yellow Fancy Deep brownish Weakgreenish yellow
1.5/GIA 1.60 ct pear Classic Fancy Dark yellowish brown Fancy Deep brownish Strongorangy yellow
1.6/GIA 0.46 ct pear Classic Fancy Dark grayish yellowish Fancy Intense orangy Stronggreen yellow
1.7/EGL 0.83 ct heart Classic Fancy Deep grayish Fancy Intense orangy Strongyellowish green yellow
1.8/GIA 1.75 ct cushion Classic Fancy Dark grayish Fancy greenish yellow Weakyellowish green
1.9/GIA 0.67 ct oval Classic Fancy Dark grayish Fancy Intense yellow Strongyellowish green
2.1/GIA 1.93 ct marquise Classic Fancy Deep brownish Fancy Deep brownish Stronggreenish yellow orangy yellow
2.2/GIA 0.72 ct marquise Classic Fancy brownish Fancy Deep orangy Stronggreenish yellow brown yellow
2.3/GIA 0.58 ct marquise Classic Fancy grayish greenish Fancy Deep brownish Strongbrown yellow orangy yellow
2.4/GIA 0.81 ct heart Classic Fancy Deep brownish Fancy Deep brownish Stronggreenish yellow orangy yellow
2.5/GIA 0.48 ct marquise Classic Fancy brownish yellow Fancy Intense yellowish Strongorange
2.6/GIA 0.29 ct marquise Classic Fancy brownish greenish Fancy Intense orangy Strongyellow yellow
2.7/GIA 0.57 ct heart Classic Fancy grayish greenish Fancy brownish yellow Strongyellow
2.8/EGL 0.46 ct round Classic Fancy Deep brownish Fancy Deep brownish Stronggreenish yellow orangy yellow
2.9/EGL 0.52 ct round Reverse Fancy Light brownish yellow Fancy greenish yellow Moderate
aDescriptions of the unstable colors for all of the diamonds were determined by the authors. Note that, presently, GIA only recognizes the Classic type (and not the Reverse type) as a chameleon diamond.
Weight and shape Stable color Unstable colora

spectra at room temperature as well as with somestones heated to approximately 325°C; the highertemperature was used to assure that the diamondwas in its unstable color state during the accumula-tion of the spectrum.
In addition to the 39 diamonds included in thechameleon collection, one additional chameleon dia-mond was analyzed (box A); the sample, referencedas TH-A1, was first described by Hainschwang(2001). An FTIR spectrum of a hydrogen-richchameleon diamond, which was not part of the col-lection, called “TH-cham1,” is included to comparethe strength of color change with hydrogen content.
RESULTSColor Description. Two different stable-colorgroups were observed in the chameleon diamonds(see figure 3, top):
1. Green with a gray, brown, or yellow color compo-nent (“olive”); or yellow with green, brown, orgray modifying colors. These are referred to here-after as “Classic.”
2. Light yellow with typically a greenish, grayish, orbrownish component. These are referred to as“Reverse.”
3.2/GIA 1.52 ct oval Classic Fancy grayish yellowish green Fancy Deep brownish yellow Strong3.3/GIA 0.47 ct marquise Classic Fancy grayish yellowish Fancy brownish yellow Strong
green3.4/GIA 0.58 ct marquise Classic Fancy Deep brownish yellow Fancy Deep brownish Strong
yellow3.5/GIA 1.01 ct marquise Classic Fancy grayish yellowish Fancy Intense yellow Strong
green3.6/GIA 1.54 ct marquise Classic Fancy gray yellowish green Fancy grayish yellow Moderate to
strong3.7/GIA 0.41 ct round Classic Fancy Dark greenish gray Fancy Intense yellow Strong3.8/GIA 0.29 ct round Classic Fancy Dark greenish gray Fancy Deep brownish Strong
yellow3.9/GIA 0.47 ct round Classic Fancy Dark grayish Fancy Intense yellow Strong
yellowish green3.10/GIA 0.47 ct round Classic Fancy grayish yellowish Fancy Intense yellow Strong
green3.11/GIA 0.51 ct round Classic Fancy gray greenish yellow Fancy greenish yellow Moderate3.12/GIA 0.39 ct round Classic Fancy yellowish-yellowish Fancy orangy yellow Strong
green4.2/GIA 0.47 ct round Classic Fancy Light yellow Fancy greenish yellow Weak4.3/EGL 0.57 ct round Reverse Light grayish greenish yellow Fancy yellow-green Moderate4.4/GIA 0.56 ct round Classic Fancy Light grayish greenish Fancy brownish yellow Weak
yellow4.5/EGL 0.59 ct round Reverse Very Light yellow Fancy Light greenish Moderate to
yellow strong4.7/EGL 0.51 ct marquise Reverse Very Light grayish yellow Fancy yellow-green Strong4.8/EGL 0.46 ct marquise Reverse Light grayish greenish yellow Fancy Light yellow-green Moderate to
strong4.9/EGL 0.58 ct marquise Reverse Light brownish yellow Fancy greenish yellow Moderate to
strong4.10/EGL 0.47 ct marquise Reverse Light yellow (U-V) Fancy Light greenish Moderate
yellow4.11/GIA 0.80 ct marquise Classic Fancy brownish greenish Fancy Intense orangy Strong
yellow yellow4.12/EGL 0.36 ct marquise Reverse Light yellow (U-V) Fancy Light greenish Moderate
yellow
CHAMELEON DIAMONDS GEMS & GEMOLOGY SPRING 2005 23
Stone no./ Classic or Magnitude of Grading Lab Reverse group color changeWeight and shape Stable color Unstable color

The Classic group of chameleons (31 of the 39diamonds) exhibited a distinct change in colorwhen heated (figure 3, bottom). The unstable colorvaried from saturated brown-yellow to orange-yel-low to yellow. The same change of color also wasobserved after prolonged storage in the dark for allexcept four stones, but it was not nearly as pro-nounced as the change induced by heating. Usuallya couple of hours in darkness was sufficient toinduce the color change. Cooling to liquid nitrogentemperature did not provoke a color change.
The Reverse group (8 of the 39 diamonds) dif-fered from the first group in that heating inducedonly a weak-to-moderate change to a more saturat-ed and greener color (again, see figure 3, bottom).Storage in the dark, even for days, did not provoke achange in color. As in the Classic chameleons, thecolor was not influenced by cooling to liquid nitro-gen temperature (-196°C). We use the term Reversefor such chameleon diamonds, because their yel-low-to-yellowish green color change is almost theopposite of the green-to-yellow change seen in typi-cal chameleon diamonds.
The change in color due to heating began atapproximately 100–120°C in both groups. For themajority of the stones, the unstable color was mostintense between 120 and 140°C. Although the dia-monds were heated up to 300°C, no further changesin color were observed above about 140°C. At thistemperature, a complete change in color could beinduced within a few seconds.
Color Distribution. The color in most of thechameleon diamonds was evenly distributed; how-ever, a few of the samples from the Classic groupshowed very slight patchy (irregular) color zoning.One diamond, also from the Classic group, exhibit-ed very distinct yellow-brown banding (figure 4).
Anomalous Double Refraction. Between crossedpolarizing filters, no characteristic pattern was seen.Some strain was observed in all samples, evident asinterference colors of various intensity, and wasmainly associated with inclusions. Deformation-related extinction patterns along octahedral slipplanes (as typically seen in many brown to brownish
24 CHAMELEON DIAMONDS GEMS & GEMOLOGY SPRING 2005
Figure 3. The collectionof 39 chameleon dia-monds (0.29 to 1.93 ct)is shown at room tem-perature (top) andwhen heated to 150°C(bottom). Photos byJulia Kagantsova, EGL.

yellow-green diamonds) were observed in only a fewsamples, and were localized and very indistinct.
Reaction to UV Radiation. All samples exhibitedcharacteristic long- and short-wave UV fluores-cence. There were basically two types of responses:
1. Classic group: chalky white to chalky yellow toyellow, stronger to long-wave than to short-waveUV (figure 5)
2. Reverse group: chalky blue to blue to long-wave,and weaker chalky blue to yellow to short-waveUV (figure 6)
Most of the diamonds displayed moderate tostrong luminescence to long-wave UV radiation,with a weak to moderate response to short-waveUV. The most interesting feature was that all stonesexhibited persistent phosphorescence, more dis-tinctly to short-wave than to long-wave UV. Thephosphorescent color was yellow for all samples,but its strength and decay time varied considerably:Light yellow stones of the Reverse group that exhib-ited blue fluorescence had much weaker and shorterphosphorescence than the Classic-group diamondsthat exhibited chalky white to yellow luminescence(again, see figures 5 and 6). Some of the diamonds ofthe Classic group emitted a faint, but still eye-visi-
ble, yellow glow over one hour later. In contrast, thephosphorescence of the Reverse group diamondslasted just a few seconds to a few minutes. AReverse-type diamond (TH-A1) analyzed prior to
CHAMELEON DIAMONDS GEMS & GEMOLOGY SPRING 2005 25
What is believed to be the first report of a “low-tem-perature” (i.e., below 200°C) thermochromic colorchange observed in a very high-nitrogen and high-hydrogen yellow diamond exhibiting Reversechameleon behavior was published by Hainschwang(2001). The 1.09 ct marquise cut diamond, herereferred to as TH-A1 (figure 2, bottom; figure 8,orange trace), exhibited a Vis-NIR spectrum with sev-eral hydrogen-related peaks—notably at 425, 440,452, 462, 474, 545, and 563 nm—similar to the spec-trum shown in figure 11 (green trace). The Reverse
chameleon diamonds included in the present articleexhibit only a few of these absorptions, and theycommonly show distinctly less IR-active hydrogen.Nevertheless, the color change shown by those dia-monds is as strong, and in some stones stronger, thanexhibited by sample TH-A1. An interesting charac-teristic of this diamond is that the luminescence andphosphorescence behavior change on heating (tableA-1). Further research will be needed before themechanism that produces these phenomena can beunderstood.
BOX A: AN UNUSUAL REVERSE CHAMELEON DIAMOND
TABLE A-1. Variations in the emissions excited by UV radiation observed in sample TH-A1.
Luminescence Long-wave UV Short-wave UV
Room temperature Hot (~200°C) Room temperature Hot (~200°C)
Fluorescence Violetish blue Zoned blue and yellow Chalky bluish yellow Blue with yellow zonesPhosphorescence Weak yellow Distinct blue Distinct yellow Weak blue
Figure 4. This 1.93 ct chameleon diamond from theClassic group was the only sample that showed dis-tinct color banding. Photo by T. Hainschwang.

this study exhibited a remarkable inversion of lumi-nescence and phosphorescence behavior when heat-ed (box A).
Infrared Spectroscopy. The infrared spectra also helpdistinguish the two groups of chameleon diamonds:
1. Classic group: low to moderate concentrations ofnitrogen, mainly A aggregates (rarely A~B), andlow-to-moderate hydrogen content (figure 7)
2. Reverse group: high to very high concentrationsof nitrogen, mainly in the form of B aggregates(very rarely B<A), and low-to-high hydrogen con-tent (figure 8)
Classic Group. The low-to-moderate nitrogen, typeIaA chameleon spectra (Classic group) are character-ized by hydrogen-related absorptions at 4496, 4167,3235, 3186, 3181, 3160, 3143, 3138, 3107, 2786, and1405 cm-1 (not all of these are visible in figure 7). Apeak present in most Classic chameleons at1434–1428 cm-1 (again, see figure 7) was relativelyweak and broad (FWHM ~25–35 cm-1). This absorp-tion was in no way related to the intensity of aplatelet peak at 1358–1380 cm-1, as described byWoods (1986; see figure 9). Most of the stonesshowed a weak type Ib character, which was visibleas some hydrogen-related peaks such as the 3143cm-1 line (Woods and Collins, 1983), a shoulder at1135 cm-1, and in a few stones as very weak sharppeaks at 1344 cm-1.
In addition to the hydrogen- and nitrogen-relatedfeatures, the Classic chameleon diamonds exhibitedabsorptions at 1548–1544 cm-1 and 1590–1577 cm-1,plus a weak peak at 1464 cm-1.
Reverse Group. The high-nitrogen, mostly type IaBchameleon spectra (Reverse group) also exhibited
hydrogen-related features: sharp peaks at 4496, 4167,3236, 3107, 3055, 2982, 2813 and 2786 cm-1 wereobserved (figure 8; peaks at 3055, 2982 and 2813 aretoo small to be seen at this scale). However, theReverse chameleon diamonds lacked any featuresassigned to a type Ib character. The peak at 1430 cm-1
was found to be asymmetric and relatively strongand sharp (FWHM ~8–9 cm-1), and it could be direct-ly correlated with the intensity of the platelet peak(figure 9) as documented by Woods (1986).
The N-related absorptions in the one-phononregion were truncated in the Reverse chameleonspectra (see figure 8), so the strengths of the 1282and 1175 cm-1 absorptions that indicate the relativeamounts of A- and B-aggregates could not be com-pared. Consequently, to determine which aggre-
26 CHAMELEON DIAMONDS GEMS & GEMOLOGY SPRING 2005
Figure 6. These samples (nos. 4.7–4.10, from left toright) demonstrate the appearance of Reversechameleon diamonds when exposed to long-wave UV(top row), short-wave UV (center row), and after theUV was turned off (bottom row). Composite photo byT. Hainschwang.
Figure 5. These samples(nos. 2.1–2.8, from leftto right) demonstratethe appearance ofClassic chameleon dia-monds when exposedto long-wave UV (toprow), short-wave UV(center row), and afterthe UV source wasturned off (bottomrow). Composite photoby T. Hainschwang.

gates were dominant, related peaks at 1010 cm-1 (B-aggregates) and 482 cm-1 (A-aggregates) were com-pared. In these stones, the 482 cm-1 peak was typi-cally very weak or absent, whereas the 1010 cm-1
feature was always strong; it thus could be conclud-ed that the Reverse chameleon diamonds are pre-dominantly type IaB diamonds.
Several absorptions between 1577 and 1450
cm-1 were noted in spectra of certain Reversegroup diamonds (i.e., at 1577, 1554, 1551, 1546,1543, 1526, 1523, 1521, 1518, 1508, 1500, 1498,1490, 1473, and 1450 cm-1). None of the studiedchameleon diamonds exhibited deformation-relat-ed amber center absorptions (i.e., with main fea-tures in the range of 4165–4065 cm-1; DuPreez,1965 and Hainschwang, 2003).
CHAMELEON DIAMONDS GEMS & GEMOLOGY SPRING 2005 27
Figure 7. The infraredspectra of Classicchameleon diamondsshow variable hydrogenand nitrogen contents.The spectrum of sample2.5 is the exception,since strong B-aggregateabsorption is very rare insuch diamonds. Thespectra show that thequantity of IR-activehydrogen does not corre-late to the intensity ofthe color change. Thehydrogen-relatedabsorptions indicating atype Ib character areshown in the inset. Thespectra have been shift-ed vertically for clarity.
Figure 8. The infraredspectra of Reverse-chameleon diamondsshow similar features,except for a more vari-able hydrogen content.The spectrum of sample4.5 is the exception,since strong A-aggregateabsorption is very rare insuch diamonds. Thespectra show that thequantity of IR-activehydrogen does not corre-late to the intensity ofthe color change. Thespectra have been shift-ed vertically for clarity.

28 CHAMELEON DIAMONDS GEMS & GEMOLOGY SPRING 2005
Vis-NIR Spectroscopy. As was the case for standardgemological testing and FTIR spectroscopy, the twogroups of chameleon diamonds also showed differ-ent absorption spectra in the visible to near-infrared range.
Classic Group. Diamonds from this group showedabsent or usually weak absorption at 415 nm (N3),weak absorption at 425 nm, a weak to distinctbroad band at 480 nm, and a very broad band cen-tered at 775–825 nm (figure 10).
Figure 9. The 1430 cm-1 absorption is present in theIR spectra of both Classic and Reverse chameleondiamonds. However, the specific appearance of thisabsorption and absence of a platelet peak in theClassic chameleon diamonds indicates that the 1430cm-1 peak in those diamonds has a different originthan the platelet-related 1430 cm-1 feature in theReverse chameleons.
Figure 10. These Vis-NIR spectra were recorded for aClassic-group chameleon diamond at room tempera-ture, when cooled with liquid nitrogen, and whenheated. The characteristic 425 nm band and the broadfeatures at 480 and 800 nm became less pronouncedwhen the diamond was heated. The spectra have beenshifted vertically for clarity.
Figure 11. These Vis-NIR spectra compare the absorp-tion features of a yellow-orange type Ib/aA diamondcolored by the 480 nm band, a grayish yellow-greenH-rich diamond, and a Classic chameleon diamondshowing the 480 nm band and H-related features. Thespectra have been shifted vertically for clarity.
Figure 12. These Vis-NIR spectra of a Reverse-groupchameleon diamond were recorded at room tempera-ture and when heated. Heating weakened the charac-teristic peaks between 415 and 478 nm and the broadband centered at 750–800 nm. The spectra have beenshifted vertically for clarity.

Spectra taken at temperatures of 150–350°C (i.e.,with a stone exhibiting its unstable color) revealed aweakening of all the above-mentioned absorptionfeatures. There was also a general decrease in trans-mittance in the blue and, particularly, green regionsof the spectrum (again, see figure 10). This behaviorwas reported previously by Fritsch et al. (1995).
In addition to the hydrogen-related featuresrecorded in the infrared spectra (e.g., at 3107 and 1405cm-1), evidence of hydrogen was found in the visiblerange as the 425 nm absorption, which alwaysoccurred together with the 480 nm band. The 480nm band is known from type Ib/aA diamonds oforange to orangy yellow color (Field, 1992; Zaitsev,2001, p. 296). In the experience of the authors, hydro-gen-related bands are known mainly from the spectraof grayish green to grayish yellow diamonds. A com-parison of these spectra with that of a Classicchameleon diamond can be seen in figure 11.
Reverse Group. Diamonds from this group showedstrong N3 and N2 centers, with absorptionsbetween 415 and 478 nm (“cape lines”) and a broadasymmetric band in the 650–900 nm region thatwas centered at 750–800 nm (figure 12). The differ-ences between the spectra of heated and ambient-temperature stones were not always very distinct.All of the absorption features commonly weakenedon heating (again, see figure 12).
Photoluminescence Spectroscopy. Again, two dif-ferent groups of spectra were obtained, correspond-ing to the Classic and Reverse groups (figures 13and 14). While the spectra differed considerablybetween the two groups, they also had some peaksin common, such as a strong emission at 701 nm.The Classic group exhibited a total of 44 PL emis-sions between 554 and 949 nm, versus 20 emis-sions for the Reverse group.
Classic Group. The broadband emission of theClassic group chameleon diamonds occurred main-ly as one band centered at 630–650 nm; a weakband centered at 730 nm also was usually visible,which is caused by the vibronic structure of the 701nm center (Iakoubovskii and Adriaenssens, 2001).The color of this luminescence induced by the 532nm laser is equivalent to reddish orange or orangyred. In the experience of the authors, this broadbandemission is similar to the one exhibited by typeIaA/Ib orange to orangy yellow diamonds thatexhibit the 480 nm band (figure 15), which is consis-tent with the comparison seen in figure 11.
The chameleon diamonds of the Classic group(figure 13) were characterized mainly by usuallystrong emissions at 590 and 595 nm, sometimes aweak to strong peak at 701 nm with associatedvibronic sidebands at 716 and 726 nm (Iakoubovskiiand Adriaenssens, 2001), and several weaker but
CHAMELEON DIAMONDS GEMS & GEMOLOGY SPRING 2005 29
Figure 13. Typical PLspectra for Classicchameleon diamondsare shown here. Thepeaks in the NIR regionbetween 700 and 950nm are characteristic.The spectra have beenshifted vertically forclarity.

very characteristic peaks in the NIR region of thePL spectrum, at 769, 794, 800, 819, 839, 882, 926,and 949 nm.
Reverse Group. For the Reverse group, PL varia-tions from stone to stone were minor (figure 14).These diamonds had luminescence spectra thatbasically consisted of one large, sloping plateau-like structure comprised of multiple bandsbetween 580 and 800 nm. The luminescence excit-ed by the 532 nm laser was equivalent to an orangeyellow to orange emission.
The PL spectra of the Reverse group samples (fig-ure 14) were characterized mainly by a peak at 604nm, a doublet at 641 and 645 nm, and a strong tovery strong emission at 701 nm with vibronic side-bands at 716 and 726 nm (Iakoubovskii andAdriaenssens, 2001). The PL peaks in the NIRregion of the Classic samples were not present inthe spectra of the Reverse chameleons, except forthe 926 nm feature, which was detected in the spec-tra of two samples. Most of the Reverse group dia-monds showed a very weak 741 nm GR1 peak and aweak feature at 763 nm.
DISCUSSION Analysis of the Vis-NIR absorption spectra of thechameleon diamonds confirms that the transmis-sion window between the two broad bands at 480and 800 nm is responsible for the green color of theClassic group (Fritsch et al., 1995). On heating, the
480 nm absorption is slightly reduced and the 800nm band practically disappears, which explains thechange in color (Fritsch et al., 1995). The 800 nmband is very broad and ranges all the way fromabout 575 to 1000 nm; thus, it absorbs from the redall the way to the yellow region. Therefore, there isa transmission window centered at about 560 nm,which is shifted toward the red and yellow regionson heating. The 480 nm band absorbs slightly in theblue and accentuates the transmission window at560 nm in the green. Unfortunately, UV-Vis absorp-tion spectroscopy at room and elevated tempera-tures did not record any features consistent with achange to a greener color in the Reverse group.Further work is needed to establish the cause of thiscolor modification. The reduction of the bands cen-tered at 750–800 nm would only explain a yellowercolor, but not a greener hue. A luminescence effectcan be excluded, since no green transmission lumi-nescence was observed in the Reverse chameleondiamonds, regardless of temperature.
The long-lasting phosphorescence is a very char-acteristic feature of chameleon diamonds.Conversely, the authors have noted a lack of phos-phorescence in samples of yellow to “olive” hydro-gen-containing diamonds with spectral propertiessimilar to chameleons, but lacking any chameleonbehavior.
The Reverse chameleons contain more nitrogenand hydrogen than the stones from the Classicgroup. There is a known correlation in diamondbetween the presence of hydrogen and relatively
30 CHAMELEON DIAMONDS GEMS & GEMOLOGY SPRING 2005
Figure 14. This PL spec-trum is typical for achameleon diamond ofthe Reverse group (sam-ple 4.5) is shown here.Characteristic featuresinclude the peak at 604nm, the dominant 701nm center, the doubletat 641/645 nm, and theGR1 peak at 741 nm.

large amounts of nitrogen (Iakoubovskii andAdriaenssens, 2001; Rondeau et al., 2004); therefore,any H-rich diamond will be N-rich as well. Asexpected, Reverse chameleons show more distinctabsorptions related to their hydrogen-rich character,in particular in the visible range, with bands of the“yellow-gray to violet to brown family,” for exam-ple, at 563 and 474 nm (Fritsch et al., 1991).Although no definite proof exists that these absorp-tions are due to a defect containing hydrogen, theauthors can confirm that all these absorptions areexclusively present in hydrogen-rich diamonds andare therefore hydrogen-related. The absorption com-plex between approximately 600 and 900 nm, withapparent maxima in the range of 820–860 nm (notseen in Classic chameleons) is also probably H-related (see figure 11). Therefore, the change in colorseen in the Reverse chameleon diamonds, mostlyexplained by the reduction in these bands at around140°C and above, is clearly related to the presenceof hydrogen. The exact atomic-scale nature of thesedefects is unknown at present.
In the infrared range, the C-H related absorptionsin H-rich diamonds have been described by Fritschet al. (1991), as well as by Woods and Collins (1983),and have been recently reviewed by DeWeerdt et al.(2003) and Rondeau et al. (2004). In the chameleondiamonds studied here, no correlation was foundbetween the strength of the color change and theamount of the IR-active hydrogen. On the contrary,yellow to “olive” diamonds with very high hydro-gen content usually exhibit no chameleon behavior
(Hainschwang, 2004). “Olive” diamonds colored byplastic deformation do not show a chameleonbehavior, either. However, such stones do clearlyshow different color distribution in the form of col-ored graining along octahedral slip planes(Hainschwang, 2003). The infrared spectra of such“olive” type IaA and Ib stones exhibit amber centerabsorptions (Du Preez, 1965), typically with themain feature being a double peak at 4165 and 4065cm-1 (Hainschwang, 2003; Massi, 2003). Previouswork has demonstrated that in strongly zonedClassic chameleons, the more intensely coloredzones are richer in hydrogen; thus, at least theintensity of color appears to be hydrogen-related (F.Notari, pers. comm., 2004).
The presence of the 1495 cm-1 absorption seemsto imply that Reverse chameleons have undergoneirradiation and annealing (Zaitsev, 2001, p. 44) innature, unlike the Classic ones. This natural irradia-tion is confirmed by the presence of a weak GR1emission at 741 nm in the PL spectra of mostReverse chameleons.
The 1430 cm-1 absorptions seen in both groupsappear to be different: In the Classic chameleons,the observed range of positions between 1434 and1428 cm-1, the band width of 25 to 35 cm-1, andthe missing correlation with the platelet peak indi-cate that this absorption is not the same as the1430 cm-1 absorption described by Woods (1986).This is in fact the first report of this feature. Incontrast, the sharp 1430 cm-1 absorption in theReverse chameleons correlates well with the
CHAMELEON DIAMONDS GEMS & GEMOLOGY SPRING 2005 31
Figure 15. In this PLspectrum of a naturalyellow-orange diamondcolored by the 480 nmband, the broadbandemission is very similarto the one observed inthe Classic chameleondiamonds.

32 CHAMELEON DIAMONDS GEMS & GEMOLOGY SPRING 2005
platelet peak and thus clearly points toward thefeature published by Woods (1986).
The Classic chameleon category shows twoabsorptions (at 1590–1577 and 1548–1544 cm-1) thatmay correspond to those reported at 1580 and 1544cm-1 by Collins and Mohammed (1982) in naturalbrown diamonds. Interestingly, the somewhat broad1434–1428 cm-1 feature was only present togetherwith the 1548–1544 cm-1 and 1590–1577 cm-1
absorptions; none of them occurred as isolated fea-tures. Even though these absorptions were foundonly in the Classic chameleon diamonds, whichwere richer in hydrogen, a direct correlation betweenthem and the hydrogen content could not be estab-lished with certainty. Nevertheless, our observationsindicate that these absorptions may tentatively beassigned to a hydrogen-related defect. The features at1546, 1543, 1518, and 1500 cm-1 seen in the Reversechameleons have been described by Iakoubovskiiand Adriaenssens (2001) and Hainschwang (2004) inhydrogen-rich diamonds. The absorptions at 1577and 1546 cm-1 seem to be the same as those seen inthe Classic chameleons.
Emissions at 581 and 596 nm detectable by PLspectroscopy have been reported previously, for dia-monds with yellow luminescence (Zaitsev, 2001, pp.212, 216) to long-wave UV. They are absent inReverse chameleons, which primarily luminesceblue to long-wave UV. The vibronic structure of the701 nm center (with its sidebands at 716 and 726 nm)was identified by Iakoubovskii and Adriaenssens(2001) as probably nickel-related. The 794 nm emis-
sion seen in the PL spectra of many Classicchameleon diamonds is interpreted as a nickel-nitro-gen defect that has been documented in syntheticand certain natural diamonds (Lawson and Kanda,1993). A distinct doublet at 883 and 884 nm found insynthetic diamonds grown by the temperature-gradi-ent method with a Ni catalyst was assigned to anickel defect (Lawson and Kanda, 1993); in certainsamples, a single peak at 882 nm was found instead(figure 16). The peak observed in the Classicchameleon diamonds at 882 nm can most probablybe assigned to the same or a similar Ni-related defect.
The 926 nm PL peak in the Classic (and rarelyalso the Reverse) chameleon diamonds has beenrecorded by one of us (TH) in some hydrogen-richviolet-blue-gray and “straw” yellow diamonds, aswell as in one HPHT-treated yellow diamond thatwas originally olive-brown. In this diamond, the926 nm peak (absent before treatment) was createdduring the HPHT process (2000°C at 65 kbar for 10minutes). Interestingly, it was produced togetherwith a vibronic system, yielding peaks at 701, 716,and 726 nm (Hainschwang et al., 2005). The tenta-tive assignment of the 701 nm center to a Ni-relat-ed defect by Iakoubovskii and Adriaenssens (2001)leads to the possible attribution of these apparent-ly related features to a nickel-nitrogen defect. Thisis due to the fact that a defect created by theannealing of a “normal” type Ia diamond mostprobably involves nitrogen. Assuming that this is anickel defect as proposed by the above authors, its creation by annealing indicates a nickel-
Figure 16. In this PLspectrum of a Ni-richHPHT-treated syntheticdiamond, the emissionsin the NIR region aretypical for Ni-relateddefects. There are manysimilarities to the fea-tures seen in Classicchameleon diamonds;identical peak positionsare marked in red.

nitrogen complex for the defects at 701 and 926 nm.Most of the other sharp bands in the PL spectra
of Classic chameleon diamonds also have beenobserved in natural brown diamonds (Smith et al.,2000; Zaitsev, 2001; Hainschwang, 2003), and theones seen in the Reverse chameleons are seen inhydrogen-rich diamonds from the Argyle mine(Iakoubovskii and Adriaenssens, 2001). The defectsresponsible for most of these emissions areunknown. Many of the PL emissions shown byClassic chameleons are reminiscent of those seen insynthetic diamonds grown with a Ni catalyst; suchstones characteristically show multiple emissionsin the NIR range (figure 16).
The presence of Ni in the Classic and theReverse chameleons as indicated by PL spec-troscopy was recently confirmed by one of us (TH)using EDXRF chemical analysis: two Reverse andtwo Classic chameleons were analyzed and all ofthem exhibited rather distinct Ni peaks.
The observation of a color change solely inducedby relatively low heat in the Reverse chameleonsindicates that a thermochromic color change can becaused by a hydrogen-related defect. The pho-tochromic color change induced by storage in thedark is unique to the Classic chameleon diamonds.Three factors may be involved in the combined ther-mochromic and photochromic chameleon behaviorof the Classic group: the implied weak type Ib char-acter, a specific (although unknown) hydrogen-relat-ed defect, and possibly the presence of Ni.
The Classic and Reverse groups are related tosome degree and do have significant properties incommon. However, the fact that the Reverse grouplacks a photochromic color change and exhibits onlya weak-to-distinct thermochromic color change rais-es the question as to whether such solely ther-mochromic diamonds should be called chameleondiamonds, or whether this name should be reservedfor diamonds exhibiting both thermochromic andphotochromic color change. Presently, the GIA GemLaboratory only recognizes diamonds in the latter,“Classic” group as chameleons.
CONCLUSIONSThis study has differentiated two sample groupsfrom a collection of 39 chameleon diamonds: thoseshowing only thermochromic color change andthose that exhibit both thermochromic and pho-tochromic behavior. Each group exhibited distinc-tive hue changes. We propose the term Classic for
those that show the green-to-yellow behavior withheating or after prolonged storage in the dark; thiscolor change is commonly associated withchameleon diamonds. Those that lack a photo-chromic color change—that is, they become slightlygreener and more saturated only when heated—arehere called Reverse chameleons.
The presence of the 480 nm band and hydrogen-related features such as the 425 nm absorption sug-gests that Classic chameleon diamonds fall betweenvery hydrogen-rich diamonds and type IaA/Ib dia-monds that exhibit the 480 nm absorption band (fig-ure 11). This is also strongly indicated by the factthat some truly hydrogen-rich diamonds such as theReverse chameleons exhibit this “low temperature”(i.e., below 200°C) thermochromic color change.This is further confirmed by comparison of the PLspectra of Classic chameleons and those of typeIb/aA orange diamonds that exhibit the 480 nmband (again, see figures 13 and 15). Hydrogen-richdiamonds very frequently exhibit PL spectra remi-niscent of those of the Reverse chameleons(Hainschwang, 2001; Iakoubovskii and Adri-aenssens, 2001). The influence and role of singlenitrogen and the 480 nm band in the color change ofthe Classic chameleon diamonds will be the subjectof future research by the authors.
We have shown that the easiest way to identifychameleon diamonds is by heating them to moderatetemperature and observing the change in color.However, this study proved that the Classicchameleon diamonds also could be identified by acombination of their spectroscopic properties andtheir reaction to UV radiation. This is preferable toheating, to avoid modifying the color of green dia-monds that are not chameleons; their radiation-caused coloration is rather sensitive to heat and insome cases absorptions in the visible range areknown to be modified at emperatures as low as275°C (see, e.g., Collins et al., 1988). All of thechameleon diamonds exhibited yellow phosphores-cence after exposoure to short-wave UV. The absenceof this yellow afterglow in any hydrogen-containingyellow to “olive” diamond indicates that nochameleon effect will be present. Also, in the experi-ence of the authors, stones that lack traces of hydro-gen in their IR spectra and stones that show amber-center absorption were never found to exhibit thisunusual change in color (see e.g., Hainschwang,2003). The Reverse chameleon diamonds cannotalways be identified without heating, but sinceyellow diamonds are not permanently modified by
CHAMELEON DIAMONDS GEMS & GEMOLOGY SPRING 2005 33

simple heating at relatively low temperature, theheating test is not problematic for such samples.
The presence of hydrogen and nickel in thesediamonds has been demonstrated by various spec-troscopic methods; emissions assigned to Ni impu-rities were identified particularly in the Classicgroup by PL spectroscopy.
At present, we can only speculate about the causeof the color change in Classic chameleon diamonds.
The results presented here point toward a defectinvolving hydrogen combined with the 480nm band,which is related to isolated single nitorgen atoms.This combination seems to cause the themochromicand photochromic change in color; whether Niplays a role in this color change remains to be seen.In the diamonds exhibiting only a thermochromiccolor change, such as the Reverse chamelons, thedefects appear to be solely hydrogen-related.
34 CHAMELEON DIAMONDS GEMS & GEMOLOGY SPRING 2005
REFERENCESCollins A.T., Mohammed K. (1982) Optical studies of vibronic
bands in yellow luminescing natural diamonds. Journal ofPhysics C, Vol. 15, No. 1, pp. 147–158.
Collins A.T., Szechi J., Tavender S. (1988) Resonant excitation ofthe GR centre in diamond. Journal of Physics C, Vol. 21, No.7, pp. L161–L164.
Chabert V., Reinitz I. (2000) Gem Trade Lab Notes: Diamond—chameleon, with blue-to-violet “transmission” luminescence.Gems & Gemology, Vol. 36, No. 1, pp. 60–61.
Deljanin B. (2004) Lab Notes: Chameleon diamonds. CanadianDiamonds, Summer, pp. 24–25.
DeWeerdt F., Pal’yanov Y.N., Collins A.T. (2003). Absorptionspectra of hydrogen in 13C diamond produced by high-pres-sure, high-temperature synthesis. Journal of Physics:Condensed Matter, Vol. 15, No. 19, pp. 3163–3170.
Du Preez L. (1965) Paramagnetic resonance and optical investiga-tions of defect centres in diamond. Ph.D. dissertation,University of the Witwatersrand, Johannesburg, South Africa,pp. 83–84.
Field J.E., Ed. (1992) The Properties of Natural and SyntheticDiamond. Academic Press, London.
Fritsch E., Scarratt K., Collins A.T. (1991) Optical properties ofdiamonds with an unusually high hydrogen content. In R.Messier, J.T. Glass, J.E. Butler, R. Roy, Eds., MaterialsResearch Society International Conference Proceedings,Second International Conference on New Diamond Scienceand Technology, Washington D.C., Sept. 23–27, MaterialsResearch Society, Pittsburgh, PA, pp. 671–676.
Fritsch E., Shigley J.E., Moses T., Rossman G.R., Zucker B.,Balfour I. (1995) Examination of the twenty-two carat greenchameleon diamond. In D.J. Content, Ed., A Green Diamond:A Study of Chameleonism, W. S. Maney & Son, Leeds,England, 42 pp.
GIA Diamond Dictionary, 3rd ed. (1993) Gemological Instituteof America, Santa Monica, CA, p. 44.
Hainschwang T. (2001) Characterization of hydrogen rich diamondsfrom Argyle/Australia with Vis/NIR—and photolumines-cence—spectroscopy. http://www.gemlab.net/research1_1.htm[accessed 02/18/05].
Hainschwang T. (2003) Classification and color origin of brown
diamonds. Diplôme d’Université de Gemmologie, Universityof Nantes, France.
Hainschwang T. (2004) Gem News International: A diamondexhibiting a spectacular phantom. Gems & Gemology, Vol.40, No. 1, pp. 76–78.
Hainschwang T., Katrusha A., Vollstaedt H. (2005) HPHT treat-ment of different classes of type I brown diamonds. Journal ofGemmology, Vol. 29 (in press).
Iakoubovskii K., Adriaenssens G.J. (2001) Optical characteriza-tion of natural Argyle diamonds. Diamond and RelatedMaterials, Vol. 11, No. 1, pp. 125–131.
Lawson S.C., Kanda H. (1993) An annealing study of nickel pointdefects in high-pressure synthetic diamond. Journal ofApplied Physics, Vol. 73, No. 8, pp. 3967–3973.
Massi L. (2003) Défauts résponsables de la couleur brune dans lesdiamants. Mémoire de stage du Diplôme d’ÉtudesApprofondies, Sciences des Matériaux, University of Nantes,France.
Rondeau B., Fritsch E., Guiraud M., Chalain J.P., Notari F. (2004)Three historical “asteriated” hydrogen-rich diamonds: Growthhistory and sector-dependent impurity incorporation.Diamond and Related Materials, Vol. 13, No. 9, pp.1658–1673.
Raal F.A. (1969) Mineralogical notes: A study of some gold minediamonds. American Mineralogist, Vol. 54, Nos. 1–2, pp.292–295.
Shigley J., Wang W., Moses T., Hall M. (2004) Photoluminescencefeatures of “chameleon” diamonds. Proceedings of the 55th DeBeers Diamond Conference, Coventry, England, pp. 4.1–4.2.
Smith C.P., Bosshart G., Ponahlo J., Hammer V.M.F., Klapper H.,Schmetzer K. (2000) GE POL diamonds: Before and after.Gems & Gemology, Vol. 36, No. 3, pp. 192–215.
Woods G.S., Collins A.T. (1983) Infrared absorption spectra ofhydrogen complexes in type I diamonds. Journal of Physicsand Chemistry of Solids, Vol. 44, No. 5, pp. 471–475.
Woods G.S. (1986) Platelets and the infrared absorption of type Idiamonds. Proceedings of the Royal Society of London A, Vol.407, pp. 219–238.
Zaitsev A.M. (2001) Optical Properties of Diamond: A dataHandbook. Springer, Berlin, pp. 44, 45, 190-230, 212, 216, 296.
ABOUT THE AUTHORSMr. Hainschwang ([email protected]) is researchgemologist at GIA’s GemTechLab in Geneva, Switzerland; he performed the research for this article prior to joining GIA, while hewas director of Gemlab Gemological Laboratory in Liechtenstein.Mr. Simic is a gemologist at EGL USA, New York. Dr. Fritsch isprofessor at the University of Nantes, Institut des Matériaux JeanRouxel (IMN-CNRS), Nantes, France. Mr. Deljanin is director ofresearch and director of Canadian operations for the EGL USA
group, Vancouver, British Columbia, Canada. Ms. Woodring is agemologist and educational instructor, and Mr. DelRe is managerof Gemological Services, at EGL USA, New York.
ACKNOWLEDGMENTS: The authors are grateful to NileshSheth of Nice Diamonds, New York, a subsidiary of ForeverCollections Inc., for loaning the “Forever ChameleonCollection” for this research, and to Franck Notari, Director ofGemTechLab, for fruitful discussions.

The Diamond Trading Company (DTC)Research Centre had the opportunity toexamine a diamond that, on submission to acommercial gem laboratory, was stated tohave been HPHT treated. However, spec-troscopic analysis yielded data inconsistentwith this statement. After further testing, itwas determined that this diamond, whichoriginally was probably pale yellow, hadbeen coated to change its color to theequivalent of Fancy Intense purple-pink.Careful examination with a microscoperevealed evidence of a coating exclusivelyon the pavilion facets. Elemental analysis ofthe coating suggests it may be calcium fluo-ride with a gold impurity that was addedeither to generate the absorption responsiblefor the pink color or to assist as a nucleatingagent for the calcium fluoride film.
he emergence of high pressure/high tempera-ture (HPHT) color treatment of natural dia-mond has brought about a marked increase
in the sophistication of the spectroscopic analysisused by grading laboratories when testing dia-monds (see, e.g., Fisher and Spits, 2000; Smith etal., 2000). Care must be exercised, however, thatthe reliance on such advanced analytical tech-niques does not cause the gemologist to neglect themore “traditional” means of identifying simplerforms of treatment. The case described here servesto highlight the potential consequences of such
neglect, although the net result was the gatheringof interesting analytical information on a diamondtreated by an older technique.
A CASE STUDYDuring September 2004, scientists at the DTCResearch Centre in Berkshire, United Kingdom, hadthe opportunity to study the 0.85 ct round brilliantcut diamond shown in figure 1. The diamond hadbeen graded Fancy Intense purple-pink by a gemologi-cal laboratory and was said to have been colorenhanced by HPHT treatment. Although pinkHPHT-treated diamonds with colors as strong asFancy Deep have been reported (see, e.g., Hall andMoses, 2000), they are extremely rare. Therefore, thisidentification immediately raised our suspicions.
Spectroscopic Analysis. Because the diamond hadbeen described as HPHT treated, testing began withthe advanced analytical instrumentation that istypically used to determine when the color of a dia-mond has been modified by exposure to HPHTtreatment conditions. This involved the use of sev-eral spectrometers, including those that analyzethe absorption of light throughout the ultraviolet,visible, and near-infrared regions of the spectrum (aPerkin Elmer Lambda 19 UV-Vis-NIR spectrome-ter, with the diamond at room temperature as wellas cooled to liquid nitrogen temperature using a
36 NOTES AND NEW TECHNIQUES GEMS & GEMOLOGY SPRING 2005
T
COATED PINK DIAMOND—A CAUTIONARY TALE
David J. F. Evans, David Fisher, and Christopher J. Kelly
See end of article for About the Authors and Acknowledgments.GEMS & GEMOLOGY, Vol. 41, No. 1, pp. 36–41.© 2005 Gemological Institute of America
NOTES & NEW TECHNIQUES

suitable cryostat) and the mid-infrared region (aNicolet Magna IR 750 Fourier-transform infrared[FTIR] spectrometer, at room temperature only).The diamond’s photoluminescence (PL) spectrawere recorded under a range of different laser-exci-tation wavelengths: 325 and 633 nm excitationusing a Jobin-Yvon Labram Infinity spectrometer;488 and 514 nm excitation using a Spex 270Mspectrometer. For the PL spectroscopy, the dia-mond was again cooled to liquid nitrogen tempera-ture in a cryostat.
UV-Vis-NIR spectroscopy revealed that the pinkcolor was caused by a broad absorption band cen-tered at around 550 nm (figure 2). A similar absorp-tion feature at this wavelength is responsible for thecolor in most natural-color pink diamonds, both(nitrogen containing) type I and (nitrogen free) typeII stones (see, e.g., Collins, 1982; King et al., 2002).In natural-color pink diamonds, however, this 550nm band typically is accompanied by a broadabsorption band at 390 nm (again, see figure 2),which was not recorded in this sample. The dia-mond did show an absorption line at 415 nm (theN3 center), a nitrogen-related feature that is foundin most type Ia diamonds.
Using FTIR, we discovered that the diamond wasa type IaAB, with the majority of the nitrogen in theA aggregate form (figure 3). (For a description of dia-mond types and how they relate to the various aggre-gation states of nitrogen impurities in diamond,refer, for example, to Fritsch and Scarratt, 1992.)Although the spectrum was saturated in the region
NOTES AND NEW TECHNIQUES GEMS & GEMOLOGY SPRING 2005 37
Figure 2. The UV-Vis-NIR absorption spectra of the0.85 ct diamond at room temperature and liquidnitrogen temperature show a broad 550 nm band andN3 absorption at 415 nm; the latter is present in mosttype Ia diamonds. A room-temperature absorptionspectrum of a type IaAB natural-color pink diamondis provided for comparison. It shows the two broadabsorption bands at 390 and 550 nm that are charac-teristic of such diamonds; careful examination allowsthe 390 nm band to be distinguished from the broadabsorption associated with N3.
Figure 3. The infrared spectrum of the 0.85 ct diamondrevealed that it was a type IaAB, whereas pink HPHT-treated diamonds are typically type IIa.
Figure 1. This 0.85 ct purple-pink diamond wasexamined at the DTC Research Centre to investi-gate the claim that it had been HPHT treated.Careful analysis and observation revealed that thecolor of the diamond was due to a topical coatingthat had been applied to the pavilion of the stone.Photo by Chris Kelly.

associated with nitrogen-related absorption (approxi-mately 1300–1100 cm-1), spectral fitting techniquesdeveloped at the DTC Research Centre providednitrogen concentration estimates of 470 parts permillion (ppm) of A-form nitrogen and 280 ppm of B-form nitrogen. Fairly strong hydrogen-related absorp-tion also was detected in the form of the C-H stretchmode at 3107 cm-1. These results contradict the stat-ed origin of color: HPHT-treated pink diamonds aretypically type IIa, and the absorption characteristicswere not consistent with those one would expect toencounter in any type IaAB diamond that had under-gone HPHT treatment at temperatures sufficientlyhigh to generate a significant color change (Reinitzet al., 2000). Natural-color pink diamonds do show arange of nitrogen concentrations and aggregationstates, but in our experience they typically do notshow the very high levels measured in this case andtheir aggregation levels tend to be higher.
Low-temperature photoluminescence spec-troscopy with 325 nm excitation revealed dominantN3 luminescence (main line at 415 nm), consistentwith its observation in the absorption spectra. Thespectrum taken with 488 nm excitation showedtwo lines at 503 nm separated by 0.2 nm. One wasthe frequently observed H3 center (from a nitrogen-vacancy-nitrogen impurity). The identity of theother line, at a slightly shorter wavelength, is notcertain, but it may be the S1 center (for a descrip-tion of luminescence centers, see Davies, 1977, andField, 1992). Other strong luminescence featuresobserved with 488, 514, and 633 nm excitation werelines at 701, 787, and 793 nm. All of these havebeen seen in natural “cape” yellow diamonds (Field,
1992), and it is the experience of the authors thatthey are generally encountered in untreated near-colorless to pale yellow diamonds with a nitrogencontent of a few hundred parts per million and sig-nificant hydrogen-related absorption. No indicationof HPHT treatment was found, and we have notseen the 701, 787, and 793 nm lines at the strengthobserved here in natural-color pink diamonds.
Although the diamond had been described asbeing HPHT treated, the data recorded using vari-ous advanced spectroscopic techniques did not sup-port this assessment. However, they were not whol-ly consistent with natural-color pink diamondseither. Rather, in the experience of the authors, thespectroscopic features recorded were more consis-tent with those seen in natural-color near-colorlessto pale yellow diamonds. It was therefore deter-mined that additional testing was needed to resolvethe cause of the pink coloration in this diamond.
Further Investigation. When viewed with a micro-scope, the diamond revealed a somewhat unevencolor distribution. This is not necessarily unusual innatural-color pink diamonds, but in such stones thepink coloration tends to be concentrated along so-called slip planes where plastic deformation hastaken place. Closer examination showed that theuneven color distribution in this sample was actual-ly related to “patches” where the pink color wasabsent (figure 4, left), revealing pale yellow regionswith transmitted light. This raised the possibilitythat the diamond had been coated in some way toproduce the pink color. Examination of the pavilionfacets showed clear evidence of a coating that had
38 NOTES AND NEW TECHNIQUES GEMS & GEMOLOGY SPRING 2005
Figure 4. This photomicrograph of the 0.85 ct diamond in transmitted light (left) shows two pale yellow regions(circled) where the pink color is not visible (photomicrograph by Chris Kelly; magnified 35¥). The Nomarskiimage (right) of the edge of one of the pavilion facets shows how the coating has worn away (photomicrographby David Fisher).
50 µm

NOTES AND NEW TECHNIQUES GEMS & GEMOLOGY SPRING 2005 39
worn away at facet junctions and in the centers ofsome facets. The coating was most easily viewedusing the Nomarski differential interference contrasttechnique (Robinson and Bradbury, 1992), as illus-trated in figure 4 (right). No coating was observed onthe table and crown facets. Once we had establishedthe location of the coating, we were able to find itwith the microscope using reflected light; the coat-ing appeared as slightly yellower regions with theset-up used. This yellow color is likely due to inter-ference associated with the thin film coating, assuch effects are relatively strong in reflected light.No fluorescence associated with the coating wasdetected, but careful imaging with the DiamondTrading Company DiamondView instrumentshowed that the luminescence intensity was slightlylower from the coated regions. We concluded thatthe coating was fairly durable, as it had not beenremoved by the several cycles of cooling to liquidnitrogen temperatures and re-warming to room tem-perature the diamond experienced during the spec-troscopic testing.
Following these observations, we conducted adetailed analysis to determine the composition ofthe coating. First, we examined the pavilion regionwith a Philips Quanta 200 low-vacuum scanningelectron microscope (SEM). The microscope scans abeam of high-voltage electrons across the surface ofthe sample in a variable pressure chamber. As the
electrons impinge on the surface of the sample, theyare scattered and X-rays of energies characteristic ofthe elements comprising the material are produced.The scattered electrons can be imaged to providetopographic information, and specific X-ray energiescan be selected and mapped on the same scale toproduce a distribution map of a particular element.The low-vacuum technique has benefit over a moreconventional SEM analysis in that the sputteredmetallic (usually gold) or carbon coating typicallyrequired for SEM work on nonconducting diamondwas not necessary.
SEM imaging of the areas being analyzed clearlyconfirmed the presence of minor wear and removalof the coating (figure 5). Further analysis using ener-gy-dispersive X-ray (EDX) mapping (figure 6)revealed that the coating was comprised of gold, cal-cium, and fluorine exclusively. Peaks associatedwith carbon from the underlying diamond and oxy-gen contaminant present equally in both the coat-ing and the diamond also were observed. As thesample had not been conventionally prepared forSEM, the gold content was found to be a genuinecomponent of the coating and not a specimenpreparation artifact.
Discussion. Although the diamond had been present-ed as HPHT treated, spectral analyses and microscop-ic examination contradicted this conclusion and
Figure 5. These low-vacuum SEM backscattered electron images reveal damage and wear to the coating on thepavilion of the stone (left) and, at higher magnification, bright areas where the coating was intact and dark areaswhere it had worn away (right).
3 mm 10 µm

40 NOTES AND NEW TECHNIQUES GEMS & GEMOLOGY SPRING 2005
established that the purple-pink color was the resultof a topical coating.
The use of fluoride coatings on diamond hasbeen reported previously as being “consideredunsatisfactory by coaters, since they are easilydetected by their purplish-blue iridescence” (Miles,1962, p. 356). However, the present sample did notreveal such an iridescence effect. Calcium fluoride(CaF2) is a material commonly used in optical com-ponents. Naturally occurring calcium fluoride (asthe mineral fluorite) exists in a range of colors vari-ously attributed to impurities or lattice defects dueto irradiation (Deer et al., 1966), with the latticedefects having been associated with purple in someinstances. There has been work on the implantationof calcium fluoride with gold to generate nanoparti-cles that can produce a broad absorption band atabout 520 nm, similar to the broad absorption peakobserved in this diamond (Henderson et al., 1997).While the gold may be responsible for the color inthis case, it is also possible that it was used to pro-mote the nucleation or adhesion of the coating. Theexact form of the coating on this diamond is notknown, but clearly it involves the deposition of cal-cium fluoride either as the color-producing layer oras a protective or host layer for gold particles, whichthemselves are responsible for the absorption fea-ture resulting in the pink color.
CONCLUDING COMMENTSGemologists and gemological laboratories mustcontend with an ever-increasing number of sophisti-cated diamond treatments that can only be identi-fied with advanced analytical techniques.Therefore, it is not surprising that the more tradi-tional forms of color treatment may be overlookedwhen they are assessing whether a particular dia-mond’s color is natural or has been artificiallyinduced. A recent Gems & Gemology lab note oncoated diamonds (Sheby, 2003) emphasized theimportance of keeping these earlier treatments inmind during a gemological examination.
For the diamond described in this report, thespectroscopic data conflicted with the stated HPHTorigin of the pink color, whereas careful examina-tion with the microscope revealed evidence of acoating. This coating produced a broad absorptionband at around 550 nm, which imparted a pinkcolor to an originally pale yellow stone. Analysis ofthe coating suggests that it is calcium fluoride withgold, but the data acquired do not allow for thedetermination of whether the gold or some otherimpurity doping the calcium fluoride is responsiblefor the color-causing absorption. This study servesto re-emphasize the importance of sound gemologi-cal observation when examining stones for the pos-sibility of color treatments.
Figure 6. These energy-dispersive X-ray mapsshow the distributions ofthe main elementsdetected in the analysis:carbon, calcium, gold,and fluorine. Bright spotscorrespond to regions ofhigh concentrations ofthe specific element. Thefeature to the lower rightin each is the area wherethe coating was wornaway in figure 5 (right).The carbon X-ray mapshows a high signalwhere the coating hasbeen removed (due tothe underlying dia-mond). The calcium,gold, and fluorine signalsare significantly strongerin the regions where thecoating is intact. 20 µm
Carbon Calcium
FluorineGold

REFERENCESCollins A.T. (1982) Colour centres in diamond. Journal of
Gemmology, Vol. 18, No. 1, pp. 37–75.Davies G. (1977) The optical properties of diamond. In P.L.
Walker and P.A. Thrower, Eds., Chemistry and Physics ofCarbon, Vol. 13, Marcel Dekker, New York, pp. 1–143.
Deer W.A., Howie R.A., Zussman J. (1966) An Introduction tothe Rock Forming Minerals. Longmans, Green and Co.,London, p. 512.
Field J.E. (1992) The Properties of Natural and SyntheticDiamond. Academic Press, London, pp. 687–698.
Fisher D., Spits R.A. (2000) Spectroscopic evidence of GE POLHPHT-treated natural type IIa diamonds. Gems & Gemology,Vol. 36, No. 1, pp. 42–49.
Fritsch E., Scarratt K. (1992) Natural-color nonconductive gray-to-blue diamonds. Gems & Gemology, Vol. 28, No. 1, pp. 35–42.
Hall M., Moses T. (2000) Gem Trade Lab Notes: Diamond—blueand pink HPHT annealed. Gems & Gemology, Vol. 36, No. 3,p. 255.
Henderson D.O., Tung Y.S., Mu R., Ueda A., Chen J., Gu Z., White
C.W., Zhu J.G., McKay M., Scott O. (1997) Gold implanted cal-cium fluoride single crystals: Optical properties of ion induceddefects and metal nanocrystals. Materials Science Forum, Vol.239–241, pp. 695–698.
King J.M., Shigley J.E., Guhin S.S., Gelb T.H., Hall M. (2002)Characterization and grading of natural-color pink diamonds.Gems & Gemology, Vol. 38, No. 2, pp. 128–147.
Miles E.R. (1962) Diamond-coating techniques and methods ofdetection. Gems & Gemology, Vol. 10, No. 12, pp. 355–383.
Robinson P.C., Bradbury S. (1992) Qualitative Polarized-LightMicroscopy. Oxford University Press, Oxford, pp. 94–108.
Reinitz I.M., Buerki P.R., Shigley J.E., McClure S.F., Moses T.M.(2000) Identification of HPHT-treated yellow to green dia-monds. Gems & Gemology, Vol. 36, No. 2, pp. 128–137.
Sheby J. (2003) Lab Notes: Coated diamonds. Gems & Gemo-logy, Vol. 39, No. 4, pp. 315–316.
Smith C.P., Bosshart G., Ponahlo J., Hammer V.M.F., Klapper H.,Schmetzer K. (2000) GE POL diamonds: Before and after.Gems & Gemology, Vol. 36, No. 3, pp. 192–215.
ABOUT THE AUTHORS
Mr. Evans is a senior research assistant, Dr. Fisher is a seniorresearch scientist, and Mr. Kelly is a physics technician at theDiamond Trading Company (DTC) Research Centre inMaidenhead, Berkshire, United Kingdom.
ACKNOWLEDGMENTS: The authors would like to thank
Andy Taylor at the DTC Research Centre for assistancewith the differential interference contrast microscopy andMark Peers at Oxford Instruments, High Wycombe, U.K.,for access to and assistance with the X-ray mapping.Members of the Consumer Confidence Technical Researchteam at the DTC Research Centre provided valuable inputto discussions throughout this work.
NOTES AND NEW TECHNIQUES GEMS & GEMOLOGY SPRING 2005 41

DIAMONDWith Bodycolor Possibly Affected by the 3H DefectIrradiation is an important mecha-nism for diamond coloration. Itoccurs naturally to some diamondsover geologic time, and has been per-formed for over a century in the labo-ratory. Features such as radiationstains and color distribution are use-ful for differentiating these two pro-cesses. However, definitive identifica-tion of color origin is still a challenge.Understanding defect configurationsin known natural and treated stones
is a helpful way to recognize somesubtle differences between naturallyand laboratory-irradiated diamonds.For example, H3 and 3H are two com-mon radiation-related defects. The 3Hdefect consists of an interstitial car-bon atom, while the H3 defect isformed by two nitrogen atoms andone vacancy. Because the 3H defectrequires relatively little energy torelax into a normal diamond bond, itis much less stable than the H3 defectat high temperature. The zero phononline—or principal absorption—of H3is at 503.2 nm, and that of 3H is at503.6 nm.
The East Coast laboratory recent-ly examined a radiation “damaged”stone that showed some interestingfeatures. The 8.08 ct diamond (12.67¥ 10.60 ¥ 6.74 mm) in figure 1 (left)was color graded as Fancy Deep gray-ish yellowish green; however, magni-fication revealed that the green colorwas concentrated in the diamond’s“skin” (figure 1, right). Over largeareas of the pavilion and girdle,intense green stains remained onoriginal crystal surfaces that had notbeen entirely removed in the polish-ing process. In contrast to the greenskin, the diamond’s bodycolor was adistinct brownish yellow. This color“contrast” was different from thatseen in many other naturally irradiat-ed diamonds, which sometimes dis-play a less saturated greenish orbluish coloration after the darkerskin is removed in the manufacturingprocess.
Infrared absorption spectroscopyrevealed that this was a type Ia dia-mond with a high concentration ofnitrogen. A very weak absorption at1450 cm-1 due to the H1a defect wasobserved, but no H1b or H1c defectswere detected. The color distribution,
42 LAB NOTES GEMS & GEMOLOGY SPRING 2005
© 2005 Gemological Institute of America
GEMS & GEMOLOGY, Vol. 41, No. 1, pp. 42–50
Editor’s note: The initials at the end of each itemidentify the editor(s) or contributing editor(s)who provided that item. Full names are given forother GIA Gem Laboratory contributors.
EDITORSThomas M. Moses and Shane F. McClureGIA Gem Laboratory
CONTRIBUTING EDITORSG. Robert CrowningshieldGIA Gem Laboratory, East Coast
Cheryl Y. WentzellGIA Gem Laboratory, West Coast
Figure 1. This 8.08 ct diamond was graded Fancy Deep grayish yellowish green (left). However, with magnification it is apparent thatthe green color is concentrated in areas of the diamond’s “skin,” whilethe rest of the stone shows distinct brownish yellow coloration (right;width of image is 1.6 mm). Many intense green radiation stains werenoted on original crystal surfaces that remained on large areas of thepavilion and girdle. These distinctive surface stains, readily seen with acombination of reflected and transmitted light, are believed to resultfrom natural irradiation.

absence of H1b and H1c, and intensegreen radiation stains at the surfaceestablished that this diamond wasuntreated.
In addition to those absorptionscommon in this type of diamond(ND1, N2, N3, 595 nm, 666 nm, andGR1), the ultraviolet-visible absorp-tion spectrum contained a strong 3Hline (figure 2). The presence of the 3Hdefect throughout the whole stonewas confirmed with Raman photolu-minescence spectroscopy at 488 nmlaser excitation. The intensity of the3H absorption varied substantially inthe different locations analyzed, butwithout any consistent trends. Onlyrarely has the 3H defect beenobserved in intensity as strong as thatseen in this stone (approximately0.43 cm-1 in absorption coefficient,assuming the path length of light isequal to the girdle diameter at thepoint of analysis). Although typicallythe 3H defect does not cause color,its intensity in this stone suggeststhat this defect could make a signifi-cant contribution to the diamond’syellow bodycolor.
However, as noted above, the 3H
defect is somewhat unstable. In N-rich diamond, its intensity can beenhanced by heating to about 300°C,but it can be annealed out at tempera-tures above 500°C (see, e.g., A. M.Zaitsev, Optical Properties of Dia-mond, Springer-Verlag, Berlin, 2001).Since the polishing process can easilyproduce these temperatures, it could
either enhance or decrease the con-centration of the 3H defect. (In con-trast, much higher temperatures arerequired to affect the H3 defect.) Wehave noted in the past when examin-ing diamonds before and after cuttingthat the 3H absorption is oftenremoved during faceting. We do notknow the manufacturing history ofthis specific stone, but slight colormodification during cutting cannot beruled out entirely. Slight color changeby this process is not considered arti-ficial treatment, but it obviously addsone more variable to the complexityof identification.
Wuyi Wang and Tom Moses
HPHT-Treated Type IIa Yellow DiamondHigh pressure/high temperature(HPHT) annealing can be used to alterthe bodycolor of type IIa diamonds.Depending on the properties of thestarting material and the pressuresand temperatures employed, most ofthese diamonds are colorless or near-colorless after treatment, with a smallpercentage resulting in a predominant-ly pink bodycolor. Recently, the EastCoast laboratory examined a stone(figure 3) with a color very similar tothat associated with natural-color typeIa yellow diamonds commonly re-
LAB NOTES GEMS & GEMOLOGY SPRING 2005 43
Figure 3. This 4.33 ct rectangular modified brilliant cut (left) proved to bea type IIa HPHT-treated diamond. In contrast to many other HPHT-treat-ed type IIa diamonds, it shows a pure yellow color that is surprisingly sim-ilar to the 1.21 ct untreated type Ia cape stone on the right, which was alsocolor graded as Fancy yellow.
Figure 2. The UV-Vis absorption spectrum of the diamond in figure 1shows a strong absorption at 503.6 nm from the 3H defect, in addition toother absorptions common in diamonds that have been exposed to radia-tion either naturally or in the laboratory (e.g., ND1, N2, N3, 595 nm, 666nm, and GR1).

44 LAB NOTES GEMS & GEMOLOGY SPRING 2005
ferred to as “cape” diamonds. How-ever, its gemological properties andspectral analyses led to a very differentidentification.
The 4.33 ct cut-cornered rectangu-lar modified brilliant cut (9.84 ¥ 8.92 ¥5.50 mm) was color graded Fancy yel-low. It did not have any unusual inter-nal characteristics, either inclusions orfractures. It displayed a very weak bluefluorescence to long-wave ultraviolet(UV) radiation and a very weak yellowfluorescence to short-wave UV, withno phosphorescence. However, in con-trast to the overall turbid blue fluores-cence that is very common in type Iacape yellow diamonds, the long-wavereaction appeared much more trans-parent. This is very unusual for anydiamond other than a type IIa.Observation with a handheld spectro-scope revealed no absorption lines. Itwas clear that further spectroscopicanalysis was necessary, as these resultsdid not explain the cause of the pureyellow color.
The infrared absorption spectrashowed features typical of a type IIa
diamond, with no detectable A-formor B-form nitrogen. However, therewas a weak but clear absorption fromisolated nitrogen. The absorption coef-ficient of the peak at 1344 cm-1 wasapproximately 0.02 cm-1, correspond-ing to a nitrogen concentration ofabout 0.8 ppm. In the UV-Vis absorp-tion spectrum (figure 4) taken at cryo-genic temperature, a moderatelystrong and broad absorption centeredat 270 nm, with two superimposedsharp absorptions at 268 and 271 nm,and the gradual increase in absorptionat energies above ~500 nm confirmedboth the presence of isolated nitrogenand that it was the main defectresponsible for the yellow color. Inaddition, a very weak N3 absorptionat 415 nm and several other weakabsorptions (~300 nm) related to iso-lated nitrogen also were observed.
D. Fisher and R. A. Spits(“Spectroscopic evidence of GE POLHPHT-treated natural type IIa dia-monds,” Spring 2000 Gems & Gem-ology, pp. 42–49) reported nineHPHT-treated type IIa stones in
which isolated nitrogen was detected,although their concentrations werelower. Since it is well known thatnatural type IIa diamonds may con-tain traces of highly aggregated nitro-gen, the occurrence of isolated nitro-gen in this 4.33 ct yellow diamondraised suspicions of HPHT treatment.This was confirmed by photolumi-nescence (PL) analysis. PL spectracollected using an Ar laser at 488 and514 nm excitations exhibited strongemissions from N-V centers, with thepeak at 637 nm being much strongerthan that at 575 nm. Additional evi-dence included the presence of astrong H3 emission (but see the fol-lowing Lab Note) and the absence of3H and H4 emissions. Imaging with aDiamond Trading Company (DTC)DiamondView instrument showed ahomogeneous distribution of green-ish yellow luminescence, which isvery different from what we haveobserved in natural-color type IIa orIb diamonds, or in typical type IIaHPHT-treated diamonds.
The temperatures employed inHPHT treatment are much higherthan the natural conditions of dia-mond formation. Conceivably, HPHTannealing not only could removebrown coloration possibly caused byplastic deformation, but it also couldtransform part of the highly aggregat-ed nitrogen into isolated nitrogen.When the concentration of isolatednitrogen is high enough, the diamondwill show a pure yellow color. TheFancy yellow bodycolor of this stonecould be a combination of the relative-ly high concentration of isolated nitro-gen with the stone’s relatively largesize and its cut. The existence of thishigh-quality type IIa yellow diamondindicates that HPHT annealing iscapable of producing a wider range ofcolors than previously believed.
This diamond is a reminder of thecomplexity of identifying HPHT-annealed diamonds. Although wehave encountered a few diamondslike this in the past, we do not knowif this was a “planned” result or anaccidental outcome of the treatment.
Wuyi Wang and Thomas Gelb
Figure 4. The moderately strong and broad absorption centered at 270 nm,together with the two sharp absorptions at 268 and 271 nm, in the UV-Visabsorption spectrum of the 4.33 ct yellow type IIa diamond confirmed the pres-ence of isolated nitrogen. The gradual increase in absorption at energies above~500 nm due to isolated nitrogen is the main cause of the yellow bodycolor.

LAB NOTES GEMS & GEMOLOGY SPRING 2005 45
Inhomogeneous Cape Diamond Yellow type Ia cape diamonds show acharacteristic visible absorption spec-trum, with primary peaks at 415.5and 478.0 nm and weaker bands at453.0 and 466.0 nm. Absence of H3absorption is also typical. These arethe most common colored diamondsin the market. Attractive yellow colorin diamond can be artificially createdby irradiation and annealing, as wellas by HPHT treatment. These pro-cesses, particularly irradiation andannealing, create a strong absorptionof H3, which selectively absorbs bluelight. As a result, a distinct yellowhue is produced. Occurrence of a rela-tively strong H3 absorption in an oth-erwise typical cape diamond usuallyraises suspicions of treatment.
Recently, the East Coast laborato-ry had a chance to examine a veryunusual 1.03 ct Fancy Intense yellowcushion modified brilliant diamond(figure 5). Although it had absorptionfeatures and other gemological prop-erties that proved it was a natural-color cape stone, it displayed anunusual luminescence pattern whenexamined using the DTC Diamond-View. In contrast to typical cape dia-monds, which show homogeneousblue (and, to a lesser extent, brownishyellow) UV fluorescence in theDiamondView (figure 6, left), thisstone displayed obvious zoning (figure
6, right). A strong greenish yellowreaction was seen in some narrowparallel bands that extended acrossalmost half the table facet, whilemost of the remainder of the stoneshowed typical blue luminescence. Ofthe more than 100 cape diamondsexamined face-up in the laboratorywith the DiamondView, this is theonly one that has ever shown suchheterogeneous luminescence.
To confirm our belief that thestrong greenish yellow fluorescence in
these bands was caused by localizedhigh concentrations of the H3 defect,we took PL spectra with a Ramanmicrospectrometer (using 488 nmlaser excitation) in both the blue andgreenish yellow fluorescing areas ofthe stone. As seen in figure 7, the bluearea showed only a very weak H3peak, whereas the isolated greenishyellow area showed a very strong H3.Note that in an irradiated yellow dia-mond, the H3 absorption would havebeen observed across the entire stone.
Figure 5. This natural-color 1.03ct cape diamond showed local-ized H3 absorption, a feature typ-ically associated with treated-color yellow diamonds.
Figure 6. A typical cape diamond (left) shows homogenous blue fluores-cence in the DTC DiamondView. In contrast, the 1.03 ct diamond on theright displayed blue and greenish yellow luminescence zoning. The green-ish yellow fluorescence is caused by the H3 defect.
Figure 7. These PL spectra of the unusual cape diamond in figure 5 clearlyillustrate the difference in intensity of H3 emission between a blue fluo-rescing area (marked A on figure 6, spectrum A here) and an area showinga greenish yellow fluorescence (B on figure 6, spectrum B here).
BA

These results confirm that natu-ral cape diamonds can have localizedregions with high concentrations ofthe H3 defect. Because it was nothomogenous throughout the stone,the H3 center in this cape diamondwould have gone undetected withstandard testing methods. RandomPL analyses would not have revealedit. Likewise, standard short-waveUV lamps do not have enough inten-sity to excite the H3 defect, andtherefore would not have shown thegreenish yellow zoning. Discovery ofthis rare cape diamond indicatesthat the occurrence of H3 in a (natu-ral-color) type Ia cape diamond couldbe more common than we hadbelieved. We continue to gather use-ful information about the distribu-tion of defects in diamond using theDTC DiamondView.
Paul Johnson and Kyaw Soe Moe
Irradiated and Fracture-Filled DiamondRecently, the East Coast laboratoryreceived a bluish green 1.22 ct roundbrilliant cut diamond for a coloreddiamond grading report. Preliminaryvisual inspection of the stone raisedquestions about the origin of itscolor, which appeared quite similarto that seen in artificially irradiated
diamonds. Indeed, magnificationrevealed a bluish green color zonethat followed the faceting outline—acommon side effect of laboratoryirradiation—at the culet (figure 8).This zonation, along with features inthe visible spectrum observed with adesk-model spectroscope, confirmedthat the color of this stone was theresult of artificial irradiation.
However, microscopic examina-tion revealed signs of additional treat-ment. A number of large fracturesdisplayed the flash-effect colors typi-cally associated with fracture fillingto improve apparent clarity (figure 9).Closer inspection revealed both theflash-effect colors and, within thefractures, the flow structures that arecommonly seen in a glass-like filler(again, see figure 8). An X-radiographprovided final proof of clarityenhancement (the filling materialabsorbs more X-rays than the sur-rounding diamond).
Although it is not uncommon forus to see treated diamonds, it is rareto see two such treatments in onestone. From the brown grain linesthat were still visible and the largefractures, one could speculate thatthis round brilliant was a heavilyincluded brown diamond beforetreatment. Since fracture filling is anon-stable treatment, it is laboratorypolicy not to provide any grading
information on diamonds enhancedin this fashion.
Thomas Gelb
A Coated “NIGHT GLOWING PEARL”“Night glowing pearls” are legendaryjewels in Chinese and south Asiancultures, and were a symbol of super-natural power and wealth in ImperialChina. One such “pearl” is said tohave been placed in the mouth ofDowager Empress Cixi, the lastempress of the Qing Dynasty, afterher death. These jewels have alwaysbeen greatly sought after, and inrecent years they have fetched highprices in the Chinese jewelry market.However, they have remained myste-rious due to their scarcity, which hashampered thorough documentation oftheir nature. According to historicalChinese literature, as quoted inJoseph Needham’s Science andCivilization in China (CambridgeUniversity Press, Cambridge, UK,1954), they are not actually pearls;rather, they are spheres of a mineralor rock of various colors that exhibitphosphorescence at night (i.e., “glowin the dark”). Ancient Chinese impe-rial courts acquired these spheresfrom Persia or Ceylon. Today, theyare believed to be composed of fluo-rite or calcite with rare-earth ele-ments that act as phosphorescentagents (A. S. Marfunin, Spectroscopy,Luminescence and Radiation Centersin Minerals, Springer-Verlag, Berlin,1979; Y. R. Huang, “The glowingstones,” Jewelry World, No. 2, 2004,pp. 112–115 [in Chinese]).
Recently, a semitranslucent toopaque mottled green-and-gray sphere(figure 10) was submitted to the EastCoast laboratory for identification.Due to its size (63 mm in diameter)and weight (366 g), we could not mea-sure its specific gravity using thehydrostatic method; however, it ispossible to estimate the S.G. of aspherical object from its mass anddiameter. Using this method, we cal-culated the S.G. to be approximately2.80. Spot R.I. measurements varied
46 LAB NOTES GEMS & GEMOLOGY SPRING 2005
Figure 8. This 1.22 ct round bril-liant diamond displays an obvi-ous color zone at the culet, whichis a typical side effect of artificialirradiation. Also visible are flowstructures from extensive fracturefilling. Magnified 30¥.
Figure 9. Closer examination ofthe diamond in figure 8 showsthe numerous flash-effect colorsassociated with fracture fillingto improve apparent clarity.Magnified 45¥.

LAB NOTES GEMS & GEMOLOGY SPRING 2005 47
from 1.56 in the green areas to as highas 1.60 in a gray area.
Magnification with a standardgemological microscope revealednumerous small round gas bubbles,some of which broke the surface (fig-ure 11). These were observed acrossthe sphere, with the exception of onegray area. The sphere fluoresced verystrong green-yellow to long-wave UVradiation and strong green to short-wave UV. The most impressive gemo-logical property was the strong green-yellow phosphorescence to both long-and short-wave UV, which lastedlonger than 15 minutes. However,both the fluorescence and the phos-phorescence were unevenly distribut-ed, as the gray areas showed less ornone of either reaction (compare fig-ures 10 and 12), and the area withoutany bubbles was inert. Even moreunusual was the fact that when thesphere was subjected to a strong fiber-optic light source, the phosphores-cence was visible even in regularoffice lighting. Due to the strengthand duration of the phosphorescence,we suspected this sphere would proba-bly be considered a legendary “nightglowing pearl.”
Because of the many gas bubbles,our first impression was that thesphere was likely a mineral or rockthat had some sort of coating, with thegray areas—from their higher R.I. and
weaker phosphorescence—represent-ing spots where the coating was thinor nonexistent. Thus, with the client’spermission, we analyzed a green areaand a gray area with Raman spec-troscopy both at and beneath the sur-face by digging two very small, shal-low (approximately 0.5 mm deep)craters. The spectra obtained at thebottom of the craters clearly differedfrom those taken on the surface, evenin the gray area, but neither set of spec-tra provided a conclusive identifica-tion. We subsequently performed ener-gy-dispersive X-ray fluorescence(EDXRF) analysis of another green areaand the gray area without bubbles, andfound that the green area contained amajor amount of Sr, as well as signifi-cant amounts of Al, Ba, S, Zn, Fe, andCa, and minute quantities of Eu andDy. In comparison, the gray area con-tained Mg, Al, Si, Ca, Fe, and Ni.
We also performed X-ray diffrac-tion analysis on small quantities ofpowder scraped from the bottom ofthe previously mentioned craters andfrom the surface. For both craters, theformer pattern matched that of a talc-serpentine mixture (Mg, Al silicates),whereas the pattern from the surfacematched that of a mixture of SrAl2O4and SrAl4O7 (generally known as
strontium aluminates). Based on this evidence, we con-
cluded that the sphere was a talc-ser-pentine rock covered unevenly with acoating that contains an Eu- and Dy-doped SrAl2O4–SrAl4O7 mixture. Thismanufactured coating has severalmodern uses as a long-lasting phospho-rescent pigment. Its phosphorescencehas been documented to last for manyhours and, in some cases, even days (T.Katsumata et al., “Characteristics ofstrontium aluminate crystals used forlong-duration phosphors,” Journal ofthe American Ceramic Society, Vol.81, No. 2, 1998, pp. 413–416; K. R. S.Preethi et al., “SrAl4O7:Eu2+ nanocrys-tals: Synthesis and fluorescence prop-erties,” Journal of Physics D, Vol. 37,No. 19, 2004, pp. 2664–2669).
Andy Shen, Wendi M. Mayerson,and Dino DeGhionno
QUARTZCovellite in QuartzWe recently had the opportunity toexamine four oval buff-top modified
Figure 10. This mottled green-and-gray sphere (63 mm in diameter)proved to be a talc-serpentine rockwith a phosphorescent coating.
Figure 12. After exposure to ultra-violet radiation, the sphere in fig-ure 10 shows exceptional phos-phorescence. This phosphores-cence lasted longer than 15 min-utes following exposure to bothlong- and short-wave UV. Theareas showing less or no phospho-rescence correspond to the areasthat appeared gray under normallighting conditions.
Figure 11. Magnification revealednumerous gas bubbles on the sur-face of the talc-serpentine sphere.No bubbles are apparent in therectangular area in the lower rightcorner, where there was no coat-ing. Magnified 112¥.

48 LAB NOTES GEMS & GEMOLOGY SPRING 2005
brilliant cut samples of a material thatwas being represented as “pink firequartz.” The stones (8.07–18.81 ct)were transparent to semitransparentand near-colorless to light brown;most had numerous inclusions (see,e.g., figure 13). At first there did notseem to be anything unusual aboutthese stones, which were readily iden-tified as quartz based on standard
gemological testing, but closer exami-nation revealed a flash of pink to pur-ple from some viewing angles. Theflash was directional and at times verybright, resembling the schiller some-times seen in corundum when lightreflects off oriented rutile inclusions.
We had not witnessed such aneffect in quartz before, and at firstglance we thought it might have been
produced by some form of treatment.However, the inclusions creating thisschiller could be seen with the unaid-ed eye as dark specks throughout thestones. With magnification and dark-field illumination, these inclusionsproved to be very thin transparent tosemitransparent grayish green hexago-nal platelets oriented in parallel planes(figure 14). The pink/purple schillerwas iridescence off the flat surfaces ofthese platelets when they wereviewed in reflected light (figure 15).These inclusions were so thin thatthey almost disappeared when viewedat 90° from the flat surface.
Raman analysis identified a coupleof these platelets as the copper sulfidecovellite (CuS), which is typicallyopaque with a mottled dark blue color,metallic luster, and strong pink-to-pur-ple iridescence. Covellite usuallyforms as hexagonal platelets, and canappear green in transmitted light whenthe platelets are thin enough (M.Fleischer et al., Microscopic Deter-mination of the Nonopaque Minerals,U.S. Geological Survey Bulletin 1627,1984, p. 62). It is occasionally seen cutinto cabochons, but we were unfamil-iar with it as an inclusion. DinoDeghionno, manager of West CoastIdentification Services, attempted toconfirm this identification using pow-der X-ray diffraction analysis, but theinclusions were too small to providesufficient material for analysis.However, EDXRF chemical analysis ofthe quartz samples by research associ-ate Sam Muhlmeister did reveal cop-per. Based on the Raman analysis,presence of Cu, and appearance of theinclusions, we concluded that therewas a high probability they wereindeed covellite. Our literature searchdid not uncover a reference to covelliteas an inclusion in quartz, but the twominerals are known to occur together.
This material reportedly was fromBrazil’s Minas Gerais region. Thestones contained additional inclusionstypical of quartz: “fingerprints,” two-phase inclusions, and elongated, angu-lar orangy red crystals that Ramananalysis identified as hematite.
Elizabeth P. Quinn and SFM
Figure 13. Covellite inclusions are responsible for the “hot pink” schiller inthese two samples of smoky and near-colorless quartz (18.81 and 18.00 ct).
Figure 14. With magnification anddarkfield illumination, these cov-ellite inclusions appeared astransparent to semitransparentgrayish green hexagonal plateletsin the host quartz. Magnified 33¥.
Figure 15. When viewed withreflected light, the platelets seenin figure 14 appeared bright pinkdue to unusually strong irides-cence, a property well document-ed in covellite.

LAB NOTES GEMS & GEMOLOGY SPRING 2005 49
Rock Crystal Quartz with Unusual Surface TextureRecently, the East Coast laboratoryreceived for identification three trans-parent to semitransparent near-color-less oval modified brilliants rangingfrom 5.20 to 5.40 ct. Standard gemo-logical testing on all three stonesrevealed properties consistent withrock crystal quartz. What caught thisauthor’s attention was an unusualsurface texture seen on all threestones in varying degrees (figure 16).
The first stone was almost com-pletely covered with numerous small,very shallow, irregular grooves andchannels (figure 17). Although differ-ent in structure, this overall patternwas reminiscent of the “crazed layer”seen on stones with a Lechleitnersynthetic emerald overgrowth (seeWinter 1992 Lab Notes, pp. 263–264),which aroused suspicion. The texturewas seen in random patches on thesecond stone, although in some placesit appeared as thin crystalline layerson the surface (figure 18), very differ-ent from the first stone. Synthetic
overgrowths normally display somesort of disturbance at or near thepoint of interface with the substrate;frequently, this disturbance appears asa plane of inclusions. However, nointerface was detected on any of thesestones. The third stone had only rem-nants of the unusual surface textureon its girdle, which suggested that itmight have been repolished.
No differences in properties weredetected between the areas of unusualtexture and the polished areas witheither standard gemological or spec-troscopic (EDXRF and Fourier-trans-form infrared) testing; nor were anydifferences in properties detectedamong the three stones. A discussionwith the client revealed that thesestones were part of a larger parcel thathad been purchased as topaz and thensent to be treated by a “diffusion”process. These three were rejected bythe treater because they were quartzand were returned to the client in thiscondition.
This new information gave usmuch-needed insight. The texturedsurface was not an overgrowth, but
Figure 17. The unusual surfacetexture—numerous small, veryshallow, irregular grooves andchannels—almost completelycovered the stone on the far left infigure 16. Magnified 112¥.
Figure 16. These three faceted samples of rock crystal (5.20–5.40 ct) showvarying degrees of an unusual surface texture. The stone on the right hasthe texture only on the girdle.
Figure 18. In addition to areas of channels and grooves, the middle stonein figure 16 also showed thin, uneven crystalline layers on its surface.These layers are transparent (left) but slightly rough, and therefore scatterlight and have a white appearance when viewed at certain angles (right).Magnified 20¥ (left), 15¥ (right).

50 LAB NOTES GEMS & GEMOLOGY SPRING 2005
rather the result of dissolution or etch-ing. Whether or not this treatment oftopaz (which uses cobalt or a cobaltoxide) is actually “diffusion” or merelya durable surface treatment has notbeen established (see S. F. McClure,“Identification challenges of the newmillennium,” Fall 1999 Gems &Gemology, pp. 86–87). In either case, itwas first seen at the Tucson gemshows in 1998 (Summer 1998 GemNews, pp. 143–144) and is a patentedprocess (R. Pollak, Method forEnhancing the Color of MineralsUseful as Gemstones, U.S. Patent5,888,918, filed April 25, 1997; issuedMarch 30, 1999) that is currently beingmarketed under the trademark PHD.
The patent mentions that duringpreparation for treatment, the stonesmay be soaked in a series of acid andsolvent baths. Although the patentalso covers the treatment as it appliesto quartz, it specifically states that“[c]are should be taken in selectingthe temperature to which stones areheated, as quartz tends to develop sur-face damage when subjected to exces-sive temperatures.” Even more inter-esting in relation to the three stonesin question, the patent goes on tomention, “[i]n the event surface dam-age does occur, the treated stones canbe repolished, producing a smoothcolored finished product.” Accordingto the patent, cobalt typically pro-duces a light to dark pink colorationwith quartz.
Since these three stones were col-orless, it is likely the surface dissolu-tion/etching, and hence their identityas quartz rather than topaz, was dis-covered during the preparation pro-cess, and they never underwent thecobalt treatment.
Wendi M. Mayerson
SPHENE Cabochon with anUnusual Natural Surface Sphene, or titanite, a monoclinic calci-um titanium silicate, is a relativelyuncommon gem mineral primarilyknown for its strong dispersion, or“fire.” This colorful property is bestdisplayed when material of suitable
quality is fashioned as a round brilliantor similar faceting style, so virtually alltransparent gem-quality sphene isfaceted. Therefore, it was interesting toexamine an 8.49 ct transparent yellow-ish green pear-shaped sphene cabochonthat had been cut from a facetablecrystal purchased in GovernadorValadares, Minas Gerais, Brazil. LeonM. Agee sent the 17.64 ¥ 14.04 ¥ 3.73mm partially polished cabochon to theWest Coast laboratory for gemologicalexamination.
As can be seen in figure 19, thiscabochon showed virtually no disper-sion, which at first glance seemed tobe a waste of this gem material’spotential. However, Mr Agee in-formed us that the stone was not cutto display this sphene’s dispersion,but rather to highlight and magnifyan interesting natural crystal surface,which was left unpolished and usedas the base of the cabochon.
With the dome serving as a mag-nifying lens, not only did the convo-luted contours and depressions onthe base stand out, but sphene’s char-acteristic strong double refractioncould also be seen. With low-powermagnification, it was evident that thebase of the cabochon was decoratedwith an intricate random arrange-ment of partial mineral casts with a micaceous habit (figure 20).
From observation of this microfea-ture, it appeared that the sphene wasat one time either superficially dustedwith numerous twisted worm-likecolumns or stacks of a mica- or chlo-
rite-group mineral, or it grew upaganist such minerals. Then, as thesphene continued to grow, the mica-ceous minerals became embedded inits surface, leaving their characteristicvisual impressions. However, growthmust have ceased before they could becompletely enclosed as inclusions. Asa result, only partial casts of the mica-ceous mineral(s) were left behind.
To complete the examination ofthis gem, we identified the cabochonitself as sphene using classical gemo-logical testing techniques.
John I. Koivula and Maha Tannous
PHOTO CREDITSWuyi Wang—1 and 5; Jessica Arditi—3;Paul Johnson—6; Thomas Gelb—8 and 9;Maha Tannous—10, 12, 13, and 19;Wendi Mayerson—11, 17, and 18; Shane F.McClure—14 and 15; Elizabeth Schrader—16; John I. Koivula—20.
Figure 19. This 8.49 ct sphene wascut as a cabochon to showcasethe interesting natural surfacethat was used as the base.
Figure 20. With 5¥ magnifica-tion and a combination of polar-ized and fiber-optic lighting, thebase of the sphene cabochon infigure 19 revealed an intricaterandom arrangement of whatappear to be casts of a mineralwith a micaceous habit.
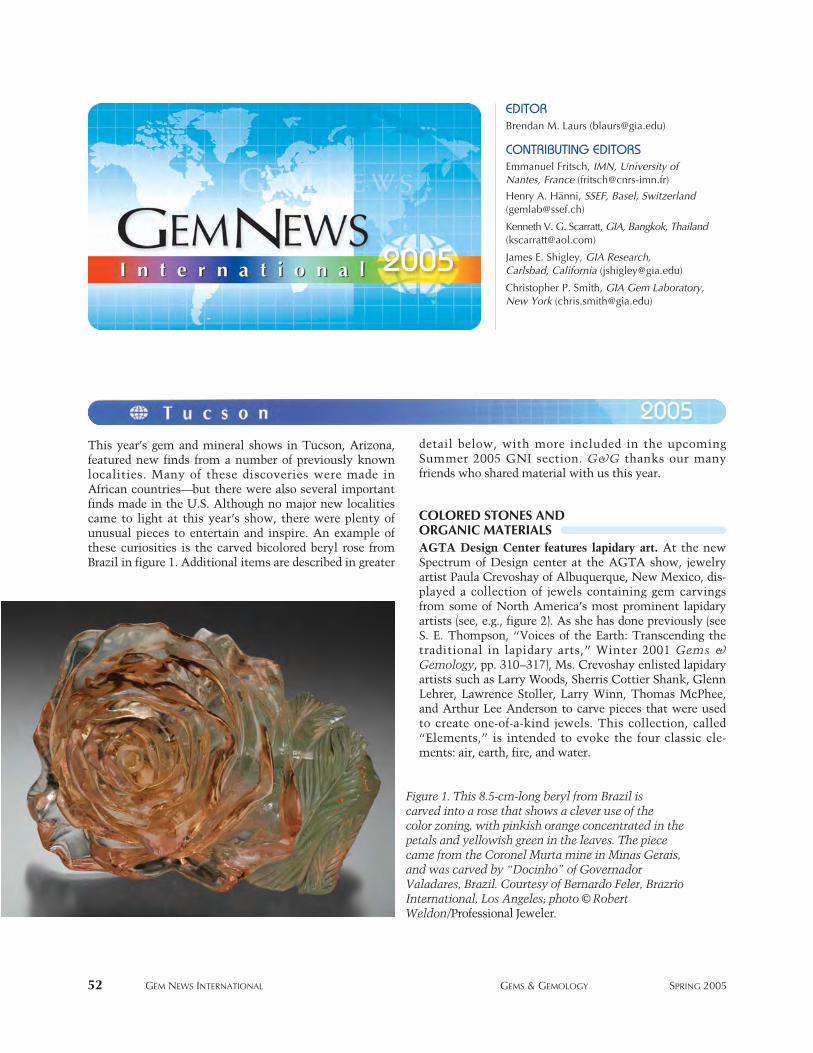
detail below, with more included in the upcomingSummer 2005 GNI section. G&G thanks our manyfriends who shared material with us this year.
COLORED STONES AND ORGANIC MATERIALSAGTA Design Center features lapidary art. At the newSpectrum of Design center at the AGTA show, jewelryartist Paula Crevoshay of Albuquerque, New Mexico, dis-played a collection of jewels containing gem carvingsfrom some of North America’s most prominent lapidaryartists (see, e.g., figure 2). As she has done previously (seeS. E. Thompson, “Voices of the Earth: Transcending thetraditional in lapidary arts,” Winter 2001 Gems &Gemology, pp. 310–317), Ms. Crevoshay enlisted lapidaryartists such as Larry Woods, Sherris Cottier Shank, GlennLehrer, Lawrence Stoller, Larry Winn, Thomas McPhee,and Arthur Lee Anderson to carve pieces that were usedto create one-of-a-kind jewels. This collection, called“Elements,” is intended to evoke the four classic ele-ments: air, earth, fire, and water.
This year’s gem and mineral shows in Tucson, Arizona,featured new finds from a number of previously knownlocalities. Many of these discoveries were made inAfrican countries—but there were also several importantfinds made in the U.S. Although no major new localitiescame to light at this year’s show, there were plenty ofunusual pieces to entertain and inspire. An example ofthese curiosities is the carved bicolored beryl rose fromBrazil in figure 1. Additional items are described in greater
52 GEM NEWS INTERNATIONAL GEMS & GEMOLOGY SPRING 2005
EDITORBrendan M. Laurs ([email protected])
CONTRIBUTING EDITORSEmmanuel Fritsch, IMN, University of Nantes, France ([email protected])
Henry A. Hänni, SSEF, Basel, Switzerland([email protected])
Kenneth V. G. Scarratt, GIA, Bangkok, Thailand([email protected])
James E. Shigley, GIA Research,Carlsbad, California ([email protected])
Christopher P. Smith, GIA Gem Laboratory,New York ([email protected])
Figure 1. This 8.5-cm-long beryl from Brazil is carved into a rose that shows a clever use of the color zoning, with pinkish orange concentrated in thepetals and yellowish green in the leaves. The piececame from the Coronel Murta mine in Minas Gerais,and was carved by “Docinho” of GovernadorValadares, Brazil. Courtesy of Bernardo Feler, BrazrioInternational, Los Angeles; photo © RobertWeldon/Professional Jeweler.

GEM NEWS INTERNATIONAL GEMS & GEMOLOGY SPRING 2005 53
One of the most notable pieces is “Green Dream,” adiamond, tourmaline, and tsavorite necklace featuring a217 ct peridot carving by Larry Woods (see the cover of thisissue). According to Mr. Woods, the central stone wascarved from a 69 gram Pakistani peridot crystal, incorporat-ing the abstract organic style he uses for most of his work.
Two other pieces contain memorable, though very dif-ferent, opal carvings by Sherris Cottier Shank (again, seefigure 2). “Spring Waterfall” features a 6.15 ct crystal opalfrom Lightning Ridge, Australia. The difficulty in work-ing with this material, according to Ms. Shank, is that theintense play-of-color requires great care in planning adesign, so that the final carving works with the color pat-terns instead of against them. The other jewel, “Ether,”also features a crystal opal; however, this larger (53.80 ct)stone, though near-colorless at first glance, displays ele-gant textures and tones brought out by precise carving ofthe back of the piece.
“Elements” will be the focus of a future museumexhibit intended to showcase the growth of gem carving asan art form in North America.
Thomas W. Overton ([email protected])GIA, Carlsbad
Amethyst from Georgia. At the Arizona Mineral & FossilShow (Clarion Hotel) and the Tucson Gem & MineralSociety show (Tucson Convention Center), Terry Ledford
Editor’s note: The initials at the end of each item identify theeditor or contributing editor who provided it. Full names andaffiliations are given for other contributors. Shane F. McClureand Dr. Mary L. Johnson of the GIA Gem Trade Laboratoryin Carlsbad are thanked for their internal review of the GemNews International section.
Interested contributors should send information andillustrations to Brendan Laurs at [email protected] (e-mail),760-603-4595 (fax), or GIA, 5345 Armada Drive, Carlsbad,CA 92008. Original photos will be returned after considera-tion or publication.
GEMS & GEMOLOGY, Vol. 41, No. 1, pp. 52–73© 2005 Gemological Institute of America
Figure 2. These pieces are from Paula Crevoshay’s “Elements” collection. From left are “Ether,” a brooch featuringa 53.80 ct carved opal with zircon; “Spring Waterfall,” incorporating a 6.15 ct carved opal with zircon, demantoid,aquamarine, moonstone, and diamond; “Sky,” a gold and diamond ring showcasing a 9.54 ct tanzanite carving;and “Ocean Dream,” a brooch featuring a 199.62 ct chrysocolla octopus with a moonstone “eye” and diamondand zircon accents. The chrysocolla in “Ocean Dream” was fashioned by Glenn Lehrer; the other carvings are bySherris Cottier Shank. Courtesy of Paula Crevoshay; photo © Harold and Erica Van Pelt.

54 GEM NEWS INTERNATIONAL GEMS & GEMOLOGY SPRING 2005
of Mountain Gems & Minerals, Little Switzerland, NorthCarolina, had some newly mined amethyst from WilksCounty, Georgia. The mine is located between the com-munities of Rayle and Tignall, in an area known asJackson’s Crossroads, about 150 km east of Atlanta.Amethyst has been produced from surface workings inthis area since the mid-1980s.
The current property owner, Rodney Moore, beganmining in August 2004. After the initial work yieldedsome high-quality amethyst, Mr. Moore began workingthe subsurface deposits with a trackhoe, starting in lateOctober. The following month, he formed a partnershipwith Mr. Ledford to market the rough and cut material.Their excavations have exposed a series of pockets to adepth of 6 m in the weathered granitic host rock. Thelargest pockets measured 60–80 cm long and 25–30 cmwide, and contained crystals of amethyst that were “float-ing” within clay. So far, more than 100 kg of amethystcrystal specimens and fragments have been produced,from which several stones were faceted. The largest stonescut so far weigh 19.95 (figure 3), 36.22, and 48.55 ct.
The cut material typically displays a deep purple colorin incandescent light, and Mr. Ledford indicated that a
noticeable color shift (more blue) is seen in daylight.According to gem cutter Mike Watkins of Hiddenite,North Carolina, the orientation of the rough is critical toattaining the maximum color shift in the faceted material.
In early March 2005, Mr. Ledford indicated that furthermining has resulted in additional amethyst production.The site is open to public mineral collecting on a fee-digbasis (see www.dixieeuhedrals.net/jxr).
BML
Amethyst and citrine from northwestern Namibia. Atthe Arizona Pueblo Inn Gem & Mineral Show, HannesKleynhans (Kristall Galerie, Swakopmund, Namibia)showed this contributor some amethyst and citrine fromthe Sarusas mine in northwestern Namibia. Bill Barker(Barker & Co., Scottsdale, Arizona) also had Sarusas cit-rine at the AGTA show. Mr. Kleynhans, who is miningthe deposit, has enlisted Mr. Barker to market both theamethyst and citrine cut stones in the future.
The deposit is located in the Namib Desert, within aremote area of Skeleton Coast Park. According to Mr.Kleynhans, quartz was mined there on a small scale fromthe late 1960s to the mid-1980s, and all the productionwent to Germany. In 2004, after completing a three-yearpermitting procedure to mine in this environmentally sen-sitive area, he started reworking the deposit with mecha-nized equipment. The requirements of the permit stipu-late that no permanent structures or roads may be built inthe area, and all pits must be reclaimed.
Figure 3. Fine amethyst crystals and faceting rough wererecently mined in Georgia. The doubly terminated crys-tal shown here is 6.4 cm tall, and the Portuguese cut(faceted by Mike Watkins) weighs 19.95 ct. Courtesy ofMountain Gems & Minerals; photo © Jeff Scovil.
Figure 4. Mining for amethyst geodes at the Sarusasmine in northwestern Namibia employs pneumaticdrills to make holes in hard areas of the basalt, whichare then filled with an expansion compound to helpfracture the rock. Courtesy of Kristall Galerie.

GEM NEWS INTERNATIONAL GEMS & GEMOLOGY SPRING 2005 55
According to Mr. Kleynhans, the deposit hosts geodesof amethyst (and, rarely, pale citrine) in vugs within basalt.An excavator is used to dig shallow open pits, and theminers also drill in the more solid areas of the basalt (fig-ure 4) and fill the holes with an expansion compound.After this compound is moistened with seawater, itexpands and fractures the surrounding rock.
During the latter part of 2004, about 1,500 kg of roughwas produced. So far, less than 1% of the rough has beenfacetable, with the cut stones weighing between 2 and 20ct. The color of the amethyst ranges from light to dark pur-ple, and the citrine is typically orangy yellow to deeporange (figure 5). The commercially available citrine is pro-duced by heating the amethyst up to 600°C, with the deep-er orange colors corresponding to a deeper purple color inthe original amethyst.
BML
Aquamarine from Mt. Antero, Colorado. A recent discov-ery of spectacular aquamarine crystals from the historicMt. Antero locality in Colorado was displayed for the firsttime at the Tucson Gem & Mineral Society show. Thegem-quality aquamarines were associated with smokyquartz and feldspar, and the specimens were exhibitedtogether with some faceted aquamarines from the samepocket.
Mt. Antero is located 27 km northwest of Salida in theSawatch Range, Chaffee County, central Colorado; the areahas fascinated mineral collectors for over a century (see,e.g., M. I. Jacobson, Antero Aquamarines: Minerals fromthe Mt. Antero–White Mountain Region, Chaffee County,Colorado, L. R. Ream Publishing, Coeur d’Alene, Idaho,1993). According to Stephen Brancato, who discovered andmined the aquamarines in July 2004, they were found in a miarolitic cavity (called “Diane’s Pocket”) on the Claire
Mary Ellen #1 claim, at an elevation of about 12,500 feet(3,810 m). This discovery considerably overshadows previ-ous finds at Mt. Antero, possibly yielding the finest matrixaquamarine crystals from North America.
So far, five stones (ranging from 2 to 4 ct) have been cutfrom aquamarine fragments in the pocket. According toBryan Lees (The Collector’s Edge, Golden, Colorado), thereis sufficient gem rough to cut several dozen stones, possiblyup to 20 ct. As such, this discovery could yield Colorado’slargest faceted aquamarine; the weight of the current recordholder is 18.95 ct (see J. A. Murphy and P. J. Modreski, “Atour of Colorado gemstone localities,” Rocks & Minerals,Vol. 77, No. 4, 2002, pp. 218–238). The faceted aquamarinesare being marketed by Paul Cory (Iteco Inc., Powell, Ohio),while the mineral specimens are sold through Mr. Lees.About six high-quality matrix aquamarines were produced,with the longest crystal measuring 16.5 cm (figure 6). All ofthe specimens required simple repairs to reattach crystalsthat had been broken from the matrix by natural forces. Inaddition to these specimens, the pocket yielded dozens ofwell-formed loose aquamarine crystals.
BML
Figure 5. Amethyst and citrine (here, approximate-ly 4.5 ct each) from the Sarusas mine show a widerange in color. Courtesy of Barker and Co.; photoby Maha Tannous.
Figure 6. Reportedly the best matrix aquamarinecrystals ever found in North America were recoveredin July 2004 at Mt. Antero, Colorado. The largeraquamarine crystal in this repaired specimen mea-sures 16.5 cm tall. Courtesy of The Collector’s Edge;photo © Jeff Scovil.

56 GEM NEWS INTERNATIONAL GEMS & GEMOLOGY SPRING 2005
Saturated blue aquamarine from Nigeria. At the AGTAshow, Robert Kane (Fine Gems International, Helena,Montana) had some aquamarine from northern Nigeriathat was notable for its saturated blue color. According toMr. Kane, the intensely colored rough was purchased asnatural-color aquamarine, and the material was not subse-quently subjected to any treatment. The stones were cutfrom a 103 gram parcel of rough, with pieces weighing
0.5–3 grams. A total of 107 carats were faceted, rangingfrom approximately 0.25 to 3 ct (see, e.g., figure 7).
In January 2005, Mr. Kane loaned 17 of the better-quali-ty faceted samples to GIA for examination. A 2.91 ct emer-ald cut was examined in detail for a GIA Gem Laboratoryidentification report, and the following properties wererecorded: color—blue; pleochroism—strong, dark blue andlight blue-green (visible even to the unaided eye whenviewed face-up); R.I.—1.582–1.589; birefringence—0.007;S.G.—2.76; and fluorescence—inert to long- and short-wave UV radiation. The desk-model spectroscope showed astandard aquamarine absorption spectrum (caused by iron)that ruled out a Maxixe-type color origin. Magnificationrevealed growth tubes, pinpoints, white mineral inclusions(identified as a carbonate by Raman analysis), and anunusual growth zoning (figure 8) with wavy and planar fea-tures that were reminiscent of some hydrothermal synthet-ic beryls. EDXRF spectroscopy revealed major amounts ofAl and Si, and traces of K, Sc, Mn, Fe, Zn, Ga, Rb, and Cs.This chemical composition, as well as the inclusion char-acteristics, proved a natural origin for this aquamarine.
The R.I., birefringence, and S.G. values are in the highend of the range reported for aquamarine (see, e.g., R.Webster, Gems, 5th ed., revised by P. G. Read, Butterworth-Heinemann, Oxford, England, 1994, pp. 124–125). Whilethese properties (and the color) are consistent with berylcontaining small amounts of iron, they are substantiallylower than those documented recently in dark blue berylfrom Canada that contained high amounts of iron (seeWinter 2003 Gem News International, pp. 327–329).
BML
Carved chalcedony chain. At the Arizona Pueblo Inn Gem& Mineral Show, Steve Ulatowski (New Era Gems, GrassValley, California) showed this contributor a chain thathad been carved in China from a single piece of Brazilianchalcedony (figure 9). According to Mr. Ulatowski, onlytwo such chains (22 and 43 cm long) were successfullycarved in early 2002, from about a dozen attempts by thecarvers. Although this style of carving also is seen injadeite, the brittle nature of chalcedony makes the chainsparticularly challenging to execute. In addition, relativelylarge pieces of unfractured material were needed to carvethe chalcedony chains.
BML
New emerald deposit in Xinjiang, China. At the AGTAshow, one of us (DB) had a few rough and cut samples ofemerald from a new deposit in China. From recent conver-sations with miners and mineral dealers in northernPakistan who have visited the deposit or purchased roughnear it, this contributor learned that it is located in theTaxkorgan region in western Xinjiang Province, near thevillage of Dabdar, which is approximately 120 km (or atwo-hour drive) from the Khunjerab Pass. At 15,800 feet(4,816 m), this pass lies on the border between northern
Figure 8. An unusual wavy growth zoning was seen inthe Nigerian aquamarine. Photo by Maha Tannous;magnified 40¥.
Figure 7. This aquamarine from Nigeria (0.40–2.91 ct)shows a saturated blue color. Courtesy of Fine GemsInternational; photo © Harold and Erica Van Pelt.

GEM NEWS INTERNATIONAL GEMS & GEMOLOGY SPRING 2005 57
Pakistan and China. Visiting the emerald area is reportedlynot straightforward, requiring a special travel permit froma government office in Kashgar (6–8 hours by road fromthe Khunjerab Pass). After backtracking to the mine area,Dabdar village is then about 2.5–3 km from the mainKashgar road.
This contributor first learned of the Chinese emeralddiscovery while in northern Pakistan in November 2003,but he saw only poor-quality rough at that time. Heobtained additional samples during a return visit toPakistan in June 2004, including a matrix specimen con-taining a small bright green emerald crystal, as well as afew cut emeralds; three of these were subsequently exam-ined at GIA for this report (see below). He also was offeredattractive faceted examples, each about 2 ct, by a Pakistanidealer who had knowledge of a very few cut stones up to~5 ct. News about the deposit became more widespread inPakistan by October-November of last year, when thespecimen in figure 10 was purchased from a dealer whohad also taken photographs of the mine; these revealed alarge pit made with bulldozers and other earth-movingequipment. According to this dealer, the price of roughmaterial at the mine had escalated considerably.
Examination of the three faceted emeralds (0.29–0.46ct; again, see figure 10) by one of us (EPQ) showed the fol-lowing properties: color—bluish green, with moderatedichroism in yellowish green and bluish green; diaphane-ity—transparent; R.I.—no=1.588–1.589 and ne=1.580–1.581; birefringence 0.007–0.008; S.G.—2.69–2.74;Chelsea filter reaction—weak red; and fluorescence—inertto both long- and short-wave UV radiation. Absorptionlines in the red end of the spectrum (due to chromium)
were visible with the desk-model spectroscope. Micro-scopic examination revealed “fingerprints,” fractures, two-and three-phase inclusions (some of which were jagged inappearance resembling those in Colombian emeralds), andfine growth lines parallel to the c-axis (observed perpendic-ular to the optic axis) that had an almost “Venetian blind”appearance. Testing with a thermal reaction tester causedsome of the fractures to “sweat,” and air bubbles in cer-tain fractures were seen to contract, indicating the pres-ence of a filling substance. One of the stones containedlow-relief crystals that were identified by Raman analysisas plagioclase.
EDXRF chemical analysis of all three samples by oneof us (SM) revealed the expected Al and Si as major compo-nents, and K, Sc, V, Cr, Fe, and Ga as trace elements. TheUV-Vis spectra showed typical emerald absorption fea-tures. Although Fe was detected by EDXRF, the absorptionspectra indicated that this element did not have a signifi-cant influence on their color, which was due to Cr.
Dudley BlauwetDudley Blauwet Gems
Louisville, Colorado
Elizabeth P. Quinn and Sam MuhlmeisterGIA Gem Laboratory, Carlsbad
Figure 10. These rough and cut emeralds are from anew deposit in western Xinjiang Province, China. Thecrystal is 1.3 cm long, and the faceted emeraldsweigh 0.29–0.46 ct. Courtesy of Dudley BlauwetGems; photo © Jeff Scovil.
Figure 9. This delicate chain (88.68 ct) was carvedfrom a single piece of chalcedony in China. The chainis 43 cm long, and the thickness of the chalcedony ineach link is approximately 2 mm. Courtesy of NewEra Gems; photo by Don Mengason.

58 GEM NEWS INTERNATIONAL GEMS & GEMOLOGY SPRING 2005
Gold-in-quartz from Mariposa County, California. At theClarion Hotel, Doug Wallace (Mineral Search Inc., Dallas,Texas) had specimens, art objects, cabochons, and finishedjewelry featuring gold-in-quartz from a historic lodedeposit in Mariposa County, central California (figure 11).The material was mined by his partner, Bill Forrest(Fresno, California), from the former Badger and No. 5mines, located near the town of Hornitos. In 2004, theypurchased the property—consisting of nine claims on 150acres—from Ed Coogan (Turlock, California), who hadused metal detectors to work the surface deposits inter-mittently since the late 1980s. According to Mr. Wallace,the Badger mine was first worked in the 1850s, when itreportedly produced $80,000 worth of gold from trenchesand shallow tunnels. During this time, the miners collect-ed only pieces showing visible gold on the surface. As aresult, reworking of the Badger dump material has yieldedabundant gold, through the use of metal detectors or bysimply breaking open pieces of quartz. Substantialamounts also were produced from the No. 5 mine, begin-ning in 1910. The original miners processed all of the veinmaterial they recovered for gold, so the tailings do not con-tain any high-grade ore. Nevertheless, there is a consider-able amount of loose vein material within soil downslopeof the No. 5 deposit. Both mines are located on a lode
known as the Prescott vein. This quartz vein system,which ranges up to nearly 10 m wide, forms prominenttraceable outcrops in the mining area.
According to Mr. Wallace, most of the material theyhave recovered comes from the Badger mine, and is there-fore marketed as Badger Gold. Mr. Forrest works the areausing a backhoe, to a depth of 6 m, by excavating portionsof the vein that were not mined by the historic operations.In addition, he has achieved considerable production fromthe dump material by digging down more than 50 cm,which is the detection limit of the metal detectors usedpreviously on the property. Mr. Wallace indicated that theyhave recovered an average of 25 pounds (12 kg) of gold-bear-ing quartz each month, starting in July 2004. The produc-tion is first soaked in oxalic acid to remove iron staining,and then classified as specimen-grade material or piecesthat are suitable for polishing. The specimens are character-ized by relatively large clots of gold that are mechanicallyexposed (rather than etching the quartz using hydrofluoricacid). The polish-grade material is formed into spheres,eggs, and cabochons (ranging up to 25 mm) that are mount-ed into fine jewelry (again, see figure 11).
In addition to this new production from MariposaCounty, other commercial sources of jewelry-quality gold-in-quartz also were available in Tucson. These includedmaterial from Australia that was sold through Kabana Inc.,Albuquerque, New Mexico (GJX show), and Gold NuggetExports Australia, Gold Square, Victoria (Arizona Mineral
Figure 11. Renewed mining of a historic lodedeposit in Mariposa County, California, is produc-ing gold-in-quartz for jewelry uses, as well as pol-ished art objects and specimens. The sphere mea-sures 3.8 cm in diameter. Courtesy of MineralSearch Inc.; photo © Jeff Scovil.
Figure 12. Iolite from the Santa Barbara mine, RioGrande do Norte, Brazil, is mined from shallow openpits and trenches. Courtesy of Paraíba Inc.

GEM NEWS INTERNATIONAL GEMS & GEMOLOGY SPRING 2005 59
& Fossil Show, InnSuites Hotel). The latter dealer also wasmarketing jewelry-quality rough material that was recov-ered from the highly productive Sixteen to One mine inSierra County, California, by Orocal Natural Gold(Oroville, California). Also of note in Tucson was a newmanufactured gold-in-quartz product (see report on p. 63).
BML
Iolite from northeastern Brazil. During the AGTA show,David Sherman (Paraíba Inc., Reno, Nevada) showed GNIeditor Brendan Laurs some newly mined iolite from RioGrande do Norte State. The stones were produced shortlybefore the 2005 Tucson gem show, from a locality nearParelhas that is now called the Santa Barbara mine (figure12). According to Mr. Sherman, the deposit was originallydiscovered about 15 years ago, when about 1,000 kg ofrough iolite of various grades was produced. The area waslater reworked for a brief period 4–5 years ago, yielding3–4 kg of material per month.
Mr. Sherman stated that the iolite forms in podswithin narrow quartz veins (figure 13). Since January2005, mining by his partner, Horst Munch (T.O.E.Mineraçao Ltda., Parelhas), has uncovered small iolitepods approximately every half meter from shallow openpits. A crew of 3–4 miners uses a portable compressorand pneumatic drill to make holes (about 2 m deep) thatare loaded with dynamite. After blasting, wheelbarrowsand hand tools are used to process the blasted materialand recover the iolite. Production has averaged about 10kg/month of rough that will cut clean stones up to 5 ct.Typically they are somewhat smaller (figure 14), becausemuch of the rough is fractured.
BML
Kyanite widely available. At the G&LW HolidayInn/Holidome show, numerous dealers were offeringkyanite beads. The beads ranged from transparent deepblue rondelles and briolettes to unpolished translucentblue and grayish green elongated blades. The majority ofthe strands consisted of polished semitransparent to
translucent beads, in various shapes and sizes, that werecolor-zoned in lighter and darker blues (figure 15). Thedealers reported that the kyanite originated from Brazil,Tanzania, or Sri Lanka.
Although not new, mineral specimens of kyanite fromBrazil were available in abundance through several dealersat the various satellite shows. Fine decorator pieces con-sisted of clusters of kyanite blades (with small amounts ofinterstitial matrix) that ranged up to about 20 cm long.Such specimens were seen at the Inn Suites and Clarionhotels, with Vasconcelos Ltda. and Geometa Ltda. (both ofGovernador Valadares, Minas Gerais, Brazil). According toCarlos Vasconcelos, the kyanite is mined from 3–4 smalldeposits in Minas Gerais; the largest kyanite blade seen byhim measured 50 cm long. The most common colors arebluish gray to blue to deep blue. Although some gem-qual-ity material is mined, it is quite difficult to cut.
Nevertheless, large quantities of faceted kyanite wereavailable from Nepal. At the AGTA show, Anil Dholakia(Anil B. Dholakia Inc., Franklin, North Carolina) hadapproximately 20,000 carats of moderate-to-dark blue
Figure 14. These iolites (0.98–1.60 ct) were cut fromrecent Santa Barbara mine material. Courtesy ofParaíba Inc.; photo by Maha Tannous.
Figure 13. The iolite is associated with quartz; thedark brown areas are the host rock adjacent to thequartz veins. Courtesy of Paraíba Inc.
Figure 15. This strand of color-zoned beads (eachapproximately 11.0 ¥ 7.5 mm) consists of polishedkyanite that is reportedly from Brazil. Photo byMaha Tannous.

60 GEM NEWS INTERNATIONAL GEMS & GEMOLOGY SPRING 2005
transparent Nepalese kyanite in calibrated sizes rangingfrom 6 ¥ 4 mm to 10 ¥ 8 mm. Some of the stones werealready mounted in bracelets and earrings. While transpar-ent kyanite from Nepal has been known for several years(see Spring 1999 Gem News, pp. 51–52 and Spring 2002Gem News International, pp. 96–97), the abundance ofattractive calibrated material is expected to make this little-known gemstone more popular in finished jewelry.
BML and Elizabeth P. Quinn
Albitic “moonstone” from the Morogoro region, Tanzania.Among the many interesting items seen at the 2005Tucson gem shows was some Tanzanian “moonstone”that showed relatively high clarity and strong blue adu-larescence. This material was first brought to our atten-tion in August 2004 by Hussain Rezayee (Pearl Gem Co.,Beverly Hills, California), who indicated that the miningarea is located near the town of Kilosa, about 80 km westof Morogoro in east-central Tanzania. The deposits havebeen known for almost 15 years, but until fairly recentlythey only produced low-grade material. Since mid-2003,further mining (by hand methods) has yielded some high-quality rough in relatively large sizes. He estimated that afew hundred kilograms have been produced, with about10% being cuttable.
Mr. Rezayee loaned six samples to GIA for examination,consisting of five cabochons and one cushion mixed cut,ranging from 5.44 to 19.88 ct (figure 16). Gemological testingof three stones by one of us (EPQ) yielded the following prop-erties: color—very light gray to very light yellow, with strongblue adularescence; diaphaneity—transparent to semitrans-parent; R.I.—1.530–1.540 from the faceted stone (birefrin-gence 0.010), and 1.54 spot readings on the two cabochonstested; S.G.—2.64; Chelsea filter reaction—none; fluores-
cence—inert to long-wave UV radiation and a weak red reac-tion to short-wave; and no absorption lines were visible withthe desk-model spectroscope. Microscopic examinationrevealed that all three samples contained numerous needlesand platelets as well as cleavage fractures. Polysynthetictwinning was visible between crossed polarizers when thesamples were viewed along their edge (i.e., perpendicular tothe direction that showed adularescence).
The term moonstone is most commonly used to des-ignate orthoclase feldspar that shows adularescence.However, the R.I., birefringence, and S.G. values of theTanzanian samples were significantly higher than thosereported for gem orthoclase (1.520–1.525, 0.005, and2.56–2.59, respectively; see R. Webster, Gems, 5th ed.,revised by P. G. Read, Butterworth-Heinemann, Oxford,England, 1994, p. 208). Rather, the Tanzanian feldsparhas properties that are consistent with albitic feldspar(see W. A. Deer et al., Rock-forming Minerals, Vol. 4A—Framework Silicates: Feldspars, 2nd ed., The GeologicalSociety, London, 2001, pp. 626–908). A comparison ofthe R.I. and S.G. values to the charts provided by Deer etal. also shows the Na-rich nature of the plagioclase. Thisagrees with the composition of the six samples that wasdetermined by one of us (SM) using EDXRF spectroscopy.One set of analytical parameters was used to detectmajor elements and light trace elements in all samples.In addition, one sample was run under two additionalconditions to detect heavier elements. All the samplescontained major amounts of Al, Si, and Na, and traces ofCa and K. In addition, Fe was detected in five of the sam-ples, and Sr and Ba were also detected in the one samplerun under multiple conditions.
Figure 17. The adularescence shown by this 1.83 ctpink doublet is created by a cap of transparentTanzanian “moonstone” that was affixed to a light-colored amethyst base. Courtesy of New Era Gems;photo by Maha Tannous.
Figure 16. These albitic “moonstones” from Tanzania(5.44 to 19.88 ct) display strong blue adularescence.
Courtesy of Pearl Gem Co.; photo by Maha Tannous.

GEM NEWS INTERNATIONAL GEMS & GEMOLOGY SPRING 2005 61
Albitic plagioclase with the appearance of moonstone ismost commonly known from Ontario and Quebec, Canada(Webster, 1994). This feldspar consists of albite-oligoclase(with an anorthite content of An1-An17, called peristerite)that have unmixed into submicroscopic lamellae. Whenthese lamellae are on the scale of the wavelength of visiblelight, an iridescent optical phenomenon is seen when thefeldspar is viewed in a direction that is perpendicular to thelamellar planes. Although this mechanism is probablyresponsible for the adularescence in the Tanzanian plagio-clase, further work would be necessary to confirm this.
Because the orientation is critical for displaying adu-larescence, and the rough is commonly fractured in thesame direction as the lamellae, large polished stones arerare. Nevertheless, according to Dimitris Mantheakis (RuvuGemstone Mining Ltd., Dar es Salaam, Tanzania), cutTanzanian “moonstones” can attain weights up to 300 ct.
The transparency shown by some of the Tanzanianmaterial may lend it to some rather unconventional uses, asillustrated by the doublet in figure 17, which was shown toone of us (BML) at the Arizona Pueblo Inn Gem & MineralShow by Steve Ulatowski of New Era Gems. The feldspartop was placed over a light-colored amethyst base to givethe appearance of a pink gem showing adularescence.
Elizabeth P. Quinn, Sam Muhlmeister, and BML
A faceted pezzottaite from Afghanistan. So far, gem-qualitypezzottaite is known from only one mine in Madagascar,which appears to be exhausted (B. M. Laurs et al.,(“Pezzottaite from Ambatovita, Madagascar: A new gemmineral,” Winter 2003 Gems & Gemology, pp. 284–301).In 2004, one of us (BML) received some samples that wererepresented as pezzottaite from Afghanistan, which is thesecond-known source of this rare mineral (see H. A. Hänniand M. S. Krzemnicki, “Caesium-rich morganite fromAfghanistan and Madagascar,” Journal of Gemmology, Vol.28, No. 7, 2003, pp. 417–429). The specific locality wasreported to Hänni and Krzemnicki as the Deva mine,Paroon Valley, in Nuristan, Afghanistan. The Afghan sam-ples were supplied by E. “Buzz” Gray (Missoula, Montana),Herb Obodda (H. Obodda, Short Hills, New Jersey), andHaleem Khan (Hindukush Malala Gems & Minerals,Peshawar, Pakistan). Since we did not know of any priorreports of faceted pezzottaite from Afghanistan, we weresurprised to see that one of the samples we received fromMr. Gray in May 2004 was a 1.11 ct cut stone (figure 18).
Mr. Gray obtained the gem rough in late 2002 from aPakistani dealer who represented them as being fromAfghanistan. He faceted five stones that ranged from 1 to 6ct; all were heavily included. Gemological properties wereobtained by one of us (EPQ) on the 1.11 ct octagonal modi-fied brilliant, which was subsequently donated to GIA byMr. Gray. The R.I, birefringence, and S.G. values areshown in table 1, and other properties were as follows:color—purple-pink (with no color zoning), showing moder-ate dichroism in pink-orange and pink-purple; diaphane-
ity—transparent to semitransparent; fluorescence—a veryweak violet to long-wave UV, and a weak banded white toshort-wave. With a desk-model spectroscope, the stoneshowed a band at 500 nm and a weaker band at 570 nm.Microscopic examination revealed a network of feathersand smaller internal fractures throughout the stone, givingit an almost “quench crackled” appearance; stringers ofparticles; and both angular and straight growth lines.Evidence of clarity enhancement was seen when the stonewas exposed to a thermal reaction tester.
Chemical analyses of this 1.11 ct stone by electronmicroprobe (seven spot analyses) confirmed its identity aspezzottaite, with 10.18 to 12.56 wt.% Cs2O (table 1). Thisis somewhat more cesium than was documented byHänni and Krzemnicki in the sample of Afghan pezzot-taite they analyzed (up to 10.05 wt.%); in addition, ouranalyses showed less Si and slightly more Al (again, seetable 1). Compared to pezzottaite from Madagascar(11.23–18.23 wt.% Cs2O, as reported by Laurs et al.), theCs content of the Afghan pezzottaite was typically lower.The Afghan samples also showed slightly more Na, andless Rb, than the Madagascar material.
The R.I. and birefringence of the 1.11 ct stone are veryclose to those reported for the Afghan pezzottaite studiedby Hänni and Krzemnicki (again, see table 1). However,the S.G. reported by those authors is significantly lowerthan the value we obtained. As documented by Hänni andKrzemnicki, the faceted Afghan pezzottaite we examinedhad a slightly lighter pink color, and significantly lowerR.I. and S.G. values, than pezzottaite from Madagascar.
Interestingly, electron-microprobe analysis of anotherAfghan pezzottaite sample (from Mr. Obodda) yielded abroad range of cesium contents. A traverse across a 27 ¥ 11mm slab that was cut from a crystal specimen yielded
Figure 18. This 1.11 ct pezzottaite is reportedly fromAfghanistan. GIA Collection no. 31418; photo byMaha Tannous.

62 GEM NEWS INTERNATIONAL GEMS & GEMOLOGY SPRING 2005
3.58–12.95 wt.% Cs2O. This indicates the presence of bothcesian beryl and pezzottaite in the same sample, anddemonstrates the need to perform advanced testing (ideal-ly quantitative chemical analysis and crystal structurerefinement to confirm rhombohedral structure) to confi-
dently identify pezzottaite in such material.BML and Elizabeth P. Quinn
William B. (Skip) Simmons and Alexander U. FalsterUniversity of New Orleans, Louisiana
TABLE 1. Physical and chemical properties of a 1.11 ct faceted pezzottaite from Afghanistan, as compared to published values for another Afghan pezzottaite andsamples from Madagascar.
Property Afghanistan Afghanistan Madagascar
Reference This study Hänni and Laurs et al. (2003)Krzemnicki (2003)
R.I.no 1.605 1.606 1.615–1.619ne 1.598 1.598 1.607–1.610
Birefringence 0.007 0.008 0.008–0.009S.G. 2.97 2.91 3.09–3.14
Chemical Lowest Cs Highest Cs Representative Average of 49 compositiona analysis of one analyses of 11
sample samplesOxide (wt.%)SiO2 56.75 56.51 61.32 56.77Al2O3 16.79 16.52 15.72 15.99Sc2O3 0.01 0.00 nd 0.03BeO (calc) 8.97 8.71 8.13 8.14MnO 0.03 0.08 0.02 0.11CaO nd nd 0.98 ndLi2O 1.76 1.88 1.35b 2.16c
Na2O 1.33 1.01 1.15 0.41K2O 0.06 0.07 0.03 0.11Rb2O 0.14 0.25 0.14 0.85Cs2O 10.18 12.56 9.70 13.55Total 96.04 97.61 98.54d 98.12
Ions per 18 oxygens, anhydrous basisSi 5.943 5.956 6.000 6.030Al 0.057 0.044 0.000 0.000Sum tet. 6.000 6.000 6.000 6.030
Be 2.258 2.204 1.190 2.077Li 0.741 0.796 0.532 0.923Sum Be+Li 2.999 3.000 1.722 3.000
Al 2.015 2.008 1.813 2.000Sc 0.001 0.000 nd 0.002Ca nd nd 0.103 ndMn 0.003 0.007 0.001 0.010Sum oct. 2.021 2.018 1.917 2.012
Na 0.270 0.206 0.218 0.085K 0.008 0.009 0.004 0.015Rb 0.010 0.017 0.009 0.058Cs 0.455 0.564 0.405 0.617Sum channel 0.743 0.796 0.636 0.775
a All analyses by electron microprobe, unless otherwise noted. The low analytical totals are likely due to waterbeing omitted from the analyses. For the Afghan pezzottaite analyzed for this study, Li was calculated to allow forcharge balance, by setting it equal to the sum of the alkalis in the channel sites (Na+K+Rb+Cs). Be was calculat-ed as 3-Li. The following elements were below the detection limit (shown in wt.%): MgO (0.01), TiO2 (0.002),FeO (0.02), CaO (0.07). In addition, the following were checked for (scanned), but not detected: Cr2O3 (0.03),Bi2O3 (0.03), V2O3 (0.03), PbO (0.01), ZnO (0.08), BaO (0.03), Cl (0.04), F (0.05). Abbreviation: nd = not detected.b Li was calculated.c Li was assumed, based on an ICP (inductively coupled plasma) analysis of another sample of Madagascarpezzottaite (see Laurs et al., 2003).d Includes 0.02 wt.% iron, reported as Fe2O3.

GEM NEWS INTERNATIONAL GEMS & GEMOLOGY SPRING 2005 63
Tanzanite marketing initiatives. TanzaniteOne (Johannes-burg, South Africa), the world’s largest producer of tanzan-ite, has instituted a De Beers–like sales and marketing sys-tem to create market stability, build demand, and addressconsumer confidence issues. At a February 3 news confer-ence in Tucson, Michael Nunn, CEO of TanzaniteOne,explained that the company would channel its rough salesthrough six primary sightholders. These firms wouldreceive six sights yearly, with a three-year guarantee ofsupply. The firms chosen as sightholders will have to meetseveral criteria, including a tanzanite-focused business,excellent distribution in primary consumer markets,financial strength, and a long-term marketing strategy.
According to Mr. Nunn, TanzaniteOne supplies justunder 50% of all tanzanite on the market. It acquired thetanzanite assets of AFGEM in December 2003, and plansto institutionalize AFGEM’s grading system for polishedstones. The system divides tanzanite into two color cate-gories: blue-violet and violet-blue, with grades rangingfrom pale to “vivid exceptional.” The clarity grades rangefrom internally flawless to heavily included. Mr. Nunnsaid that lack of a standard grading system has led to a sit-uation where there is a skewed price differentiationbetween highest and lowest qualities, with the upper endbeing underpriced by half, and the lower being consider-ably overpriced.
The company has also helped foster the TanzaniteFoundation, an organization that issues certificates of ori-gin, which provide assurance that all tanzanite mined andsold by participating companies is done so responsibly andethically. The foundation is also developing marketingprograms to support tanzanite sales in major consumermarkets. TanzaniteOne has contributed $3 million to thefoundation thus far. The sightholders, and other minersbelonging to the foundation, will contribute 10% of theirrevenues toward marketing; the goal is to raise $5–6 mil-lion a year. The foundation also intends to provide assis-tance to other operators through its Small MineAssistance Program, and channel development funds backto local communities near the mining area.
Russell Shor ([email protected])GIA, Carlsbad
SYNTHETICS AND SIMULANTSManufactured gold/silver-in-quartz. At the TucsonElectric Park Gem & Mineral show, James Taylor (EurekaGems LLC, Fountain Hills, Arizona) had some slabs andcabochons of quartz containing “veins” of gold or silverthat were manufactured by a new process in a partnershipwith Onnik Arakelian, Todd Allen, and Gnel Gevorkyan.Several varieties were available, using gold alloys in 14K or20K, as well as fine silver. According to Mr. Taylor, smokyquartz from Brazil is used to make “Grizzly Gold” and“Grizzly Silver,” whereas rock crystal from Arizona, ormilky quartz from Nova Scotia, is employed in the
“Glacier Gold” and “Silver Lightning” lines (figure 19).The materials is sold in slabs that are at least 2.5mm thick,and as finished cabochons. Opticon is used to stabilize thethin slabs and cabochons.
At the time of the Tucson show, 15 kg of each varietywas being produced each month. At press time, Mr. Tayloranticipated that the production would increase to 50kg/month by April-May 2005. The material is produced inMesa, Arizona, using a proprietary, patent-pending processdeveloped by Mr. Gevorkyan. He reported that the gold orsilver is mobilized into fractures within the host quartzunder heat and pressure; if necessary, the quartz is fracturedbefore the metal is introduced. Mr. Taylor also had some dis-play samples of Australian black jade containing gold thatwere manufactured by the same process. He expects thisproduct to become commercially available in time for the2006 Tucson gem shows. In addition to the gold and silveralloys mentioned above, he indicated that white gold and a platinum alloy (with silver) could be used in the process.
Figure 19. A new process is being used to introducegold and silver into smoky, milky, and colorlessquartz for jewelry use. The elongate piece on the bot-tom measures 52 ¥ 30 mm. Courtesy of Eureka GemsLLC; photo © Jeff Scovil.

64 GEM NEWS INTERNATIONAL GEMS & GEMOLOGY SPRING 2005
The manufactured products can usually be separatedfrom natural gold-in-quartz by the typical fracture-aligned or spiderweb-like texture of the gold, which isdistinct from the blebs and irregular pods of gold thatoccur in natural quartz (see GNI entry on p. 58). How-ever, Mr. Taylor indicated that some of the manufac-tured gold-in-quartz looks so natural that it cannot be
separated by visual means. In that case, chemical analy-sis of the metal alloy could be used to identify it. Distin-guishing the manufactured silver-in-quartz from naturalmaterial (which is quite rare in jewelry quality) isstraightforward, due to the distinctive texture and theuse of fine silver in this product.
BML
DIAMONDS 10.53 ct gem-quality diamond from Saskatchewan,Canada. Kensington Resources Ltd., of Victoria, BritishColumbia, reported that it recently recovered a 10.53 ctgem-quality diamond crystal (figure 20) from a core sam-ple of kimberlite at its Fort à la Corne Diamond Projectin central Saskatchewan (see B. A. Kjarsgaard and A. A.Levinson, “Diamonds in Canada,” Fall 2002 Gems &Gemology, pp. 208–238, for more information about dia-mond exploration in this area). The diamond was one ofseveral recovered from core samples drilled in 2004.These diamonds (which also included a 1.32 ct crystal)were sampled from a depth interval of 118–130 m. A140.34 tonne core sample from another drill hole yielded135 macrodiamonds (generally defined as larger than0.5–1.0 mm) weighing a total of 15.45 carats; the largestdiamond was 0.46 ct, and 16 others weighed more than0.25 ct. A 10.23 ct diamond was recovered from thisproperty in 2002.
The Fort à la Corne Diamond Project is a joint venturebetween Kensington, De Beers Canada Inc., CamecoCorp., and UEM Inc.
Russell Shor
INCLUSIONS IN GEMSSpiral in aquamarine. Dudley Blauwet of Dudley BlauwetGems in Louisville, Colorado, provided us with an inter-esting Pakistani aquamarine crystal from Nyet, BralduValley, Baltistan. As shown in figure 21, the transparent,singly terminated gem-quality crystal weighed 117.64 ctand measured 53.4 ¥ 19.3 ¥ 11.3 mm. The most intriguingfeature of this aquamarine was an eye-visible decorateddislocation pattern in the form of a centrally locatedgrowth spiral extending the entire length of the crystal.
With low magnification, when viewed through theside in any one of several different directions perpendicu-lar to the length, the spiral pattern looked very much likea feather or a partial fish skeleton (figure 22). The crystal’soverall clarity made a dramatic showcase for the intricategrowth spiral. This feature is actually a visual form ofgrowth disturbance propagated through the host crystalalong a screw dislocation that develops from a sourcesuch as a small solid inclusion or structural defect, oftenat or near the base of a crystal during the earliest stages ofgrowth. Growth spirals also have been observed in otherberyls, such as natural and synthetic emerald (seePhotoatlas of Inclusions in Gemstones, pp. 82 and 473).
John I. Koivula ([email protected])AGTA Gemological Testing CenterNew York and Carlsbad, California
Maha TannousGIA Gem Laboratory, Carlsbad
“Bamboo” moonstone. An 81.59 ct freeform orthoclasefeldspar from Mogok, Myanmar, was provided to these con-tributors for examination by Mark Smith of Thai LankaTrading Ltd., Bangkok, because of its obvious eye-visibleinclusions. The identification as orthoclase was confirmedthrough standard gemological testing. As shown in figure 23,this 38.2 ¥ 27.3 ¥ 12.3 mm polished feldspar not only showedadularescence, as would a moonstone, but also contained
Figure 20. This 10.53 ct diamond was recently recov-ered from a drill core at the Fort à la Corne DiamondProject in Saskatchewan, Canada. Courtesy ofKensington Resources.

GEM NEWS INTERNATIONAL GEMS & GEMOLOGY SPRING 2005 65
several etch tubes of varying thickness that appeared to beoriented along twin planes. The light brown color of thesetubes appeared to be due to an epigenetic filling material.
Some of these rough-edged, “dirt-filled” tubes were innear-parallel formation, and with low magnification theyresembled stalks of dried bamboo (figure 24). The “nodes”apparent on these “stalks” were created by intersectingcleavage cracks. Interestingly, the epigenetic fillings insome of the tubes fluoresced moderate yellow to long-wave UV radiation. This is the first moonstone with suchinclusions that we have seen.
John I. Koivula and Maha Tannous
Pezzottaite in quartz. Pezzottaite, a Cs,Li-rich member ofthe beryl group that is known from Madagascar andAfghanistan, has been described in detail in recent arti-cles (see, e.g., F. C. Hawthorne et al., “Pezzottaite,Cs(Be2Li)Al2Si6O18, a spectacular new beryl-group miner-al from the Sakavalana pegmatite, Fianarantsoa Province,
Figure 23. This 81.59 ct orthoclase feldspar (moon-stone) from Mogok, Myanmar, contains obvious etchtubes filled with a light brown material. Courtesy ofMark Smith; photo by Maha Tannous.
Figure 24. Where they are aligned in near-parallel for-mation, the etch tubes in the moonstone resemblestalks of dried bamboo. Photomicrograph by John I.Koivula; magnified 5¥.
Figure 21. Weighing 117.64 ct and measuring 53.4 mmlong, this aquamarine crystal from Pakistan hosts astriking eye-visible spiral dislocation pattern. Courtesyof Dudley Blauwet; photo by Maha Tannous.
Figure 22. When viewed through the side of the aqua-marine crystal, the spiral pattern is reminiscent of afeather or fish skeleton. Photomicrograph by John I.Koivula; magnified 10¥.

66 GEM NEWS INTERNATIONAL GEMS & GEMOLOGY SPRING 2005
Madagascar, Mineralogical Record, Vol. 35, No. 5, 2004,pp. 369–378, and references cited in the Afghanistan pez-zottaite entry on p. 61). Although these articles discusspegmatite minerals (e.g., quartz and tourmaline) found inassociation with pezzottaite, as well as inclusions withpezzottaite as the host, pezzottaite has not yet beenreported as an inclusion in another mineral.
During a visit to the Sakavalana pegmatite in July2003, Gems & Gemology editor Brendan Laurs acquiredseveral representative specimens from the deposit. Onesample was a broken piece of rock crystal that appearedto contain a pinkish inclusion. The quartz was given toLeon M. Agee of Agee Lapidary, Deer Park, Washington,who faceted a 4.39 ct cushion-shaped step cut (figure 25)that revealed an approximately 5.0-mm-long light pinksix-sided doubly terminated crystal that was thought tobe pezzottaite.
Microscopic examination showed that the inclusionwas color zoned down its length. Stronger pink was obvi-ous at both ends, and the pink zone tapered inward fromboth ends toward the center like an hourglass. The quartzhost had several cracks near and around the inclusion,and numerous tiny primary fluid inclusions also were pre-sent. Polarized light revealed the birefringent nature ofthe inclusion and the fact that it had a weak pleochroismfrom pink to orangy pink. The pink color was most obvi-ous down the inclusion’s length.
Raman analysis indicated that the inclusion was ofthe beryl group, and comparison with aquamarine, mor-ganite, red beryl, and pezzottaite standards confirmed thatthe Raman pattern obtained from this inclusion was thatof pezzottaite. To our knowledge, this is the first report ofpezzottaite as an inclusion in another mineral, in thisinstance rock crystal quartz.
John I. Koivula and Maha Tannous
TREATMENTSTreated-color topaz from Pakistan. Since late 2002, thiscontributor has been receiving periodic reports that treated-color orange topaz was being sold in the mineral market ofPeshawar, Pakistan. Most of this information has beensupplied by Farooq Hashmi of Intimate Gems, Jamaica,New York. Mr. Hashmi, who regularly visits the Peshawarmarket, reported that the starting material was pale-col-ored topaz from the Katlang area of Pakistan’s North WestFrontier Province (see E. Gübelin et al., “Pink topaz from
Figure 25. The 5.0-mm-long color-zoned pezzottaite inthis 4.39 ct rock crystal from the Sakavalana peg-matite in Madagascar is the first pezzottaite reportedas an inclusion. Photo by Maha Tannous.
Figure 26. The orange color of this topaz from theKatlang area of Pakistan is probably due to an irradi-ation process. Although the color of some of the treat-ed topaz is reportedly stable to sunlight, it fades onexposure to heat. The color of the 2.88 ct triangularbrilliant, which was originally the same as the crystal(2.5 cm tall), faded due to heat from the cuttingwheel. The stone was faceted for GIA’s examinationby Scott Fenstemacher of Grand Rapids, Michigan.Both samples are courtesy of Farooq Hashmi; photoby Maha Tannous.

GEM NEWS INTERNATIONAL GEMS & GEMOLOGY SPRING 2005 67
Pakistan,” Fall 1986 Gems & Gemology, pp. 140–151).Mines in this area are famous for producing fine pinktopaz, although near-colorless and pale-colored topaz ismuch more commonly recovered.
Mr. Hashmi reported that the topaz has been treatedboth as loose crystals and matrix specimens, possibly byan irradiation process. The color ranges from light to darkorange or pinkish orange. According to Syed IftikharHussain (Syed Trading Co., Peshawar), the treated topazfirst appeared in the local market in late 2001, sometimesavailable as relatively large, clean crystals. However, deal-ers soon discovered that the material commonly fadedafter a few days’ exposure to sunlight. Nevertheless, someof the treated-orange topaz appears to be stable to sunlight;samples obtained by Mr. Hashmi have retained their colorafter exposure to sunlight for over one month. The color issensitive to heat, however, as discovered when one of thesamples was cut on a diamond lap. As shown in figure 26,the stone faded appreciably during the cutting process.Clearly, when faceting such material, gem cuttersshould—as much as possible—avoid heating the stones(e.g., by using a water-cooled lap with oxide abrasives).
While information on the precise treatment processhas not been revealed, it is interesting to note that experi-ments by Gübelin et al. (1986) succeeded in creatingorange-brown topaz from pale-colored Katlang materialthrough heating and subsequent irradiation. They reportedthat the treated color was heat-sensitive, and speculatedthat it would also fade on exposure to sunlight. Accordingto K. Nassau (Gemstone Enhancement, 2nd ed.,Butterworth-Heinemann, Oxford, England, 1994, pp.187–193), the coloration of yellow-to-orange-to-browntopaz may be created through relatively low doses of radia-tion, which forms color centers that may or may not bestable to light. These coloration and stability characteris-tics are consistent with the orange coloration in the treat-ed-orange topaz from Pakistan. Unfortunately, the onlyway to determine the sensitivity of such material to lightis to perform a direct fade test.
BML
CONFERENCE REPORTSInternational Geological Congress. The 32nd IGC tookplace in Florence, Italy, August 20–28, 2004. Held everyfour years, this large earth science conference featured over300 scientific sessions, with more than 6,100 delegatesregistered from 141 countries. Presentations on gems weresubmitted to a special session on gem materials, but alsowere heard in a variety of other sessions. Conferenceabstracts can be searched on-line according to authorname or keyword at www.32igc.info/igc32/search. Thisreport highlights selected presentations that provided newinformation or innovative approaches to gem materials.
Diamonds were featured in presentations coveringtheir origin, characteristics, and exploration. Some of this
information was previously given at the 2003International Kimberlite Conference held in Canada (andreviewed in the Fall 2003 Gem News International sec-tion, pp. 245–248), and will not be repeated here. Dr. I.Swintitsky of Moscow State University, Russia, and col-leagues used geographic information system (GIS) comput-er technology to show that the world’s highly diamondif-erous areas coincide with regional lineaments (particularlyat lineament intersections). Mikhail Krutoyarskiy, a geo-logic consultant from Chicago, determined that diamon-diferous kimberlites and lamproites formed during onlyfive of the more than 15 epochs of alkaline magmatism inthe earth’s history, and that higher diamond reserves werecorrelated to younger epochs.
The coloration of brown and black diamonds was clas-sified into four categories each by Dr. E. Fritsch of theUniversity of Nantes, France, and colleagues. Brown dia-monds include those with brown graining and associatednear-infrared absorptions called the “amber center,” certain“H-rich” (see, e.g., figure 27) and CO2-rich diamonds, andextremely N-rich type Ib diamonds. Black diamonds mayconsist of polycrystalline material (carbonado) with a vari-ety of dark inclusions, or of monocrystalline material thatis colored by abundant inclusions (typically graphite), scat-tering, or other causes (e.g., very dark yellow to green col-oration).
Cathodoluminescence (CL) in conjunction with scan-ning electron microscopy was used by Dr. Monica
Figure 27. The 61 ct Tiger Eye is the largest document-ed hydrogen-rich diamond. It is faceted preciselyenough to stand on its culet. Photo by Franck Notari.

68 GEM NEWS INTERNATIONAL GEMS & GEMOLOGY SPRING 2005
Mendelssohn and coauthors from the University CollegeLondon to reveal growth features, platelets, plastic defor-mation, slip planes, and brecciation/regrowth textures ingem diamonds, which help characterize the natural mate-rial. Dr. Maxim Viktorov and colleagues from MoscowState University, Russia, documented a decrease in the redCL of irradiated synthetic diamonds as compared to thosethat were not treated.
Numerous presentations covered Russian diamonddeposits. Dr. Nikolay Gorev of the Yakutian GeologicalEnterprise of Exploration, Research & Development CNI-GRI, Alrosa Co. Ltd., Mirny, Sakha, Russia, showed thatkimberlites of the Yakutian diamond province are local-ized within structural channels (grabens) that range up to20–40 km long and 1–4 km wide. Dr. Nikolay Zintchoukand coauthors, also from the Yakutian GeologicalEnterprise, studied the morphology of diamonds fromYakutia. In general these diamonds were octahedral torhombic dodecahedral, although specific differences werefound in diamonds from various economically importantpipes. In a separate presentation, these authors reportedon the morphology of diamonds from placers in thisregion, which can be broadly divided into two ages: latePaleozoic (octahedral to rhombic dodecahedral) and UpperTriassic (dodecahedral, rounded, and cuboid). AndreyUkhanov of the Vernadsky Institute of Geochemistry andAnalytical Chemistry, Russian Academy of Sciences,Moscow, and colleagues found a wide range of carbon iso-tope values in diamonds from primary and alluvialdeposits in Yakutia. They were able to trace some alluvialdiamonds back to known kimberlite pipes, whereas oth-ers (with isotopically light signatures) could not be corre-lated to any known primary source. Dr. Zdislav Spetsiusand coauthor from the Institute of Diamond Industry,Alrosa Co. Ltd., Mirny, studied the mineral inclusions indiamonds from the Botoubinskaya pipe (Nakyn District),and determined that unlike diamonds from other pipes inYakutia, these showed mainly eclogitic paragenesis (e.g.,garnet, clinopyroxene, and pyrrhotite). Dr. Victor Garaninof Moscow State University and colleagues had severalpresentations on diamond indicator minerals fromRussian kimberlites. For example, they measured the per-ovskite fraction of the microcrystalline oxides in kimber-lite groundmass and correlated <5% perovskite with highdiamond grade, and 30% perovskite with low-grade tonon-diamondiferous pipes.
Margarita Dobrynina and colleagues of the EcologyInstitute of Northern Region, Russian Academy ofSciences, proposed that kimberlites of the Arkhangelskdiamond province in western Russia are localized in areaswhere fractures are concentrated in the basement rocks, asimaged by airborne magnetic surveys. Dr. Nikolai Golovinof the joint stock company “Archangelskgeoldobycha”and colleagues documented systematic differences in themorphology and spectroscopic characteristics of diamondsfrom the two main deposits of the Arkhangelsk diamond
province (M.V. Lomonosov and V. Grib mines). They alsofound that diamonds from this province generally containrelatively high amounts of structural hydrogen and lownitrogen (of low aggregation state) compared to other dia-monds worldwide, as revealed by infrared spectroscopy.
Dr. Tatiana Posukhova of Moscow State Universityand coauthors studied diamond morphology and associat-ed mineral assemblages from placer deposits in westernand central Africa (Bafit and Chikapa) and found no corre-lation with those from the Koidu kimberlite pipe in SierraLeone, which indicates that they come from a differentprimary source. Dr. Geraldo Sgarbi and coauthors from theFederal University of Minas Gerais (UFMG), Brazil, sug-gested that Quaternary diamond placers of western MinasGerais are derived from Upper Cretaceous conglomeratesof the Bauru Group. They proposed that the large dia-monds in these deposits may have come from kimberlitesthat were weathered into laterites in this area.
Colored stones were featured in a wide variety of pre-sentations, covering databases, analytical techniques, andgems from pegmatites or particular localities. Dr. IslamiaKovalenko and colleagues from the Russian ResearchInstitute for the Synthesis of Materials (VNIISIMS),Alexandrov, presented a comprehensive gem locality mapof Russia that included approximately 150 deposits, thelargest of which consist of amethyst, “chrysolite,” tourma-line, jadeite, lazurite, and nephrite. Dr. Jean-Pierre Milesiof Bureau de Recherches Géologiques et Minières (BRGM),Orleans, France, and coauthors developed an innovativemap using GIS that correlated gem localities of East Africaand Madagascar with the underlying geology; the depositswere classified according to their geologic origin (magmat-ic, metamorphic, metasomatic, hydrothermal, and vol-canic-related).
Dr. Don Marshall of Relion Industries, Bedford,Massachusetts, described a technique for the macropho-tography of cathodoluminescence of gem and mineralspecimens that uses a CL instrument mounted on a cus-tom stand, rather than a microscope, allowing for CL pho-tos of areas up to 4–5 cm in diameter. Dr. Olga Yakushinaof the All-Russian Research Institute of Geological,Geophysical, and Geochemical Systems, Moscow, used X-ray computed microtopography to nondestructively imagethe internal structure of pearls (natural and cultured) andcorals at room temperature. Gioacchino Tempesta andcolleagues from the Università degli Studi di Bari, Italy,demonstrated how faceted samples (up to 4 mm thick) ofsynthetic moissanite could be identified using X-ray topog-raphy, by imaging their distinctive structural defects.
Dr. Igor Peretyazhko of the Vinogradov Institute ofGeochemistry, Irkutsk, Russia, and colleagues proposedthat rare-element assemblages near gem-bearing pocketsin granitic pegmatites crystallized from melt-like gelsthat represent the transition between a silicate melt andan aqueous fluid. Dr. Antônio Carlos Pedrosa-Soares anda colleague from UFMG classified the geologic affiliation,

GEM NEWS INTERNATIONAL GEMS & GEMOLOGY SPRING 2005 69
age, and gem production of the famous Brazilian peg-matite districts of Conselheiro Pena (two-mica granites,585–565 My), São José da Safira and Araçuaí (two-micagranites, 530–500 My), and Padre Paraíso and Pedra Azul(biotite granite and charnockite, 520–500 My). Dr.Olugbenga Okunlola of the University of Ibadan, Nigeria,differentiated seven Precambrian granitic pegmatite beltsin Nigeria; the geochemically most-evolved pegmatites(according to Ta mineralization) are located in the Kabba-Isanlu, Lema-Share, and Kushaka–Birnin Gwari belts.This contributor and colleagues proposed that gem-quali-ty pezzottaite formed at the Sakavalana pegmatite inMadagascar via Cs remobilization by late-stagehydrothermal fluids.
Dr. Gaston Giuliani of the Centre de RecherchesPétrographiques et Géochimiques (CRPG), Nancy, France,and coauthors presented preliminary oxygen isotope dataon gem corundum from several world sources, whichshow potential for differentiating the geographic origin ofstones from some localities (e.g., rubies from Mogok vs.Mong Hsu, Myanmar). Dr. Daniel Ohnenstetter of CRPGand colleagues proposed that marble-hosted ruby depositsin central and southeast Asia formed during the uplift ofthe Himalayas from the metamorphism of impure carbon-ate rocks containing layers of organic and evaporitic mate-rial. Dr. Frederick (Lin) Sutherland of the AustralianMuseum, Sydney, and colleagues explored the geologic ori-gin of gem corundum from basalt-related deposits in east-ern Australia, southeast Asia, eastern China, and easternRussia, and found that they consist mainly of magmaticsapphires with subordinate metamorphic sapphire and/orruby suites and minor metasomatic sapphires. Dr. KhinZaw of the University of Tasmania, Australia, and coau-thors performed PIXE and Raman analyses of fluid andmelt inclusions in gem corundum from eastern Australia,and found that Tasmanian sapphires crystallized from amagmatic source, whereas Barrington corundums have ametamorphic signature with an igneous component.Andrea Cade of the University of British Columbia (UBC),Canada, and coauthors showed that the recently discov-ered sapphire deposits on Baffin Island, Nunavut, Canada,are hosted by the Lake Harbor marble unit and share simi-larities in their origin with marble-hosted sapphires fromcentral and southeast Asia.
Dr. Ricardo Castroviejo of the Polytechnic Universityof Madrid, Spain, and colleagues reported that emeralddeposits of the central Ural Mountains in Russia are host-ed by metasomatized ultramafic rocks, and the emeraldsformed under conditions of repeated tectonic activity at350–400°C and 1.5–2 kbar. Dr. Mohammad Arif and coau-thor from the University of Peshawar, Pakistan, indicatedthat emeralds of northwest Pakistan’s Swat Valley formeddue to carbonate alteration of previously serpentinizedultramafic rocks by CO2-bearing fluids released from themetamorphism of adjacent Indian-plate sedimentaryrocks. Heather Neufeld of UBC and colleagues suggested
that emerald crystallization at Regal Ridge in Canada’sYukon Territory may have been triggered by the destabi-lization of hydrothermal fluids as a result of mixing, albiti-zation (to release Ca), tourmaline crystallization, and/or achange in host-rock permeability. Ms. Neufeld also report-ed (in the absence of poster author Dr. Lee Groat of UBCand coauthors) that pale green beryl at the Lened Propertyin the Northwest Territories, Canada, contains up to 0.5wt.% V2O3 and 0.04 wt.% Cr2O3, and formed at250–550°C and <3.7 kbar. The composition of these greenvanadian beryls is similar to those from Gandao, Pakistan.
Dr. Peter Ermolov of the Academy of Sciences ofKazakhstan in Karaganda reported that jadeite-omphaciteof the Itmurundy mélange in central Kazakhstan formedvia a metasomatic interaction between the host serpenti-nite and its tectonic inclusions. He Mingyue of the ChinaUniversity of Geosciences, Beijing, indicated that “Hetianjade” (nephrite) from the western Kunlun Mountains ofXinjiang Province consists mainly of tremolite thatformed in two stages by the metasomatic replacement ofmarble. Dr. Douglas Nichol of Newtra GeotechnicalGroup, Wrexham, United Kingdom, reported that themain nephrite jade deposits in Europe are located inPoland, Switzerland, and Italy, while smaller deposits arefound in Finland, Germany, and Scotland.
Bertha Oliva Aguilar-Reyes of the University of Nantes,France, and colleagues studied the “crazing” of fire opalfrom Mexico and other localities, and proved that thewhitening of these opals is due to water loss. Comparisonsbetween whitened and uncrazed areas generally revealedabout 10% water loss (although from 6% to 95% water losswas documented in one sample). Dr. Xiaoyan Yu and coau-thors from the China University of Geosciences, Beijing,studied play-of-color opal by transmission electronmicroscopy and determined that there are two types ofwater present: molecular water (H2O) attached to the sur-face of silica spheres, and minor amounts of hydroxyl (OH)found between the silica spheres.
Dr. Corina Ionescu and colleagues from Babes-BolyaiUniversity, Cluj-Napoca, Romania, distinguished threecompositional groups of Cenozoic fossil resins from fivespecimens: 1—Romanian amber, 2—Polish (Baltic),Dominican, and German (Bitterfeld) amber, and 3—“krantzite” (a soft amber-like resin) from Königsaue,Germany.
Dr. Margherita Superchi of CISGEM, Milan Chamberof Commerce, Italy, and colleagues documented the prop-erties of faceted musgravite and taaffeite (now each classi-fied by the International Mineralogical Association aspolytypes of magnesiotaaffeite), and documented inclu-sions consisting of quartz, apatite, calcite, augite, andscapolite. Valentin Prokopets of Kiev Geological College,Ukraine, described the Kukhilal spinel deposit of thesouthwestern Pamir Mountains in Tajikistan, where thespinel is associated with forsterite in magnesite marbles.
BML

70 GEM NEWS INTERNATIONAL GEMS & GEMOLOGY SPRING 2005
World Diamond Conference, Perth, Australia. Approx-imately 180 people attended this event, which was heldin conjunction with the Australian Diamond Conferenceon November 22–23, 2004. The format consisted of 28presentations and a concluding panel session. There werefive presenters from outside the country. James Picton,diamond analyst of W. H. Ireland, London, emphasized (ashe did at the 2003 Australian Diamond Conference) thatby 2012 there will be a US$3–3.5 billion shortfall in thesupply of rough, and thus the price will rise. This hasgreatly encouraged both major and junior diamond explo-ration companies to increase their exploration efforts, andhas added to the general feeling of optimism in the dia-mond exploration industry. Dr. Craig Smith of De BeersGeoscience Centre, Johannesburg, South Africa, empha-sized the importance of “good science” (i.e., geology, vol-canology, and lithology) in the study of kimberlites andtheir diamond potential. De Beers’s diamond laboratoriesin Johannesburg and Kimberley are available to assistjoint-venture partners with improving target selectionand diamond recovery. Norman Lock of RSG Global,Johannesburg, discussed the difficulty of applying stan-dard guidelines to the calculation of reserves for alluvialdiamond deposits. These deposits are notoriously incon-sistent in their extent, thickness of gravel, and diamondcontent, so a bankable feasibility study based on such cal-culations is not realistic. Therefore, either the rules foralluvial deposits must be changed or capital can only beraised from private subscribers, not from a bank or byprospectus from the money market. Carl Pearson, dia-mond industry observer, London, said that synthetic dia-monds will have little effect on the retail diamond mar-ket, as bridal jewelry must contain natural diamonds;however, custom and fashion jewelry may be affected abit more. David Duval, of Duval Mincom, Vancouver,gave an overview of the current diamond explorationscene in Canada and remarked that it is much easier forCanadian companies to raise venture capital than it is forAustralian ones.
Most of the conference speakers were locally based andreported on the results of their respective companies. MilesKennedy of Kimberley Diamond Co., Perth, presented thelatest news from their mine at Ellendale. Last year’s pro-duction included about 60,000 carats of good-quality yel-low diamonds worth US$200-250/ct. Use of the large-diam-eter Bauer drill has given much better results in outliningreliable reserves than the smaller drills used previously.Reserves have increased up to 60 million carats from theoriginal 9 million; the overall grade is 6 carats/100 tonnes(cpht). Mr. Kennedy claimed the company can break evenwith open-pit mining down to 3 cpht. Kimberley has paidoff its Aus$23.5 million debt to Rio Tinto and is confidentof having a profitable 10-year mine life.
Dr. Kevin Wills of Flinders Diamonds, Norwood, SouthAustralia, announced the discovery of three kimberlitesnext to the Barossa Valley (famous for its viniculture) in
South Australia. However, so far they are not diamondifer-ous. Charles Mostert of Crown Diamonds, Perth, discussedthe incorporation of four separate South African fissuremines (Star, Messina, Helam, and DanCarl) into one com-pany. These old mines, which date from the late 1930s(Helam and Star) to late 1950s (Messina and DanCarl)explore kimberlite dikes down to 500–700 m. Collectively,they are expected to produce up to 200,000 carats annuallyas of 2006. Don Best of Elkedra Diamonds, Perth, reviewedthis company’s entry into the Brazilian alluvial diamondmining scene with the takeover of the Chapada deposit inMato Grosso State. The previous Chapada Diamonds com-pany failed twice to raise sufficient capital on the AIM mar-ket (of the London Stock Exchange), but Elkedra succeededin raising Aus$12 million in September 2004. The value ofthe alluvial diamonds at Chapada is very high, at morethan US$400/ct.
Mike Woodborne of the newly floated companyBonaparte Diamonds, Perth, maintained that there is achance of a viable deposit offshore in the Bonaparte Gulfalong the north coast of Western Australia, despite previ-ous failed attempts in the 1980s and early 1990s. TomReddicliffe of Striker Resources said that this companyonly recently gained access to the dormant Merlin mine,after more than a year of legal wrangling with Rio Tinto.Striker believes that the small kimberlite pipes on theproperty join up at shallow depth, and that this increasedvolume of ore may form a viable deposit. Drilling is under-way to prove this theory. In addition, since no crusher wasused in previous mining operations, the grade may behigher than first thought due to the presence of diamondsin oversized “waste.”
For this contributor, the most significant talk was byCarl Simich of Namakwa Diamonds, Perth, who told thegathering that despite new South African regulations andthe requirement of 51% equity being held by BlackEconomic Empowerment groups, they managed to acquireall the necessary permits and have started mining incoastal Namaqualand. This shows that a new diamondmining project proposed by a foreign company on propertywith state-owned mineral rights and in an environmental-ly sensitive area can actually get off the ground. This giveshope to many new ventures promoted by diamond juniorsfrom Australia and Canada. Dr. Neil Allen of Ka Pty. Ltd.,Melbourne, showed a new magnetic separator, theRotomag, which uses the property that some minerals arenot only magnetic but are also rotated in a magnetic field.Combining these two properties, the new machine pro-vides a better recovery of the kimberlite indicator mineralsilmenite, chromite, and pyrope. Other speakers gaveupdates on their projects, but no significant new discover-ies or developments were announced. Overall the moodwas guardedly optimistic.
A. J. A. “Bram” Janse ([email protected])Archon Exploration Pty. Ltd.
Perth, Western Australia

GEM NEWS INTERNATIONAL GEMS & GEMOLOGY SPRING 2005 71
MISCELLANEOUSBurmese faceted rubies and the U.S. import ban. A recentruling by the U.S. Customs Service has held that rubyrough from Myanmar (Burma) that has been faceted inother countries does not come under the import ban ofthe Burmese Freedom and Democracy Act of 2003 (seeU.S. Customs Ruling HQ 563127, Dec. 15, 2004;http://rulings.customs.gov/detail.asp?ru=563127).
Under long-standing U.S. law defining “country of ori-gin” for customs regulations, the origin of a manufacturedproduct differs from the origin of its raw materials if thematerials have undergone a “substantial transformation”in another country (see Code of Federal Regulations title19, section 134.1[b]). A material has undergone a substan-tial transformation if processing and/or other modificationshave created a different product having a distinctive charac-ter or use. For example, the Customs Service has historical-ly defined a polished diamond’s country of origin as thelocation where the polishing took place, not the countrywhere the diamond was mined (see, e.g., U.S. CustomsRuling J80098, Jan. 15, 2003; http://rulings.customs.gov/detail.asp?ru=J80098).
In a petition by Tiffany & Co. (New York) late last year,the Customs Service was asked to determine if the heattreating, pre-forming, faceting, and polishing that rubyrough undergoes is sufficient to qualify as a substantialtransformation. The ruling held that, indeed, as a result ofthese manufacturing processes carried out in other coun-tries, “[t]he finished stones are no longer considered prod-ucts of Burma.” Thus, they are not prohibited from importunder the Burmese Freedom and Democracy Act.
The ruling was specifically limited to faceted rubies andexcluded cabochon or other stones with no facets. However,in light of this and an earlier ruling that reached the sameconclusion (see U.S. Customs Ruling K85866, May 14,2004; http://rulings.customs.gov/detail.asp?ru=k85866), itseems likely that the Customs Service could rule that othergem materials from Myanmar that are polished elsewherealso fall outside the import ban.
Tiffany & Co. has recently stated, however, that it willnot import any gems of Burmese origin, despite this ruling.
Thomas W. Overton
ANNOUNCEMENTSGem-A field trip to Brazil. The Gemmological Associationof Great Britain is planning a tour of Minas Gerais State,Brazil, August 15–29, 2005. The trip will include visits tocutting centers and gem mines. E-mail [email protected] orvisit www.gem-a.info/membership/fieldTrips.htm.
ExhibitsNative American jewelry at AMNH. “From Totems toTurquoise: Native North America Jewelry Arts of theNorthwest and Southwest,” an exhibition of more than
500 pieces of contemporary and historic NativeAmerican jewelry, is being held at the AmericanMuseum of Natural History in New York City until July10, 2005. Visit www.amnh.org/exhibitions/totems or call(212) 769-5100.
Pearls at the Milwaukee Public Museum. “Pearls: ANatural History,” a traveling exhibition tracing the natu-ral and cultural history of pearls that was organized by theAmerican Museum of Natural History (New York) in col-laboration with the Field Museum (Chicago), will be ondisplay at the Milwaukee Public Museum, Milwaukee,Wisconsin, until June 26, 2005. The many exhibits includepearl formation and culturing, as well as historical pearljewelry that once belonged to Great Britain’s QueenVictoria and Marie Antoinette of France. Visitwww.mpm.edu/Pearls/Pearlsmain2.htm.
Gems at the Hungarian Natural History Museum.“Wondrous Gemstones,” an exhibition of gems from theSpanish Programa Royal Collections, will be on display atthe Hungarian Natural History Museum in Budapest untilJuly 3, 2005. The collection includes notable pieces such asa 1,490 ct rutilated kunzite from Minas Gerais, Brazil, anda 455 ct heart-shaped emerald, in addition to over 150,000carats of other gems. Visit www.dragako.nhmus.hu.
Cameos at the Met. “Cameo Appearances,” a display ofmore than 160 examples of the art of gem carving fromGreco-Roman antiquity to the 19th century, will be ondisplay until October 30, 2005, at the MetropolitanMuseum of Art in New York City. Among the pieces fea-tured will be works by the neoclassical Italian mastersBenedetto Pistrucci, Giuseppe Girometti (figure 28), andLuigi Saulini. A variety of educational programs will beoffered in conjunction with the exhibition. Also on displayat the Met (through January 2006) is “The Bishop Jades,” aselection of fine Chinese and Mughal Indian jades fromthe collection of Heber R. Bishop that was donated to themuseum in 1902. Visit www.metmuseum.org or call (212)535-7710.
ConferencesGemmoBasel 2005. The first open gemological confer-ence in Switzerland will be presented by the SSEF SwissGemmological Institute at the University of Basel, April29–May 2. Among the events scheduled is a field trip toa Swiss manufacturer of synthetic corundum and cubiczirconia. Visit www.gemmobasel2005.org or [email protected].
Kimberlites at UBC. A two-day introductory course onCanadian kimberlite geology will be presented by theMineral Deposit Research Unit of the University of BritishColumbia in Vancouver, May 5–6, 2005. Both classroom

72 GEM NEWS INTERNATIONAL GEMS & GEMOLOGY SPRING 2005
lectures and laboratory practical work are included. Visitwww.mdru.ubc.ca/home/courses/sc42.phpall, [email protected], or call 604-822-6136.
ICNDST-10 in Japan. The 10th International Conferenceof New Diamond Science and Technology will be held atthe National Institute of Advanced Industrial Science andTechnology Conference Hall in Tsukuba, Japan, May11–14, 2005. Among the topics covered will be HPHT syn-thesis and processing and the growth of CVD syntheticdiamond. Visit www2.convention.co.jp/ICNDST-10 or e-mail [email protected].
Diamonds at GAC-MAC. The 2005 joint meeting of theGeological Association of Canada and the MineralogicalAssociation of Canada will take place May 15–18, 2005, inHalifax, Nova Scotia. “From Cratons to Carats: ASymposium to Honour the Career of Herwart Helmstaedt”will feature presentations on geotectonic controls on dia-mond exploration. Visit www.halifax2005.ca or [email protected].
Bead Expo in Miami. The 2005 International Bead Expowill be held in Miami, Florida, May 18–22. Over 60 work-shops and educational lectures on bead jewelry design andmanufacture are scheduled. Visit www.beadexpo.com or e-mail [email protected].
Goldschmidt geochemistry conference. The 15thAnnual Goldschmidt Conference will take place May
20–25, 2005, in Moscow, Idaho. The meeting willinclude a session on the geochemistry of gem deposits,as well as numerous presentations on advanced analyti-cal techniques. E-mail [email protected] or visitwww.uidaho.edu/gold2005.
Elba 2005. Crystallization processes in granitic pegmatiteswill be addressed at the Elba 2005 International Meeting,May 23–29, 2005, on the island of Elba, Italy. Both educa-tional seminars and field trips to local granitic pegmatitesare planned. Visit www.elba-pegmatites.org.
Corundum treatment seminar. A seminar on corundumtreatments will be presented by Ted Themelis at theItalian Gemmological College on May 29, 2005, in Milan,Italy. The subjects will include heat treatment (with andwithout beryllium) of rubies and sapphires; lead-glass-filled rubies; and new heat-treatment processes for starrubies. A presentation on gems from Mogok, Myanmar,also will be given. Visit www.themelis.com.
JCK Show–Las Vegas. Held at the Sands Expo andConvention Center and the Venetian Hotel on June2–7, 2005, this gem and jewelry trade show will alsohost a comprehensive educational program beginningJune 2. Scheduled seminars will cover industry trends,diamond sales and marketing strategies, legal issues forretailers and manufacturers, and developments ingemology. The AGTA will also be offering seminarsfocusing on color and fashion on June 2 at the AGTAPavilion. To register, call 800-257-3626 or 203-840-5684, or visit http://jckvegas2005.expoplanner.com.
Maine Pegmatite Workshop. The Fourth Annual MainePegmatite Workshop will take place June 4–10, 2005, inPoland, Maine. This one-week seminar will focus on themineralization and origin of granitic pegmatites of theworld, and will include daily field trips to numerous quar-ries in Maine. Also featured will be a one-day field trip tothe famous Palermo pegmatite in North Groton, NewHampshire and visits to several gem and mineral displaysin Maine. E-mail Raymond Sprague at [email protected] visit http://homepage.mac.com/rasprague/PegShop.
Gem inclusions at ECROFI. The 18th Biennial Meeting ofEuropean Current Research on Fluid Inclusions will takeplace July 6–9, 2005, in Siena, Italy. The event willinclude a two-day short course on fluid inclusions ingems. Visit www.unisi.it/eventi/ECROFIXVIII or [email protected].
Jewelry Camp 2005. The 26th Annual Antique & PeriodJewelry and Gemstone Conference will be held July15-20, 2005, at Hofstra University, Hempstead, NewYork. The program emphasizes hands-on jewelry exami-nation techniques, methods of construction, understand-
Figure 28. This cameo brooch, Priam SupplicatingAchilles for the Body of Hector, was carved from sard-onyx by Italian master Giuseppe Girometti (1779–1851)in the early 19th century. Courtesy of the MetropolitanMuseum of Art, The Milton Weil Collection, 1940.

GEM NEWS INTERNATIONAL GEMS & GEMOLOGY SPRING 2005 73
ing materials used throughout history, and the constantlychanging marketplace. Visit www.jewelrycamp.org, call212-535-2479, or e-mail [email protected].
AAffgghhaanniissttaann GGeemm TToouurr.. Gary Bowersox will be leadinganother tour of Afghan gem mining areas during the sec-ond half of August 2005. Visits to the mines for Jegdalekrubies and Panjshir emeralds are planned, in addition to atour of Kabul and meetings with local dignitaries. Visitwww.gems-afghan.com/guidetours.htm or [email protected].
RRaammaann SSppeeccttrroossccooppyy iinn AArrtt aanndd AArrcchheeoollooggyy.. The 3rdInternational Conference on the Application of RamanSpectroscopy in Art and Archaeology will be held August31-September 3, 2005, in Paris, France. Among theplanned topics are development of Raman instrumenta-tion for the nondestructive analysis of art, approaches in
dealing with Raman imaging, and the investigation ofgemstones. Visit www.ladir.cnrs.fr/ArtRaman2005 ore-mail [email protected].
DDiiaammoonndd 22000055.. Scientific and technological aspects ofnatural and synthetic diamond (as well as related materi-als) will be discussed at the 16th European Conference onDiamond, Diamond-like Materials, Carbon Nanotubes &Nitrides, September 11-16, 2005, in Toulouse, France.Visit www.diamond-conference.com
AAggaattee ssyymmppoossiiuumm aatt CCSSMM.. On September 10-11, 2005, asymposium on agate and cryptocrystalline quartz will takeplace at the Colorado School of Mines in Golden,Colorado, in connection with the Denver Gem andM<ineral Show on September 16-18. Field trips to Coloradomineral localities are planned for September 12-13. Call303-202-4766 or e-mail [email protected].

74 GEMS & GEMOLOGY CHALLENGE GEMS & GEMOLOGY SPRING 2005
he following 25 questions are based on information from the four 2004 issues of Gems & Gemology. Refer to thefeature articles and “Notes and New Techniques” in those issues to find the ssiinnggllee bbeesstt aannsswweerr for each question;then mark your choice on the response card provided in this issue. (Sorry, no photocopies or facsimiles will beaccepted; contact the Subscriptions Department—[email protected]—if you wish to purchase additional copies of thisissue.) Mail the card so that we receive it no later than Monday, August 1, 2005. Please include your name andaddress. All entries will be acknowledged with a letter and an answer key aafftteerr tthhee dduuee ddaattee..
Score 75% or better, and you will receive a GIA Continuing Education Certificate. If you are a member of the GIAAlumni Association, you will earn 10 Carat Points toward GIA’s Alumni Circle of Achievement. (Be sure to includeyour GIA Alumni membership number on your answer card and submit your Carat card for credit.) Earn a perfectscore, and your name also will be listed in the Fall 2005 issue of Gems & Gemology. Good luck!
1. The FTC Guides for the jewelryindustry require disclosure of
A. any treatment to a gem material.
B. any treatment to a gem materi-al that substantially affects its value.
C. only those treatments that are impermanent or create specialcare requirements.
D. only those treatments that are not generally accepted in the trade.
2. The cultured pearls produced byPerlas del Mar de Cortez in Mexicoare grown in _____ oysters.
A. Pinctada margaritiferaB. Pinctada mazatlanicaC. Pinctada maximaD. Pteria sterna
3. The seven major components thatyield an overall cut grade in the GIAdiamond cut grading system are:brightness, fire, scintillation, weightratio, _____, polish, and symmetry.
A. crown angleB. durabilityC. optical symmetryD. sparkle
4. Since 1994, extraordinary amountsof fine, large gem peridot havebeen discovered in the SapatValley of
A. Pakistan.B. Vietnam.C. Tanzania.D. Myanmar.
5. The practical use of X-ray topo-graphs to fingerprint diamondshas historically been limitedbecause
A. faceted diamonds cannot be diffracted by this technique.
B. high-clarity diamonds with few inclusions do not create usable topographs.
C. too much exposure to X-rays can damage a diamond.
D. many individual topographs are necessary to characterize a single diamond.
6. The presence of the 3543 cm-1 infra-red absorption band in amethyst is
A. proof of synthetic origin.B. proof of natural origin.C. indicative of possible synthetic
origin.D. meaningless.
7. One disadvantage of laser-inducedbreakdown spectroscopy (LIBS) indetecting Be-diffused sapphire is that it
A. is not affordable for mostcommercial gemological laboratories.
B. is slightly destructive.C. cannot detect beryllium in
very low concentrations.D. requires elaborate prepara-
tion of the sample.
8. Which of the following is not a com-mon identifying characteristic ofHPHT-grown synthetic diamonds?
A. Metallic inclusionsB. Color zoningC. Diamond typeD. Cuboctahedral crystal shape
9. Colorless as-grown (high-purity)CVD synthetic diamonds have beencreated by
A. the addition of nitrogen to the growth chamber.
B. the removal of all impurities other than hydrogen from the growth chamber.
C. the addition of diborane to the growth chamber.
D. different temperature and
T

GEMS & GEMOLOGY CHALLENGE GEMS & GEMOLOGY SPRING 2005 75
pressure conditions than for colored CVD synthetics.
10.A small percentage of amethyst fromthe Four Peaks mine displays redovertones and/or a deep reddishpurple bodycolor that is known inthe trade as _____ quality.
A. “Siberian”B. “Brazilian”C. “Arizonan”D. “Bolivian”
11. A customer shopping for an emerald ring says he only wants a natural, untreated emerald. The sales associate replies that her store sells only natural stones. The owner—who knows the associate misunderstood the request—overhears this, but is in the middle of another transaction and does not intervene before the customer buys a resin-filled emerald.The owner
A. is guilty of fraud.B. has engaged in a deceptive
trade practice under the FTC Guides for the jewelry industry.
C. both A and B D. is not liable for his employee's
good-faith mistake.
12. Almost all the faceted synthetic dia-monds from Chatham Created Gemsthat were examined by GIA scientistsshowed _____, which is a strongindication of synthetic origin.
A. a photoluminescence (PL) feature at 589 nm
B. eye-visible metallic inclusionsC. an infrared (IR) absorption
line at 1344 cm-1
D. distinctive color zoning related to growth sectors
13. When laser-induced breakdown spec-troscopy (LIBS) is used to analyze afaceted stone, the best part to test is its
A. crown.B. pavilion.C. girdle.D. table.
14. ______ of brown nitrogen-doped CVDsynthetic diamonds can produce col-orless or near-colorless material.
A. HPHT annealingB. Fracture filling
C. IrradiationD. No known treatment
15. For observation of overall diamond cutappearance, the GIA “common view-ing environment” combines daylight-equivalent _____ lamps with spot light-ing from light-emitting diodes (LEDs).
A. halogen B. incandescentC. metal halideD. fluorescent
16. Pearl farming has been conducted inthe Gulf of California, Mexico, sincethe early 1900s, although it is onlysince _____ that full-round dark cul-tured pearls from this area havebecome commercially available.
A. 1936B. 1966C. 1996D. 2000
17. The 3543 cm-1 infrared absorptionband is present in the majority ofsynthetic amethyst seen in the jewelrytrade because
A. the vast majority of synthetic amethyst is grown on seed crystals cut parallel to the zcrystallographic sector.
B. the vast majority of synthetic amethyst is grown on seed crystals cut parallel to the rcrystallographic sector.
C. synthetic amethyst cannot be grown on seeds cut parallel to r crystallographic sectors.
D. it is induced by post-growth irradiation treatment.
18. To provide the best protection, a well-crafted disclosure policy should
A. be in writing.B. be part of any employee
training program.C. be carefully reviewed for
legal compliance well before any problems arise.
D. all of the above
19. GIA's research into diamond propor-tions has established that top-gradediamond cuts can have crown anglesranging from approximately 32.0° to
A. 36.0°.B. 37.0°.C. 38.0°.D. 39.0°.
20. The process of grinding a piece of rough into the approximate shape of the finished colored stone is known as
A. cobbing.B. preforming.C. girdling.D. bruting.
21. The pink synthetic diamonds fromChatham Created Gems do not dis-play the _____ that is common in nat-ural pink diamonds.
A. magnetismB. purplish color componentC. 637 nm line in their visible
absorption spectraD. strong strain visible in cross-
polarized light
22. The dense accumulations of ___inclusions in some Four Peaks amethyst prove that it is natural.
A.. rutileB. apatiteC. hematiteD. flurite
23. A square or _____-shaped fluores-cence pattern is commonly seen inHPHT snthetic diamonds.
A. triangleB. crossC. rodD. crescent
24. X-ray topography can “fingerprint” afaceted diamond by imaging
A. structural characterisitics suchas crystal lattice defects.B. patterns created by lumines-cence to X-rays.C. trace-element concentrationssuch as nitorgen and boron.D. isotopic ratios of inclusions.
25. High-purity CVD synthetic diamondshave few identification features otherthan_____in the De BeersDiamondView.
A. an orange to orangy red reac-tion with striations
B. a green to blue-green reactionwith striations
C. the absence of mosaic or slip-related patterns of blue dislo-cation luminescence
D. a blue-green reaction withfeatures relating to surfacemorphology

76 BOOK REVIEWS GEMS & GEMOLOGY SPRING 2005
Understanding Jewellery, 3rd EditionBy David Bennett and DanielaMascetti, 426 pp., illus., publ. byAntique Collector’s Club, Wood-bridge, England, 2003. US$89.50*
True to its name, UnderstandingJewellery provides the reader with astrong grasp of jewelry history inEurope and the United States from thelate 18th century to the present day.This excellent reference text showshow social and economic factors influ-enced the way jewelry was designedand worn through the decades fromthe French Revolution to the start ofthe new millennium. Instantly popu-lar at the time of its first publicationin 1989, Understanding Jewellery hasbeen reprinted twice and undergonetwo revisions. The first revision, in1994, added a chapter on jewelry from1960 to 1980; the current revisionbrings the text up to the present daywith a chapter on 1980–2000.
The authors have unique qualifi-cations that give them the authorityto write about jewelry history inEurope. With 32 years at Sotheby’s forDavid Bennett and 24 years forDaniela Mascetti, they have a loftyvantage point from which to observetrends in the evolution of jewelrydesign. During their tenure, they havebeen in a prime position to seesuperlative examples from every era,giving them real insight into the sub-tleties of the subject.
Unlike most books on jewelry his-tory, Understanding Jewellery openswith a section on gemology that pro-vides descriptions of the various gemsencountered in jewelry, some simple
tests that will aid in their identifica-tion, and the basics of instrumenta-tion. This section includes appendiceson the refraction of light and therefractometer, the Mohs hardnessscale, pastes (glass imitations) andcomposite stones, and (new to this edi-tion) gemstone enhancement. The lastsummarizes the types of treatmentsthat might be encountered in dia-mond, corundum, and emerald, andsuggests that when in doubt, the gemin question should be submitted to anindependent laboratory for analysis.
The remainder of the book consistsof 10 chapters, each of which covers anapproximately 20-year segment (exceptChapter 1, which also includes the late18th century). Each chapter beginswith an historical overview thatdescribes how changes in societyimpacted the use of gems, metals, andstylistic elements in the jewelry man-ufactured during the period. Thisoverview is followed by individual sec-tions that give greater detail on specifictypes of jewelry, such as tiaras andcombs, parures (groups of matchingpieces), earrings, necklaces, pendants,brooches, bracelets, and rings.
The chapters are lavishly illustratedwith beautiful examples of exquisitejewels, all of which have passedthrough Sotheby’s auction house in thelast two decades. The layout of thebook is better in this latest manifesta-tion, as many more of the illustrationsare closer to the text that describesthem. Another plus is the addition ofnumerous dazzling new photos, partic-ularly in the Gemstones section ofChapter 9, and in the new chapter thatfollows, which covers the period1980–2000. Unfortunately, however,
several photographs have been re-mas-tered with the intent of making themsharper. While this is an improvementin some cases, in others it has the effectof making the pieces appear flat andunnatural. Sadly, in comparison withprevious editions, many of these digi-tally enhanced images have lost someof the richness of the gems, thewarmth of the gold, and nuances in thedetails. Other changes include anupdated bibliography to reflect theaddition of the new chapter, and thedeletion of approximate auction values,a section featured in previous editions.
The newly added Chapter 10describes how the social and profes-sional roles for women changed at theend of the 20th century, and how thisinfluenced jewelry design. Theauthors describe the 1980s as a“decade of greed and excess,” whichwas followed by a decade largely ofrecession and restraint. In theirdescriptions of how jewelry reflectedthese traits, Bennett and Mascetti do awonderful job of profiling an era thatis still in progress, or at least not farbehind us. In this reviewer’s estima-tion, if one could afford just one bookon the subject, UnderstandingJewellery would be a prime choice forany aspiring jewelry historian.
ELISE B. MISIOROWSKIGemological Institute of America
Carlsbad, California
2005Book REVIEWS
EDITORSSusan B. JohnsonJana E. Miyahira-SmithStuart Overlin
*This book is available for purchasethrough the GIA Bookstore, 5345Armada Drive, Carlsbad, CA 92008.Telephone: (800) 421-8161; outsidethe U.S. (760) 603-4200. Fax: (760)603-4266. E-mail: [email protected]

BOOK REVIEWS GEMS & GEMOLOGY SPRING 2005 77
Collecting Fluorescent MineralsBy Stuart Schneider, 192 pp., illus.,publ. by Schiffer Publishing Ltd.,Atglen, PA, 2004. US$29.95*
In this fascinating work, StuartSchneider introduces readers to theamazing beauty of fluorescent rocksand minerals. A photographic tourde force, it will likely inspire morepeople to pay attention to mineralsthat “glow in the dark” under ultra-violet light (actually, on exposure toUV radiation, but “under ultravioletlight”—a common misnomer—isused throughout the book).
For the most part, this book is acatalogue of color photos comparingmineral specimens as they appear inordinary daylight and when exposedto short- and/or long-wave UV. Of its192 pages, fully 156 are devotedentirely to such juxtaposed photos,with only 22 pages of text. Afterbriefly covering the basics of whatfluorescence is, how to get startedbuilding a collection, and the equip-ment needed, most of the remainingtext focuses on three of the world’smost prolific collecting areas for fluo-rescent minerals: Franklin, NewJersey; Mont St. Hilaire, Quebec; andIlimaussaq, Greenland.
The best feature of the book is thephotographs of fluorescent minerals.The author has done a superb job ofcompiling this exhaustive collectionof photos, which are enhanced by thehigh-quality printing and paper. Aninteresting component of the photocaptions is the guide to the monetaryvalue. Given the volatility of speci-men prices, few authors would bebrave enough to attempt such aguide, but Schneider does a reason-ably good job of providing noviceswith a rough idea of what they willhave to spend to purchase a particu-lar fluorescent mineral if they aren’tinclined to go mucking about inmines and quarries themselves.
The weakest area, unfortunately,is the geological and mineralogical
information, where there are a num-ber of errors. To cite just one exam-ple, of the six “radioactive mineralsthat fluoresce” listed on page 31, onlyone (autunite) is actually fluorescent.The text would have benefited fromproofreading by someone more famil-iar with mineral species.
The intended audience for thisbook is people with a collectorinstinct. It will undoubtedly achieveits objective and induce more of thosewho thrive on building collections toacquire fluorescent rocks. Mostgemologists are already familiar withthe uses of fluorescence in gem iden-tification (a subject not covered in thebook), although they might be inter-ested in the use of fluorescent miner-als as gemstones. The book containsseveral pages with photos of fluores-cent cabochons. Many of these, how-ever, are “collector’s gems” only.They could not be considered “wear-able,” given that they are not particu-larly attractive in daylight and fluo-resce only when exposed to short-wave UV radiation, which is notadvised for any length of time.
ALFREDO PETROVPeekskill, New York
OTHER BOOKS RECEIVED
50-Year History of the Tucson Show.By Bob Jones, 183 pp., illus., publ. byThe Mineralogical Record, Tucson,AZ, 2004, US$20.00. This specialsupplement to The MineralogicalRecord offers a nostalgic look at thehistory of the Tucson Gem andMineral Show, the most importantannual event for the mineral collect-ing community. Reconstructed frompersonal scrapbooks and unofficialarchives, the book features highlightsfrom every TGMS, beginning withthe inaugural event: a two-day showheld at an elementary school inMarch 1955. The descriptions arecomplemented by enjoyable photos
of the memorable specimens and per-sonalities through the years.
STUART OVERLIN
The Grandmasters of Mineral Photog-raphy. 136 pp., illus., publ. by Miner-alogical Almanac, Moscow, 2004,US$45.00. This book, a special issueof the Russian publication Miner-alogical Almanac, features 14 of theworld’s most talented gem and miner-al photographers, including NellyBariand, Olaf Medenbach, JeffreyScovil, Harold and Erica Van Pelt, andWendell Wilson. Each artist has cho-sen nine gorgeous photographs forthis book; these are accompanied bybiographical sketches and a briefoverview of their techniques.
SO
Tone Vigeland: Jewellery + SculptureMovements in Silver. By CecilieMalm Brundtland, 182 pp., illus.,publ. by Arnoldsche Art Publishers,Stuttgart, 2004 [in German andEnglish], US$75.00. Influential Nor-wegian jeweler Tone Vigeland (born1938) has been creating modernistmasterpieces in silver, gold, steel, andlead for nearly 50 years. This artistmonograph documents Vigeland’scareer and captures her finest silverjewelry and sculpture with 160 dra-matic photos.
SO
The Tourmaline: A Monograph. ByFriedrich Benesch and BernardWöhrmann, 234 pp., illus., publ. byVerlag Urachhaus, Stuttgart,Germany, 2003, US$150.00. The firstEnglish version of this oversized book(41 ¥ 31 cm) follows three Germaneditions. The text includes a histori-cal review of tourmaline, a section oncrystallography and chemical compo-sition, and an extensive bibliography.The book is lavishly illustrated, with380 large color photos and illustra-tions that encompass tourmaline’sincredible variety.
SO

78 GEMOLOGICAL ABSTRACTS GEMS & GEMOLOGY SPRING 2005
COLORED STONES AND ORGANIC MATERIALSThe origin of precious opal—A new model. B. Deveson,
Australian Gemmologist, Vol. 22, No. 2, 2004, pp.50–58.
A new model is proposed for the formation of opal showingplay-of-color, as well as potch (common opal). According tothis new model, the essential requirements for opal formationare: (1) artesian “mound” springs with alkaline, silica-richwaters; (2) a mechanism for changing the physicochemical fea-tures of this water so that suitable silica spheres are precipitat-ed in linear chains; and (3) the occurrence of suitable voidslined with clay—which acts as a semipermeable membrane toconcentrate and purify the silica solution by ultrafiltration anddialysis.
Active and extinct artesian mound springs are found ingeneral proximity to several sedimentary rock–hosted opalfields in New South Wales, South Australia, and Queensland.In the Great Artesian Basin, the natural springs lie on a NE-trending line over 300 km long, subparallel to the LightningRidge opal fields. The lepispheres in play-of-color opal are veryuniform in size (apparently within 2–3% of the mean size),indicating a batch process rather than a continuous one. Themixing of the high-pH spring water with cool, slightly acidicgroundwater that has low total dissolved salts would decreasethe pH, lower the temperature, and lower the ionic strength ofthe spring water; all three processes facilitate the formation ofsilica spheres. Montmorillonite (clay) can act as a semiperme-able membrane and assist in the pressurization of the fluidsfor ultrafiltration.
RAH
Gemological ABSTRACTS
2005EDITOR
A. A. LevinsonUniversity of Calgary
Calgary, Alberta, Canada
REVIEW BOARDChristopher M. Breeding
GIA Gem Laboratory, Carlsbad
Jo Ellen ColeVista, California
Michelle Walden FinkGIA Gem Laboratory, Carlsbad
Eric FritzGIA Gem Laboratory, Carlsbad
R. A. HowieRoyal Holloway, University of London
Alethea InnsGIA Gem Laboratory, Carlsbad
David M. KondoGIA Gem Laboratory, New York
Taijin LuGIA Research, Carlsbad
Wendi M. MayersonGIA Gem Laboratory, New York
Kyaw Soe MoeGIA Gem Laboratory, New York
Keith A. MychalukCalgary, Alberta, Canada
Joshua ShebyGIA Gem Laboratory, New York
James E. ShigleyGIA Research, Carlsbad
Boris M. Shmakin Russian Academy of Sciences, Irkutsk, Russia
Russell ShorGIA, Carlsbad
Maha TannousGIA Gem Laboratory, Carlsbad
Rolf Tatje Duisburg University, Germany
Christina TaylorBoulder, Colorado
Sharon WakefieldNorthwest Gem Lab, Boise, Idaho
This section is designed to provide as complete a record aspractical of the recent literature on gems and gemology. Articlesare selected for abstracting solely at the discretion of the sectioneditor and his reviewers, and space limitations may require thatwe include only those articles that we feel will be of greatestinterest to our readership.
Requests for reprints of articles abstracted must be addressed tothe author or publisher of the original material.
The reviewer of each article is identified by his or her initials at theend of each abstract. Guest reviewers are identified by their fullnames. Opinions expressed in an abstract belong to the abstrac-ter and in no way reflect the position of Gems & Gemology or GIA.
© 2005 Gemological Institute of America

GEMOLOGICAL ABSTRACTS GEMS & GEMOLOGY SPRING 2005 79
Preliminary studies on rainbow-pearl of penguin wing oys-ter Pteria penguin. Y. Mao, F. Liang, S. Fu, X. Yu, F.Ye, and C. Deng, Chinese Journal of Zoology, Vol.39, No. 1, 2004, pp. 100–102 [in Chinese withEnglish abstract].
Although there are nearly 40 species of pearl oysters world-wide that can produce saltwater cultured pearls, ~99.9% ofthe production comes from just three species: Pinctadafucata martensii, P. margaritifera, and P. maxima.Currently, the winged oyster Pteria penguin is used solelyfor the commercial production of mabe or half-round cul-tured blister pearls. However, research in Guangxi, China,showed that spherical cultured pearls with a rainbow color(“rainbow pearls”) can be produced from P. penguin.
The research involved 144 winged oysters that were2.5 years old (11.0–14.2 cm in longest dimension); thesewere housed in cages suspended at 3 m depth. The oysterswere nucleated with beads (5.1 mm in diameter) andpieces of mantle tissue (2 ¥ 2 mm). After three months ofculturing, the nacre layer was up to 300 µm thick, andafter nine months it was up to 890 µm thick. Twelve cul-tured pearls were produced that ranged from 5.8 to 6.9 mmin diameter with the color, shape, luster, and nacre thick-ness that met the requirements for cultured pearls inChina. Some of them displayed a “rainbow” appearance.At present, because of space limitations in the vicinity ofthe nucleus, cultured pearls larger than 10 mm cannot beproduced in P. penguin. TL
Taphonomy of insects in carbonates and amber. X.Martínez-Delclòs, D. E. G. Briggs, and E. Peñalver,Palaeogeography, Palaeoclimatology, Palaeoecology,Vol. 203, No. 1–2, 2004, pp. 19–64.
Taphonomy deals with the incorporation of organic remainsinto sediments or other media (e.g., resins) and the fate ofthese materials after burial. Such occurrences are uncom-mon in the case of insects, as compared, for example, to fos-sil mollusk shells. In this article, the authors present anextensive review of the wide range of major taphonomicprocesses that control insect preservation in both carbonaterocks (e.g., limestones) and resins (e.g., amber and copal).These processes (both biologic and diagenetic) are restrictedin geologic time and geographic distribution, which gener-ates biases in the fossil record in terms of the number, type,and location of insects preserved. The authors suggest thattaphonomic studies are an essential prerequisite to thereconstruction of fossil insect assemblages, to the interpre-tation of the sedimentary and environmental conditionswhere insects lived and died, and to the investigation of therole of insects in ancient ecosystems. JES
Traditional pearl and chank diving technique in Gulf ofMannar: A historical and ethnographic study. N.Athiyaman and K. Rajan, Indian Journal of Historyof Science, Vol. 39, No. 2, 2004, pp. 205–226.
Using traditional methods, divers have retrieved pearls and
chank (Turbinella pyrum, also known as “Indian conch”)shells from the Gulf of Mannar, on the southeast coast ofIndia, for several millennia. At present there is no pearlfishery along this coast, but chank shell is still harvested.Historically, the pearl oyster beds were located at a depthof 4–12 fathoms (7–22 m), and the best period for pearl div-ing was between March and mid-May. Before the seasonbegan, divers would survey potential sites to determinethe best locations. Early reports indicate that hundreds(even thousands) of boats were used for pearl fishing eachseason, some accommodating as many as 60–90 divers.Thousands of divers participated in the pearl harvest.Chank shell recovery was accomplished by similar meth-ods but with fewer people.
The harvested oysters would be left in a pit to decay forone month before the pearls were extracted. A 16th centuryaccount states that, after washing, the pearls would be sort-ed into four grades, according to size and quality, that weredirected to specific markets: Aia of Portugal, or roundgoods, which were purchased by Portuguese merchants;Aia of Bengal, or off-round; and Aia of Canara, which wereinferior to the previous two. The lowest grade of pearls, Aiaof Cambaia, was sold in the local countryside. RS
DIAMONDSCharacterization of carbonado used as a gem. K. de Corte,
Y. Kerremans, B. Nouwen, and J. van Royen,Gemmologie: Zeitschrift der Deutschen Gemmolo-gischen Gesellschaft, Vol. 53, No. 1, 2004, pp. 5–22.
The popularity of colored diamonds and the availability ofadvanced laser cutting techniques have advanced the useof carbonado as a gem. Carbonado is an opaque polycrys-talline diamond material with properties that are quite dif-ferent from those of “normal” diamonds. This article pre-sents a study of 21 carbonados from the Central AfricanRepublic that is augmented with data from the literature,mostly on Brazilian stones.
Morphologically, two categories of carbonado are dis-tinguished. The first has a mostly homogeneous grain size(20–30 mm in diameter), while the second comprises larg-er crystals (>80 mm in diameter) that are embedded in afine-grained matrix. Pores among the crystals are filledwith a variety of oxide, phosphate, or silicate minerals.Due to its porosity, the density of a carbonado is distinc-tively lower than that of a pure diamond (3.07–3.45 vs.3.52 g/cm3). Sr, Pb, Fe, and Y were detected as major ele-ments in the pores by EDXRF. Infrared spectroscopyshowed that the diamonds were types Ia or Ib; both typeswere found in some samples. Raman photoluminescencespectroscopy revealed N-V centers at 638 and 575 nm, aswell as the H3 center at 503 nm; all of these defects arecaused by exposure to natural radiation.
Carbonados have only been found in alluvial deposits,and their source rock is unknown. They can be quite

80 GEMOLOGICAL ABSTRACTS GEMS & GEMOLOGY SPRING 2005
large, with stones >1,000 ct reported. Various hypotheseshave been offered to explain their origin, ranging from for-mation in the earth’s interior to meteorites, but the mat-ter is still unresolved. KSM
Conditions of incipience and growth of diamond crystals.V. N. Anfilogov, Proceedings of the Russian Miner-alogical Society, Vol. 133, No. 1, 2004, pp. 110–116[in Russian with English abstract].
Mechanisms of nucleation and the subsequent growth ofnatural diamond crystals are discussed. It is postulatedthat morphological and structural features in the centralzones of diamond crystals (i.e., their nuclei) may initiallyform under extreme physical conditions (e.g., impacts ormechanical deformation) as a metastable, diamond-likemodification of the carbon. Alternately, in accordancewith the commonly accepted mantle origin of kimberlites,their formation may be due to an interaction betweenbasaltic melts in the mantle and rocks occurring at thebase of a craton in the earth’s crust. In this case, the kim-berlite is viewed not as a hypothetical mixture of a meltand a gaseous phase, but as a fluid from which all the“magmatic” minerals of kimberlite crystallize. There issome evidence that diamond crystals grow while kimber-lite pipes are being emplaced. RAH
How long can diamonds remain stable in the continentallithosphere? C. J. O’Neill and L. Moresi, Earth andPlanetary Science Letters, Vol. 213, No. 1–2, 2003,pp. 43–52.
A question of importance to diamond geologists is: DoArchean ages (>2.5 billion years [By]) obtained for dia-monds from many of the world’s cratons constrain thethermal state of the Archean continental lithosphere?Recent evidence suggests that the published ages may notrepresent the ages of the diamonds themselves, but rathermay significantly pre-date them. To study this possibility,the authors mathematically modeled the thermal stabilityof the continental lithosphere in the convecting mantle.
If diamonds have survived in cratonic roots since theArchean, the conditions necessary for their stability musthave existed in the Archean continental lithosphere andremained relatively unperturbed for ~3.0 By. In this study,the longevity of the diamond stability field is explored forsystems with chemically distinct continental crust and astrongly temperature-dependent mantle viscosity. Suchmodels frequently produce the temperature conditionsneeded to form diamonds within the Archean lithosphere,but temperature fluctuations experienced within the mod-eled mantle lithosphere are generally able to destroy thesediamonds within 1 By. The models show that the maxi-mum residence time of diamonds in the lithosphere is~284–852 million years. While this approaches the orderof magnitude (of Archean ages) required, extremely fortu-itous mantle conditions are required to explain the appar-ent longevity of Archean diamonds. RAH
Mineralogy of diamonds from the Yubileinaya pipe(Yakutia). N. N. Zinchuk and V. I. Koptil, Geologyof Ore Deposits, Vol. 46, No. 2, 2004, pp. 135–149.
The Yubileinaya (Jubileynaya) kimberlite pipe in theDaldyn-Alakit diamondiferous district of Yakutia is thelargest (59 ha) primary diamond deposit in Russia. It wasconcealed by an overlying dolerite sill (average thicknessof 66 m) that has been stripped away to allow for open-pitmining. This article presents the results of a comprehen-sive study of the mineralogy and physical properties of~7,000 diamonds taken from drill core and large tonnagesamples. Data are presented on crystal morphology (crys-tal varieties and habits, twins and intergrowths, etchingfeatures), transparency, color, photoluminescence, X-rayluminescence, degree of preservation, mineral composi-tion of solid inclusions, optically active defects, infraredspectroscopy, and carbon isotropic composition.
Many of the diamonds from the Yubileinaya pipe,similar to those of other primary deposits of the Siberianprovince, are colorless; about 40% have octahedral andtransitional forms from octahedral to rhombic dodecahe-dra. However, variations in crystal morphology accordingto diamond size are distinctly different from the varia-tions seen at the Mir, Aikhal, and other pipes in theregion. Diamonds from this pipe also show strong evi-dence of natural dissolution (e.g., corrosion features, frost-ing) compared to diamonds from other Yakutian deposits.The colored diamonds are mainly pale “smoky” brown,pinkish violet, and violet-brown (caused by ductile defor-mation). Many of the YubileŠinaya diamonds appear graybecause of numerous graphite inclusions. Most of the dia-monds have blue, pinkish violet, and green photolumines-cence, with a large number showing yellow-green photo-luminescence. These and other data are used to distin-guish diamonds from the Yubileinaya pipe from thoseproduced elsewhere in Yakutia.
Paul Johnson
A new type of synthetic [syngenetic] xenomineral inclu-sions in diamond. V. I. Silaev, I. I. Chaikovskii, V. I.Rakin, and V. N. Filippov, Doklady of the RussianAcademy of Sciences, Earth Science Section, Vol.394, No. 1, 2004, pp. 53–57.
A new class of syngenetic inclusions composed of Ti-Fe-Si-Zr-Al oxide solid solutions has been found in diamondcrystals obtained from placers in the Middle UralMountains. The inclusions, which are linearly arrangedand probably represent two generations, have been detect-ed in both the marginal and central parts of the diamonds.They are up to 20 mm in size and have a wide range ofcompositions, as evidenced by the analysis of 17 inclu-sions. These inclusions are probably suitable for determin-ing conditions of diamond nucleation and growth, becausethey could be close analogues of mineral phases present inthe inferred deep mantle. RAH

GEMOLOGICAL ABSTRACTS GEMS & GEMOLOGY SPRING 2005 81
GEM LOCALITIESAventurescent oligoclase feldspar from Oregon, USA. U.
Henn, Journal of Gemmology, Vol. 29, No. 2, 2004,pp. 72–74.
Basaltic rocks in Oregon have been the source of gem-quality plagioclase feldspars since the 1960s. The mostabundant species is labradorite, but bytownite, andesine,and oligoclase have also been recovered. Oligoclase com-prises only 1% of the gem material. The gemological prop-erties (e.g., R.I. of 1.535–1.547) and chemical composition(e.g., an anorthite content of An12.7) of the transparentoligoclase “sunstone” are reported along with a descrip-tion of the euhedral hematite inclusions that are responsi-ble for their aventurescence. Similar transparent sunstonesfrom Norway and colorless oligoclase from Brazil can bedifferentiated from the Oregon material, as the latter hasboth lower refractive indices and a lower anorthite con-tent. [Editor’s note: Most of the sunstone previouslyreported from Oregon is labradorite (An70 in composition),with aventurescence attributed to platelets of native cop-per (C. L. Johnston et al., Winter 1991 Gems & Gemology,pp. 220–233).] WMM
Amethyst in the Thunder Bay region, Ontario. M. I.Garland, Canadian Gemmologist, Vol. 25, No. 2,2004, pp. 44–57.
The Thunder Bay amethyst area (~125 km long and ~40km wide) in Ontario extends along the northern shore ofLake Superior from Thunder Bay to Lake Nipigon. Theamethyst is related to the hydrothermal system thatformed the Thunder Bay silver and the Dorion lead-zinc-barite veins. There is a spatial relationship between theseveins and an Archean and Proterozoic unconformity (con-taining 2.7 and 2.0 billion-year-old rocks, respectively),suggesting that the unconformity provided a conduit forsilica-rich solutions. Areas with good amethyst potentialare recognized by development of quartz-rich brecciazones along recurrent faults. The amethyst has a variety ofoccurrences, such as in vugs and zoned veins, with colorsranging from the palest violet to almost black. Facetableamethyst is produced at several operating mines.
Although amethyst was used by native people, “mod-ern” mining began in the 1860s; interest waned in theearly 1900s with the appearance of abundant, inexpensive,good-quality Brazilian material. In the 1950s, there was aresurgence of exploration, resulting in the discovery of sev-eral large deposits. In addition to recovering amethyst forsale in their own shops, many Thunder Bay producers (14are listed in a table) offer fee digging. The amethyst indus-try is important to the local economy, but it suffers from alack of consistent marketing and production, as well ascompetition (particularly from South America). Currently,the economic strength of Thunder Bay amethyst lies inthe variety of spectacular specimens, particularly in com-bination with barite and fluorite. AAL
Conditions of pocket formation in the Oktyabrskayatourmaline-rich gem pegmatite (the Malkhan field,central Transbaikalia, Russia). I. S. Peretyazhko, V.Y. Zagorsky, S. Z. Smirnov, and M. Y. Mikhailov,Chemical Geology, Vol. 210, No. 1–4, 2004, pp.91–111.
Coexisting melt, fluid-melt, and fluid inclusions in quartzfrom the Oktyabrskaya gem tourmaline deposit in Russiawere studied to elucidate the conditions of pocket forma-tion. At room temperature, fluid-melt inclusions in earlypocket quartz and in quartz from the coarse-grained quartz-oligoclase host pegmatite contain crystalline aggregates andan orthoboric-acid fluid. The prevalence of fluid-melt inclu-sions decreases, and the volume of fluid in the inclusionsincreases, from the early to the late growth zones in thepocket quartz. No fluid-melt inclusions were found in thelate growth zones. Analysis of the fluid inclusions andaccompanying fluids suggests that the residual melts of thelatest magmatic stage were strongly enriched in H2O, B, F,and Cs, and contained elevated concentrations of Li, Be, Ta,and Nb. Fluid-melt inclusion microthermometry showedthat those melts could have crystallized at 615–550°C. EF
Emerald mineralization in the Kafubu area, Zambia. A. V.Seifert, V. Zácek, S. Vrána, V. Pecina, J. Zachariáš,and J. C. Zwaan, Bulletin of Geosciences, Vol. 79,No. 1, 2004, pp. 1–40.
This study provides the first quantitative geochemical,petrological, and mineralogical data on major rock typesand minerals of the Kafubu emerald area in Zambia. Theemerald-bearing phlogopite schists are confined to the con-tacts of quartz-tourmaline veins (and less commonly,quartz-feldspar pegmatites) with the host chromium-richmetabasites. The veins and pegmatites are the source of Be,and are genetically related to a hidden fertile granite pluton.The formation of the phlogopite schists from the metaba-sites was also associated with the addition of K, F, Li, andRb. Data on pegmatite occurrences in active mines andexploration pits and their extrapolation into surroundingareas point to the existence of a single, major pegmatitefield that overlaps the extensive horizons of metabasite.
The emeralds range from light to dark green and areoften color zoned. They are typically heavily included andmoderately fractured. They are dichroic, inert to long- andshort-wave UV radiation, and commonly appear greenthrough the Chelsea filter. Fluid inclusion data indicatethat the most common interval of quartz veins associatedwith emerald mineralization was at approximately350–400°C and 200–400 MPa. EF
Gem corundum deposits in Vietnam. P. V. Long, H. Q.Vinh, V. Garnier, G. Giuliani, D. Ohnenstetter, T.Lhomme, D. Schwarz, A. Fallick, J. Dubessy, and P.T. Trinh, Journal of Gemmology, Vol. 29, No. 3,2004, pp. 129–147.
This paper reviews the main types of gem corundum

82 GEMOLOGICAL ABSTRACTS GEMS & GEMOLOGY SPRING 2005
deposits in Vietnam, the history of their discovery, andtheir geologic framework, gemological and mineralogicalproperties, and inclusions. Beginning in 1983, gem-qualityrubies were mined first from marble-hosted deposits nearLuc Yen and later from the Yen Bai and Quy Chau min-ing districts, all of which are in the northern part of thecountry. Blue, green, and yellow sapphires (associatedwith basalt) have been mined since 1991 from the DakLak, Lam Dong, and Bin Thuan provinces of southernVietnam. Although corundum is known from amphibo-lite, gneiss, and metasomatites in Vietnam, these depositsare not currently viable. The physical appearance of thesevarious gem corundums, and the inclusions found withinthem, are directly related to their respective geologic envi-ronments.
Trace-element variations in the corundums underlinethe diversity of their host rocks. Plots of the ratiosCr2O3/Ga2O3 versus Fe2O3/TiO2 divide the corundumsinto three main geochemical fields that are discrete andpartly overlap. Some rubies, as well as some blue and col-orless sapphires, are found in placer deposits and there-fore are of unknown geologic origin. Fluid compositionsignatures, inclusions, and oxygen isotope compositionsclearly differentiate Vietnamese corundums of differentorigins. WMM
Inclusions in Vietnamese Quy Chau ruby and their origin.P. V. Long, H. Q. Vinh, and N. X. Nghia, AustralianGemmologist, Vol. 22, No. 2, 2004, pp. 67–71.
The inclusions found in ruby from Quy Chau, Vietnam,were studied by optical and scanning electron microscopy,as well as Raman spectroscopy. The following were identi-fied: anatase, andalusite, anorthite, apatite, biotite,boehmite, brookite, calcite, corundum, diaspore, dolomite,graphite, margarite, muscovite, phlogopite, pyrite, rutile,zircon, and zoisite. The compositions of both primary andsecondary gas-liquid phases, and negative crystals, are alsodescribed. The authors suggest that the mixed composi-tion of the inclusions in Quy Chau rubies is suggestive ofboth metamorphic and metasomatic origins.
RAH
Sapphire-blue kyanite from Nepal. U. Henn, AustralianGemmologist, Vol. 22, No. 1, 2004, pp. 35–36.
Gem-quality deep blue kyanite, yielding faceted stones upto 12.2 ct, is described from Nepal. Refractive indices werea = 1.715–1.718, b = 1.726–1.727, and g = 1.731–1.734 (bire-fringence = 0.016). S.G. values were 3.67–3.69. The kyaniteshowed a distinct red luminescence to long-wave UV radi-ation. Growth tubes were oriented parallel to the c-axis ofthe kyanite and were accompanied by distinct color zon-ing. A second type of growth tube (oriented perpendicularto the other tubes) was tapered and partly filled by a dou-bly refractive mineral. The nonpolarized absorption spec-trum showed bands attributable to Fe3+ occupying octahe-dral Al sites. RAH
Spinel from Kayah State (Myanmar). U. T. Hlaing,Australian Gemmologist, Vol. 22, No. 2, 2004, pp.64–66.
Gem-quality pink-to-red spinels were recovered in 2001from an alluvial deposit between the Pawn Chaung andSalween Rivers, some 40 km south of the township ofHsa-taw, Kayah State, eastern Myanmar. They werelikely derived from marbles associated with the PawnChaung rock series. Some of these spinels have yieldedfaceted stones up to 1 ct. Gemological properties wereR.I. = 1.713 and S.G. = 3.63, and inclusions were rare.
RAH
INSTRUMENTS AND TECHNIQUESThe application of the confocal micro-Raman in the gem-
stone identification. E. Zu, Y. Duan, and P. Zhang,Journal of Yunnan University, Vol. 26, No. 1, 2004,pp. 51–55 [in Chinese with English abstract].
The application of Raman spectroscopy to the nondestruc-tive identification of natural gems, simulants, synthetics,enhancements, and inclusions, with particular emphasison stones likely to be encountered in Yunnan, China (i.e.,jadeite), is described. Several examples are given, the mostinteresting of which relate to green stone axes that werefound in Yunnan. These axes were purportedly made ofBurmese jadeite that was produced 3,000–7,000 years agoand subsequently imported into China. However, Ramananalysis clearly established that the green material waskyanite. TL
Chemical determination of coloured zoned minerals in“natural stones” by EDS/WDS electron microprobe:An example of dumortierite quartzites. A. Borghi,R. Cossio, L. Fiora, F. Olmi, and G. Vaggelli, X-RaySpectrometry, Vol. 33, No. 1, 2004, pp. 21–27.
Quartzite, a metamorphic rock composed primarily ofgranular quartz, on rare occasions displays a blue color dueto dumortierite impurities. This study of dumortieritewithin quartzite from Mozambique, Brazil, andMadagascar was undertaken to determine the relationshipbetween the color and chemistry of this mineral. The sam-ples from Mozambique contained two generations ofdumortierite crystals, both of which exhibited zoning ofcolor and of Al, Si, Ti, and Sb contents. Areas of strongerblue pleochroism could be correlated with higher Ti con-tents. These dumortierites also displayed an unusualamount of antimony (up to 5 wt.% Sb2O3), but with nocorrelation to color. The authors suggest that Sb and Ti areaccommodated in the Mozambique dumortierite by cou-pled exchange with Si and Al, respectively. Thedumortierite in quartzites from Brazil and Madagascarwere less zoned in terms of color and chemistry.
JES

GEMOLOGICAL ABSTRACTS GEMS & GEMOLOGY SPRING 2005 83
LIBS: A spark of inspiration in gemological analyticalinstrumentation. T. Themelis, Australian Gem-mologist, Vol. 22, No. 4, 2004, pp. 138–145.
The application of laser-induced breakdown spectroscopy(LIBS) to the detection of Be, B, and Li in selected untreat-ed and treated gem corundums was studied using a bench-type apparatus. With this technique, laser pulses fired ontothe surface of test specimens generate a plasma that givesrise to distinct spectral emission signatures, which are cap-tured by a spectrograph and processed by a computer. Theuse of LIBS for detecting Be, Li, B, and other elements ingems is hindered by the substantial instrumental error of~20%. Also, the specimen undergoes some damage. Theauthor concludes that the use of LIBS in gemology appearslimited because the technique is not sufficiently quantita-tive. Nevertheless, LIBS may be useful for detecting poly-mers and for analyzing the content of jewelry metal alloys.
RAH
The use of optical coherence tomography for monitoringthe subsurface morphologies of archaic jades. M.-L.Yang, C.-W. Lu, I.-J. Hus, and C. C. Yang, Archae-ometry, Vol. 46, No. 2, 2004, pp. 171–182.
When buried for centuries, the mineralogical structures ofjade objects gradually alter, resulting in a whitening of thesurface and part of the interior. This provides one of themost important characteristics for identifying authenticarchaic jade objects. However, an archaic appearance canalso be created by heating or burning jade objects. Thisstudy shows how optical coherence tomography (OCT)can be used to nondestructively differentiate betweenauthentic archaic jades and forgeries by imaging their sub-surface structures.
The authors used an OCT system that was modifiedfor scanning jade objects to study three archaic samplesand two artificially treated jades. Systematic differenceswere found in the small- vs. large-scale structures thatwere imaged, as well as in the backscattering intensitymeasured by the technique. OCT can provide a usefulmeans of authenticating archaic jade objects. AI
JEWELRY RETAILINGDiamond polisher. J. Kutler, Institutional Investor, Vol.
38, No. 11, 2004, pp. 18–21.A profile is presented of Terry Burman, who helped restorethe fortunes of Signet Group. Signet is the world’s largestspecialty retail jewelry chain, with more than 1,700 storesand 17,000 employees in the U.K and the U.S. operatingunder several well-known names (e.g., H. Samuel, KayJewelers). The company began the 1990s with lossesincurred by large debts that were exacerbated by adversepublicity generated by former CEO Gerald Ratner. A suc-cessor to Ratner, James McAdam, helped restore the com-pany to profitability. However, in the four years since
Burman took the helm, pre-tax profits have increased 65%,a result of stressing product quality and continuousimprovement in all aspects of the business. The companyalso increased its diamond branding efforts, shifted much ofits advertising to television, and worked hard on trainingprograms to instill consumer confidence in the sales staff.
RS
A gem of a resourcing strategy. R. Suff, IRS EmploymentReview, Issue 809, 2004, pp. 46–48.
Signet Group recently launched a new human resourcesstrategy to support its prime business goal of “makingits existing space work harder.” This entailed attractingand retaining employees capable of taking the businessforward.
The company set up a screening program to attractpeople with a strong work ethic, which entailed updatingthe company’s image in the employment market. It thencommissioned a business psychology firm to identify keytraits of an “ideal” employee. Communication skills werecritically important. The company also devised a numberof incentive programs, including ongoing training andcareer tracking, to retain as many employees as possible.
RS
Displaying jewelry in the best light. A. DeMarco, JCK,Vol. 175, No. 4, 2004, pp. 96–100.
This article describes how lighting can be used in retailjewelry stores to help attract customers and boost sales.The best lighting arrangements employ fluorescent lightsin jewelry showcases and metal halide or tungsten halogenlights from above. This allows pieces to be lit effectivelyboth in and out of the case. In addition, the temperature ofthe light source can have an effect on color. Temperaturesbelow 3,000 K produce a warm, reddish appearance. From3,400–3,500 K, the light is white or neutral. Temperaturesgreater than 4,600 K produce bluish “cool” colors.
Lighting and associated electrical requirements can beone of the most significant store expenses (about 25%) forretail jewelers, and as such they should be considered aninvestment. Studies have shown that better-lit displaysand cases attract more browsers and promote significantlyhigher sales. The author notes that hiring lighting profes-sionals often saves money in the long run. RS
TREATMENTSThe effect of high-temperature treatment on the defect-
and-impurity state and color of diamond singlecrystals (review). N. V. Novikov, A. N. Katrusha, S.A. Ivakhnenko, and O. A. Zanevsky, Journal ofSuperhard Materials, Vol. 25, No. 6, 2003, pp. 1–12.
This article presents a detailed review (as of 2003) of thetechnology for changing diamond color by high temper-ature/high pressure annealing (HPHT; also called ther-

84 GEMOLOGICAL ABSTRACTS GEMS & GEMOLOGY SPRING 2005
mobaric treatment). It discusses changes in atomic-level defects and visible absorption spectra from HPHTtreatment of both type I and II natural and syntheticdiamonds. The color changes result from the formationor annihilation of color centers often involving nitro-gen. The treatment technologies used by several compa-nies (such as General Electric and others) are summa-rized. Results are presented of experiments carried outby the authors to produce a range of colors in diamondsusing a toroid-type high-pressure apparatus at condi-tions of 1,600–2,100°C and 5.5–6.5 GPa. The potentialrisk of cracking even high-clarity diamonds duringHPHT treatment is also discussed.
JES
If you can’t stand the heat, get out of the gem business. G.Roskin. JCK, Part I. Vol. 175, No. 5, May 2004, pp.182–188; Part II. Vol. 175, No. 6, June 2004, pp.129–132; Part III. Vol. 175, No. 8, August 2004, pp.90–92.
This three-part report summarizes the history and meth-ods of heat treating colored stones to create a more sal-able product, as well as the issues raised by these treat-ments in the retail marketplace. Heat treatment hasbeen practiced for centuries, primarily to improve color,but only recently have detection techniques and equip-ment evolved to the point that most of them can beidentified consistently. Detection of treatment for somegem varieties continues to be very difficult or evenimpossible. Aquamarine is one example, but the list ofgems with unidentifiable color origins is growing, andtwo of the “big three” colored stones—ruby and sap-phire—are in danger of joining that list. Corundumtreatment was not recognized until the 1970s; a 1979 labnote in Gems & Gemology by Robert Crowningshield,then director of GIA’s Gem Trade Laboratory in NewYork, observed that heat-treating of sapphires is “one ofthe best kept commercial secrets in the jewelry indus-try.” [Editor’s note: see Spring 1979 Gems & Gemology,p. 147.]
Heat treatments of Sri Lankan geuda sapphire andlater Burmese (Mong Hsu) ruby helped the industrymeet the growing demand for these gemstones by trans-forming unattractive material into salable gems. Thetreatment bar was raised in the mid-1980s when the pro-cess of creating blue color in sapphire by diffusing titani-um was introduced to the market. Detection of this pro-cess was easy because the color was confined to the sur-face. However, detecting heat treatment of certain sap-phires was much more difficult because the color couldbe improved with temperatures as low as 300–400°C(which is insufficient to produce telltale altered inclu-sions). The latest treatment, beryllium diffusion, is evenmore difficult to detect.
The report also lists five categories of corundum treat-ment that affect price and therefore must be disclosed:
unenhanced, lightly heated (i.e., Madagascar), heatedwithout flux, heated with flux, and heated with an addi-tive (e.g., beryllium). RS
The use of thermobaric treatment to manipulate thedefect-and-impurity state of natural diamond singlecrystals. A. N. Katrusha, S. A. Ivakhnenko, O. A.Zanevsky, and T. Hainschwang, Journal of Super-hard Materials, No. 3, 2004, pp. 47–54 [in Russian].
Natural brown type I diamonds were treated underHPHT conditions corresponding to the graphite stabili-ty region of the carbon phase diagram (1,750–2,000°C,44–65 kbar) for 10–30 minutes to evaluate the effects ofpressure on the aggregation state of nitrogen and theformation of color centers. Following HPHT treatment,mixed type IaA/B diamonds showed considerabledecreases in brown coloration at all experimental pres-sures. However, those samples treated at the lowestpressure (44 kbar) also developed a yellow color, whichwas attributed to H3, H4, and N3 absorption centers. Itis speculated that enhanced mobility of vacancies wasresponsible for the formation of these color centers atonly lower pressures. Despite conditions that favoredgraphite stability, no graphitization of diamond surfacesor fractures was observed.
HPHT treatment of a brown type Ib diamond causednear-complete aggregation of nitrogen, resulting in atype IaA/B pinkish yellow diamond. The creation of N3and H3 centers caused the yellow, and a broad absorp-tion band at 560 nm produced the pink color. Nearlypure type IaB brown diamonds, after exposure to HPHTconditions, gave varying results. It was found that1.1–4.0 ppm of nitrogen in the form of A-aggregatesmust be present within the IaB diamonds to producesufficient N3 and H3 centers to cause a green-yellowcolor under the treatment conditions used. These exper-iments with type I diamonds indicate that the results ofHPHT treatment are dependent not only on the typeand amount of nitrogen present but also on the pressureconditions. CMB
MISCELLANEOUSCriteria and parameters for gemstones [sic] uniqueness.
V. S. Chernavtsev and K. K. Atabaev, GemologicalBulletin, No. 9, 2003, pp. 12–17 [in Russian withshort English abstract].
The authors studied gem exhibits in museums and atmineral shows worldwide with the objective of quantify-ing the factors that determine the value of museum-qual-ity colored stones, particularly rough specimens butsometimes cut stones. On the basis of the data collected,they were able to classify the stones into several groupsand to value them. They also determined characteristicsthat make certain specimens “unique” (i.e., those of

GEMOLOGICAL ABSTRACTS GEMS & GEMOLOGY SPRING 2005 85
exceptional quality, rarity, or other attributes). Suchspecimens are found not only in museums but also inprivate collections.
The main criteria that determine the uniqueness ofgemstones are: (1) aesthetic appeal, (2) purity (i.e., thenumber and nature of associated minerals) and perfection,(3) rarity, (4) historical importance, and (5) scientific signif-icance. Based on these criteria, several categories of uniquestones were recognized, their parameters tabulated, andvaluations applied. Particularly unique samples areextremely difficult to value but, as a generalization, theirprice depends on size, purity, abundance and location ofphysical defects, availability of details on their geologicoccurrence, and publications (scientific or popular) relatedto the particular specimen. BMS
Managing the commons: An economic approach to pearlindustry regulation. B. Poirine, AquacultureEconomics & Management, Vol. 7, No. 3–4, 2003,pp. 179–193.
Unregulated use of tropical lagoons for pearl culturehas created problems associated with overexploitation,which has led to declining profits (or losses) for pearlfarmers. Various factors cause cultured pearl produc-tion to decline and oyster mortality to increase when acritical density is reached. Particular emphasis isplaced on the problems facing the Tahitian black cul-tured pearl industry.
In lagoons owned privately by a single producer, over-crowding is not a problem because profits are maximizedfar below the critical density. However, in public lagoons,the author proposes that the government should regulate,by auction, the use by a single producer for a specific peri-od of time, with rules to ensure equitable policies towardall producers. Arguments are also made for a global cul-tured pearl production quota to keep prices from fallingdue to excess supplies; both Australia and Japan haveenacted successful oyster quota policies that have prevent-ed overexploitation and the economic havoc that resultsfrom such practices. RS
Not forever: Botswana, conflict diamonds and theBushmen. I. Taylor and G. Mokhawa, AfricanAffairs, Vol. 102, No. 407, 2003, pp. 261–283.
Although Botswana, a peaceful democracy in southernAfrica, has not been implicated in the campaigns againstconflict diamonds, the policies of its government regardingtribes of Bushmen living in the Central Kalahari GameReserve have come under fire.
Botswana is the world’s largest diamond producer byvalue, and diamonds are responsible for 87% of its for-eign exchange. The country, one of the poorest at inde-pendence in 1966, is now in the upper-middle incomecategory (with a per capita Gross Domestic Product ofmore than $6,000), though the distribution of wealthremains very unequal. Because the country is so depen-
dent on diamond revenues, its government launched a“Diamonds for Development” campaign to ensure differ-entiation from other African nations beset by wars thatspawned the conflict diamond campaigns. However, anumber of nongovernmental organizations (SurvivalInternational, in particular) have sought to link the gov-ernment’s policy of removing Bushmen tribes, known asthe San, from the Reserve to diamond exploration effortsin that area.The government cut off services, including water, to
the area in January 2002 as part of a policy to resettle theSan, claiming the action and the resettlements were to protect wildlife and foster tourism in the area. SurvivalInternational drew De Beers—a 50/50 partner inBostswana’s diamond mining operations—into the contro-versy, as De Beers holds an exploration license near theaffected area. De Beers has distanced itself from the gov-ernment’s resettlement policy and noted that its explo-ration area comprises only 20 km2 of the Reserve’s 55,000km2. Survival International continues to organize protestsagainst. De Beers and the Botswana government.
RS
SSttrraatteeggiieess ffoorr ssuussttaaiinnaabbllee ddeevveellooppmmeenntt ooff tthhee ssmmaallll--ssccaallee ggoolldd aanndd ddiiaammoonndd mmiinniinngg iinndduussttrryy ooff GGhhaannaa.. R. K.Amankwah and C. Anim-Sackey, Resources Policy,Vol. 29, No. 3-4, 2003, pp. 131-138.
Small-scale mining of gold and diamonds has helped createemployment and government revenue in Ghana. Since thegovernment instituted reforms in 1989 that legalized suchactivites, more than 1.5 million ounces of gold and 8 mil-lion carats of diamonds have been produced. The small-Scale Mining Law inlcudes a technical assistance programthat has helped with prospecting and development, legal-ized the purchase of mercury for gold recovery, and estab-lished a marketing authority to buy and export gold anddiamonds. By the end of 2001, 420 small-scale mining con-cessions (nine for diamonds) had been licensed. Thesecompanies have generated employment for more than100,000 people.
However, there are still thousands of illegal miners,called galamsey in local parlance, who have created prob-lems for the government. First, conflicts have arisen overtheir encroachment on concessions held by larger miningcompanies. some large firms have accommodated the ille-gal miners by ceding less-economic areas of their conces-sion to them—in exchange for their registering with thegovernment. Second, these illegal miners—and some legalmining enterprises—also cause a great deal of enviornmen-tal damage. Mercury poisoning is a particular problem insome mining villages.
The government has launched an education programto promote cleaner, safer extraction methods. It also hasencouraged the formation of small-scale mining associ-ations to better regulate safe and productive miningpractices. RS

1. While very small, industrial-quality synthetic diamondswere documented in the mid-1950s, the first faceted jewelry-quality synthetic diamonds were unveiled by the GeneralElectric Company (GE) on June 17, 1971. The internal char-acteristics and ultraviolet fluorescence observed in theseearly synthetic diamonds are among the key identificationfeatures still used today.
2. The GE synthetic diamonds were produced by subjectingcarbon in a metallic flux to extremely high temperatures andpressures, a process known as high temperature/high pres-sure (HPHT) growth. In the early 1970s, it took a week ormore to grow a 1 ct gem-quality crystal, at a cost of roughly$20,000 (equal to about $90,000 today).
3. Also in the 1970s, the De Beers Diamond ResearchLaboratory in South Africa began manufacturing gem-qualitysynthetic diamonds of a size suitable for use in jewelry—then, as now, for research purposes only.
4. In April 1985, Sumitomo Electric Industries of Japanannounced the first commercial production of gem-qualitysynthetic diamonds. These yellow crystals, intended only forhigh-technology industrial applications, were largely free ofinclusions and ranged from 1 to 2 ct in size.
5. In the early 1990s, small quantities of Russian gem-quality synthetic diamonds began to turn up in the jewelrytrade. Whereas GE, Sumitomo, and De Beers researchershad used a “belt”-type press (so called because it uses acylindrical growth chamber) to grow synthetic diamonds,the Russians used a new type of machinery. The “split-sphere” apparatus (also known by the Russian acronym“BARS”) applies high pressure on all sides of the growthchamber rather than just the top and bottom.
6. During the 1980s, a low-pressure diamond growthtechnique called chemical vapor deposition (CVD) saw its
first major industrial use. In contrast to HPHT diamondsynthesis, CVD growth takes place at a high temperaturebut at one-tenth atmospheric pressure.
7. The CVD process, which actually pre-dates HPHT synthesis, involves the high-temperature ionization of a carbon-rich gas, typically methane. Carbon atoms aredeposited on the substrate as a film of polycrystalline orsingle-crystal synthetic diamond. So far only thin layers ofCVD-grown synthetic diamond (up to several millimeters inthickness) have been produced by the technique.
8. For decades, CVD-grown synthetic diamond was avail-able only as polycrystalline material with a grayish, granularappearance or as very thin single crystals (too thin to befaceted). This changed in 2003, when Apollo Diamond Inc.announced that it had succeeded in growing brown-to-grayand near-colorless CVD synthetic diamond crystals in sizessuitable for faceting small cut stones.
9. Although the latest generations of CVD synthetic diamondshave few if any distinguishing visual features, they can bepositively identified through surface luminescence imagingwith instruments such as the Diamond Trading Company’sDiamondView, as well as with additional analytical tech-niques available in larger gemological laboratories.
10. Most of the faceted synthetic diamonds seen in the gemtrade to date have been small (0.30 ct and less). Most havebeen strongly colored, usually yellow or brownish yellowand occasionally blue. In addition, some pink, red, purple,green, and yellow colors have been produced by post-growth irradiation and/or heat treatment. They exhibit arange of distinctive gemological properties that allow themto be identified by gemologists.
Stuart OverlinAssociate Editor
Source: Gems & Gemology in Review: SyntheticDiamonds, a compilation of G&G articles and reportson synthetic diamonds published between 1971 and2004. Edited by Dr. James E. Shigley; published bythe Gemological Institute of America, 2005, 294 pp., illustrated.
Available now: To order, visit the GIA GemInstruments Bookstore at www.gia.edu, or call 800-421-8161. Outside the U.S. and Canada, call760-603-4200. E-mail [email protected]
Price: $49.95 plus shipping and handling
86 THE LAST PAGE GEMS & GEMOLOGY SPRING 2005
Fast Facts about
SYNTHETIC DIAMONDSLAST Page
The


![National Competency Standards For Gemologist - … [CS].pdf · National Competency Standards For Gemologist . ... the internal world of gemstone. To know the internal view of gemstones](https://static.fdocuments.us/doc/165x107/5b0453aa7f8b9a6c0b8da1a7/national-competency-standards-for-gemologist-cspdfnational-competency-standards.jpg)
