IN LATIN AMERICA & THE CARIBBEANIN LATIN AMERICA & THE CARIBBEAN For more information visit This...
1
500 1,000 1,500 2,000 4,000 VEN URY SUR DOM PER PAR PAN NIC MEX JAM HND HTI GUY GTM SLV ECU CRI COL CHL BRA BOL BHS ARG 2012 MICROFINANCE IN LATIN AMERICA & THE CARIBBEAN For more information visit WWW.FOMIN.ORG This infographic is based on primary data collected and processed by the Multilateral Investment Fund, Member of the IDB Group. It also refers to secondary information managed by the Microfinance Information Exchange, Inc (MIX), The Economist Intelligence Unit, and the Latin American Federation of Banks (FELABAN). We invite you to explore this valuable information further. Over the last 10 years, microfinance has experienced continuous growth in Latin America and the Caribbean. Through a responsible regulatory environment and strong, well-regulated microfinance institutions, more micro and small businesses and poor households have access to financing opportunities. no data under 10% 10 < 20% 20 < 30% 30 < 40% more than 40% PENETRATION of microcredit per working household Location and rank of the region’s best Microfinance Institutions 1 Banco FIE Bolivia 2 Fundación Espoir Ecuador 3 CRECER Bolivia 4 CMAC Arequipa Peru 5 BancoSol Bolivia 6 FODEMI Ecuador 7 FONDESOL Guatemala 8 Central Cresol Baser Brazil 9 CRAC Nuestra Gente Peru 10 ENLACE El Salvador 1 3 5 2 6 4 9 8 7 10 5 1 Peru 79.8 2 Bolivia 71.8 3 Pakistan 67.4 4 Philippines 63.3 5 Kenya 62.8 6 El Salvador 56.3 7 Colombia 56.0 8 Cambodia 55.7 9 Mexico 53.6 Panama 53.6 11 Ecuador 52.6 12 Paraguay 52.0 13 Chile 51.8 14 Uganda 51.6 15 Ghana 51.0 16 Brazil 49.2 17 Rwanda 48.6 18 Armenia 47.4 19 Tanzania 46.5 20 Honduras 46.3 14.9 million $18.9 billion Fondo Multilateral de Inversiones Miembro del Grupo BID TOTAL MICRO- CREDIT VOLUME THE REGION’S BEST MICROFINANCE INSTITUTIONS WHEN LOOKING AT REACH, EFFICIENCY AND TRANSPARENCY LATIN AMERICA IS THE MOST COMPETITIVE AND REGULATED MICROFINANCE MARKET CLIENTS RECEIVING MICROCREDITS MICROCREDIT PORTFOLIO BY COUNTRY in millions of US$ CLIENTS 10 15 20 2011 2010 2009 2008 2007 The microfinance industry grew by 24% in 2011 With $6 bn, Peru is by far the biggest market. Caribbean countries, Argentina and Uruguay continue to be small markets. According to Global Microscope, evaluating 55 countries worldwide. Score: 0-100 where 100=most favorable According to FOMIN, The MIX: Microfinance Americas 2012: The Top 100 YET, AVERAGE CREDIT VARIES WIDELY -1000 -500 +500 +1,000 +2,000 +3,000 VEN URY SUR DOM PER PAR PAN NIC MEX JAM HND HTI GUY GTMvv SLV ECU CRI COL CHL BRA BOL BHS ARG 9,240 1,266 Average credit is $1,266. But in Costa Rica, it is $10,505, and goes to small, rather than micro enterprises Mexico: 4.1m El Salvador: 240k Guatemala: 560k Nicaragua: 240k Costa Rica: 66k Honduras: 170k Dominican Rep: 300k Venezuela: 45k Panama: 12k Colombia: 1.8mn Ecuador: 800k Peru: 2.5m Bolivia: 860k Chile: 450k Uruguay: 13k Paraguay: 190k Brazil: 2.4m Argentina: 40k
Transcript of IN LATIN AMERICA & THE CARIBBEANIN LATIN AMERICA & THE CARIBBEAN For more information visit This...
500
1,000
1,500
2,000
4,000
VENURYSUR
DOMPERPAR
PANNIC
MEXJAMHNDHTI
GUYGTMSLVEC
UCRICOLCHL
BRA
BOL
BHS
ARG
2012MICROFINANCEIN LATIN AMERICA & THE CARIBBEAN
For more informationvisit WWW.FOMIN.ORG
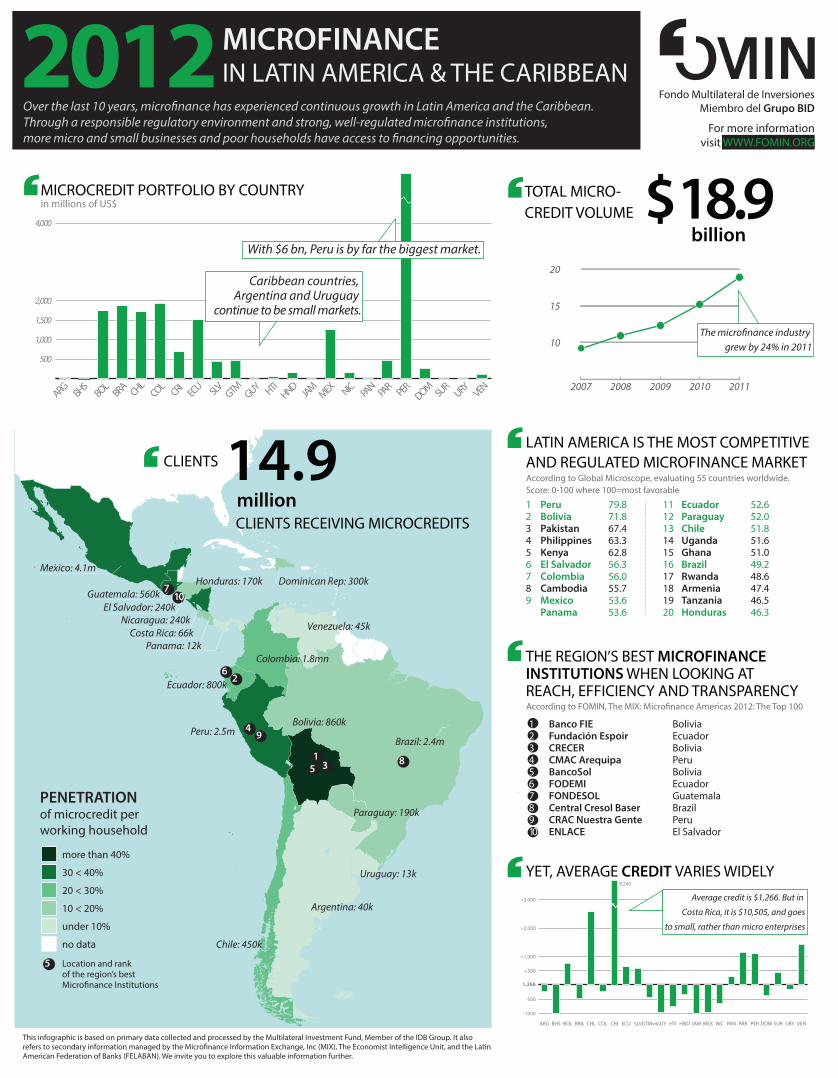
This infographic is based on primary data collected and processed by the Multilateral Investment Fund, Member of the IDB Group. It also refers to secondary information managed by the Micro�nance Information Exchange, Inc (MIX), The Economist Intelligence Unit, and the Latin American Federation of Banks (FELABAN). We invite you to explore this valuable information further.
Over the last 10 years, micro�nance has experienced continuous growth in Latin America and the Caribbean. Through a responsible regulatory environment and strong, well-regulated micro�nance institutions, more micro and small businesses and poor households have access to �nancing opportunities.
no data
under 10%
10 < 20%
20 < 30%
30 < 40%
more than 40%
PENETRATION of microcredit per working household
Location and rank of the region’s best Micro�nance Institutions
1 Banco FIE Bolivia2 Fundación Espoir Ecuador3 CRECER Bolivia4 CMAC Arequipa Peru5 BancoSol Bolivia6 FODEMI Ecuador7 FONDESOL Guatemala8 Central Cresol Baser Brazil9 CRAC Nuestra Gente Peru10 ENLACE El Salvador
135
26
49
8
710
5
1 Peru 79.82 Bolivia 71.83 Pakistan 67.44 Philippines 63.35 Kenya 62.86 El Salvador 56.37 Colombia 56.08 Cambodia 55.79 Mexico 53.6 Panama 53.6
11 Ecuador 52.612 Paraguay 52.013 Chile 51.814 Uganda 51.615 Ghana 51.016 Brazil 49.217 Rwanda 48.618 Armenia 47.419 Tanzania 46.520 Honduras 46.3
14.9 million
$18.9 billion
Fondo Multilateral de InversionesMiembro del Grupo BID
TOTAL MICRO-CREDIT VOLUME
THE REGION’S BEST MICROFINANCE INSTITUTIONS WHEN LOOKING AT REACH, EFFICIENCY AND TRANSPARENCY
LATIN AMERICA IS THE MOST COMPETITIVEAND REGULATED MICROFINANCE MARKET
CLIENTS RECEIVING MICROCREDITS
MICROCREDIT PORTFOLIO BY COUNTRYin millions of US$
CLIENTS
10
15
20
20112010200920082007
The micro�nance industry grew by 24% in 2011
With $6 bn, Peru is by far the biggest market.
Caribbean countries, Argentina and Uruguay
continue to be small markets.
According to Global Microscope, evaluating 55 countries worldwide. Score: 0-100 where 100=most favorable
According to FOMIN, The MIX: Micro�nance Americas 2012: The Top 100
YET, AVERAGE CREDIT VARIES WIDELY
-1000
-500
+500
+1,000
+2,000
+3,000
VENURYSURDOMPERPARPANNICMEXJAMHNDHTIGUYGTMvvSLVECUCRICOLCHLBRABOLBHSARG
9,240
1,266
Average credit is $1,266. But in
Costa Rica, it is $10,505, and goes
to small, rather than micro enterprises
Mexico: 4.1m
El Salvador: 240kGuatemala: 560k
Nicaragua: 240kCosta Rica: 66k
Honduras: 170k Dominican Rep: 300k
Venezuela: 45k
Panama: 12kColombia: 1.8mn
Ecuador: 800k
Peru: 2.5mBolivia: 860k
Chile: 450k
Uruguay: 13k
Paraguay: 190k
Brazil: 2.4m
Argentina: 40k