In-depth analysis of data on food and nutrition security ... In-depth analysis of data on food and...
20
1 In-depth analysis of data on food and nutrition security situation in the Indian state of Madhya Pradesh Food and Nutrition Security, Enhanced Resilience Programme (FaNS), India Archana Sarkar, Barbara Walter, Vandana Sabharwal, Michael Klingler May 2017
Transcript of In-depth analysis of data on food and nutrition security ... In-depth analysis of data on food and...
1
In-depth analysis of data on food and nutrition security situation in the Indian state of Madhya
Pradesh
Food and Nutrition Security, Enhanced Resilience Programme (FaNS), India
Archana Sarkar, Barbara Walter, Vandana Sabharwal, Michael Klingler
May 2017
2
Contents Contents .....................................................................................................................................2 List of Tables ..............................................................................................................................2 List of Figures .............................................................................................................................2 List of Abbreviations ....................................................................................................................2 1) Summary ................................................................................................................................3 2) In-Depth Analysis ....................................................................................................................5
2.1 Purpose of the re-analysis .................................................................................................5 2.1 Methodological approach of the in-depth analysis ..............................................................6 2.3 Findings .............................................................................................................................6
3) Conclusion ............................................................................................................................ 19
List of Tables Table 1 Data on Caste vs. Individual Dietary Diversity of Women ...............................................7 Table 2 Data on caste vs. infants of 6 - 23 months who receive a minimum acceptable diet .......8 Table 3 Association of caste vs. Food insecurity severity experienced by households ................9 Table 4 Data on educational status vs. Individual Dietary Diversity of Women .......................... 11 Table 5: Data on educational status vs. infants of 6 - 23 months who receive a minimum acceptable diet .......................................................................................................................... 11 Table 6 Data on educational status vs. Food insecurity severity experienced by households .... 12 Table 7 Data on income category vs. Individual Dietary Diversity of Women ............................ 14 Table 8 Data on income vs. infants of 6 - 23 months who receive a minimum acceptable diet .. 14 Table 9 Data on income vs. Food insecurity severity experienced by households .................... 15 Table 10 Correlation Matrix ....................................................................................................... 16 Table 11 Logistic Regression Analysis showing the factors affecting Individual Dietary Diversity Scores of Women ..................................................................................................................... 18 Table 12 Logistic Regression Analysis Showing the Factors Affecting Minimum Adequacy of Diet for Children ........................................................................................................................ 19
List of Figures Figure 1 Results of the NBS presented according to the UNICEF Model ....................................5 Figure 2 Effect of Caste on IDDS, MAD, HFIES Scores and TPDS Scheme ............................. 10 Figure 3 Effect of Educational Status on IDDS, MAD, HFIES Scores and TPDS Scheme ......... 13
List of Abbreviations MAD Minimum Acceptable Diet
IDDS Individual Dietary Diversity Score
HFIES Household Food Insecurity Experience Scale
TPDS Targeted Public Distribution System
NBS Nutrition Baseline Survey

3
The caste system was originally a first attempt to divide
labour with the society as it is based on the belief that each group was born with an unchangeable nature and capacity to do certain kind of work. Within a lifetime generally nobody is able to leave the assigned group. The exploitation of this system went so far that certain groups were seen as ‘untouchables’ not being allowed to even get close to one of the higher ranking groups. The former untouchables are today recognized as the so called “scheduled castes” and “scheduled tribes” also known as Dalits and Adivasi. Even though discrimination in any form has been officially discarded by the Indian Constitution in 1950, the system is still very important for the social and economic fabric of the country especially in rural settings. Although the Government has introduced a lot of schemes and even service quotas for improving the social and economic situation of the lowest ranking groups, discriminative practices persist. People belonging to Scheduled castes and Scheduled tribes often live in isolated and separate clusters and are denied access to common services like wells or water-taps located in the areas where higher caste people live in the villages. .
1) Summary
Why looking into the data again? The key findings of the International Baseline included low dietary
diversity among women of reproductive age and children (6-23 months of age) in the intervention districts
of Sheopur and Chhatarpur in Madhya Pradesh, India. Only 16.2% of children had achieved the Minimum
Acceptable Diet (MAD); whereas more than 80% of women had an average of less than 5 food groups
consumed daily and 77% of children had consumed less than 4 food-groups daily.
Given these alarming findings, the in-depth analysis of the International Baseline data was conducted to
have a further understanding of various socio-demographic factors, behavioral practices and access to
services affecting the dietary diversity and food availability among women and children.
The project wanted to understand better how underlying factors are influencing the nutrition diversity and
food security situation of its target group (women and children). This should also help to tailor the ongoing
activities of the project especially concerning the nutrition awareness programme better to the specific
conditions for example influence of social factors like caste or environmental circumstances such as water
shortage.
What we found:
Caste status influences every aspect of social
life especially in the Indian rural areas.
Scheduled castes and scheduled tribes in Indian
context are the most vulnerable in terms of their
social, economic characteristics and health
facilities access. The study revealed that it
further determines how many different food
groups or how many meals women have.
Women who belonged to the scheduled tribes
(isolated and so called low ranking group) had a
significantly lower value for the Individual
Dietary Diversity Score (IDDS) compared to
women belonging to the general category
(29.5% vs 9%; χ2 = 20.294; p<0.001). This was
also reflected in the food security status of
scheduled tribes who were the most food
insecure group surveyed. District wise, in
Chhatarpur, fewer respondents were severely
food insecure as compared to those in Sheopur.
However, infants who receive a minimum acceptable diet remained low irrespective of caste (χ2 = 71.0;
p<0.001).
With better educational status comes a better nutrition status for mother and children in terms of IDDS
and MAD respectively. Also, income stability matters for a stable food situation. Households having
stable income source (example: sale of own crops/goods/crafts/regular salary income) were more food
4
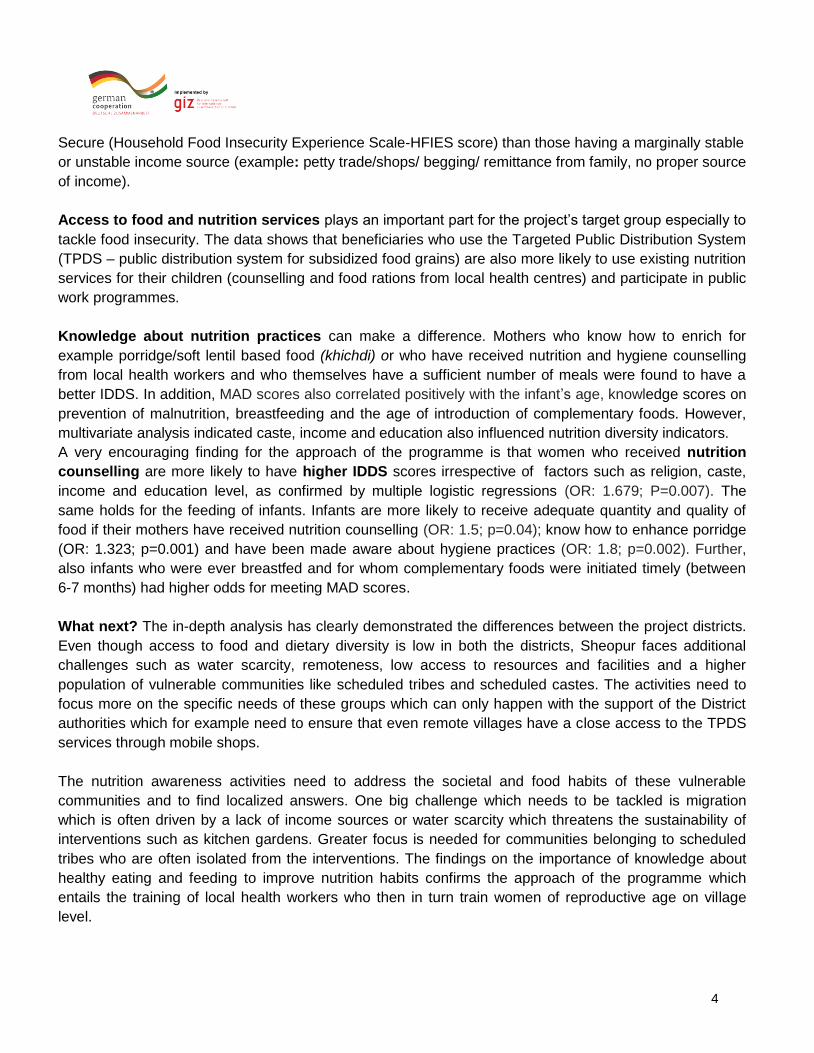
Secure (Household Food Insecurity Experience Scale-HFIES score) than those having a marginally stable
or unstable income source (example: petty trade/shops/ begging/ remittance from family, no proper source
of income).
Access to food and nutrition services plays an important part for the project’s target group especially to
tackle food insecurity. The data shows that beneficiaries who use the Targeted Public Distribution System
(TPDS – public distribution system for subsidized food grains) are also more likely to use existing nutrition
services for their children (counselling and food rations from local health centres) and participate in public
work programmes.
Knowledge about nutrition practices can make a difference. Mothers who know how to enrich for
example porridge/soft lentil based food (khichdi) or who have received nutrition and hygiene counselling
from local health workers and who themselves have a sufficient number of meals were found to have a
better IDDS. In addition, MAD scores also correlated positively with the infant’s age, knowledge scores on
prevention of malnutrition, breastfeeding and the age of introduction of complementary foods. However,
multivariate analysis indicated caste, income and education also influenced nutrition diversity indicators.
A very encouraging finding for the approach of the programme is that women who received nutrition
counselling are more likely to have higher IDDS scores irrespective of factors such as religion, caste,
income and education level, as confirmed by multiple logistic regressions (OR: 1.679; P=0.007). The
same holds for the feeding of infants. Infants are more likely to receive adequate quantity and quality of
food if their mothers have received nutrition counselling (OR: 1.5; p=0.04); know how to enhance porridge
(OR: 1.323; p=0.001) and have been made aware about hygiene practices (OR: 1.8; p=0.002). Further,
also infants who were ever breastfed and for whom complementary foods were initiated timely (between
6-7 months) had higher odds for meeting MAD scores.
What next? The in-depth analysis has clearly demonstrated the differences between the project districts.
Even though access to food and dietary diversity is low in both the districts, Sheopur faces additional
challenges such as water scarcity, remoteness, low access to resources and facilities and a higher
population of vulnerable communities like scheduled tribes and scheduled castes. The activities need to
focus more on the specific needs of these groups which can only happen with the support of the District
authorities which for example need to ensure that even remote villages have a close access to the TPDS
services through mobile shops.
The nutrition awareness activities need to address the societal and food habits of these vulnerable
communities and to find localized answers. One big challenge which needs to be tackled is migration
which is often driven by a lack of income sources or water scarcity which threatens the sustainability of
interventions such as kitchen gardens. Greater focus is needed for communities belonging to scheduled
tribes who are often isolated from the interventions. The findings on the importance of knowledge about
healthy eating and feeding to improve nutrition habits confirms the approach of the programme which
entails the training of local health workers who then in turn train women of reproductive age on village
level.
5
The in-depth analysis also shows how important it is to take into account the difference between the two
districts especially in terms of the social groups when designing a research study. For further studies it
needs to be ensured that the sample reflects the different population shares of the district so that the
situation of the scheduled tribes and scheduled castes is reflected in the collected data and analysis. An
in-depth analysis of the International Baseline data of all countries which are part of the global programme
on food and nutrition security, enhanced resilience can provide key evidence on dietary diversity and food
security context in different regions.
2) In-Depth Analysis 2.1 Purpose of the re-analysis The Nutrition Baseline Survey (NBS) was conducted among women of reproductive age (15-49 years),
infants and young children between the age of 6-23 months in India in January and February 2016. The
main objective of this survey was to describe the nutrition situation among the target groups in rural areas
of the districts Chhatarpur and Sheopur in the Indian state of Madhya Pradesh. Of special interest were
Minimum Acceptable Diet (MAD) of infants and young children and Individual Dietary Diversity Scores for
women (IDDS). The study examined linkages between dietary diversity and complementary feeding
practices with living conditions as well as with knowledge and practices in regard to hygiene and nutrition.
The key findings of the baseline included low dietary diversity in women and children (6-23 months of
age), high prevalence of diarrhoea and low levels of knowledge among women on nutritional, hygiene and
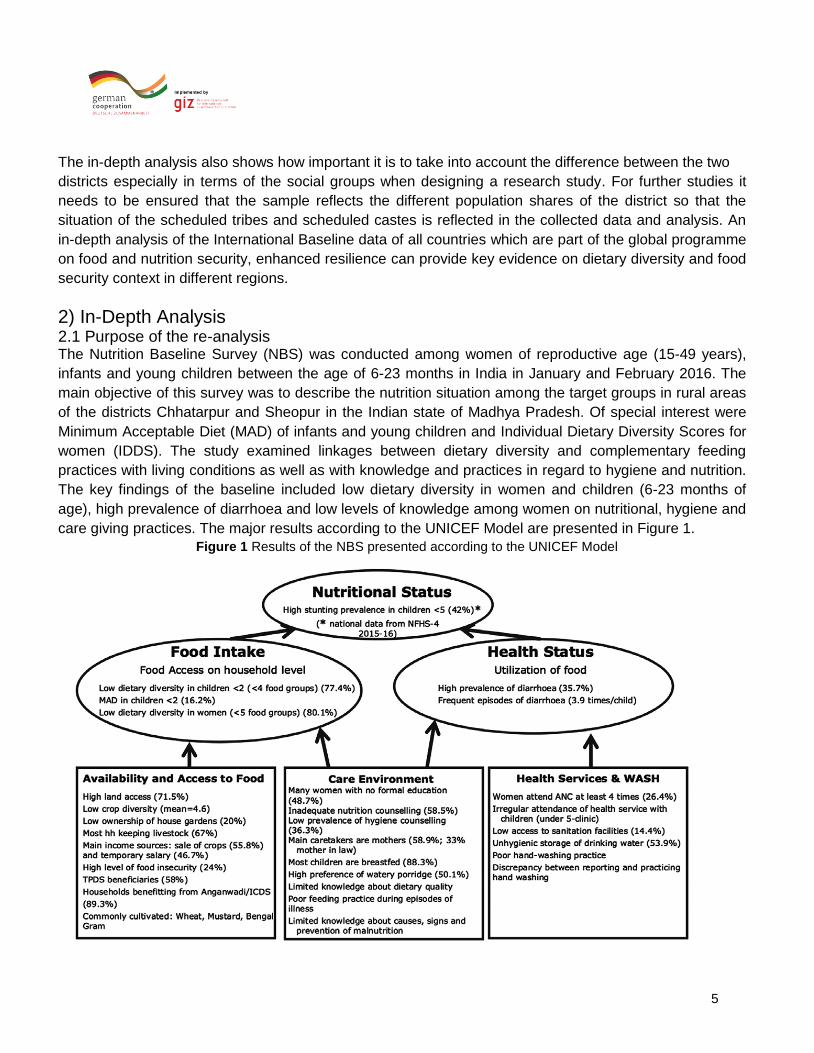
care giving practices. The major results according to the UNICEF Model are presented in Figure 1.
Figure 1 Results of the NBS presented according to the UNICEF Model
6
An in-depth analysis of the International baseline data was carried out in order to foster a better
understanding of various factors (socio-economic, demographic, availability of counselling services and
mother’s feeding practices) affecting nutritional intake of women and infants in the study districts.
2.1 Methodological approach of the in-depth analysis The in-depth analysis has re-analysed the findings by the variables of caste, education and income to
understand their effects on the IDDS for women, the MAD for children (defined as receiving at least
minimum dietary diversity and minimum meal frequency), household food insecurity status as well as
usage of the TPDS scheme. Chi-square tests have been applied in order to examine statistical
differences at a 0.05 level of significance. Further, correlation analysis has been conducted to
understand factors influencing IDDS and MAD. For this, the spearman rank correlation has been
employed at 0.05 level of significance. Thereafter, advanced multivariate logistic regression analysis has
been run to understand the effect/role of vulnerability factors on MAD and IDDS. Few variables were re-
categorized for the study, these include age of the mother, income, nutritional counselling and age of
introduction of starting complementary foods:
The age of mother was reported as a continuous variable in the study, however, the re-analysis treated it as a categorical variable: <=20 years, 21-25 years, 26-30 years, and > 30 years.
The data on source of income was also re-categorized as no /marginal income, temporary income and permanent income. No /marginal income included subsistence farming and begging/rag picking; temporary income included temporary salary, petty trade/small business, remittance from relatives/husband as well as income generated by sales or exchange of public transfers; permanent income included sale of own produced crops, sale of own produced goods/crafts and regular salary.
In case of nutritional counselling recoding was done in two categories, one for those who received no counselling and the other for those who received at least one or more counselling sessions.
Since the age of starting complementary feeding should be ideally between 6-7 months, this variable was recoded into four categories: those who have not received any complementary foods, complementary foods started before 6 months, complementary foods started between 6-7 months and complementary foods started after 7 months.
2.3 Findings
a) Association of Caste (Social Group) with IDDS, MAD AND HFIES Scores
Caste had a statistically significant effect on individual dietary diversity scores of women as shown in
table 1. Women belonging to vulnerable tribal communities’ (Scheduled tribes) had significantly lower
dietary diversity scores as compared to other women in the sample. IDDS (consuming the recommended
>=5 food groups) was higher for women belonging to general category as compared to other castes.
Women belonging to scheduled tribes had the lowest minimum dietary diversity (9%). Similar trends
were seen in Sheopur. In Chhatarpur, women in the general category had better individual dietary
diversity scores however, no statistical difference was observed. In general the IDDS was better in

7
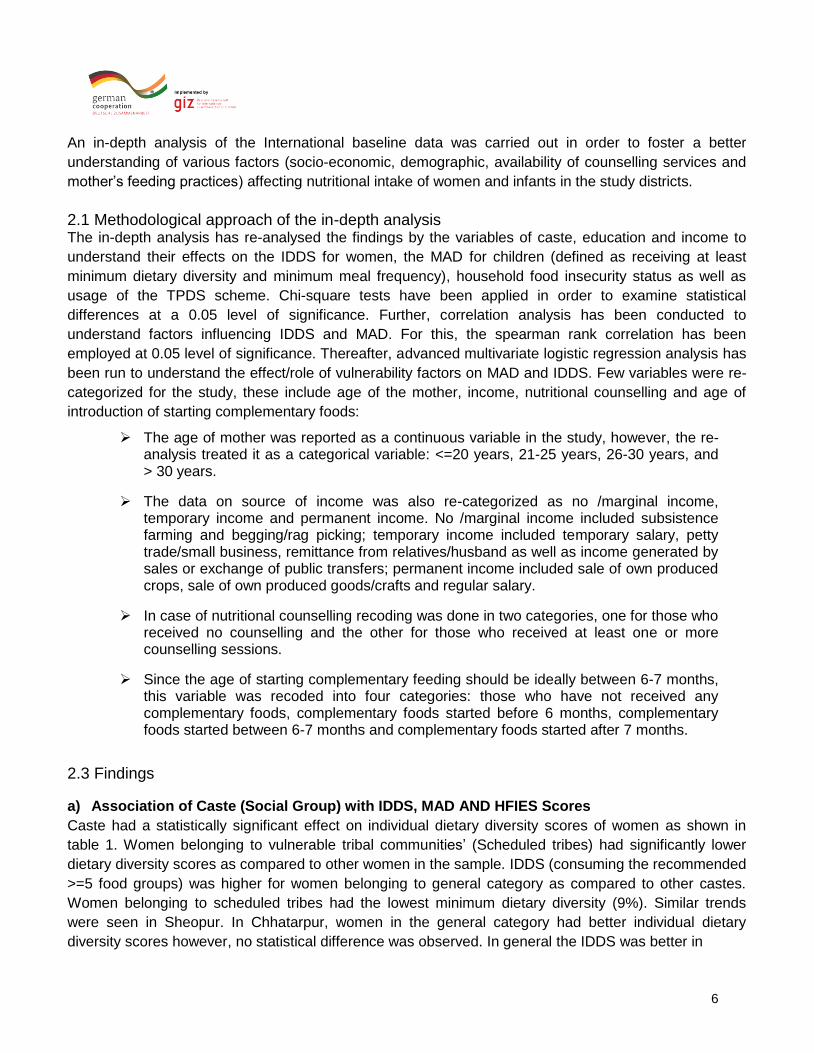
women belonging to Chhatarpur as compared to Sheopur. Table 2 indicates that the share of infants
of 6- 23 months who receive a minimum acceptable diet remained low irrespective of caste (p<0.05).
However, more infants of 6 - 23 months received a minimum acceptable diet in Chhatarpur (20.3 %)
than in Sheopur (12.0%). Severe food insecurity was least prevalent among the general caste
followed by other backward classes while respondents from the group of scheduled tribes were the
most food insecure (p<0.05). Similar trends were seen in Sheopur (Table 3). In Chhatarpur, fewer
respondents were severely food insecure as compared to those in Sheopur (Fig 2). Further, in
Chhatarpur, no statistical difference was observed concerning the relation of caste and food
insecurity.
Table 1 Data on Caste vs. Individual Dietary Diversity of Women
Caste Chhatarpur Sheopur Pooled Sample#
N Women who
received 5 or more
food groups
N Women who
received 5 or more
food groups
N Women who
received 5 or more
food groups
No Yes No Yes No Yes
Scheduled
Caste
57 40 (70.2) 17 (29.8) 67 58 (86.6) 9 (13.4) 124 98 (79.0) 26 (21.0)
Scheduled
Tribe
38 31 (81.6) 7 (18.4) 139 130 (93.5) 9 (6.5) 177 161 (91) 16 (9.0)
Other
Backward
Caste
256 189
(73.8)
67 (26.2) 166 139 (83.7) 27 (16.3) 422 328
(77.7)
94 (22.3)
General 48 33 (68.8) 15 (31.3) 30 22 (73.3) 8 (26.7) 78 55 (70.5) 23 (29.5)
Total 399 293
(73.3)
106
(26.8)
402 349 (86.8) 53 (13.2) 801 642
(80.1)
159 (19.9)
Chi-Square
Value
χ2= 4.898; p = 0.298 χ2= 11.778; p = 0.019 χ2= 20.294; p = 0.000
Figure in the parenthesis indicate percentages; # Pooled Chhatarpur & Sheopur Sample
8
Table 2 Data on caste vs. infants of 6 - 23 months who receive a minimum acceptable diet
Caste Chhatarpur Sheopur Pooled Sample#
N Infants of 6 - 23
months who
receive a minimum
acceptable diet
N Infants of 6 - 23
months who receive
a minimum
acceptable diet
N Infants of 6 - 23
months who receive
a minimum
acceptable diet
No Yes No Yes No Yes
Scheduled
Caste
56 40 (71.4) 16 (28.6) 66 59 (89.4) 7 (10.6) 122 99 (81.1) 23 (18.9)
Scheduled
Tribe
36 30 (83.3) 6 (16.7) 133 119 (89.5) 14 (10.5) 169 149
(88.2)
20 (11.8)
Other
Backward
Caste
253 205
(81.0)
48 (19.0) 163 142 (87.1) 21 (12.9) 416 347(83.4) 69 (16.6)
General 48 39 (81.3) 9 (18.8) 29 24 (82.8) 5 (17.2) 77 63 (81.8) 14 (18.2)
Total 393 314
(79.7)
79 (20.3) 391 344 (88.0) 47 (12.0) 784 658
(83.8)
126 (16.2)
Chi-Square
Value
χ2 = 6.934; p = 0.139 χ2= 1.407; p = 0.843 χ2 = 4.966; p = 0.291
Figure in the parenthesis indicate percentages; # Pooled Chhatarpur & Sheopur Sample

9
Table 3 Association of caste vs. Food insecurity severity experienced by households
Caste Chhatarpur Sheopur Pooled Sample (Chhatarpur & Sheopur)
N Food insecurity severity experienced by
households
N Food insecurity severity experienced by
households
N Food insecurity severity experienced by
households
Food
secure
Mild food
insecure
Moderate
food
insecure
Severe
food
insecure
Food
secure
Mild food
insecure
Moderate
food
insecure
Severe
food
insecure
Food
secure
Mild
food
insecure
Moderate
food
insecure
Severe
food
insecure
Scheduled
Caste
55 22
(40.0)
21
(38.2)
8
(14.5)
4
(7.3)
67 44
(65.7)
21
(31.3)
1
(1.5)
1
(1.5)
122 66
(54.1)
42
(34.4)
9
(7.4)
5
(4.1)
Schedule
Tribe
36 10
(27.8)
17
(47.2)
7
(19.4)
2
(5.6)
139 40
(28.8)
53
(38.1)
30
(21.6)
16
(11.5)
175 50
(28.6)
70
(40.0)
37
(21.1)
18
(10.3)
Other
Backward
Caste
245 112
(45.7)
103
(42.0)
27
(11.0)
3
(1.2)
166 113
(68.1)
37
(22.3)
12
(7.2)
4
(2.4)
411 225
(54.7)
140
(34.1)
39
(9.5)
7
(1.7)
General 48 27
(56.3)
14
(29.2)
6
(12.5)
1
(2.1)
30 26
(86.7)
3
(10.0)
1
(3.3)
0
(0.0)
78 53
(67.9)
17
(21.8)
7
(9.0)
1
(1.3)
Total 384 171
(44.7)
155
(40.3)
48
(12.5)
10
(2.6)
402 223
(55.3)
114
(28.5)
44
(10.9)
21
(5.2)
786 394
(50.1)
269
(34.3)
92
(11.7)
31
(3.9)
Chi-
Square
Value
χ2= 17.135; p = 0.145 χ2 = 82.268; p = 0.000 χ2= 71.063; p = 0.000

10
Figure 2 Effect of Caste on IDDS, MAD, HFIES Scores and TPDS Scheme
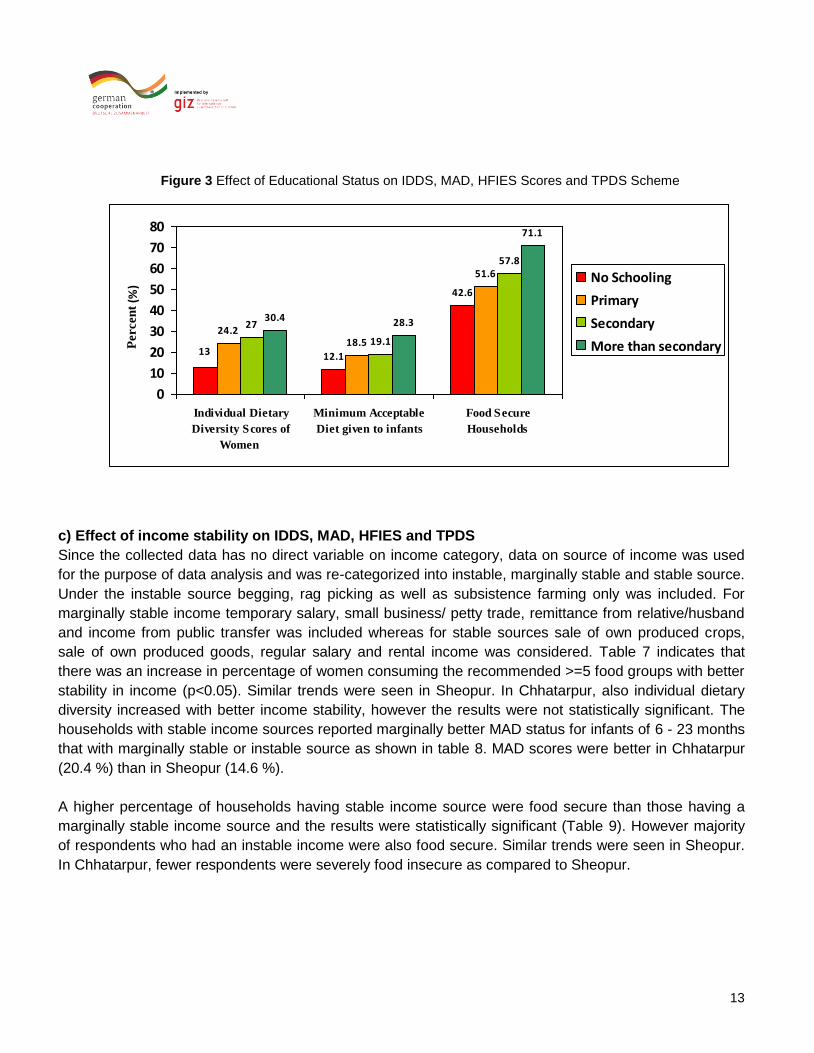
b) Effect of educational status on IDDS, MAD, HFIES Scores and TPDS
Although very few women in the study population (19.9%) had scored well on individual dietary diversity,
there was an increase in percentage of women consuming the recommended >=5 food groups with better
educational status (p<0.05) as shown in table 4. Similar trends were seen in Sheopur. In Chhatarpur, also
individual dietary diversity increased with better educational status, however the results were not
statistically significant. In general individual dietary diversity was better in women belonging to Chhatarpur
as compared to Sheopur. As shown in table 5, infants of 6 - 23 months who receive a minimum acceptable
diet remained low in the study population. However, more Infants of 6 - 23 months received a minimum
acceptable diet whose mother were better educated. MAD scores were better in Chhatarpur (20.3%) than in
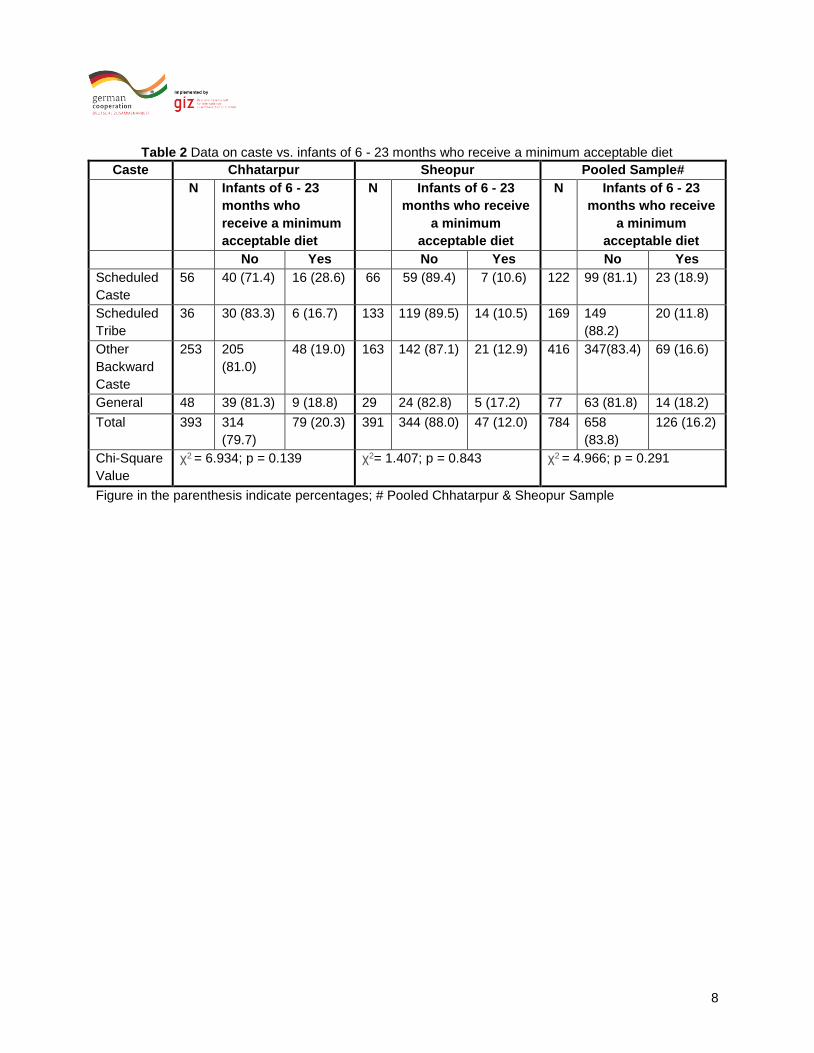
Sheopur (12.0%). A higher percentage of household having mothers who had received education higher
than secondary were food secure (Table 6). In general food security increased with increase in educational
status (p<0.05). Similar trends were seen in Sheopur. In Chhatarpur, fewer respondents were severely food
insecure as compared to those in Sheopur. Further, in Chhatarpur, no statistical difference was observed
with education in status of food insecurity.
18.9
54.1
9 11.8
28.622.3
16.6
54.7
29.5
18.2
67.9
21
0
10
20
30
40
50
60
70
80
Individual Dietary
Diversity Scores of
Women
Minimum Acceptable
Diet given to infants
Food Secure Households
Per
cen
t (%
)
Schedule Caste
Schedule Tribes
Other Backward Classes
General

11
Table 4 Data on educational status vs. Individual Dietary Diversity of Women
Educational
status
Chhatarpur Sheopur Pooled Sample#
N Women who
received 5 or more
food groups
N Women who
received 5 or more
food groups
N Women who
received 5 or more
food groups
No Yes No Yes No Yes
No
Schooling
150 121
(80.7)
29
(19.3)
242 220
(90.9)
22
(9.1)
392 341
(87.0)
51
(13.0)
Primary 73 52
(71.2)
21
(28.8)
55 45
(81.8)
10
(18.2)
128 97 (75.8) 31
(24.2)
Secondary 149 102
(68.5)
47
(31.5)
88 71
(80.7)
17
(19.3)
237 173
(73.0)
64
(27.0)
More than
secondary
28 18
(64.3)
10
(35.7)
18 14
(77.8)
4
(22.2)
46 32
(69.6)
14
(30.4)
Total 400 293
(73.3)
107
(26.8)
403 350
(86.8)
53
(13.2)
803 643
(80.1)
160
(19.9)
Chi-Square
(λ2)Value
χ2 = 7.258; p = 0.064 χ2 =8.939; p = 0.030 χ2= 23.855; p = 0.000
Figure in the parenthesis indicate percentages; # Pooled Chhatarpur & Sheopur Sample
Table 5: Data on educational status vs. infants of 6 - 23 months who receive a minimum acceptable diet
Educational
status
Chhatarpur Sheopur Pooled Sample
N Infants of 6 - 23
months who
receive a minimum
acceptable diet
N Infants of 6 - 23
months who receive
a minimum
acceptable diet
N Infants of 6 - 23
months who receive
a minimum
acceptable diet
No Yes No Yes No Yes
No
Schooling
146 119
(81.5)
27 (18.5) 234 215 (91.9) 19
(8.1)
380 334
(87.9)
46
(12.1)
Primary 71 56 (78.9) 15 (21.1) 53 45
(89.5)
8
(10.5)
124 101
(81.5)
23
(18.5)
Secondary 149 122
(81.9)
27 (18.1) 87 69
(79.3)
18 (20.7) 236 191
(80.9)
45
(19.1)
More than
secondary
48 17 (60.7) 11 (39.3) 18 16 (88.9) 2 (11.1) 46 33 (71.7) 13
(28.3)
Total 394 314
(79.7)
80 (20.3) 392 345 (88.0) 47 (12.0) 786 659
(83.8)
127 (16.2)
Chi-Square
(λ2) Value
χ2 = 6.999; p = 0.072 χ2= 10.059; p = 0.018 χ2 = 11.579; p = 0.009
Figure in the parenthesis indicate percentages; # Pooled Chhatarpur & Sheopur Sample
12
Table 6 Data on educational status vs. Food insecurity severity experienced by households
Educatio
nal status
Chhatarpur Sheopur Pooled Sample (Chhatarpur & Sheopur)
N Food insecurity severity
experienced by households
N Food insecurity severity experienced
by households
N Food insecurity severity experienced by
households
Food
secure
Mild food
insecure
Moderate
food
insecure
Severe
food
insecure
Food
secure
Mild food
insecure
Moderate
food
insecure
Severe
food
insecure
Food
secure
Mild food
insecure
Moderate
food
insecure
Severe
food
insecure
No
Schooling
14
3
53
(37.1)
62
(43.4)
23
(16.1)
5
(3.5)
24
2
111
(45.9)
77
(31.8)
37
(15.3)
17
(7.0)
38
5
166
(42.6)
139
(36.1)
60
(15.6)
22
(5.7)
Primary 71 30
(42.7)
31
(43.7)
7
(9.9)
3
(5.6)
55 35
(63.6)
16
(29.1)
2
(3.6)
2
(3.6)
12
6
65
(51.6)
47
(37.3)
9
(7.1)
5
(4.0)
Secondar
y
14
4
73
(50.7)
54
(37.5)
16
(11.1)
1
(0.7)
88 61
(69.3)
21
(23.9)
4
(4.5)
2
(2.3)
23
2
134
(57.8)
75
(32.3)
20
(8.6)
3
(1.3)
More than
secondary
27 16
(59.3)
8
(29.6)
2
(7.4)
1
(3.7)
18 16
(88.9)
1
(5.6)
1
(5.6)
0
(0.0)
45 32
(71.1)
9
(20.0)
3
(6.7)
1
(2.2)
Total 38
5
172
(44.7)
155
(40.3)
48
(12.5)
10
(2.6)
40
3
223
(55.3)
115
(28.5)
44
(10.9)
21
(5.2)
78
8
395
(50.1)
270
(34.3)
92
(11.7)
31
(3.9)
Chi-
Square λ2
Value
χ2= 11.935; p = 0.217 χ2= 31.139; p = 0.000 χ2 = 32.330; p = 0.000
Figure in the parenthesis indicate percentages; # Pooled Chhatarpur & Sheopur Sample
13
Figure 3 Effect of Educational Status on IDDS, MAD, HFIES Scores and TPDS Scheme
c) Effect of income stability on IDDS, MAD, HFIES and TPDS
Since the collected data has no direct variable on income category, data on source of income was used
for the purpose of data analysis and was re-categorized into instable, marginally stable and stable source.
Under the instable source begging, rag picking as well as subsistence farming only was included. For
marginally stable income temporary salary, small business/ petty trade, remittance from relative/husband
and income from public transfer was included whereas for stable sources sale of own produced crops,
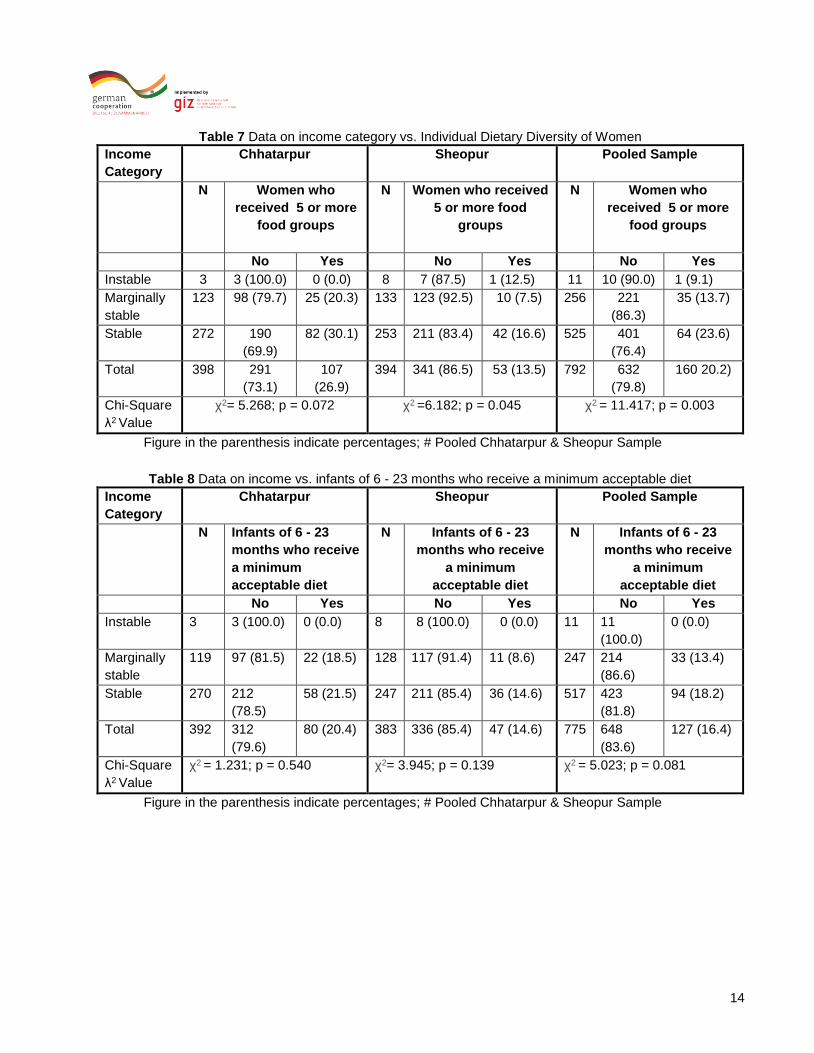
sale of own produced goods, regular salary and rental income was considered. Table 7 indicates that
there was an increase in percentage of women consuming the recommended >=5 food groups with better
stability in income (p<0.05). Similar trends were seen in Sheopur. In Chhatarpur, also individual dietary
diversity increased with better income stability, however the results were not statistically significant. The
households with stable income sources reported marginally better MAD status for infants of 6 - 23 months
that with marginally stable or instable source as shown in table 8. MAD scores were better in Chhatarpur
(20.4 %) than in Sheopur (14.6 %).
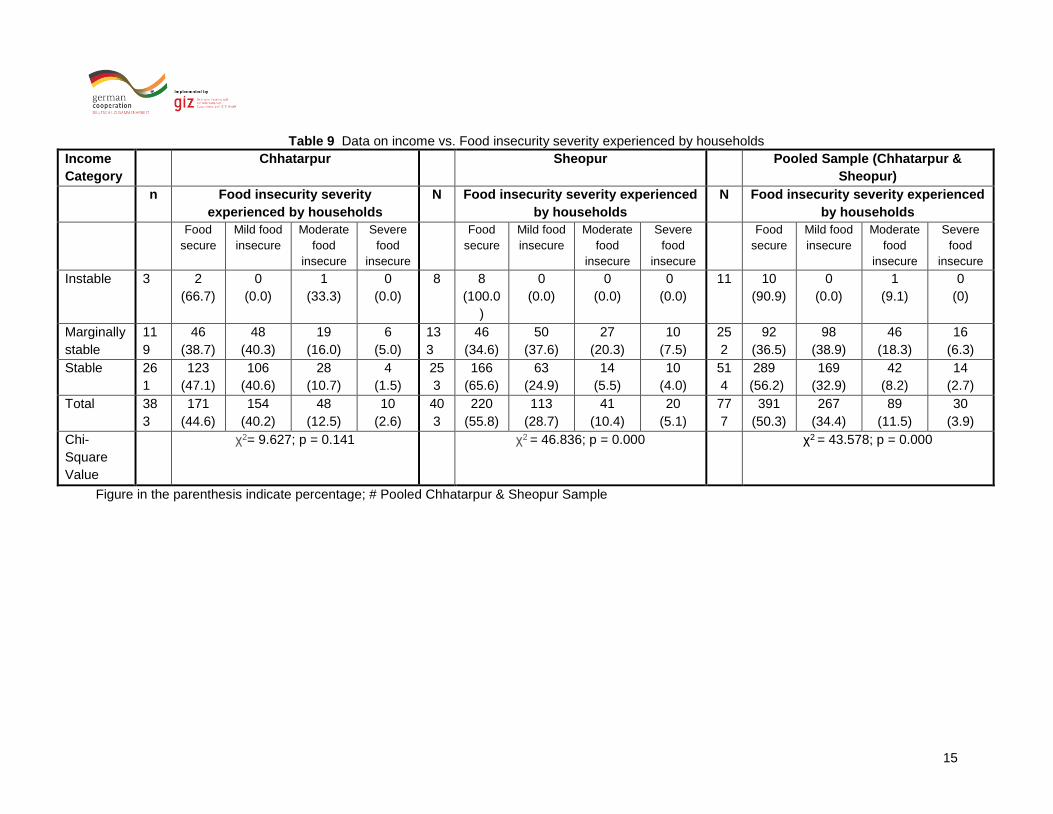
A higher percentage of households having stable income source were food secure than those having a
marginally stable income source and the results were statistically significant (Table 9). However majority
of respondents who had an instable income were also food secure. Similar trends were seen in Sheopur.
In Chhatarpur, fewer respondents were severely food insecure as compared to Sheopur.
12.1
42.6
24.218.5
51.6
27
19.1
57.8
30.4 28.3
71.1
13
0
10
20
30
40
50
60
70
80
Individual Dietary
Diversity Scores of
Women
Minimum Acceptable
Diet given to infants
Food Secure
Households
No Schooling
Primary
Secondary
More than secondaryPercen
t (%
)
14
Table 7 Data on income category vs. Individual Dietary Diversity of Women
Income
Category
Chhatarpur Sheopur Pooled Sample
N Women who
received 5 or more
food groups
N Women who received
5 or more food
groups
N Women who
received 5 or more
food groups
No Yes No Yes No Yes
Instable 3 3 (100.0) 0 (0.0) 8 7 (87.5) 1 (12.5) 11 10 (90.0) 1 (9.1)
Marginally
stable
123 98 (79.7) 25 (20.3) 133 123 (92.5) 10 (7.5) 256 221
(86.3)
35 (13.7)
Stable 272 190
(69.9)
82 (30.1) 253 211 (83.4) 42 (16.6) 525 401
(76.4)
64 (23.6)
Total 398 291
(73.1)
107
(26.9)
394 341 (86.5) 53 (13.5) 792 632
(79.8)
160 20.2)
Chi-Square
λ2 Value
χ2= 5.268; p = 0.072 χ2 =6.182; p = 0.045 χ2 = 11.417; p = 0.003
Figure in the parenthesis indicate percentages; # Pooled Chhatarpur & Sheopur Sample
Table 8 Data on income vs. infants of 6 - 23 months who receive a minimum acceptable diet
Income
Category
Chhatarpur Sheopur Pooled Sample
N Infants of 6 - 23
months who receive
a minimum
acceptable diet
N Infants of 6 - 23
months who receive
a minimum
acceptable diet
N Infants of 6 - 23
months who receive
a minimum
acceptable diet
No Yes No Yes No Yes
Instable 3 3 (100.0) 0 (0.0) 8 8 (100.0) 0 (0.0) 11 11
(100.0)
0 (0.0)
Marginally
stable
119 97 (81.5) 22 (18.5) 128 117 (91.4) 11 (8.6) 247 214
(86.6)
33 (13.4)
Stable 270 212
(78.5)
58 (21.5) 247 211 (85.4) 36 (14.6) 517 423
(81.8)
94 (18.2)
Total 392 312
(79.6)
80 (20.4) 383 336 (85.4) 47 (14.6) 775 648
(83.6)
127 (16.4)
Chi-Square
λ2 Value
χ2 = 1.231; p = 0.540 χ2= 3.945; p = 0.139 χ2 = 5.023; p = 0.081
Figure in the parenthesis indicate percentages; # Pooled Chhatarpur & Sheopur Sample
15
Table 9 Data on income vs. Food insecurity severity experienced by households
Income
Category
Chhatarpur Sheopur Pooled Sample (Chhatarpur &
Sheopur)
n Food insecurity severity
experienced by households
N Food insecurity severity experienced
by households
N Food insecurity severity experienced
by households
Food
secure
Mild food
insecure
Moderate
food
insecure
Severe
food
insecure
Food
secure
Mild food
insecure
Moderate
food
insecure
Severe
food
insecure
Food
secure
Mild food
insecure
Moderate
food
insecure
Severe
food
insecure
Instable 3 2
(66.7)
0
(0.0)
1
(33.3)
0
(0.0)
8 8
(100.0
)
0
(0.0)
0
(0.0)
0
(0.0)
11 10
(90.9)
0
(0.0)
1
(9.1)
0
(0)
Marginally
stable
11
9
46
(38.7)
48
(40.3)
19
(16.0)
6
(5.0)
13
3
46
(34.6)
50
(37.6)
27
(20.3)
10
(7.5)
25
2
92
(36.5)
98
(38.9)
46
(18.3)
16
(6.3)
Stable 26
1
123
(47.1)
106
(40.6)
28
(10.7)
4
(1.5)
25
3
166
(65.6)
63
(24.9)
14
(5.5)
10
(4.0)
51
4
289
(56.2)
169
(32.9)
42
(8.2)
14
(2.7)
Total 38
3
171
(44.6)
154
(40.2)
48
(12.5)
10
(2.6)
40
3
220
(55.8)
113
(28.7)
41
(10.4)
20
(5.1)
77
7
391
(50.3)
267
(34.4)
89
(11.5)
30
(3.9)
Chi-
Square
Value
χ2= 9.627; p = 0.141 χ2 = 46.836; p = 0.000 χ2 = 43.578; p = 0.000
Figure in the parenthesis indicate percentage; # Pooled Chhatarpur & Sheopur Sample

16
d) Correlation results
The data was further treated to understand the factors affecting IDDS scores, MAD scores and TPDS
utility using Spearman Rank correlation and the results were considered statistically significant at 0.05
level of significance. The IDDS scores were positively associated with education, income stability,
Household land access, nutrition counselling received, hygienic counselling received, knowledge scores
of food consumption during pregnancy and lactation and number of meals the respondent had
yesterday.
The MAD scores of children were positively associated with the age of the infant, level of education of
mother, income stability, knowledge scores of mother (for enriching porridge & for prevention of
malnutrition), child was ever breastfed, the age of introduction of complementary foods, child’s food
prepared separately and if the mother received counselling on hygiene.
Table 10 Correlation Matrix
Factors IDD Scores MAD Scores TPDS Utility
Sex of the household head 0.046 0.018 0.013
Age of the mother -0.096** 0.032 0.090*
Age of the infant - 0.194**
Sex of the child - 0.025
Level of education of the mother 0.170** 0.114** 0.039
Income of the household 0.120** 0.072* -0.015
Caste 0.130 0.008 0.100**
Household land access 0.101** 0.052 -0.012
Dependence of home garden for food
security
0.086 -0.012 0.017
Household participation in Anganwadi
programme
-0.041 0.032 0.073*
Household benefits from public work
programme
-0.043 -0.031 0.122**
Food insecurity severity experienced by
household
-0.098** -0.037 0.049
Nutrition counselling received 0.099** 0.073 0.021
Hygienic counselling received 0.071* 0.013** 0.042
Number of meal the respondent had
yesterday
0.119** - -
Knowledge scores of food consumption
during pregnancy
0.160** - -
Knowledge scores for enriching porridge - 0.125** -
Knowledge scores for recognizing signs for
malnutrition
- 0.036 -

17
Factors IDD Scores MAD Scores TPDS Utility
Knowledge scores for recognizing reasons
for malnutrition
- 0.033 -
Knowledge scores for prevention of
malnutrition
- 0.081* -
Child was ever breastfed - 0.118** -
Age at which complementary food was
introduced
0.113** -
Child’s food is prepared separately - 0.123** -
Individual dietary diversity scores of mothers - - -0.043
Minimum adequacy of diet for infants - - -0.036
* Correlation is significant at 0.05 level; ** Correlation is significant at 0.01 level
e) Logistic regression analysis
The variables which correlated with IDDS and MAD scores were further subjected to binary logistic
regression analysis to further understand their determinants using forward step-wise analysis. The results
are discussed under:
Determinants of IDDS scores
The results of the logistic regression highlighted that household land access, hygienic counselling
received, age of the mother and food insecurity severity experienced by household did not show
considerable improvement in the IDD Scores of women. Further after controlling for religion, caste,
income and education level of women, more proportion of women who received nutrition counselling
where likely to meet the IDDW as compared to those women who did not received counselling ( OR:
1.679; p=0.007). The results of the study also indicate that odds of meeting IDDW scores were 1.305
times higher for women who had knowledge about food consumption during pregnancy and lactation and
1.626 times higher for the once who had more than one meal on the day previous to the interview (Table
11).
18
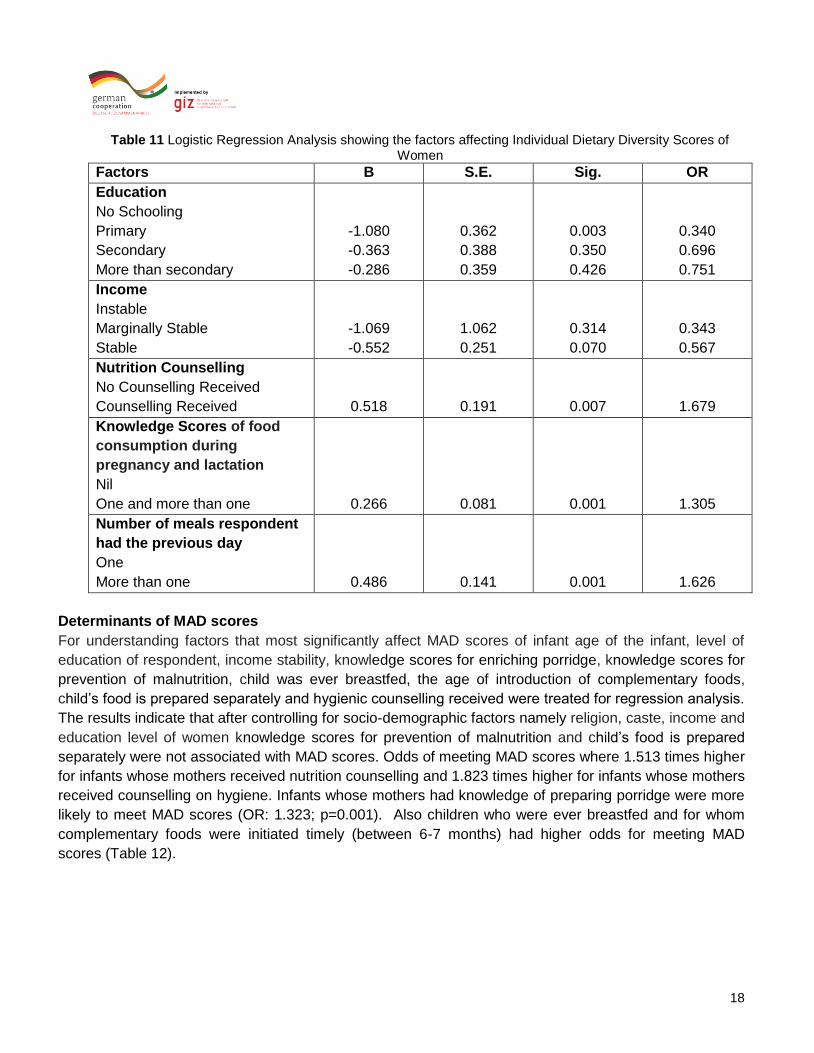
Table 11 Logistic Regression Analysis showing the factors affecting Individual Dietary Diversity Scores of Women
Factors B S.E. Sig. OR
Education
No Schooling
Primary
Secondary
More than secondary
-1.080
-0.363
-0.286
0.362
0.388
0.359
0.003
0.350
0.426
0.340
0.696
0.751
Income
Instable
Marginally Stable
Stable
-1.069
-0.552
1.062
0.251
0.314
0.070
0.343
0.567
Nutrition Counselling
No Counselling Received
Counselling Received
0.518
0.191
0.007
1.679
Knowledge Scores of food
consumption during
pregnancy and lactation
Nil
One and more than one
0.266
0.081
0.001
1.305
Number of meals respondent
had the previous day
One
More than one
0.486
0.141
0.001
1.626
Determinants of MAD scores
For understanding factors that most significantly affect MAD scores of infant age of the infant, level of
education of respondent, income stability, knowledge scores for enriching porridge, knowledge scores for
prevention of malnutrition, child was ever breastfed, the age of introduction of complementary foods,
child’s food is prepared separately and hygienic counselling received were treated for regression analysis.
The results indicate that after controlling for socio-demographic factors namely religion, caste, income and
education level of women knowledge scores for prevention of malnutrition and child’s food is prepared
separately were not associated with MAD scores. Odds of meeting MAD scores where 1.513 times higher
for infants whose mothers received nutrition counselling and 1.823 times higher for infants whose mothers
received counselling on hygiene. Infants whose mothers had knowledge of preparing porridge were more
likely to meet MAD scores (OR: 1.323; p=0.001). Also children who were ever breastfed and for whom
complementary foods were initiated timely (between 6-7 months) had higher odds for meeting MAD
scores (Table 12).

19
Table 12 Logistic Regression Analysis Showing the Factors Affecting Minimum Adequacy of Diet for Children
Factors B S.E. Sig. OR
Age of the child
6-11 months
12-17 months
18-23 months
-1.614
-0.249
0.311
0.221
0.00
0.250
0.199
0.779
Education
No Schooling
Primary
Secondary
More than secondary
-1.125
-0.633
-0.609
0.307
0.405
0.371
0.002
0.117
0.101
0.325
0.531
0.544
Nutrition counselling
No Counselling Received
Counselling Received
0.414
0.206
0.045
1.513
Counselling about hygiene
No Counselling Received
Counselling Received
0.600
0.197
0.002
1.823
Knowledge Scores on
enriching porridge
Nil
One and more than one
0.280
0.087
0.001
1.323
Child ever breastfed
No
yes
2.135
0.726
0.003
8.453
Complementary foods started
between 6-7 months
No
Yes
0.586
0.222
0.008
1.796
3) Conclusion In general individual dietary diversity and MAD scores was better in women belonging to Chhatarpur
as compared to Sheopur. In Chhatarpur, fewer respondents were severely food insecure as
compared to Sheopur. This could be due to the fact that
Caste had a statistical effect on individual dietary diversity scores of women with IDDS being
higher for women belonging to general category and lowest for schedule tribes. However,
infants who receive a minimum acceptable diet remained low irrespective of caste. Severe
food insecurity was least prevalent in general caste followed by other backward classes
whereas respondents belonging to schedule tribes were the most food insecure.
20
Higher percentage of household belonging to schedule caste were enrolled as TPDS
beneficiaries, followed by schedule tribes and other backward classes.
There was an increase in percentage of women consuming the recommended number of
food groups with better educational status and also higher infants received a minimum
acceptable diet whose mother were better educated. A higher percentage of households
having mothers who had received education more than secondary were food secure.
However, household enrolled as TPDS beneficiary did not significantly differ with educational
status.
There was an increase in percentage of women consuming the recommended >=5 food
groups with better stability in income. The households with stable income sources reported
marginally better MAD status for infants of 6 - 23 months. Also a higher percentage of
household having stable income source were food secure than those having a marginally
stable income source on the other hand, household enrolled as TPDS beneficiary did not
significantly differ with income stability.
IDDS scores were found to be positively associated with level of education of respondent,
income stability, household land access, nutrition counselling received, hygienic counselling
received, knowledge scores of food consumption during pregnancy and lactation and
number of meals the respondent had yesterday. A negative correlation was found with the
age of the mother and food insecurity severity experienced by household.
MAD scores were positively associated with age of the infant, level of education of
respondent, income stability, knowledge scores for enriching porridge, knowledge scores for
prevention of malnutrition, child was ever breastfed, the age of introduction of
complementary foods, child’s food is prepared separately and hygienic counselling received.
Positive association of TPDS Utility was found with age of the mother, caste, participation in
Anganwadi programme and household benefits from public work programme. The other
parameters for TPDS could not be treated since the data is only available in case the
household was a TPDS beneficiary.
The results of the logistic regression highlighted after controlling for religion, caste, income
and education level of women, more proportion of women who received nutrition counselling
where likely to meet the IDDW odds of meeting IDDW scores were higher for women who
received nutrition counselling, who had knowledge about food consumption during
pregnancy and lactation and ho had more than one meal on the day previous to the
interview.
Odds for meeting MAD scores were higher for infants whose mothers received nutrition and
hygienic counselling and infants whose mothers had knowledge of preparing porridge. Also
children who were ever breastfed and for whom complementary foods were initiated timely
(between 6-7 months) had higher odds for meeting MAD scores.
Therefore it can be concluded knowledge about nutrition and hygiene and optimal infant
feeding practices can go a way forward in improving dietary diversity scores.