in collaboration with the National Association of Hispanic Real Estate...
24
in collaboration with the National Association of Hispanic Real Estate Professionals
Transcript of in collaboration with the National Association of Hispanic Real Estate...

in co l laborat ion with the Nat ional Assoc iat ion of H ispanic Real Estate Profess ionals
EXECUTIVE SUMMARY 1
4
6
8
9
10
12
11
14
15
SECTION 1: HISPANIC POPULATION AND HOUSEHOLD FORMATION TRENDS
SECTION 2: HOMEOWNERSHIP AND THE ROLE OF HISPANICS IN THE NATION’S ECONOMYHomeownershipLabor Force Participation and Employment GrowthIncomeEducationEntrepreneurship and Purchasing Power
SECTION 3: CONSUMER ATTITUDES AND PREFERENCESFannie Mae National Housing Survey
SECTION 5: MILLENNIAL CONSUMER NUANCES
NAHREP INSIGHTS: THREE REASONS WHY HISPANIC HOMEOWNERSHIP IS ON THE RISE
Entrepreneurs and TechnologyLanguage
SECTION 6: IMMIGRATION AND THE IMPACT ON HOUSINGThe E�ects of Deporting One-Third of the Undocumented PopulationLabor Force Participation of Undocumented Individuals Tax Contributions from Undocumented WorkersWho are the Undocumented?Deportations and the Housing Market
CONCLUSION
END NOTES
17POLICY POSITIONS
SECTION 4: BARRIERS TO HISPANIC HOMEOWNERSHIPLack of Housing InventoryAccess to CreditShortage of Culturally Competent Professionals
advance sustainable Hispanic homeownership through engagement in strategic e�orts focused on Hispanic workforce participation in housing, small business development, and wealth building.
The National Association of Hispanic Real Estate Professionals® (NAHREP®has 26,000 members that include real estate agents, brokers, mortgage professionals, and settlement service providers. NAHREP’s mission is to advance sustainable Hispanic homeownership in America by educating and empowering real estate professionals who serve Hispanic homebuyers and sellers, advocating for policy that supports the organization’s mission, and facilitating relationships between industry stakeholders and housing professionals.
The State of Hispanic Homeownership Report™ is a publication of the Hispanic Wealth Project and NAHREP.
AUTHORS:Marisa Calderon, Executive Director, NAHREPAlejandro Becerra, Research Director, NAHREP
CONTRIBUTORS:Gary Acosta, Co-Founder & CEO, NAHREPJaimie Owens, Communications Coordinator, NAHREPZaba Rashan, Senior Marketing Manager, NAHREPEmilio Abarca
GRAPHIC DESIGN:Samira Rashan, Graphic Designer, NAHREPGreen Park Agency, Inc.Andrea Munguia, Graphic Designer, NAHREP
591 Camino de la Reina, Suite 720San Diego, CA 92108TEL: 619-719-4480www.hispanicwealthproject.org
TABLE OF CONTENTS

The 2016 State of Hispanic Homeownership Report® is a publication of the National Association of Hispanic Real Estate Professionals® (NAHREP®) and the Hispanic Wealth Project™ (HWP™).
In this seventh edition, the report focuses on the household formation rates and the consequent homeownership growth of Hispanics as well as their related educational achievements, entrepreneurial undertakings, labor force pro�le, and consumer purchasing power in the country.
This year’s installment highlights data that provides a comparative analysis of this past year and data from previous years since the beginning of the 21st Century. The report speci�cally analyzes the demographic and economic trends that shape the homebuyer market, including cultural nuances, and the role of Hispanics as drivers of homeownership growth in the United States. For clari�cation, the terms Hispanic and Latino are used interchangeably throughout the report.
2016 STATE OF HISPANIC HOMEOWNERSHIP REPORT
EXECUTIVE SUMMARY
HISPANIC HOMEOWNERSHIP (the numbers)
Origin: U.S. Census Bureau
Table A: Hispanic homeownership rate and total owner households from 2000 through 2016.
1
2016 46.0 7,301,000 +209,000

In 2016, 7,301,000 Hispanic households owned their homes. This was a 209,000 increase from the previous year, and accounted for 74.9 percent of the net growth in overall U.S. homeownership. For the second consecutive year, the Hispanic homeownership rate de�ed national trends. The Hispanic rate of homeownership increased from 45.6 percent in 2015 to 46.0 percent in 2016, while the nation’s overall homeownership rate declined to 63.4 percent, a 51-year low. Comparatively, the rate of homeownership for non-Hispanic Whites remained �at at 71.9 percent, while the rate of homeownership for both Blacks (42.2 percent) and Asians/others (55.5 percent) both declined by approximately one full percentage point during the same year. Since 2000, Hispanics have added roughly 3.1 million new homeowners, a 73 percent increase.
2016 STATE OF HISPANIC HOMEOWNERSHIP REPORT
Homeownership Today – Hispanics Continue to Drive U.S. Homeownership
Looking Forward – Population Trends & Household Formations
2
Other Hispanic Black White
Population Trends : 1990 — 2030
1990 2000 2010 2020 2030
100%
90%
80%
70%
60%
50%
40%
30%
20%
10%
0%
Origin: Urban Institute, Headship and Homeownership:
What Does the Future Hold?
Note: 2020 and 2030 data from Census projections
In 2015, the Hispanic population reached a new high of 57 million, an increase of 1.6 million from 2014, representing nearly 18 percent of the U.S. population. Since 2000, Hispanics have accounted for more than half of the population growth in the United States. By 2060, the U.S. Hispanic population is expected to reach 119 million.
Household formations are widely considered a primary predictor of homeownership growth. In 2016, Hispanics accounted for 330,000 new household formations, representing 38 percent of total household formations in the country. Since 2000, Hispanic households have increased by 6.7 million, representing approximately 42.5 percent of overall household growth in the United States.
2 5 1
HISPANIC HOMEOWNERSHIP RATES INCREASE
OVERALL HOMEOWNERSHIP
RATES DECLINE
The homeownership rate is a ratio of
owner households divided by total
number of households.
45.6% 63.4%46% 63.7%2 0 1 5 2 0 1 52 0 1 6 2 0 1 6
2016 STATE OF HISPANIC HOMEOWNERSHIP REPORT 3
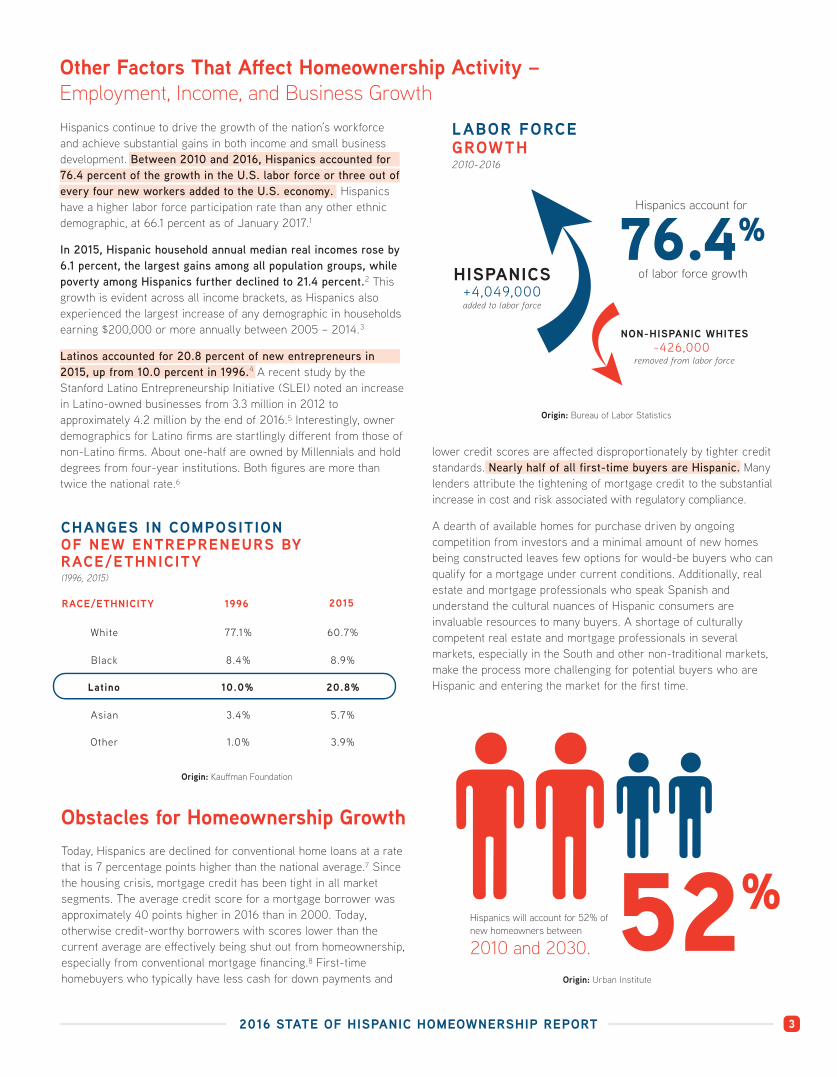
Today, Hispanics are declined for conventional home loans at a rate that is 7 percentage points higher than the national average.⁷ Since the housing crisis, mortgage credit has been tight in all market segments. The average credit score for a mortgage borrower wasapproximately 40 points higher in 2016 than in 2000. Today, otherwise credit-worthy borrowers with scores lower than the current average are e�ectively being shut out from homeownership, especially from conventional mortgage �nancing.⁸ First-time homebuyers who typically have less cash for down payments and
RACE/ETHNICITY 1996 2015
White
Latino
Other
Black
Asian
77.1%
10.0%
1.0%
8.4%
3.4%
60.7%
20.8%
3.9%
8.9%
5.7%
Origin: Kau�man Foundation
CHANGES IN COMPOSITIONOF NEW ENTREPRENEURS BY RACE/ETHNICITY (1996, 2015)
Other Factors That A�ect Homeownership Activity – Employment, Income, and Business Growth
Obstacles for Homeownership Growth
52%Hispanics will account for 52% of new homeowners between
2010 and 2030.Origin: Urban Institute
lower credit scores are a�ected disproportionately by tighter credit
lenders attribute the tightening of mortgage credit to the substantial increase in cost and risk associated with regulatory compliance.
A dearth of available homes for purchase driven by ongoing competition from investors and a minimal amount of new homes being constructed leaves few options for would-be buyers who can qualify for a mortgage under current conditions. Additionally, real estate and mortgage professionals who speak Spanish and understand the cultural nuances of Hispanic consumers are invaluable resources to many buyers. A shortage of culturally competent real estate and mortgage professionals in several markets, especially in the South and other non-traditional markets, make the process more challenging for potential buyers who are Hispanic and entering the market for the �rst time.
Hispanics continue to drive the growth of the nation’s workforce and achieve substantial gains in both income and small business development. Between 2010 and 2016, Hispanics accounted for 76.4 percent of the growth in the U.S. labor force or three out of every four new workers added to the U.S. economy. Hispanics have a higher labor force participation rate than any other ethnic demographic, at 66.1 percent as of January 2017.₁
In 2015, Hispanic household annual median real incomes rose by 6.1 percent, the largest gains among all population groups, while poverty among Hispanics further declined to 21.4 percent.₂ This growth is evident across all income brackets, as Hispanics also experienced the largest increase of any demographic in households earning $200,000 or more annually between 2005 – 2014.₃
Latinos accounted for 20.8 percent of new entrepreneurs in 2015, up from 10.0 percent in 1996.⁴ A recent study by the Stanford Latino Entrepreneurship Initiative (SLEI) noted an increase in Latino-owned businesses from 3.3 million in 2012 to approximately 4.2 million by the end of 2016.⁵ Interestingly, owner demographics for Latino �rms are startlingly di�erent from those of non-Latino �rms. About one-half are owned by Millennials and hold degrees from four-year institutions. Both �gures are more than twice the national rate.⁶
76.4%of labor force growth
Origin: Bureau of Labor Statistics
HISPANICS+4,049,000
NON-HISPANIC WHITES-426,000
Hispanics account for
LABOR FORCE GROWTH2010-2016
added to labor force
removed from labor force

Hispanics are earning more money, becoming better educated, and forming households at a faster pace than any other demographic. They also continue to demonstrate a strong desire for homeownership. As the Hispanic population ages into prime home-buying years, homeownership rates will continue to rise.
While the Hispanic market has outgrown the “niche” segment designation, the housing industry is just beginning to fully recognize its signi�cance to the vitality of the overall market and is responding with products and services that are more relevant to the needs of Hispanic consumers. The continued growth of Hispanic homeownership is not guaranteed without favorable government policies and an industry that is focused on developing solutions as the market continues to evolve. However, a strong Hispanic housing economy is increasingly critical to
Without growth from the Hispanic segment, the post-recession housing market would be weaker and wealth gains from home equity appreciation would be materially less in many regions of the country.
In 2015, the Hispanic population reached a new high of 57 million, an increase of 1.6 million from 2014, representing nearly 18 percent of the U.S. population. According to the Census Bureau, from 2000 – 2015, 90 percent of Latino population growth resulted from
and is expected to reach 119 million, representing 30 percent of the total U.S. population by 2060.⁹
2016 STATE OF HISPANIC HOMEOWNERSHIP REPORT
Conclusion
4
Since 2010, Hispanics have attained a cumulative net increase of 1,103,000 homeowners, accounting for
60% of total homeownership growth
i n t he U .S .
Origin: U.S. Census Bureau
Origin: U.S. Census Bureau
SECTION 1: HISPANIC POPULATION AND HOUSEHOLD FORMATION TRENDS
FA S T FA C T SHousehold: A group of people living together under one roof.
Household Formation: The creation of a given household. There are many types of households and the type of household can serve as an economic indicator. For example, a student moving out of his/her parent’s home into an apartment is categorized as a household formation. An increase in household formations is typically a leading indicator of downstream potential for an increase in owner households.
Owner Household: A household where the people living within it purchased the residence, either
First-Time Homebuyer: An individual who does not currently own his/her residence and has not been an owner of a residence for at least three years leading up to a purchase. This can include someone who has never owned, or someone who has previously owned, as long as it has been at least three years since the previous residence was purchased.
From 2010-2015, Hispanics accounted for more than HALF THE POPULATION GROWTH
in the United States.
2016 STATE OF HISPANIC HOMEOWNERSHIP REPORT 5
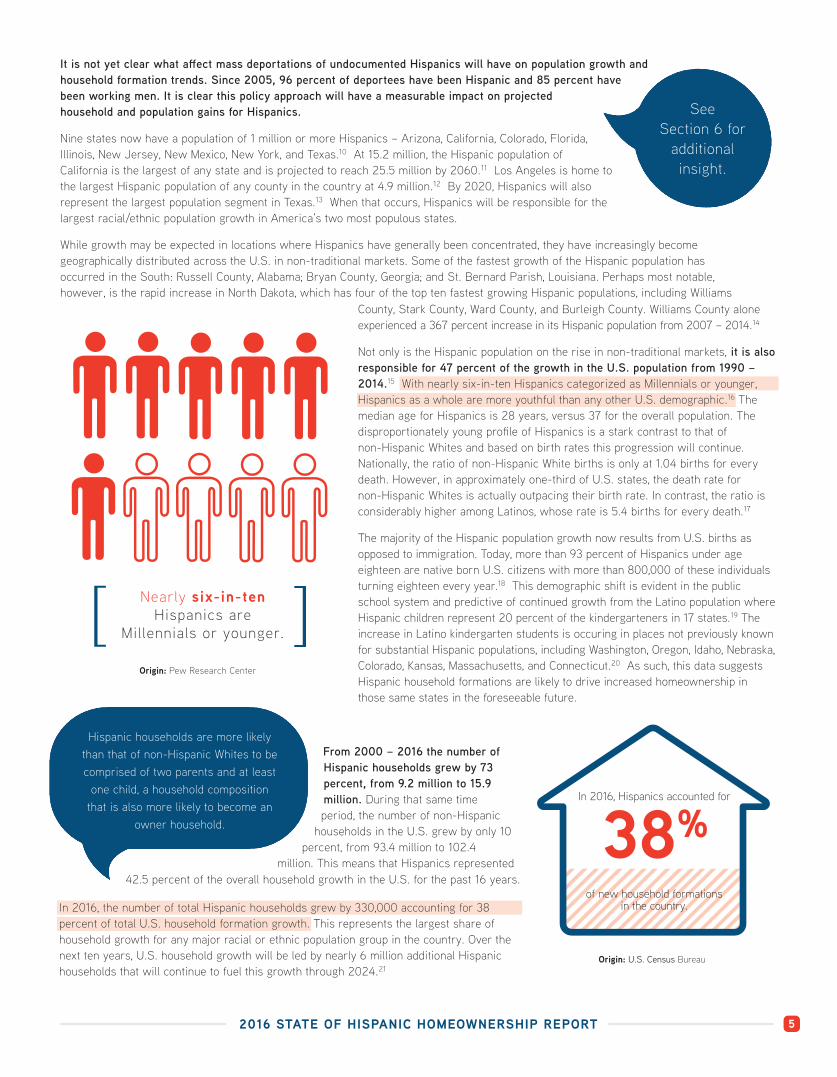
It is not yet clear what a�ect mass deportations of undocumented Hispanics will have on population growth and household formation trends. Since 2005, 96 percent of deportees have been Hispanic and 85 percent have been working men. It is clear this policy approach will have a measurable impact on projected household and population gains for Hispanics.
Nine states now have a population of 1 million or more Hispanics – Arizona, California, Colorado, Florida, Illinois, New Jersey, New Mexico, New York, and Texas.₁₀ At 15.2 million, the Hispanic population of California is the largest of any state and is projected to reach 25.5 million by 2060.₁₁ Los Angeles is home to the largest Hispanic population of any county in the country at 4.9 million.₁₂ By 2020, Hispanics will also represent the largest population segment in Texas.₁₃ When that occurs, Hispanics will be responsible for the largest racial/ethnic population growth in America’s two most populous states.
While growth may be expected in locations where Hispanics have generally been concentrated, they have increasingly become geographically distributed across the U.S. in non-traditional markets. Some of the fastest growth of the Hispanic population has occurred in the South: Russell County, Alabama; Bryan County, Georgia; and St. Bernard Parish, Louisiana. Perhaps most notable, however, is the rapid increase in North Dakota, which has four of the top ten fastest growing Hispanic populations, including Williams
From 2000 – 2016 the number of Hispanic households grew by 73 percent, from 9.2 million to 15.9 million. During that same time period, the number of non-Hispanic
households in the U.S. grew by only 10 percent, from 93.4 million to 102.4
million. This means that Hispanics represented
Origin: Pew Research Center
In 2016, Hispanics accounted for
38%
Origin: U.S. Census Bureau
of new household formations in the country.
See Section 6 for
additional insight.
County, Stark County, Ward County, and Burleigh County. Williams County alone experienced a 367 percent increase in its Hispanic population from 2007 – 2014.₁₄
Not only is the Hispanic population on the rise in non-traditional markets, it is also responsible for 47 percent of the growth in the U.S. population from 1990 – 2014.₁₅
The median age for Hispanics is 28 years, versus 37 for the overall population. The disproportionately young pro�le of Hispanics is a stark contrast to that of non-Hispanic Whites and based on birth rates this progression will continue. Nationally, the ratio of non-Hispanic White births is only at 1.04 births for every death. However, in approximately one-third of U.S. states, the death rate for non-Hispanic Whites is actually outpacing their birth rate. In contrast, the ratio is considerably higher among Latinos, whose rate is 5.4 births for every death.₁₇
The majority of the Hispanic population growth now results from U.S. births as opposed to immigration. Today, more than 93 percent of Hispanics under age eighteen are native born U.S. citizens with more than 800,000 of these individuals turning eighteen every year.₁₈ This demographic shift is evident in the public school system and predictive of continued growth from the Latino population where Hispanic children represent 20 percent of the kindergarteners in 17 states.₁₉ The increase in Latino kindergarten students is occuring in places not previously known for substantial Hispanic populations, including Washington, Oregon, Idaho, Nebraska, Colorado, Kansas, Massachusetts, and Connecticut.₂₀ As such, this data suggests Hispanic household formations are likely to drive increased homeownership in those same states in the foreseeable future.
Hispanic households are more likely than that of non-Hispanic Whites to be comprised of two parents and at least
one child, a household composition that is also more likely to become an
owner household.
42.5 percent of the overall household growth in the U.S. for the past 16 years.
household growth for any major racial or ethnic population group in the country. Over the next ten years, U.S. household growth will be led by nearly 6 million additional Hispanic households that will continue to fuel this growth through 2024.₂₁

second consecutive year, the Hispanic homeownership rate de�ed national trends. The Hispanic homeownership rate increased from 45.6 percent in 2015 to 46.0 percent in 2016, while the nation’s overall homeownership rate declined to 63.4 percent, a 51-year low. Comparatively, the rate of homeownership for non-Hispanic Whites remained �at at 71.9 percent, while the rate of homeownership for both Blacks (42.2 percent) and Asians/others (55.5 percent) both declined by approximately one full percentage point during the same year.
Since 2000, Hispanics have added 3,059,000 new homeowners. In contrast, the overall number of U.S. homeowners declined by 53,000 during the same period. The growth in Hispanic-driven homeowner-ship in the country is most clearly seen since the year 2010, when Hispanics gained 1,103,000 net new homeowners while the total number of U.S. homeowners declined by 427,000. The drop is driven primarily by non-Hispanic Whites who represent the largest share of Baby Boomers and other aging populations and had 2,270,000 fewer homeowners from 2010 – 2016. The Hispanic homeownership gains have had a net positive impact on overall U.S. homeownership, e�ectively preventing more drastic declines in the overall homeownership rate.
While the 0.4 percent increase in the Hispanic homeownership rate seems modest, it occurred simultaneously as the household formations rose at an even more rapid pace, establishing a multi-year trend in these categories.
2016 STATE OF HISPANIC HOMEOWNERSHIP REPORT6
SECTION 2: HOMEOWNERSHIP AND THE ROLE OF HISPANICS IN THE NATION’S ECONOMY
FA S T FA C T S
Homeownership
Percent: Any proportion or share in relation to a whole. Percent is expressed as a fraction of 100. For example, the rate of homeownership in 2016 was 63.4 percent.
Percentage Point: The numerical di�erence between two percentages. For example, from 2010 – 2016 the overal l U.S. homeownership rate fel l by 3.4 percentage points from 66.8 percent to 63.4 percent.
Origin: U.S. Census
209,000+
In 2016, 7,301,000 Hispanics households
owned their home
overal l netgrowth in U.S. homeownership
from 2015 – 2016
accounting for
74.9%
GROWTH IN OWNER-OCCUPIED UNITS IN THE U.S.Percentage Changes in the Growth of Owner Households in the U.S. from 2000 – 2015
2001 2002 2003 2004 2005 2006 2007 2008 2009 2010 2011 2012 2013 2014 2015 2016
6.0%
All Hispanic Non-Hispanic9.2%
5.3% 5.3%
7.4%
4.2%
3.4%
0.2%
-1.0% -0.9%
2.1%
5.6%
1.4%
1.0%
3.6%
2.9%
10.0%
8.0%
6.0%
4.0%
2.0%
0.0%
-2.0%

2016 STATE OF HISPANIC HOMEOWNERSHIP REPORT
Labor Force Participation and Employment Growth From 2010 – 2016, Hispanics accounted for 76.4 percent of the growth in the U.S. labor force, or three out of every four new workers added to the U.S. economy. As of January 2017, the Hispanic labor force participation rate of 66.1 percent was higher than that of any other ethnic demographic and 3.2 percentage points greater than the overall labor force participation rate of 62.9 percent.₂₂ Given the younger pro�le of the Latino population and its steadily increasing share of population growth, it is likely that this trend will continue well into the future.
A rapidly growing, young, and thriving Hispanic population is paramount to the nation’s long-term employment, business, and economic growth. According to IHS Economics, the Hispanic labor force is expected to make up nearly a quarter of the total U.S. labor force and to account for more than 65 percent of the growth in the U.S. labor force from 2015 – 2034.₂₃
Income Hispanic household annual median real incomes rose by 6.1 percent, the largest gains among all population groups, while poverty among Hispanics further declined to 21.4 percent.₂₄ Over the past decade, Latinos have been responsible for 29 percent of real income growth in the country, with the number of Latino households with incomes over $150,000 growing by 194 percent from 2005 – 2015.₂₅ This growth is evident across all income brackets, as Hispanics experienced the largest increase of any demographic in households earning $200,000 or more annually from 2005 – 2014.₂₆ As Hispanics continue to make real income gains, they will be in a more opportune position to participate in homeownership.
Education Over the past decade, the high school dropout rate of Hispanics has been cut in half.₂₇ In 2015, Hispanics achieved a high school graduation rate of 78 percent, an increase of �ve percentage points since 2010, helping to boost the national graduation rate to 82 percent.₂₈
More Hispanic students are also graduating from college. In 2015, 864,000 Hispanic adults earned a bachelor’s degree or higher, up 295,000 since 2009 – an increase of 5.2 percentage points.₂₉ Overall, 15 percent of the Hispanic population age 25 or older (4.8 million) had at least a bachelor’s degree or higher in 2015. Of this total, 1.5 million had a master’s, professional, or doctorate degree.₃₀
Entrepreneurship and Purchasing Power Latinos accounted for 20.8 percent of new entrepreneurs in 2015, up from 10.0 percent in 1996.³¹ A recent study by the Stanford Latino Entrepreneurship Initiative (SLEI) noted an increase in Latino-owned businesses from 3.3 million in 2012 to approximately 4.2 million by the end of 2016.³² Interestingly, owner demographics for Latino �rms are startlingly di�erent from those of non-Latino �rms. About one-half are owned by Millennials and half hold degrees from four-year institutions. Both �gures are more than twice the national rate.³³
Hispanic businesses are growing at twice the national average and contributing $668 billion annually to the U.S. economy.³⁴ The fastest-growing states for Hispanic business activity are California, Texas, and Florida. New York, Georgia, Arizona, and Illinois have also experienced substantial business growth.
Hispanics make up over 20 percent of all business owners in the U.S., compared to 10 percent a decade ago. This sustainability is most frequently seen in scaled businesses due in part to their participation in networked groups, including trade associations.³⁵ Successful Latino-owned �rms are more likely to actively participate in the overall business landscape, including membership in trade associations and other groups, which appears to be directly linked to their scalability and long-term success.
Entrepreneurship is often a pathway to increased earnings for Hispanics. Forty percent of Hispanic business owners earn greater than $75,000 in household income, compared to 23 percent of all Hispanics. Hispanic business owners are also 1.7 times more likely to earn in excess of $100,000 per year compared to Hispanics overall.³⁶
The number of U.S. Latino businesses were estimated at 4.2 million in 2016, a growth rate of 28 percent since 2012. These �gures are expected to increase, materially changing the composition of U.S. small business over time.
FA S T FA C T SLabor Force Participation Rate: The percentage of the population over the age of 16 who is either working or actively seeking work. The overal l labor force is made up of two buckets, the employed and the unemployed. Consequently, people who are neither employed nor looking for employment are not in the labor force.
Unemployment Rate: The percentage of the population who are jobless, have actively looked for a job in the prior 4 weeks, and are available for work.
7

2016 STATE OF HISPANIC HOMEOWNERSHIP REPORT
Fannie Mae National Housing Survey
If U.S. Latino consumers were a country, they would represent the world’s fourteenth largest economy – ahead of both Spain and Mexico, and growing faster than the economies of India or China.³⁷
Even with growing purchasing power and income gains, Latinos have historically lagged in participation of �nancial services in comparison to the general U.S. population. A shift in this pattern occurred from 2005 – 2015, with Hispanics accounting for 100 percent of the net growth in checking accounts and 21 percent in savings accounts. In this same ten-year span, credit card adoption by Latinos grew by 5.1 million individuals, representing 49 percent of the overall U.S. consumer growth in this segment of the economy.³⁸ As Hispanic immigrants are often “credit invisible” or have “thin credit �les”, these increased adoption rates of various �nancial products should have an improving impact over time on credit scores.
As part of an overall e�ort to support the housing market, Fannie Mae gathers attitudinal feedback from consumers on a regular basis. Its October and November 2016 survey shows that Hispanics continue to hold an optimistic economic outlook but feel it is di�cult to obtain access to credit.
Hispanic perspective on �nances and access to credit:
Most Hispanics (58 percent) say they expect their personal �nancial situations to improve.Nearly half of all Hispanics (45 percent) say this is a good time to buy a home, noting low home prices and favorable mortgage rates as the primary drivers of this sentiment. However, most (67 percent) say that it is a di�cult time to get a home mortgage.
8
$1.4 trillion
Origin: Selig Center for Economic Growth
FA S T FA C T SCredit Invisible: Individuals who are credit invisible are unscored because there is a lack of information to include on a credit bureau report. This occurs when a person does not use commonly reported forms of credit such as a credit card or auto loan.
Thin File: This is used to describe the credit score of a person who has a l imited credit history. It means his/her credit bureau report shows a short history of credit , very few trade lines or both.
SECTION 3: CONSUMER ATTITUDES AND PREFERENCES
••
A majority of Hispanics (52 percent) expect both home prices and mortgage rates to go up during the next year.One out of three Hispanics (34 percent) identi�ed a�ording the down payment or closing costs as the biggest obstacle to getting a mortgage today. More than one out of three Hispanics (36 percent) identi�ed insu�cient credit score or credit history as their biggest obstacle to getting a mortgage.
••
HISPANIC PURCHASINGPOWER IN 2016

2016 STATE OF HISPANIC HOMEOWNERSHIP REPORT
Lack of Housing Inventory Single-family residential (SFR) housing stock is at historic lows. Institutional investor purchases of SFR properties increased by 29 percent in 2016, fueling a lack of available a�ordable housing stock.³⁹ Investor purchases were concentrated most heavily in a�ordable markets, especially in the South, e�ectively edging out �rst-time home buyers. In fact, 7 of the top 10 markets with the highest institutional investor share of purchases were in Georgia.⁴⁰
A shortage of new home construction is also fueling inventory concerns. On average, the �nancial impact of government regulations accounts for nearly one-fourth of the �nal cost of a new single-family home.⁴¹
Labor shortages of skilled workers in the construction industry are further exacerbating housing inventory lows. Current estimates indicate there are approximately 150,000 un�lled jobs in the construction industry and a lack of skilled workers to �ll these positions.⁴²
A�ordability issues are also closely linked to the lack of homes for sale. Inventory in the bottom- and middle-value tiers in metropolitan areas shrank by more than 38 percent from 2010 – 2015, even as household formations increased by 4.5 million in that same time span.⁴³ As a result, fewer than 20 percent of existing homes for sale in some of the nation’s largest metropolitan areas are in the most a�ordable tier.⁴⁴ This includes the Dallas, Denver, Phoenix, Nashville, and Raleigh markets. Over the next decade, the Millennial generation is also expected to create two million households a year, aggravating the problem of a dried-up inventory of a�ordable homes.
Hispanics continue to overwhelmingly prefer homeownership to renting with more than 9 out of 10 indicating that in the future they are more likely to own a home than rent. If they were to move, 62 percent of Hispanics said they would be more likely to buy a home rather than rent. Of those who own a home, 90 percent of Hispanics indicate they are satis�ed with the features of their current mortgage.
SECTION 4: BARRIERS TO HISPANIC HOMEOWNERSHIP
9
87%say it is a way to
achieve having control over one’s living space
81%say it is a way to
live in a nicer home
Raising a Family and Wealth Creation are Primary
Drivers of Hispanic Desire for Homeownership
79%say they are better o� owning rather
than renting
82%say it’s the best way
to build wealth
77%say it’s the best investment plan
87%say they prefer owninga home as a good place
to raise children
Origin: Fannie Mae
HISPANIC ATTITUDES TOWARD HOMEOWNERSHIP

2016 STATE OF HISPANIC HOMEOWNERSHIP REPORT
Access to Credit Hispanics continue to be denied mortgage loans at a higher rate than non-Hispanic Whites. In 2016, Hispanics were denied conventional loans at a rate of 17.3 percent, nearly 9 percentage points higher than the denial rate for non-Hispanic Whites. The disparity for denial rates of FHA loans is not as stark, with Hispanics being denied at a rate of 15.5 percent in comparison to non-Hispanic Whites at 11.4 percent.
Overall, 27 percent of Hispanic consumers are “credit invisible” or have an unscored credit record, preempting access to mortgage credit �nancing.⁴⁵ In fact, Hispanics make up 21 percent of the U.S. population that is “credit invisible”.⁴⁶ Some estimates indicate that the use of new credit scoring models could expand annual mortgage lending to Hispanics by 16 percent.⁴⁷
Shortage of Culturally Competent Professionals The Urban Institute estimates that by 2030 Hispanics will be responsible for 56 percent of new homeownership gains.⁴⁸ However, those employed within the real estate and housing industries are not re�ective of this burgeoning demographic. Current estimates indicate that 4 percent of mortgage professionals and 7 percent of real estate agents are Hispanic.⁴⁹ Approximately 25 percent of Hispanic buyers say they prefer to work with a real estate agent who can assist them in Spanish. While language is important, it is not the only cultural connector important to Hispanic buyers and sellers. Factors that in�uence their home purchase or sale include how they participate in �nancial services and who contributes to the decision making process of the transaction. Hispanics tend to reside in a multi-generational household of a typical nuclear family and include additional family members like grandparents or other adult relatives, all of whom contribute to household expenses. These in�uencing factors are interconnected with their culture and a�ect how they bank. This cultural nuance can impact determinations of credit worthiness.
Access to culturally competent real estate and mortgage professionals who speak Spanish and can recommend appropriate solutions to meet their needs creates a level playing �eld for prospective Hispanic homeowners. A critical shortage of such real estate and mortgage professionals in several markets puts limits on the number of potential buyers who are entering the market.
10
Entrepreneurs and Technology
Language
Home buying populations are becoming increasingly diverse. A recent Zillow study notes that at 14 percent of home buyers, Hispanics represent the largest segment of non-White Millennial home buyers.⁵⁰
Not surprisingly, homeownership often precedes business ownership. An increasing share of Hispanic entrepreneurs are Millennials, with close to half of all Latino-owned businesses headed by Millennial owners, many of whom are college educated.⁵¹ Of Latino businesses earning over $1 million annually, more than 40 percent are owned by Millennials and 45 percent employ 50 people or more. This suggests Millennial owners are �nancially savvy and have access to extensive resources.
Latinos out index other demographics in their use of mobile technology to access the internet. Millennial Hispanics are more likely to manage their personal �nances online and are also more likely to engage in complex �nancial transactions, such as purchasing mutual funds or online trading, through mobile devices.⁵² This a�nity for social and mobile interaction informs how they engage with companies and will likely have an impact on where and with whom they do business. Companies that provide platforms that cater to mobile engagement and social interaction will have a competitive advantage with this consumer segment.
SECTION 5: MILLENNIAL CONSUMER NUANCES
HOMEOWNERSHIP DIVERSITY
Origin: Zillow Group, Consumer Housing Trends Report 2016
All Homeowners Mil lennials
77% 66%9% 17%
9%10%
5%
7%1%
When it comes to language, younger Hispanics tend to be bilingual or English-dominant. In fact, 58 percent of Millennials are bilingual and only 14 percent are Spanish-dominant.⁵³ While Millennials can �uidly communicate in English, they intentionally interact with brands and companies that appeal to them through culture. As these buyers enter their prime home buying years, are increasingly well-educated, and are more �nancially successful, they will place a greater value on working with a real estate professional who connects with them through culture and can provide insight that compliments their a�nity for social consumption.

11
Three Reasons Why Hispanic Homeownership is on the Rise
The continued growth in Hispanic homeownership is most likely due to a number of factors. In addition to the fact that Hispanics are earning more and aging into their prime homebuying years, three other reasons appear to be accelerating Hispanic homeownership.
First, Hispanics consistently out-index other demographics in terms of their enthusiasm for homeownership. In their recent National Housing Survey, Fannie Mae highlighted several ways Hispanics prioritize homeownership. The 2016 survey indicated that 91 percent of Hispanics expect to be a homeowner at some point in the future and 87 percent view it as a good place for a family to raise children. The significance of a strong desire for homeownership cannot be over-stated. Where there is a will, there is generally a way.
Second, a growing number of major real estate firms, corporations and large lenders are developing products and initiatives aimed at better serving Hispanic homebuyers. In 2015, Wells Fargo made a commitment to lend $125 billion in mortgages for Hispanic homebuyers over a ten-year period in support of NAHREP’s Hispanic Wealth Project. The commitment is inspiring the creation of new products and includes expanding a more diverse workforce and investing in homebuyer counseling. In 2016, Bank of America partnered with Down Payment Resource to implement an online tool that consumers and real estate professionals can use to identify down payment assistance programs
#2 #3#1Enthusiasm for homeownership
Products and initiatives thatbetter serveHispanichomebuyers
Professional Networks
NAHREP INSIGHTS
available for borrowers. Bank of America is publicizing the availability of these resources by conducting a series of market events aimed at educating the real estate professionals who service Latino homebuyers. In the secondary market, Fannie Mae and Freddie Mac have recently made modifications to their affordable lending products that address the financial habits of Hispanics and other underserved borrowers.
Several real estate franchises are implementing programs that incorporate various nuances that are applicable to Hispanic agents and homebuyers, and VantageScore® Solutions has continued to enhance their credit scoring products to score more thin credit or non-traditional borrowers, which include Hispanics, immigrants and other consumers. Mortgage insurers like Radian Guaranty are developing products and employing staff specifically directed in assisting their lending partners to serve their Hispanic customers.
Third, professional networks like NAHREP create awareness, disseminate best practices and advocate for corporate and government policies that help guide the industry to better serve the growing Hispanic demographic. They are also helping to spawn a surge of successful Hispanic entrepreneurs. According to a 2016 report from the Stanford Latino Entrepreneurship Initiative (SLEI), larger Hispanic-owned firms tend to belong to multiple business organizations where mentorship and peer-to-peer networking are available. Hispanic-owned mortgage
lenders like Alterra Home Loans in Nevada and New American Funding in California have leveraged their participation in NAHREP and other industry trade groups to expand their businesses. Both companies focus heavily on the Hispanic market and are now among the largest independent mortgage lenders in the country. They were part of a Freddie Mac pilot program named “Your Path” that includes expanded guidelines for borrowers who have seasonal work or income from sources that are more difficult to measure using traditional methods. Additionally, dozens of Hispanic real estate broker-owners along with several smaller technology firms are scaling their businesses and expanding into second tier markets such as Arizona, Georgia, Virginia and Tennessee.
NAHREP provides entrepreneurs with access to mentors and other useful relationships that help them scale their businesses and serve more Hispanic buyers and sellers. The success of Hispanic-owned firms can influence others in the industry by proving a particular model or set of best practices. The NAHREP ecosystem of industry participation from both Hispanic-owned and non-Hispanic owned firms encourages focus, innovation, and pushes the entire professional apparatus toward a better understanding of the Hispanic market opportunity and in the process is driving Hispanic homeownership forward.

2016 STATE OF HISPANIC HOMEOWNERSHIP REPORT12
The E�ects of Deporting One-Third of the Undocumented Population The Trump Administration has made immigration policy enforcement a top priority, putting the nation’s 11.3 million undocumented persons at risk for deportation. While the White House and the Department of Homeland Security have stated that these policies are not a mass deportation plan but simply an enhancement of resources and guidance for enforcement o�cials, some express concern at the potential economic impacts of deporting signi�cant numbers of the country’s undocumented individuals.
NAHREP has long supported immigration policy reform that provides deportation relief, immigrant visas, non-immigrant visas, and a road to citizenship for those who seek to live and work in the United States. Taking an integrated approach to �xing the immigration system, rather than enforcing a broken system, will not only bene�t the housing industry but will avoid an economic crisis caused by mass deportations. It is unlikely that all 11.3 million undocumented individuals will be deported, but even if only one-third, or approximately 3.7 million people were deported, the economic impact would nonetheless prove to be material.
SECTION 6: IMMIGRATION AND THE IMPACT ON HOUSING
Labor Force Participation of Undocumented Individuals An estimated 8 million undocumented people are part of the U.S. labor force, accounting for 5 percent of individuals who are either working or actively seeking work.⁵⁴ As Hispanics comprise two-thirds of the country’s undocumented population, they are also a disproportionately high percentage of the U.S. undocumented workforce.
Considering 85 percent of prior deportees were a part of the U.S. workforce, deporting just one-third of the remaining undocumented population would result in a loss of 3.1 million workers, or 39 percent of the overall undocumented workforce.⁵⁵
In the housing industry, 15 percent of construction jobs are held by undocumented persons.⁵⁶ In 2015, the U.S. Census Bureau estimated there are 9.6 million construction jobs, meaning 1.4 million of those jobs are held by undocumented workers. Removing 39 percent of those individuals would result in a loss of more than half a million construction workers. This is signi�cant considering the construction industry is currently experiencing a shortage of skilled labor, meaning there are not enough workers to �ll job openings in this industry.
High costs for material and labor already limit the supply of new a�ordable housing. The removal of substantial portions of existing workers will drive up new home prices and exacerbate current inventory shortages, which are already at crisis levels.
The employment rate of undocumented immigrant men is higher than both documented immigrant men and native-born men, according to the National Bureau of Economic Research. In the 1990s, the employment rate of all three groups was roughly similar, but over the last few decades the employment rates of native-born men have fallen steadily with that of undocumented men increasing substantially.⁵⁷
This is due in large part to the continued trend of non-Hispanic Whites aging out of the workforce, while Hispanics, including the undocumented, participate in the labor force at a higher rate than non-Hispanics. With fewer available native-born workers to �ll employment gaps, removing a substantial number of undocumented individuals from the existing workforce will have a disproportionate impact on the overall economy.
EMPLOYMENT RATES FOR MEN IN THE U.S.Aged 20-64, 2012-2013
73.9%
77.8%
86.6%
NATIVEBORN
DOCUMENTEDIMMIGRANTS
UNDOCUMENTEDIMMIGRANTS
Origin: National Bureau of Economic Research

2016 STATE OF HISPANIC HOMEOWNERSHIP REPORT
Tax Contributions from Undocumented Workers Undocumented workers pay signi�cant amounts in state and local taxes. According to the Institute on Taxation and Economic Policy, collectively the undocumented pay an estimated $11.74 billion a year, or approximately 8 percent of their income.⁵⁸ Granting legal status to all undocumented workers would increase this contribution by 8.6 percent, thereby positively impacting the economy.⁵⁹ Conversely, deportation would remove a substantial portion of those tax contributions.
Deportations and the Housing Market
represent two-thirds of the undocumented population, they are disproportionately subject to deportations, with an overwhelming number of male Hispanics in the work force deported. Of the individuals deported from 2005 – 2014, 85 percent were male workers and 96 percent were Latino.⁶³
During the 2008 housing crisis, Latino households lost their homes to foreclosures more often than any other ethnic or racial group. A joint study by Brigham Young University and Cornell University linked deportations to increased foreclosure rates among Hispanic households. The �ndings suggested a detrimental synergy between deportations and foreclosures, which could result in prolonged stagnation of the housing market in areas with high immigration enforcement policies.⁶⁴
Who Are the Undocumented? A 2017 report released by the Center for Migration Studies highlights that 66 percent of undocumented people who arrived in the U.S. in 2014 were not undocumented due to crossing the border illegally, but as a result of overstaying or otherwise violating the terms of their visas. This number has increased from the 61 percent of new arrivals in 2010 and 37 percent in 2004.⁶⁰
The majority of undocumented immigrants have been long-time members of their communities. Approximately two-thirds of adults living in the U.S. without documentation have been here longer than ten years, with a median length of residency at 13.6 years.⁶¹
Undocumented individuals often reside in mixed immigration status households. Consequently, 3.9 million K-12 students in U.S. public schools have at least one parent who is undocumented.⁶² Of these school-aged children, 3.2 million, or 82 percent, are American citizens themselves, making mass deportation an issue that would directly impact millions of U.S. children.
13
2002
2007
2013
165,168
319,382
434,015DEPORTATIONS
163%INCREASE
TOTAL DEPORTATIONS: 3.8 MILLION2002 – 2013
Origin: U.S. Department of Homeland Security, 2015
Deporting one-third of the undocumented population would be a major blow to the nation’s workforce and would cripple the already labor starved construction industry. Because a large number of undocumented persons have family ties to citizens and legal residents, the impact of a sharp increase in deportations would a�ect many more people than the individuals deported. The housing market is disproportionately dependent on Hispanics to fuel �rst-time buyer activity, which ultimately a�ects all segments of the housing market. A substantial ramp-up of deportations would almost certainly drive a still fragile housing market into recession or worse.
DEMOGRAPHIC PROPORTION OF DEPORTEES2005 – 2014
MALE WORKERS
LATINOS
TOTAL U.S. DEPORTATIONS
96%
85% Hispanics represent
two-thirds of the undocumented
population, but are deported at
disproportionately higher rates.
Origin: U.S. Department of Homeland Security & Sociological Science Vol. 3, December 2016
3.6 Million

2016 STATE OF HISPANIC HOMEOWNERSHIP REPORT14
NETHOMEOWNERSHIPCHANGE2010 – 2016
ASIAN & OTHER+750,000
Origin: U.S. Census Bureau
HISPANICS+1,103,000
NON-HISPANIC WHITES-2,270,000
OVERALL-427,000
BLACK/AFRICAN AMERICANS-46,000
Net Gains in Homeownership
Net Losses in Homeownership
Hispanics are earning more money, becoming better educated, and forming households at a faster pace than any other demographic. They also continue to demonstrate a strong desire for homeownership. As the Hispanic population ages into prime home buying years, homeownership rates are projected to rise.
However, these projections are dependent upon an industry that evolves alongside the changing consumer demographic that is fueling current homeownership gains. Hispanics, especially Millennials, demand engagement through social and mobile interaction via cutting-edge technology for which the �nancial services and real estate sectors are not historically known. The volume of Hispanic consumers and their appetite for tech-based products will drive innovation from FinTech �rms and other companies that choose to meet them where they are. These trailblazers will di�erentiate themselves from the �eld of industry participants who are otherwise �xed on serving consumers with the same tools and techniques as were once appropriate.
While the Hispanic market has outgrown the “niche” segment designation, the housing industry is just beginning to fully recognize its signi�cance to the vitality of the overall market and is responding with products and services that are more relevant to the needs of Hispanic consumers. The continued growth of Hispanic homeownership is dependent not only on technological innovation but also on favorable government policies and an industry that is focused on developing solutions that meet the needs of the increasing Hispanic segment.
As Hispanics are projected to represent nearly 60 percent of homeownership gains within the next 15 years, a strong Hispanic housing economy is critical to the health and well-being of the overall economy. Since 2010, Hispanics have achieved a net gain of 1,103,000 homeowners, going from 6,198,000 in 2010 to 7,301,000 in 2016. In contrast, there were 2,270,000 fewer non-Hispanic White homeowners during the same period. Without growth from the Hispanic segment, the post-recession housing market would be weaker and wealth gains from home equity appreciation would be materially less for most homeowners. Hispanics have become the fundamental drivers of U.S. homeownership growth. Their population and homeownership gains create an economic imperative to address the needs of this consumer or risk adversely impacting the overall U.S. economy.
CONCLUSION

2016 STATE OF HISPANIC HOMEOWNERSHIP REPORT 15
END NOTES
U.S. Bureau of Labor Statistics, “Labor Force Participation Rate: Hispanic or Latino,” Federal Reserve Bank of St. Louis, March 10, 2017, https://fred.stlouisfed-.org/series/LNS11300009.
U.S. Bureau of Labor Statistics, “Civilian Labor Force Participation Rate,” Federal Reserve Bank of St. Louis, March 10, 2017, https://fred.stlouisfed.org/series/-CIVPART.
Council of Economic Advisers Issue Brief, “Economic Progress of the Hispanic Community During the Obama Administration,” The White House, October 2016,
Je�ery A. Eisenach, “Making America Rich Again: The Latino E�ect on Economic Growth,” National Economic Research Associates, Inc., December 2016, http://www.nera.com/content/dam/nera/publications/2016/PUB_LDC_Prosperity_1216.pdf.
Robert W. Fairlie, E.J Reedy, Arnobio Morelix, and Joshua Russell, “The Kau�man Index: 2016 Start Up Activity,” Kau�man Foundation, 2016, http://www.kau�-man.org/~/media/kau�man_org/microsites/kau�man_index/startup_activity_2016/kau�man_index_startup_activity_national_trends_2016.pdf.
Stanford Latino Entrepreneurship Initiative, “State of Latino Entrepreneurship 2016,” Stanford Graduate School of Business, December 2016, https://ww-
Ibid., Stanford Latino Entrepreneurship Initiative.
Skylar Olsen, “Getting a Mortgage Was Easier Overall in 2015, But Remains More Challenging for Minorities,” Zillow Group, November 3, 2016, https://www.zil-low.com/research/mortgage-denial-rates-hmda-13773/.
Jim Parrott and Yamillet Payano, “Why the low Hispanic homeownership rate matters,” Urban Institute, October 12, 2016, http://www.urban.org/ur-ban-wire/why-low-hispanic-homeownership-rate-matters.
Sandra I Colby and Jennifer M. Ortman, “Projections of the Size and Composition of the U.S. Population: 2014 to 2060,” U.S. Census Bureau, 2015.
U.S. Census Bureau, “Hispanic Heritage Month 2016,” U.S. Census Bureau, October 12, 2016, https://www.census.gov/newsroom/facts-for-fea-tures/2016/cb16-�16.html.
Mark Hugo Lopez and Jens Manuel Krogstad, Will California Ever Become a Majority-Latino State? Maybe Not.
U.S. Census Bureau, Hispanic Heritage Month 2016.
Washton Brown Associates, Hispanics – Demographic and Consumer Spending Trends 9th Edition.
Renee Stepler and Mark Hugo Lopez, “U.S. Latino Population Growth and Dispersion Has Slowed Since Onset of the Great Recession” Pew Research Center, 2016, http://www.pewhispanic.org/2016/09/08/latino-population-growth-and-dispersion-has-slowed-since-the-onset-of-the-great-recession/.
Washton Brown Associates, Hispanics – Demographic and Consumer Spending Trends 9th Edition.
Pew Research Center, April 20, 2016, http://www.pewhispanic.org/2016/04/20/the-na-
Rogelio Sáenz and Kenneth M. Johnson, “White Deaths Exceed Births in One-Third of U.S. States,” University of New Hampshire Carsey School of Public Policy, 2016, http://scholars.unh.edu/cgi/viewcontent.cgi?article=1288&context=carsey.
Jens Manuel Krogstad, “10 Facts for National Hispanic Heritage Month,” Pew Research Center, September 15, 2016, http://www.pewresearch.org/-fact-tank/2016/09/15/facts-for-national-hispanic-heritage-month/.
Jens Manuel Krogstad, “A View of the Future Through Kindergarten Demographics,” Pew Research Center, July 8, 2014, http://www.pewresearch.org/-fact-tank/2014/07/08/a-view-of-the-future-through-kindergarten-demographics/.
Ibid., Jens Manuel Krogstad.
Lynn Fisher, “Housing Demand: Demographics and the Numbers Behind the Coming Multi-Million Increase in Households,” Mortgage Bankers Association, 2015.
U.S. Bureau of Labor Statistics, “Labor Force Participation Rate: Hispanic or Latino,” Federal Reserve Bank of St. Louis, March 10, 2017, https://fred.stlouisfed-.org/series/LNS11300009.
Je�rey A. Eisenach, Making America Rich Again: The Latino E�ect on Economic Growth.
Council of Economic Advisers Issue Brief, Economic Progress of the Hispanic Community During the Obama Administration.
Je�rey A. Eisenach, Making America Rich Again: The Latino E�ect on Economic Growth.
Ibid., Je�ery A. Eisenach.
U.S. Census Bureau, Current Population Survey, October 1967 through 2014.
Council of Economic Advisers Issue Brief, Economic Progress of the Hispanic Community During the Obama Administration.
Ibid., Council of Economic Advisers Issue Brief.
2015 American Community Survey, “Table 3: Detailed Years of School Completed by People 25 Years and Over by Sex, Age Groups, Race and Hispanic Origin: 2015”, U.S. Census Bureau, November 22, 2016.
Robert W. Fairlie, E.J. Reedy, Arnobio Moreliz, and Joshua Russell, “The Kau�man Index: Start Up Activity 2016,” Kau�man Foundation, August 2016, http://ww-w.kau�man.org/~/media/kau�man_org/microsites/kau�man_index/startup_activity_2016/kau�man_index_startup_activity_national_trends_2016.pdf.
Stanford Latino Entrepreneurship Initiative, “State of Latino Entrepreneurship 2016,” Stanford Graduate School of Business, December 2016, https://ww-
Stanford Latino Entrepreneurship Initiative, State of Latino Entrepreneurship, 2016.
Geoscape, “2016 Hispanics in Business Report,” Geoscape, October 2016.
SLEI 2016
Ibid., Geoscape.
1.
2.
3.
4.
5.
6.
7.
8.
9.
10.
11.
12.
13.
14.
15.
16.
17.
18.
19.
20.
21.
22.
23.
24.
25.
26.
27.
28.
29.
30.
31.
32.
33.
34.
35.
36.

2016 STATE OF HISPANIC HOMEOWNERSHIP REPORT16
37.
38.
39.
40.
41.
42.
43.
44.
45.
46.
47.
48.
49.
50.
51.
52.
53.
54.
55.
56.
57.58.
59.60.
61.
62.
63.
64.
Stanford Latino Entrepreneurship Initiative, “State of Latino Entrepreneurship 2015,” Stanford Graduate School of Business, November 2015, http://l-ban.us/wp-content/uploads/2015/11/Final-Report-.pdf.
Washton Brown Associates, Hispanics – Demographic and Consumer Spending Trends, 9th Edition.
RealtyTrac, “Single Family Rental Returns Drop to Nine-Year Low in 2016 as institutional Investor Purchases Rise in 68 Percent of Local Markets,” RealtyTrac, October 18, 2016, http://www.realtytrac.com/news/home-prices-and-sales/q3-2016-single-family-rental-market-report/.
Ibid., RealtyTrac.
Paul Emrath, “Government Regulation in the Price of a New Home,” National Association of Home Builders, May 2, 2016, https://www.nahbclassic.org/generic.as-px?sectionID=734&genericContentID=250611&channelID=311.
Bureau of Labor Statistics, “Industries at a Glance,” United States Department of Labor, March 10, 2017, https://www.bls.gov/iag/tgs/iag23.htm.
U.S. Census Bureau, “Table 6A. Total Households and Owner Households by Race and Ethnicity,” U.S. Census Bureau, 2017.
Joint Center for Housing Studies of Harvard University, “The State of the Nation’s Housing 2016,” President and Fellows of Harvard College, 2016, http://www.-jchs.harvard.edu/sites/jchs.harvard.edu/�les/jchs_2016_state_of_the_nations_housing_lowres.pdf.
The CFPB O�ce of Research, “Data Point: Credit Invisibles,” Consumer Financial Protection Bureau -data-point-credit-invisibles.pdf.
O�ce of Policy Development and Research, “Pressing Challenges in Housing Finance: Credit Access and Seniors’ Mortgage Debt,” U.S. Department of Housing and Urban Development, Spring 2016, https://www.huduser.gov/portal/periodicals/em/spring16/highlight1.html.
Vantage Score, “’The ‘Credit Invisible’ Dilemma,” National Association of Federally-Insured Credit Unions, 2016, http://dev.nafcu.org/NAFCU_Services_Corpora-tion/Partner_Library/VantageScore_Infographic__The__Credit_Invisible__Dilemma/.
Laurie Goodman, Rolf Pendall, and Jun Zhu, “Headship and Homeownership: What Does the Future Hold?,” The Urban Institute, June 2015, http://www.ur-
HWP Annual Report 2016
Ibid., Zillow Group.
Stanford Latino Entrepreneurship Initiative, State of Latino Entrepreneurship 2016.
Nielsen, “Millennails: Technology = Social Connection,” The Nielsen Company, February 26, 2014, http://www.nielsen.com/us/en/insights/news/2014/millenni-als-technology-social-connection.html.
The Neilson Company, “Hispanic In�uence Reaches New Heights in the U.S.,” The Neilson Company, August 23, 2016, http://www.nielsen.com/us/en/in-sights/news/2016/hispanic-in�uence-reaches-new-heights-in-the-us.html.
Jens Manuel Krogstad, Je�ery S. Passel, and D’Vera Cohn, “5 Facts About Illegal Immigration in the U.S.,” Pew Research Center, November 3, 2016, http://ww-w.pewresearch.org/fact-tank/2016/11/03/5-facts-about-illegal-immigration-in-the-u-s/.
Jacob S. Rugh and Matthew Hall, “Deporting the American Dream: Immigration Enforcement and Latino Foreclosures,” Sociological Science, December 8, 2016, https://www.sociologicalscience.com/download/vol-3/december/SocSci_v3_1053to1076.pdf.
Je�ery S. Passel and D’Vera Cohn, “Size of U.S. Unauthorized Immigrant Workforce Stable After the Great Recession,” Pew Research Center, November 3, 2016, http://www.pewhispanic.org/2016/11/03/size-of-u-s-unauthorized-immigrant-workforce-stable-after-the-great-recession/.
George J. Borjas, “The Labor Supply of Undocumented Immigrants,” National Bureau of Economic Research, March 2016.
Institute on Taxation and Economic Policy, “Undocumented Immigrants’ State & Local Tax Contributions,” Institute on Taxation and Economic Policy, March 1, 2017, http://itep.org/itep_reports/2017/03/undocumented-immigrants-state-local-tax-contributions-2.php#.WMdHY4HyuUk.
Ibid., Institute on Taxation and Economic Policy.
Robert Warren and Donald Kerwin, “The 2000 Mile Wall in Search of a Purpose: Since 2007 Visa Overstays have Outnumbered Undocumented Border Crossers by a Half Million,” Center for Migration Studies, 2017, http://cmsny.org/publications/jmhs-visa-overstays-border-wall/ .
Je�ery S. Passel and D’Vera Cohn, “Overall Number of U.S. Unauthorized Immigrants Holds steady Since 2009,” Pew Research Center, September 20, 2016, http://www.pewhispanic.org/2016/09/20/overall-number-of-u-s-unauthorized-immigrants-holds-steady-since-2009/ .
Je�ery S. Passel and D’Vera Cohn, “Children of Unauthorized Immigrants Represent Rising Share of K-12 Students,” Pew Research Center, November 17, 2016, http://www.pewresearch.org/fact-tank/2016/11/17/children-of-unauthorized-immigrants-represent-rising-share-of-k-12-students/ .
U.S. Department of Homeland Security, “Yearbook of Immigration Statistics 2014,” United States of America, December 15, 2016, https://www.dhs.gov/immigra-tion-statistics/yearbook/2014.
Jacob S. Rough and Matthew Hall, Deporting the American Dream: Immigration Enforcement and Latino Foreclosures.
Ibid., Jacob S. Rough and Matthew Hall.

2017 NAHREPPOLICY POSIT IONSOVERVIEWWith more than 26,000 members and 50 chapters, the National Association of Hispanic Real Estate Professionals® (NAHREP®) is one of the nation’s largest Hispanic business organizations. Annually it reevaluates its position on a number of key policy issues which have a direct impact on the association’s ability to accomplish its mission. The 2016 call to actionfocused on improving access to credit. While access to a�ordable mortgage credit remains a priority, in 2017 the association’s focus transitions to a three pronged approach on the most critical issues a�ecting sustainable Hispanic homeownership growth.
NAHREP is intent on ensuring a government focus that preserves access to homeownership
growth and does so without disrupting the country’s economic ecosystem.

NAHREP POLICY PRIORITIES
DUMP THE WALL
PRESERVE HOMEOWNERSHIP For First-time Homebuyers
SUPPORT SMALL BUSINESS SUCCESS
President Donald Trump launched his campaign with a commitment to end undocumented immigration by building a wall between the U.S. and Mexico and deporting the 11.3 million undocumented people who currently reside in the U.S. It is fair to assume that a porous border creates security risks, suppresses wages, and undermines the e�orts of our law enforcement community. However, net undocumented migration from Mexico has been zero in recent years and, as of 2014, more than two-thirds of the undocumented were admitted through legal channels and simply overstayed their visas. The Cato Institute deemed the border wall an impractical, expensive, and ine�ective solution, suggesting that spending $21.6 billion on a border wall that will take a minimum of 3.5 years to build is not a reasonable answer.
An annual Fannie Mae survey of consumer trends consistently illustrates that Hispanic enthusiasm for homeownership out-indexes that of every other ethnic group. Hispanics are expected to account for 52 percent of new homeowners from 2010 – 2030. In 2016, the overall U.S. homeownership rate reached a 51-year low while Hispanic homeownership continued a two-year increase and represented 74.9 percent of the net homeownership gains that year. As Hispanics are just entering their prime home buying years, policies that advance opportunities for hard-working families to realize their dreams of homeownership are especially critical to ensure additional homeownership gains by Hispanics.
Hispanics are entrepreneurs. Like many immigrant populations before them, the most plausible path to prosperity for many Hispanics is to start a business. Small businesses are also expected to add more private sector jobs than any other segment. However, the cost and risk of starting a small business are higher than ever before—especially for micro-businesses with two or fewer employees. The large majority of Hispanic-owned businesses are micro-businesses that are not impacted by the typical issues a�ecting larger businesses, such as the rising cost of paying for their employee’s healthcare. Rather, these small businesses are disproportionately impacted by high taxes and a complicated tax code.
2017 NAHREP POLICY POSITIONS18

DUMP THE WALL
2017 NAHREP POLICY POSITIONS 19
President Donald Trump launched his campaign with a commitment to end undocumented immigration by building a wall between the U.S. and Mexico and deporting the 11.3 million undocumented people who currently reside in the U.S. It is fair to assume that a porous border creates security risks, suppresses wages, and undermines the e�orts of our law enforcement community. However, net undocumented migration from Mexico has been zero in recent years and, as of 2014, more than two-thirds of the undocumented were admitted through legal channels and simply overstayed their visas. The Cato Institute deemed the border wall an impractical, expensive and ine�ective solution, suggesting that spending $21.6 billion on a border wall that will take a minimum of 3.5 years to build is not a reasonable answer.
From 2005 - 2014, deportations rose by 163 percent. While Hispanics represent two-thirds of the country’s undocumented population, they represent 96 percent of the people deported during that timeframe. Although approximately 40 percent of undocumented individuals are women, 85 percent of deportees are working men and are almost exclusively Hispanic. It is clear that Hispanics are disproportionately targeted for deportation. Given that Hispanics, including the undocumented, participate in the labor force at higher rates than any other segment of the U.S. population, deporting them in mass numbers will have a destabilizing e�ect on the U.S. economy. In addition, studies have shown a detrimental synergy between deportation of Hispanics and an increased number of home foreclosures, further suggesting that an enforcement approach to the country’s immigration quandary will a�ect not only Hispanics, but the country’s overall economy.
Hispanics care about more than just immigration. However, focusing so much of our government’s time, attention and resources on this divisive approach, which includes an expensive wall and mass deportations, elevates the issue’s importance for most Hispanics making it a burning platform requiring immediate engagement and attention.
Pass Comprehensive Immigration Reform: With majorities in both the House and the Senate, the current Administration is well positioned system once and for all. NAHREP urges the federal government to focus its e�orts on comprehensive immigration reform strategies which would constitute a more e�ective use of $21.6 billion than aborder wall.
Policy RecommendationsImmigrant and Non-Immigrant Visas: Immigrant visa issuance is capped at 7 percent from any one country for family-sponsored and employment-based visas, irrespective of demand or length of the wait list. As of November 2016, Mexico topped the list with 1,309,282 applicants on the wait list, more than the combined total of the next four countries (Philippines, India, Vietnam, and China). This means that for an immigrant from Mexico, where the demand to immigrate to the U.S. through the current system is greatest, the wait can be up to 20 years. Relying heavily on immigrant contributions while simultaneously expecting them to wait for decades to immigrate legally is an unreasonable expectation. In addition, given that most undocumented immigrants are currently in the U.S. by virtue of an overstayed non-immigrant visa obtained through legitimate means, creating a mechanism to consistently address this problem would also tackle the primary source of undocumented immigration to the U.S.
Deportation Relief: Approximately 1.5 million individuals have been granted temporary deportation relief under the Deferred Action for Childhood Arrivals (DACA) or Temporary Protected Status programs. These programs require renewal by participants since their relief from deportation is temporary.
Administration were not implemented. Those provisions would have protected an additional 3.9 million individuals, primarily parents of U.S. citizens or legal residents, from deportation. NAHREP urges the federal government to preserve current deportation relief provided under the previous administration and to consider additional relief for undocumented individuals.
Path to Citizenship: A majority of the undocumented have lived and worked in the U.S. for more than 10 years. They continue to make contributions to the economy by participating in the labor force, purchasing goods and services, and becoming
would increase their tax contributions and bring them out of a
•
•
•
Philippines387,323
India331,423
Mexico1,309,282
Vietnam266,297
China257,497
U.S. VISAAPPLICATIONSTop 5 Countries as of November 2016
Mexico has more than the combined
total of the next four countries.
Origin: U.S. Department of State

PRESERVE HOMEOWNERSHIP OPPORTUNITIESFOR HISPANICS AND OTHER FIRST-TIME HOMEBUYERS
2017 NAHREP POLICY POSITIONS20
An annual Fannie Mae survey of consumer trends consistently illustrates that Hispanic enthusiasm for homeownership out indexes that of every other ethnic group. Hispanics are expected to account for 52 percent of new homeowners from 2010 – 2030. In 2016, theoverall U.S. homeownership rate reached a 51-year low while Hispanic homeownership continued a two-year increase and represented 74.9 percent of the net homeownership gains that year. As Hispanics are just entering their prime home buying years, policies that advance opportunities for hard-working families to realize their dreams of homeownership are especially critical to ensure additional homeownership gains by Hispanics.
Policy Recommendations
While Hispanics have experienced steady income gains, wealth accumulation continues to lag. This circumstance directly a�ects homeownership prospects for families who can a�ord the monthly mortgage payments but may not have the down payment required to purchase a home. A�ordable lending products with low down payment requirements and private mortgage insurance that are guaranteed by Fannie Mae and Freddie Mac or fully insured by the Federal Housing Administration (FHA) program are the best sources of mortgage
margins continues to make it critical to Hispanics and other Preserving and protecting FHA
programs are vital to the overall housing economy. NAHREP
urges the federal government to implement the FHA mortgage insurance premium reduction (MIP) proposed in January 2017 making homeownership more a�ordable for Hispanics and other
Increase the availability of a�ordable homes by reducing barriers to new home construction. The home construction business was devastated during the great recession and while household formations grew by almost 5 million households from 2008 – 2014, the construction of new homes was almost non-existent. Lack of construction caused a massive shortage of a�ordable homes for purchase. The cost of over-regulation, excessive capital reserves, and leverage restrictions imposed on homebuilders and exorbitant construction fees have made building a�ordable homes cost prohibitive. The net results of this inventory shortage have been an increase in home prices and a decrease in a�ordability.
Improve tax policies that encourage homeownership. The Mortgage Interest Deduction (MID) and the Mortgage Insurance Deduction have provided billions of dollars in tax savings to homeowners for decades. Policies like the MID have helped to make the U.S. a nation of stakeholders; however, many homeowners do not itemize their deductions and are unable to take advantage of this valuable program. The federal government should consider enhancements to the MID such as a homebuyer tax credit moderate-income homebuyers.
•
•
•
SUPPORT SMALL BUSINESS SUCCESSHispanics are entrepreneurs. Like many immigrant populations before them, the most plausible path to prosperity for many Hispanics is to start a business. Small businesses are also expected to add more private sector jobs than any other segment. However, the cost and risk of starting a small business are higher than ever before – especially for micro-businesses with two or fewer employees. The large majority of Hispanic-owned businesses are micro-businesses that are not impacted by the typical issues a�ecting larger businesses, such as the rising cost of paying for their employee’s healthcare. Rather, these small businesses are disproportionately impacted by high taxes and a complicated tax code.
Policy Recommendations
Reducing the regulatory burden. Small businesses have more regulation to deal with than ever before. For example, rules regarding independent contractors have recently become overwhelming for small businesses. The Department of Labor has made it more di�cult for employers to classify people who
•
•
are integral to their business as independent contractors. The cost and complexities associated with managing employees versus independent contractors are prohibitive for many small businesses. In general, reducing the regulatory burden for small businesses would assist Hispanic entrepreneurs and get more people working.
Reducing taxes and simplifying the federal tax code. According to a survey of small business owners, nearly 60 percent said that administrative burdens were the biggest challenge to their businesses posed by federal taxes. Reducing taxes for small businesses and simplifying the tax code would have a positive e�ect. In addition, providing tax credits for micro-businesses with employees would help o�set Social Security and Medicare taxes that are the most burdensome for many micro-business owners.


591 Camino de la Reina, Suite 720San Diego, CA 92108
619-719-4480hispanicweal thpro ject .org