IN-AUTOCLAVE RESIDUAL STRESS … International Conference on Composite Science and Technology ... M....
12
10th International Conference on Composite Science and Technology ICCST/10 A.L. Araújo, J.R. Correia, C.M. Mota Soares, et al. (Editors) © IDMEC 2015 IN-AUTOCLAVE RESIDUAL STRESS PROGRESSION DURING MULTIPLE STEP FABRICATION OF COMPOSITE CYLINDERS A. Martone * , M. Esposito * , V. Antonucci * , M. Zarrelli * , M. Giordano * * Institute for Composite and Biomedical Materials National Research Council of Italy Ple E Fermi, 1 80055 Portici (NA), Italy [email protected] Key words: Composites, Manufacturing, FBG, Process-induced deformation, Cure Monitoring. Summary: Process-induced deformation represents a risk factor for composite structures as they affect surely the dimensional stability of the parts or the structural integrity. In this work, residual strains for a thick composite cylinder have been measured by FBG sensors. In addition a numerical procedure for predict strain state at the end of manufacturing process has been developed and compared to experimental data. 1 INTRODUCTION High performance composite materials are widely used in aerospace industry thanks to their intrinsic benefits such as lightweight, and high stiffness. Composite materials offer the chance to soften exorbitant raw material and manufacturing costs by monolithic design reducing the number of parts and leading to simplified geometries. Fabrication of high quality thick composite structures is still a major challenge for industry since such structures apt to the built-up of residual stresses related to process issues The manufacturing process of composite materials is a multi-physical problem since concerns thermodynamics, chemistry and mechanical topics. As matter of facts, thermal conduction within the mould and within the components drives the stress distribution within the part through gradients in degree of cure and/or mechanical distortions. Quality of components depends on ply deposition and cure process: factor as porosity, dry spots, degradation or cure gradients endanger structural efficiency of the composite parts. In line monitoring techniques allow the enhancement of final features of products by interconnecting raw materials, process and structural investigation [1]. In line sensing technology able to detect thermo-mechanical properties during the composite cure are based on ultrasonic transducers, thermometers, pressure and deformation sensors [2]. Typically, monitoring the cure process within the industry is limited to time and temperature. Usually the manufactures define cure profile according to resin manufacturer instructions. A cure monitoring system [3] offers several benefits such as - Allowing tailored cure schedules to suit the resins age and chemical integrity, - Measuring residual stresses, - Indicating when cure is complete, - Assisting in maintaining product quality, repeatability and reducing scrap rates by
Transcript of IN-AUTOCLAVE RESIDUAL STRESS … International Conference on Composite Science and Technology ... M....

10th International Conference on Composite Science and Technology
ICCST/10
A.L. Araújo, J.R. Correia, C.M. Mota Soares, et al. (Editors)
© IDMEC 2015
IN-AUTOCLAVE RESIDUAL STRESS PROGRESSION DURING MULTIPLE STEP FABRICATION OF COMPOSITE CYLINDERS
A. Martone*, M. Esposito*, V. Antonucci*, M. Zarrelli*, M. Giordano*
* Institute for Composite and Biomedical Materials
National Research Council of Italy
Ple E Fermi, 1 80055 Portici (NA), Italy
Key words: Composites, Manufacturing, FBG, Process-induced deformation, Cure
Monitoring.
Summary: Process-induced deformation represents a risk factor for composite structures as
they affect surely the dimensional stability of the parts or the structural integrity. In this
work, residual strains for a thick composite cylinder have been measured by FBG sensors. In
addition a numerical procedure for predict strain state at the end of manufacturing process
has been developed and compared to experimental data.
1 INTRODUCTION
High performance composite materials are widely used in aerospace industry thanks to
their intrinsic benefits such as lightweight, and high stiffness. Composite materials offer the
chance to soften exorbitant raw material and manufacturing costs by monolithic design
reducing the number of parts and leading to simplified geometries.
Fabrication of high quality thick composite structures is still a major challenge for industry
since such structures apt to the built-up of residual stresses related to process issues
The manufacturing process of composite materials is a multi-physical problem since
concerns thermodynamics, chemistry and mechanical topics. As matter of facts, thermal
conduction within the mould and within the components drives the stress distribution within
the part through gradients in degree of cure and/or mechanical distortions.
Quality of components depends on ply deposition and cure process: factor as porosity, dry
spots, degradation or cure gradients endanger structural efficiency of the composite parts. In
line monitoring techniques allow the enhancement of final features of products by
interconnecting raw materials, process and structural investigation [1].
In line sensing technology able to detect thermo-mechanical properties during the
composite cure are based on ultrasonic transducers, thermometers, pressure and deformation
sensors [2]. Typically, monitoring the cure process within the industry is limited to time and
temperature. Usually the manufactures define cure profile according to resin manufacturer
instructions. A cure monitoring system [3] offers several benefits such as
- Allowing tailored cure schedules to suit the resins age and chemical integrity,
- Measuring residual stresses,
- Indicating when cure is complete,
- Assisting in maintaining product quality, repeatability and reducing scrap rates by

A. Martone, M. Esposito, V. Antonucci, M. Zarrelli, M. Giordano
2
offering quantitative feedback on the cure process.
Fibre optic sensors revealed their effectiveness for composite application since their
dimensions are suitable for embedding within the stacking sequence without alter the
composite integrity [2,3,4]. In addition, chemical transformation of the matrix during cure
process does not affect the sensing capability of fibre optic sensors.
Karalekas et al. [5] demonstrated the capability of FBG sensors in providing information
on the degree of cure and evolution of fabrication induced strains inside the epoxy. In their
work a specimen was subjected to different temperature cycles, each cycle consisting of
three stages: (a) the ramp-up stage where the temperature was increased to the selected one
within 2 h, (b) a plateau where the temperature was kept constant for 9 h, (c) the cooling
down stage to room temperature after opening the oven door at the end of the plateau. The
cooling stage was fast enough to generate sufficient residual strains in each case.
Thermal deformation and/or external strain influence the spacing between reflective
surfaces and their refractive indexes. Environmental strains or temperature induce on optical
fibre interferometers a shift in the reflected wavelength peak is experienced.
An FBG is a periodic and permanent modification of the core refractive index value along
the optical fibre axis. An FBG is defined by several physical parameters: the grating length,
i.e. the gauge length where the index modulation have been realised; the periodicity (Λ) and
the amplitude (δn). The perturbation in the fibre core induces light coupling in two
propagating modes inside the core, the mode coupling occurs for some wavelength around
the Bragg wavelength defined by:
2Bragg effn (1)
Where neff
is the effective refractive index of the core at Bragg wavelength.
The effective refractive index of the core and spatial periodicity of the grating are both
affected by the changes in temperature and strain.
(1 ) ( )e glass
dP d dT
(2)
Where Pe is the elasto-optic coefficient (0.22 adimensional) while the thermal sensitivity
is about 6.67 10-6 /°C for optical fibre whose core is silicon dioxide. Actually, because FBGs
are made from different fabrication techniques, they show different sensing properties;
therefore the strain and temperature sensitivity coefficients of FBG should be determined by
calibration before we use it as strain or temperature sensors in practical applications,
especially for the packaged FBGs.
In this research, thermo-mechanical deformation achieved during the overall cure of a thick
cylinder made by autoclave process has been experimentally investigated by embedding FBG
(Fibre Bragg Grating) sensors into the composite. Actual practise for the manufacturing of
thick composite cylinders consists of multiple manufacturing steps: at each step, the
composite thickness is increased by wrapping additional un-cured layers.
FBG sensors embedded at each step allowed the estimation of temporal variation of strains
during the entire fabrication at different positions through the cylinder thickness.
Final results show a relevant strain relaxation at the cure dwell onset whereas residual
strain dramatically increases when further layered materials is wrapped
A numerical model of the residual stress built up phenomenon is also presented. The
computational analysis accounts for the cure-dependent viscoelastic properties of the
transversely isotropic materials for each wrapping steps during the whole manufacturing
First A. Author, Second B. Author, Third C. Author
3
process. Issues related to the sensing technology, data analysis and comparison with
numerical predictions are presented and analysed.
2 FIBER OPTIC SENSORS INTEGRATION
3.1 Fiber Bragg Grating. Signal processing and temperature compensation
Fiber bragg gratings are sensitive to both temperature and deformation field, the
integration of the equation (2) lead to the relation between peak shift and thermo-mechanical
forces acting on the sensor:
00
ln (1 ) ( )e glassP T
(3)
The deformation at initial state is assumed zero (0 0 ). This condition is correct only at
first polymerization step, i.e. when the sensor is embedded on the sample, in further steps the
deformation applied on the sensor should consider all previous steps.
Based on latter consideration, 0 has been considered for each sensor as nominal value
from sensor calibration in temperature calibration test at 30°C. If prestrain is present on the
sensor at first installation, the initial strain have been zeroed.
According to equation (3) the strain measured in the sensor is evaluated as:
6
0
10ln 30 0
1T
e
tt k T t C t
P
(4)
3.2 Integration of deformation sensors during manufacturing process
The manufacturing process of the test case is divided in five separated steps, at each step
three FBG array have been integrated within the composite: two bare array have been
embedded directly in the composite material while a third array is considered for temperature
compensation during the test.
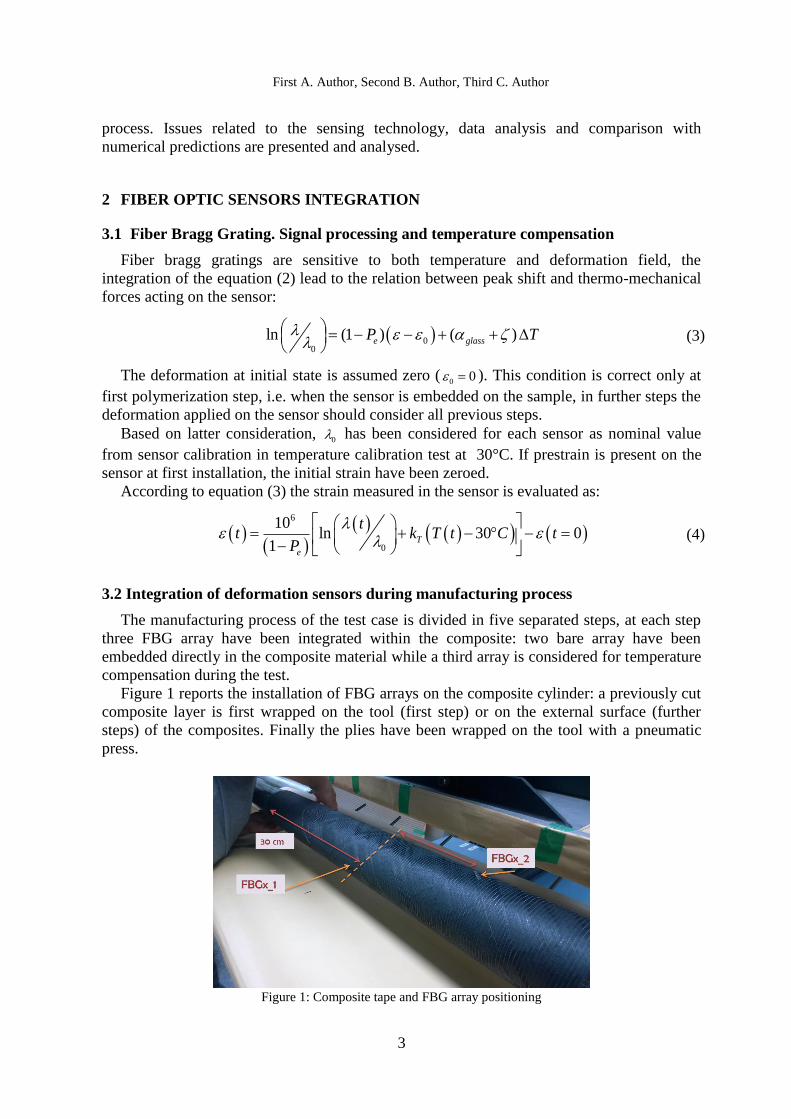
Figure 1 reports the installation of FBG arrays on the composite cylinder: a previously cut
composite layer is first wrapped on the tool (first step) or on the external surface (further
steps) of the composites. Finally the plies have been wrapped on the tool with a pneumatic
press.
Figure 1: Composite tape and FBG array positioning
A. Martone, M. Esposito, V. Antonucci, M. Zarrelli, M. Giordano
4
FBG Arrays contain two sensors spaced each other thirty centimetres. During the
installation the first sensor have been placed thirty centimetres inside the cylinder in order to
reduce boundary effect. The installation of free strain sensor is divided in two parts, during
wrapping stage an hollow carbon pipe is embedded in the composite cylinder then before
bagging stage TS array is inserted. Since carbon pipe has an external diameter of about 700
µm, a small strip of the UD tape has been cut out from the bottom layer. The temperature
FBG array is inserted within the cylinder at the end of manufacturing stage.
When all the required tapes have been wrapped on the tool, the cylinder is moved to a
lathe modified to automatically envelop the composite with nylon strips. Below the bag, a
fabric is applied in order to make easier the adhesion to further lamination step tapes.
Once the bag have been placed, all optical fibres are arranged on the tool to avoid pull out
due to the hot flow inside the autoclave chamber. Optical fibres should not tight on tool to
avoid, during its thermal expansion, dangerous loads, which could blind the measure. After
optical fibre disposition is complete and that all arrays are completed the cylinder is loaded in
the autoclave chamber. Optical fibres mounted at each step have been preserved in order to
measure the rise of strains in further manufacturing stages.
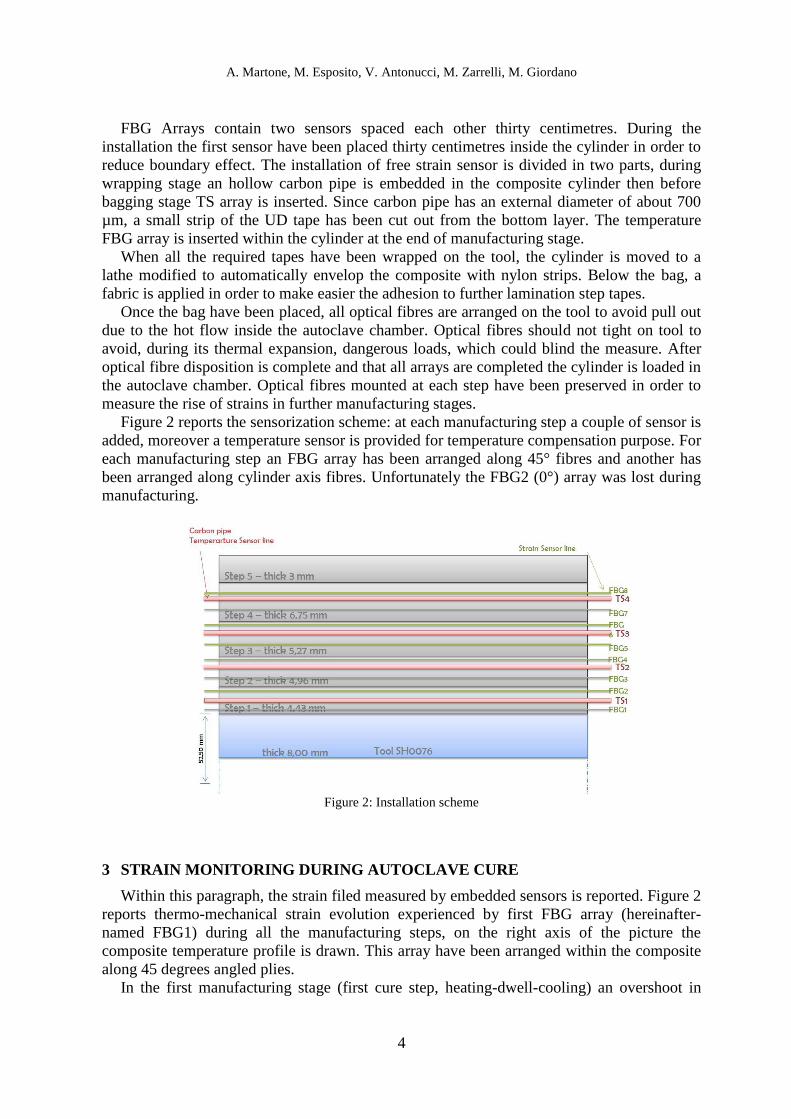
Figure 2 reports the sensorization scheme: at each manufacturing step a couple of sensor is
added, moreover a temperature sensor is provided for temperature compensation purpose. For
each manufacturing step an FBG array has been arranged along 45° fibres and another has
been arranged along cylinder axis fibres. Unfortunately the FBG2 (0°) array was lost during
manufacturing.
Figure 2: Installation scheme
3 STRAIN MONITORING DURING AUTOCLAVE CURE
Within this paragraph, the strain filed measured by embedded sensors is reported. Figure 2
reports thermo-mechanical strain evolution experienced by first FBG array (hereinafter-
named FBG1) during all the manufacturing steps, on the right axis of the picture the
composite temperature profile is drawn. This array have been arranged within the composite
along 45 degrees angled plies.
In the first manufacturing stage (first cure step, heating-dwell-cooling) an overshoot in

First A. Author, Second B. Author, Third C. Author
5
deformation is clearly visible related to the cure of the polymer matrix while in further stages
it disappears, since the material is fully cured. It is worth to notice that the sensors have been
mounted at same radius and different position along cylinder axis; experimental data confirm
the symmetric behaviour of the system: as matter of the facts, figures show the black and red
curves overlapping each other with very good approximation
Figure 2: FBG1 array strain history over four manufacturing steps
During later manufacturing stages, at the end of the dwell time, the load applied by
external additional material change the deformation filed experienced by sensor leading to
horn-like strain profiles.
Figure 4: FBG4 array strain history over four manufacturing steps
-50
-30
-10
10
30
50
70
90
110
-200
-100
0
100
200
300
400
500
600
0 1000 2000 3000 4000 5000 6000
Tem
per
atu
re (
°C)
stra
in (
µε)
time (min)
history
FBG1_1 FBG1_2 T_comp
-50
-30
-10
10
30
50
70
90
110
-140
-120
-100
-80
-60
-40
-20
0
20
40
0 1000 2000 3000 4000 5000 6000
Tem
per
atu
re (
°C)
stra
in (
µε)
time (min)
history
FBG4_1 FBG4_2 T_comp

A. Martone, M. Esposito, V. Antonucci, M. Zarrelli, M. Giordano
6
Figure 4 reports deformation field experienced by array FBG4. This array has been placed
within the composite during second manufacturing stage along 0° plies (fibres are arranged
along cylinder axis).
a)
b)
c)
d)
e)
f)
Figure 5: strain history over four manufacturing steps for arrays installed in stage 2 and further
Figure 5 reports deformation histories experienced during further manufacturing stages.
Pictures on the left side are related to arrays oriented on the 45° direction while right side
refers to array arranged along cylinder axis. Each row of the figure reports data from stages 2,
3,4 respectively.
4 RESIDUAL STRAINS BUILT-UP MODELLING
4.1 Thermo-chemical model
Thermoset resins transform from a liquid state to a solid state at elevated temperatures,
their cure progress should be described by empirical rate equations. Latter approach derives a
-50
-30
-10
10
30
50
70
90
110
-600
-400
-200
0
200
400
600
0 1000 2000 3000 4000 5000 6000
Tem
per
atu
re (
°C)
stra
in (
µε)
time (min)
history
FBG3_1 FBG3_2 T_comp-50
-30
-10
10
30
50
70
90
110
-140
-120
-100
-80
-60
-40
-20
0
20
40
0 1000 2000 3000 4000 5000 6000
Tem
per
atu
re (
°C)
stra
in (
µε)
time (min)
history
FBG4_1 FBG4_2 T_comp
-50
-30
-10
10
30
50
70
90
110
-600
-400
-200
0
200
400
600
800
0 1000 2000 3000 4000 5000 6000
Tem
per
atu
re (
°C)
stra
in (
µε)
time (min)
history
FBG5_1 FBG5_2 T_comp-50
-30
-10
10
30
50
70
90
110
-140
-120
-100
-80
-60
-40
-20
0
20
40
60
0 1000 2000 3000 4000 5000 6000
Tem
per
atu
re (
°C)
stra
in (
µε)
time (min)
history
FBG6_1 FBG6_2 T_comp
-50
-30
-10
10
30
50
70
90
110
-600
-400
-200
0
200
400
600
800
1000
0 1000 2000 3000 4000 5000 6000
Tem
per
atu
re (
°C)
stra
in (
µε)
time (min)
history
FBG7_1 FBG7_2 T_comp-50
-30
-10
10
30
50
70
90
110
-140
-120
-100
-80
-60
-40
-20
0
20
40
0 1000 2000 3000 4000 5000 6000
Tem
per
atu
re (
°C)
stra
in (
µε)
time (min)
history
FBG8_1 FBG8_2 T_comp

First A. Author, Second B. Author, Third C. Author
7
phenomenological mathematical description of curing process from experimental assessment
on DSC (differential scanning calorimetry). The approach assumes the exothermic heat flow
proportional to the degree of conversion. Different expressions have been proposed to model
the rate of reaction [7-8], within this work the model used to fit the experimental data in both
dynamic and isothermal conditions is the following:
1 2
1 21 1r rd
k kdt
(5)
While the resin cure, three different morphological state will be passed, the resin converts
from liquid to rubbery state and finally to solid state. Such different resin state are not
discontinuity in real system, but they are usually modelled as discontinuous points function
of glass transition temperature. The Di Benedetto's equation, is commonly used for
computation purpose in the following form [9]:
01
1
g g
g
T TT
(6)
Where 0gT and gT are the transition temperature for the uncured system and for the fully
cured system respectively, is a fitting parameter. The table below reports fitting parameter
for the epoxy system considered within this work
LogA1
1/sec
E1
kJ/mol
r1 lgK1diff
1/sec
logA2
1/sec
E2
kJ/mol
r2 a2 logK2diff
1/sec
C1 C2
K
13.7 124.8 86.3 -17.3 8.6 80.2 2.2 1.1 95.1 84.1 143.4
4.2 Viscoelastic constitutive equations
The stress relaxation function for thermo-rheological simple materials should be modelled
by a finite exponential series as [10]:
0
1
,, exp
N
ij ij ij ij m
m m
TQ Q Q Q w
(7)
The experimental data collected at different temperatures can be “shifted“ relative to the
frequency of loading, so that the various curves can be aligned to form a single master curve.
The master curve can be constructed using an arbitrary selected reference temperature (
100refT C ) and shifted congruently.
Unidirectional tape employed have been experimentally investigated to determinate the 5
independent functions 11Q t , 22Q t , 12Q t , 23Q t , 44Q t of the relaxation matrix in the
constitutive stress strain material relation. Independent stiffness relaxation functions have
been evaluated by considering their expression as function of independent engineering
constants for transversely isotropic materials:
1211 11 22 22 12 222
23 23
2322 22 44 122
23
1; ; ;1 1
; ;1
Q E Q E Q E
Q E Q G
(8)
Once master curve is available according to procedure described, the relaxation moduli

A. Martone, M. Esposito, V. Antonucci, M. Zarrelli, M. Giordano
8
and relaxation times should be evaluated by curve fitting procedure: the problem formulation
for the evaluation of the master curve parameters is reported.
210
0 0 21
10
1
E( )1
1 , 0 1
i
i
ii
i i
i
E E E w
w w
(9)
4.3 Problem reduction – Finite elements formulation
Due to symmetry assessments, all derivatives with respect to the angular coordinate ϑ
vanish. The equilibrium equations have been solved through the Finite Element Method. The
discretization along the cylinder thickness is dependent by the stacking sequence and by the
number of elements for each layer.
4.3.1 Heat transfer module
Within the autoclave, environment transfer energy to composite cylinder by convection.
Energy equilibrium for axisymmetric problem, considering the exothermic reaction of the
resin, are:
2
2
11
,
p r r f
T T Tc k k H v
t r r r t
f Tt
(11)
Where T is the temperature, χ is the degree of cure, r is the radius, t is the time, ρ is the
composite density, r the resin density, k the radial conductivity, pc the composite thermal
capacity, rH the cure Enthalpy, f the volumetric fibre fraction.
Boundary condition between composite and air on the external surface and between mould
and air on the internal tool surface, have been imposed according to the following equations:
ri int a i
re ext e a
J h T t T
J h T T t (10)
Where 𝐽𝑟𝑖 is the internal radial heat flow, 𝐽𝑟𝑒 is the external radial heat flow, ℎ𝑖𝑛𝑡 is the
internal convective heat exchange coefficient, ℎ𝑒𝑥𝑡 is the external convective heat exchange
coefficient, 𝑇𝑎(𝑡) is the air temperature in the chamber, 𝑇𝑖 is the temperature at the internal
surface of the tool, 𝑇𝑒 is the temperature at the external surface of the composite.

First A. Author, Second B. Author, Third C. Author
9
Figure 6: Thick composite cylinder in autoclave chamber under environmental conditions.
4.3.2 Mechanical module
In cylindrical coordinates, for axisymmetric problems the mechanical equilibrium
equations become:
0
2 0
0
rr rz
r z z
rz z rz
r z r
r z r
r z r
(12)
Boundary conditions require that external surface is in equilibrium with the environmental
pressure, in addition the external surfaces are free of transverse stresses:
, ; , 0; , 0;r ext r ext rz extR t p t R t R t (13)
5 DISCUSSION
Longitudinal strains changes during the cure cycle are almost negligible (figure 5), it is
worth to notice that strain are mainly negative since coefficient of thermal expansion of
carbon fibre is slightly negative. Even in that case, the chemical shrinkage at cure onset is
visible as a change in the strain peak before the temperature dwell.
Figure 7 reports the deformation history of array FBG1 over all steps on the same
temporal axis. In the picture, the curves reproducing the strain level during isothermal phase
(black curve) and residual strain level at the end of the step (green curve) have been reported.
The strain level at plateau seems to be constant over all steps while residual strain
dramatically increase when additional material increase in further manufacturing steps.

A. Martone, M. Esposito, V. Antonucci, M. Zarrelli, M. Giordano
10
Figure 7: FBG1 array strain history over four manufacturing steps
Figure 5-a reports the strain profile in the case of array FBG3. Pictures reports the residual
strain rise up during step2, step3 and step4. This array has been installed within second
manufacturing stage; the overshoot visible at the installation stage refers to the chemical
shrinkage due to resin cure. In further steps, overshoot following heating ramp are smaller, a
rationale for such behaviour should be small residual cure in third and fourth stages.
Figure 8: Comparison between experimental data (dashed lines) and numerical (solid lines)
Comparison between numerical prediction and experimental results is presented in the
figure 8), curves of the same colour refer to same radial position. Numerical predictions
showed fair agreement with experimental data over all the manufacturing procedure the
absolute differences are generally lower than 150µε.
The differences between numerical results and experimental data are related to sensors
arranged 45° direction respect to the cylinder axis. Experimental data show higher residual
compression at the end of the cooling stage if compared with the numerical predictions.
Higher compression state in cooling stage is consistent with the hypothesis of “more
hoop” configuration of sensors and/or the wrapped tape. At the warming up of the cylinder,
the nominal ply orientation (45°) should be varied toward a more “hoop” configuration due to
the thermal expansion of the tool. This reconfiguration is consistent with the fluid like status
of the matrix before gelation. In addition, such discrepancy of the angle ply in respect with
-200
-100
0
100
200
300
400
500
600
0,0 1000,0 2000,0 3000,0 4000,0 5000,0 6000,0
Stra
in, µε
time, min
Deformation history
FBG1-1
plateau
residual

First A. Author, Second B. Author, Third C. Author
11
nominal value is also consistent with anomalies during the wrapping phase.
Figure 9 show the comparison between numerical and experimental strain histories
considering within the model a deviation to a more hoop condition of 45° ply.
a)
b)
c)
d)
Figure 9: Comparison with experimental data
6 CONCLUSIONS
In this work, a cure monitoring system using FBG sensors was devised to monitor the cure
cycle of a thick composite component with the purpose of reducing the thermal residual
stresses. The thermos-viscoelastic residual stresses residual stresses within a polymer
composites cylinder made by multiple manufacturing stages were experimentally
investigated and numerically modelled.
The strain evolution during manufacturing steps showed that the addition of composite
plies in multiple manufacturing step lead to the rise of a compressive strain state on the
cylinder.
The numerical procedure proposed was able to reproduce experimental data, but some
discrepancies were detected considering sensor arranged on tapes ringing around the
cylinder. The model was corrected by considering a possible mismatch to the nominal
orientation of such plies due to a possible rearrangement before gelation driven by tool
expansion.
ACKNOWLEDGEMENT
This activity has been performed within the seventh framework program, grant “SCYPRI-
Smart Cylinders for Flexographic Printing Industry”. The Authors would like to thanks
Reglass staff who actively contribute to in-autoclave experimentations.

A. Martone, M. Esposito, V. Antonucci, M. Zarrelli, M. Giordano
12
REFERENCES
[1] Fonseca G.E., Dubè M.A., Penlidis A., A Critical Overview of sensors for Monitoring
Polymerizations. Macromolecular Reaction Engineering, Vol 3, pp327-373, 2009.
[2] Konstantopoulos S., Fauster E., Schledjewski R., Monitoring the production of FRP
composites: A review of in-line sensing methods. Express Polymer Letters, Vol. 8, pp.
823-840, 2014.
[3] V. Antonucci, M. Giordano, A. Cusano, J. Nasser, L. Nicolais, Real time monitoring of
cure and gelification of a thermoset matrix, Composites Science and Technology, Vol.
66, 2008.
[4] Fernando G.F., Fibre optic sensor systems for monitoring composite structures.
Reinforced Plastics, Vol. 49, pp. 41-50, 2005.
[5] D. Karalekas, J. Cugnoni, J. Botsis, Monitoring of process induced strains in a single
fibre composite using FBG sensor: A methodological study, Composites Part A: Applied
Science and Manufacturing, Volume 39, Issue 7, July 2008, Pages 1118-1127, ISSN
1359-835X, http://dx.doi.org/10.1016/j.compositesa.2008.04.010.
[6] Antonucci V., Giordano M., Imparato S.I., Nicolais L., Autoclave Manufacturing of
Thick Composites, Polymer Composites, Vol. 23, Issue 5, 2002.
[7] Hale A., Macosko C.W.,Bair E.H.,Glass transition temperature as a function of
conversion in thermosetting polymers, Macromolecules, Vol 24 (9),pp. 2610-2621,
1991.
[8] Luo Z., Wei L., Li W., Liu F., Zhao T., Isothermal differential scanning calorimetry
study of the cure kinetics of a novel aromatic maleimide with an acetylene terminal,
Journal of Applied Polymer Science, Vol 109, pp. 1097-4628, 2006.
[9] Di Benedetto A. T., Prediction of the glass transition temperature of polymers: A model
based on the principle of corresponding states, Journal of Polymer Science Part B:
Polymer Physics, Vol 25, pp. 1949-1969,1987.
[10] Kim Y.K., White S.R., Stress relaxation behaviour of 3501-6 epoxy resin during cure,
Polymer Engineering & Science, Vol.36, pp. 2852-2862, 1996.
[11] Maffezzoli, A Grieco, A., Optimization of Parts Placement in Autoclave Processing of
Composites Journal of Applied Composite Materials, Vol. 20 (3), 2012.