in Alberta Municipalities - Microsoft · PDF filePopulation and Fiscal Stresses in Alberta...
82
2 PHASE TWO Population and Fiscal Stresses in Alberta Municipalities
Transcript of in Alberta Municipalities - Microsoft · PDF filePopulation and Fiscal Stresses in Alberta...

2P H A S E T W O
Population and Fiscal Stresses in Alberta Municipalities

Vision 2020
Phase II Report:
Population and Fiscal Stresses in Alberta Municipalities
September 2005

The opinions and conclusions in this report are those of the author and do not necessarily reflect those of the Alberta Chambers of Commerce, the Certified General Accountants Association of Alberta or other contributors to the Alberta Chambers of Commerce research fund.

i
Foreword Alberta is in the midst of dramatic changes that are already reshaping the province and its future. The population has grown by over one million people since 1991 or by 70 per cent. Most of the population growth has been in the major two metropolitan areas of Edmonton and Calgary and their surrounding regions or in the corridor that runs between them through Red Deer. In the north, Fort McMurray has also become a large energy city and in the south, Lethbridge became an agricultural processing centre. At the same time much of rural Alberta has also seen dramatic change. People have left the land and many smaller communities, as farms became larger and agricultural productivity continued to increase, requiring fewer farm and rural employees. Many smaller rural communities and counties in the province are in decline at the same time as the province “booms.” These demographic changes are placing huge pressures on Alberta’s municipalities, responsible for providing services to the people of the province. In the cities and the surrounding fast growing counties and towns, demands for transportation infrastructure, waste disposal and many other municipal services have far exceeded the capacity of local government to finance them through the property tax base. In many declining rural areas a shrinking population could no longer maintain the existing infrastructure. In both cases high levels of provincial and federal governments have periodically injected funds in attempts to fill the infrastructure financing gap. Prospects for the future suggest a continuation of these trends for both urban growth and rural decline. The status quo is therefore no longer a financially sustainable or responsible option. A more comprehensive evaluation of the foundations for infrastructure financing in the province is required. This paper by Joel Emes has taken a hard look at the background, structure and prospects for infrastructure financing in Alberta. It is clear from the analysis that many of the province’s municipalities will continue to require an expansion of their municipal infrastructure base and that the current system of financing can be improved. The traditional and main source of municipal financing for provincial infrastructure in the form of the property tax has been shown to be inadequate for the social challenge and the economic opportunity that must be met to 2020. In too many growing and declining centres the revenues for infrastructure financing do not keep pace with the expenditure requirement. This situation is not sustainable! Fortunately, options for fiscal reform are available in many areas that include the transfer of federal and provincial tax authorities for a wide range of fiscal instruments to the municipal order of government, through alternative means of public service delivery and through the development of municipal structures and institutions that better meet the new geography of people and their daily movements to and from work.
ii
The process of infrastructure financing reform is not unique to Alberta, but is now underway throughout the western world. Opening a dialogue on the issue and alternatives, however, is now important if infrastructure constraints are not to limit the province’s growth or act as deterrents to the restructuring of many rural areas. Alberta’s municipal framework and its base for financing was established when the province and its economy was rural. The development of new urban corridors, large cities and declining rural areas requires a fundamental reconsideration of the organization, financing and operational powers available to the local order of government that is perhaps most closely connected to the province’s people. As Emes notes in his conclusion,
“Future productivity gains and standard of living improvements will need a reliable, efficient infrastructure system. … All orders of government need to craft long-term solutions to the underlying cause of Alberta’s and Canada’s infrastructure deficit and debt – an inadequate local government finance model.”
Accordingly, the paper opens an important discussion on infrastructure financing reforms for Alberta and recommends a series of public dialogues on the matters of municipal infrastructure, financing, organization and statutory reform in both the fastest and slowing parts of the province. It is important that an early agenda for reform be established to provide the essential transportation, water, waste management, energy and other frameworks that will be the foundation for the next round of sustainable growth in the province. Dr. Graham Parsons President Organisation for Western Economic Cooperation

iii
Executive Summary Vision 2020 This report is the second in the Vision 2020 project series. Vision 2020 is a multi-year project intended to provide insight on how demographic changes may impact Alberta’s economic, social and policy landscape and to track how government responds to the challenges that these changes present. Scope of Phase II Many Alberta communities face long-term challenges related to population changes and infrastructure finance. “At risk” communities can be placed into one of two main categories: 1) those where recent and ongoing population growth, which is expected to continue in the long-term, is outpacing infrastructure financing, management and delivery capability and 2) those where declining economic activity and population outflows are contributing to fiscal challenges. This phenomenon is not unique to Alberta. Population migration to concentrated corridors of economic activity will continue to change our provincial landscape over the next twenty years – affecting public service delivery capacity and finance in the magnet areas, as well as the areas losing population. The challenges associated with these changes should be dealt with in a thorough, comprehensive manner, so as to enhance Alberta’s competitive position relative to other countries, both developed and emerging. We don’t have twenty years to get this right; change is needed now! Intent of Phase II Phase II of Vision 2020 reviews how Alberta and competing jurisdictions – both Canadian and international – fund municipalities. It looks into the finance reform options that have been suggested for Canada generally, and Alberta specifically, to help address the challenges associated with population concentration in growth corridors. An integral part of this paper is a discussion of the “stressed” Alberta communities. They face the divergent risks of stress from decreasing population and fiscal difficulties in one group made up of largely rural and northern communities, and rapidly increasing population and fiscal difficulties in the other group including major cities and their connecting corridors. The focus here will be to identify characteristics of each group, explain why both have challenges related to municipal finance, and look for solutions that can address these challenges while getting the maximum benefit for taxpayers’ money. Overview of Research Findings and Recommendations Alberta’s population is increasingly concentrated in urban areas. This transformation, whereby roughly 81 per cent of the population lives in urban areas, has been coupled with a decrease in the local share of total government spending. Municipalities bear most of the costs associated with economic growth, while senior orders of government reap the rewards because their tax base is more comprehensive than municipalities’ property tax

iv
base. Demographic changes, under-funding of infrastructure, and large decreases in federal and provincial transfers in the 1990s have seen the development of a large infrastructure debt in Alberta and Canada as a whole. Based on population, Alberta’s share of the estimated infrastructure debt ranges from $5.7 billion for the local municipal sector alone, to $12.5 billion for all governments. Not only does this debt need to be addressed, but also the underlying causes of the annual and continuing infrastructure deficit urgently need attention. Provincial and federal government actions to address the infrastructure debt are planned under the existing municipal finance structure, but do not include allowing any changes to how municipalities fund the services they provide. Municipalities Under Stress Municipal stresses caused by population declines or rapid growth, as well as expenditure growth in excess of revenue growth, are reviewed in this paper. Specifically, municipalities with negative population growth and those with population growth more than twice the provincial average over the period 1995 through 2003 were identified as being under population stress. Fiscal data for these groups were analyzed and municipalities were also identified as being under fiscal stress if operating expenditure growth exceeded operating revenue growth for the period 1995 through 2003.
Negative Population Growth There are 21 municipal districts (MDs) and special areas (SAs) and 22 towns that saw population declines between 1995 and 2003. Taken together, the MDs lost 4,738 people (5.6 per cent) from 84,540 in 1995 to 79,802 in 2003, and the towns lost 2,867 people (5.2 per cent) from 54,762 in 1995 to 51,895 in 2003. In addition to losing population over the period, eight of the 21 municipal districts, representing 31 per cent of the aggregate population and 17 of the 21 towns (75 per cent of the population), saw spending grow faster than revenues. High Population Growth Two cities, two municipal districts, two specialized municipalities, and 11 towns saw population increases more than twice the provincial average between 1995 and 2003. In contrast with the municipalities that lost population, the strong growth group tended to have a strong relationship with a Census Metropolitan Area (CMA) or a Census Agglomeration (CA), often within the Calgary-Edmonton Corridor (CEC). However, not all of the strong growth areas are close to the CEC. The Regional Municipality of Wood Buffalo grew by 53 per cent between 1995 and 2003, Grande Prairie grew by 38 per cent and the municipal district of Mackenzie saw growth of 33 per cent. In addition to rapid population growth over the analysis period, nine of the 17 municipalities, representing 62 per cent of the aggregate population, saw spending grow faster than revenues. In addition to tackling the infrastructure debt, the current municipal finance system is in need of reform to address weaknesses. The system needs long-term, sustainable solutions. Many possibilities for reform have been suggested as of late, with focal points ranging

v
from accounting and information systems to capital finance and taxation. Some reforms, such as adjustments to property taxes and user fees, could be undertaken within existing arrangements, while those focused on new revenue tools for municipalities including income and sales taxes, hotel/motel occupancy taxes, and fuel tax sharing would require action by senior order governments. From this list of options, recommendations are made for: changes to accounting and information systems; user fees and the property tax; capital finance; gas tax revenue sharing; and, linking transfers to provincial personal income tax revenue. The reform options represent a wide range of possibilities and are a dramatic shift away from standard municipal practice in the 20th century. Therefore, a longer-term recommendation is for the reform process to include a widespread public consultation to get Albertans’ views about what services they expect from their municipal governments, and how they would prefer government be organized. Local governments shared the pain of fiscal retrenchment in the 1990s, and could face large and unpredictable cuts to their funding again if senior orders of government run into another funding crunch, perhaps derived from financing health care. A long-term solution to the infrastructure debt – involving fixing the current finance system – will benefit Alberta and the country as a whole.

Table of Contents – Overview
Foreword ....................................................................................................................... …...i
Executive Summary ........................................................................................................... iii I. Introduction..............................................................................................................1 II. Municipal Infrastructure Funding and Deficits........................................................3 III. Municipalities Under Stress...................................................................................21 IV. Reform Options......................................................................................................43 IV. Summary, Conclusions and Policy Recommendations .........................................53 Appendix A – Methodology ..............................................................................................60 References..........................................................................................................................66

Table of Contents – Detailed Foreword .............................................................................................................................. i
Executive Summary ........................................................................................................... iii I. Introduction..............................................................................................................1 Vision 2020 .......................................................................................................................................1 Phase II Objectives ...........................................................................................................................1 Organization of the Paper.................................................................................................................2 II. Municipal Infrastructure Funding and Deficits .......................................................3 Introduction.......................................................................................................................................3 Historical Perspective .......................................................................................................................3 Municipal Finance Overview ............................................................................................................5 Local Government: International......................................................................................................8 Transfers to Local Governments in the 1990s...................................................................................9 Infrastructure Deficit and Debt.........................................................................................................9 Demographic Outlook and Emerging Risks ....................................................................................11 Provincial and Federal Government Initiatives..............................................................................13 Summary..........................................................................................................................................17 III. Municipalities Under Stress...................................................................................21 Recent Population and Fiscal Changes in Alberta Municipalities .................................................21 Alberta Municipal Structure............................................................................................................21 Population Changes by Census Division ........................................................................................22 Negative Population Growth Municipalities...................................................................................26 High Population Growth Municipalities .........................................................................................30 Calgary to Edmonton Corridor.......................................................................................................33 Potential Transportation and Energy Corridors.............................................................................39 Summary..........................................................................................................................................41 IV. Reform Options......................................................................................................43 Overview and Guiding Principles ...................................................................................................43 Define Who Does What ...................................................................................................................43 Structural Reform Options ..............................................................................................................44 Taxation and User Fees ..................................................................................................................46 Capital Finance Reform..................................................................................................................49 Transfers .........................................................................................................................................49 Summary..........................................................................................................................................51 V. Summary, Conclusions and Policy Recommendations .........................................53 Summary..........................................................................................................................................53 Conclusions and Recommendations................................................................................................56 Appendix A – Methodology ..............................................................................................60 References..........................................................................................................................66

Glossary and List of Acronyms
GLOSSARY
Agglomeration In basic terms, the shift in population as people move from rural to urban areas. Operating Expenditures Operating expenditures are those necessary for day-to-day operations. Capital Expenditures Capital expenditures are those for capital assets that have a life expectancy beyond the current year. Examples include buildings, infrastructure, large equipment and vehicles. Municipal Expenditure Categories (Partial List) Protection – Courts, correction, police, firefighting and regulation Transportation – Roads and streets, snow and ice removal, parking and public transit Environment – Water, sewer, solid waste collection and disposal, and recycling Rural Metro-Adjacent Areas (RMAs) An RMA is defined as those regions not classified as part of the urban core (therefore outside the core city part of a census metropolitan agglomeration (CMA)), but that are directly adjacent to those urban cores and/or within a reasonably short commuting distance. Sustainability Sustainability in government finance has many possible definitions, which vary depending on what one views as the appropriate role for government in society. Some would accept a high level of taxation, government spending and even the accumulation of debt with the expectation that the budget would eventually be balanced. Others would prefer a minimal level of taxation and government spending, with a constantly balanced budget.
LIST OF ACRONYMS CA – Census Agglomeration CD – Census Division CEC – Calgary to Edmonton Corridor CMA – Census Metropolitan Area RMA – Rural Metro-Adjacent Area OECD – Organization for Economic Cooperation and Development

About the Author Joel Emes is currently a senior analyst with the BC Progress Board and principal with Abacus Economics. His current work is focused around economic modeling and cross-jurisdictional comparisons of economic and social indicators. From 1996 - 2002, he was senior research economist at The Fraser Institute. His articles have appeared in the National Post, the Globe and Mail, the Calgary Herald, the Vancouver Sun and the London Free Press. He received his M.A. in Economics from Simon Fraser University in 1995. Acknowledgements I wish to thank my main reviewer, Graham Parsons, for his many helpful and insightful comments. My appreciation extends to the research sponsors for comments, which also helped shape the final product. The Ministry of Municipal Affairs in Alberta provided considerable assistance in my efforts to organize, understand and analyze the municipal population and financial information, which forms the foundation for this paper. As always, Dennis Wong and his colleagues at Statistics Canada provided prompt, insightful assistance. Any errors or omissions that remain in the paper are my responsibility alone.

1
I. Introduction Vision 2020 This report is the second of several envisioned as part of the Vision 2020 project, which has the following main goals:
• provide insight on what Alberta’s economic, social and policy landscape might look like in 2020 given expected demographic changes;
• benchmark Alberta’s performance on key economic and social indicators and analyze government performance in related policy areas;
• supply useful, accessible information and possible solutions to Albertans about some of the challenges that demographic change is likely to bring; and,
• encourage discussion of issues among Albertans, including legislators and the media, and where appropriate, encourage action to mitigate or alleviate foreseeable problems.
Phase II Objectives Objectives of the current project are to:
• quantify Alberta’s infrastructure debt and its underlying causes; • describe provincial and federal initiatives that relate to infrastructure; • provide an overview of the range of fiscal and other reforms available to deal with
the infrastructure debt and its underlying causes; • identify municipalities that are under stress from either population declines or rapid
increases, coupled with expenditure growth in excess of revenue growth; • describe recent and expected demographic changes and the impact of these changes
on the future population make-up of the province; and, • in light of demographic change and the underlying cause of the infrastructure debt,
suggest reforms to alleviate the underlying cause of the debt and allow municipalities to deal with future growth.
Limitations of the current municipal structure have been brought into sharp relief by the combination of infrastructure under-funding, ongoing demographic changes, and the recent decline in provincial and federal government support for municipalities in the form of large decreases in transfers. The most obvious result of this weakness is Alberta’s infrastructure debt. Unfortunately, it is the debt, rather than its underlying causes, that is getting most of the attention. Recent provincial and federal funding announcements may effectively deal with the current debt and help alleviate the annual shortfall in infrastructure spending. However, demographic forces are expected to continue to reshape the province, with a further concentration of population in the Calgary to Edmonton Corridor at the expense of rural areas.
2
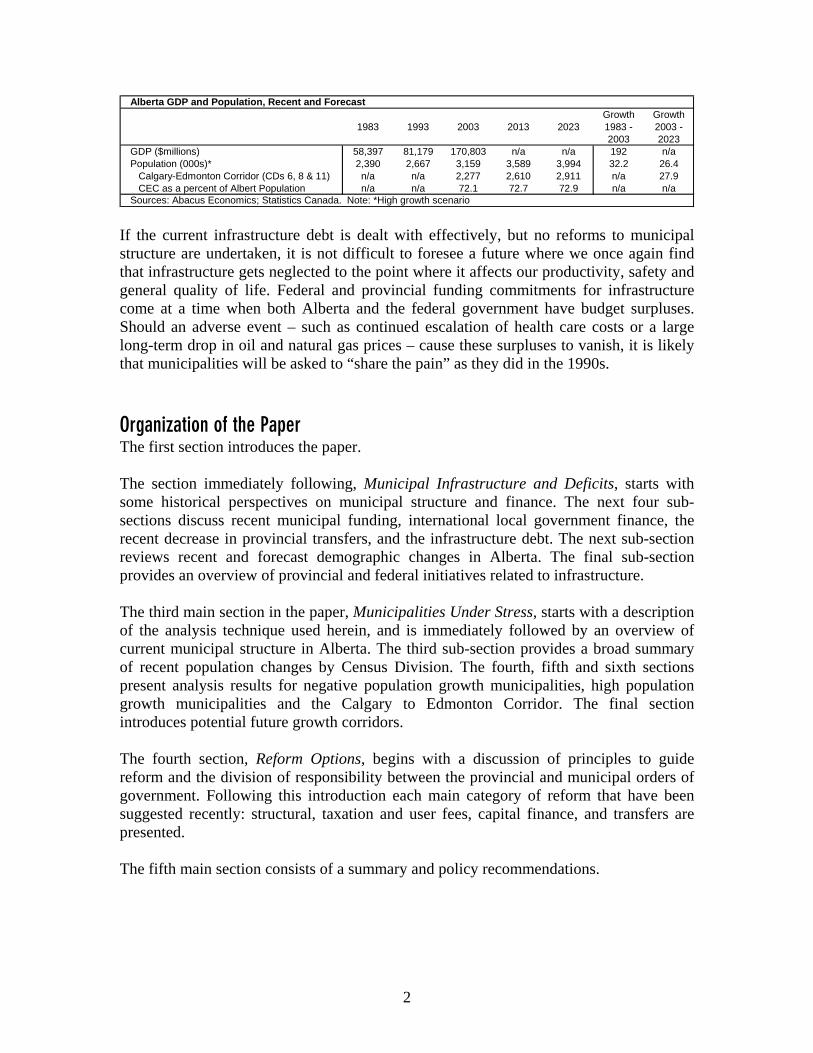
1983 1993 2003 2013 2023Growth 1983 - 2003
Growth 2003 - 2023
GDP ($millions) 58,397 81,179 170,803 n/a n/a 192 n/aPopulation (000s)* 2,390 2,667 3,159 3,589 3,994 32.2 26.4
Calgary-Edmonton Corridor (CDs 6, 8 & 11) n/a n/a 2,277 2,610 2,911 n/a 27.9CEC as a percent of Albert Population n/a n/a 72.1 72.7 72.9 n/a n/a
Sources: Abacus Economics; Statistics Canada. Note: *High growth scenario
Alberta GDP and Population, Recent and Forecast
If the current infrastructure debt is dealt with effectively, but no reforms to municipal structure are undertaken, it is not difficult to foresee a future where we once again find that infrastructure gets neglected to the point where it affects our productivity, safety and general quality of life. Federal and provincial funding commitments for infrastructure come at a time when both Alberta and the federal government have budget surpluses. Should an adverse event – such as continued escalation of health care costs or a large long-term drop in oil and natural gas prices – cause these surpluses to vanish, it is likely that municipalities will be asked to “share the pain” as they did in the 1990s. Organization of the Paper The first section introduces the paper. The section immediately following, Municipal Infrastructure and Deficits, starts with some historical perspectives on municipal structure and finance. The next four sub-sections discuss recent municipal funding, international local government finance, the recent decrease in provincial transfers, and the infrastructure debt. The next sub-section reviews recent and forecast demographic changes in Alberta. The final sub-section provides an overview of provincial and federal initiatives related to infrastructure. The third main section in the paper, Municipalities Under Stress, starts with a description of the analysis technique used herein, and is immediately followed by an overview of current municipal structure in Alberta. The third sub-section provides a broad summary of recent population changes by Census Division. The fourth, fifth and sixth sections present analysis results for negative population growth municipalities, high population growth municipalities and the Calgary to Edmonton Corridor. The final section introduces potential future growth corridors. The fourth section, Reform Options, begins with a discussion of principles to guide reform and the division of responsibility between the provincial and municipal orders of government. Following this introduction each main category of reform that have been suggested recently: structural, taxation and user fees, capital finance, and transfers are presented. The fifth main section consists of a summary and policy recommendations.

3
II. Municipal Infrastructure Funding and Deficits Introduction Municipalities have no constitutionally designated spending or revenue responsibilities, and are not formally a third order of government, but are important for the delivery of public goods and services. Municipal governments are often called creatures of the provinces because what they can do, how they can do it, their boundaries and their very existence are all determined by provincial governments.1 Historical Perspective Less than 20 per cent of Canada’s population lived in urban areas at the time of Confederation, which was when most of the statutes and structures of municipal government were established. Rural to urban migration, or agglomeration, led to a 50-50 rural-urban split by 1930, to a 67 per cent urban share by 1961 and to 79 per cent of Canada’s population living in urban centres with population of 10,000 or more in 2001.
In 2004, 65 per cent of Canada’s population lived in Census Metropolitan Areas (CMAs) and 44 per cent of Canada’s population resided in the six largest CMAs: Toronto, Montreal, Vancouver, Ottawa-Gatineau, Calgary and Edmonton2. Rural concerns, once a dominant force, have faded as the country’s population has moved out of rural areas. More recently, urban interests have been dominant and provincial governments have had to protect the interests of the rural population. Perhaps as recently as 1960, government spending on rural areas, to foster resource production, was seen to benefit urban areas. Support for this type of rural spending has eroded, as the numbers of people living in the cities rose and the share of GDP generated within the urban centres has increased.3

4
In relative terms, local governments’ share of total government spending is smaller now than at the end of World War II. In 1947, local spending4 equaled 4.4 per cent of the Gross National Expenditure (GNE) and 18.3 per cent of total government spending. By 1965, this had reached 7.8 per cent of GNE and 23.2 per cent of government spending, but by 2000 local government spending represented 8.0 per cent of GNE and 17.2 per cent of all government spending5.
Although municipal governments’ share of government spending has decreased, its spending relative to national expenditures increased until the mid 1990s. This pattern was seen at all orders of government in Canada, and indeed throughout much of the developed world. Senior orders of government increased their spending faster than local governments, as social spending became more and more expensive and inclusive. In developed countries the size of government grew until the mid 1990s when it leveled off.6 These changes do not suggest, however, that municipal government is less important than in Canada’s past. In actuality, municipal government has become increasingly important to Canadians’ daily interactions with government and what are seen as essential public services. The increased concentration of population in urban centres, combined with rapid growth in these cities, introduce or exacerbate a host of problems that must be dealt with by municipal governments. These problems include: highways and transportation, waste disposal, police and fire protection, environmental degradation, the deterioration of local infrastructure, homelessness, and a lack of affordable housing.7 Before 1930 local governments relied on their own financial sources – both current revenue and debt issue – to pay for infrastructure, much of which was built ahead of demand.8 Alberta’s towns and cities borrowed to pay for population growth and

5
concentration that did not occur until the 1940s.9 This type of over-capacity building was common in Canada. The boom that fueled this borrowing ended, leaving Alberta’s municipalities paying down debt and not investing in infrastructure. The Great Depression only worsened the situation, as many municipalities defaulted on their debts, which left the respective provinces with unsustainable liabilities. Some municipalities went bankrupt. Two important outcomes of the 1930s municipal debt crisis were: 1) closer supervision of municipal spending, coupled with conditional grants, and 2) the contention that municipalities should overtax for current needs, to build up funds to self-finance capital projects.10 In addition to increased oversight and control of municipal activities by provincial governments, an important change in the incidence of benefits and costs has occurred since the turn of the last century. From Confederation through World War I railways were the dominant transportation mode in Canada. Federal and provincial governments promoted and paid or underwrote the costs of growth, while cities benefited from increased property values and rising incomes. The situation prevalent during the rail era has been reversed in the automobile era. Population growth and economic prosperity are less of a gain and more of a burden for local governments, while the provincial and federal governments capture more of the rewards.11 The automobile era brought a change in infrastructure needs, a shift in spending responsibility towards municipal governments and limitations on the usefulness of the property tax.12 Municipalities pay much of the costs of roads, which consume a significant part of their budget; responsibility for local roads is a major cost associated with population and economic growth for cities.13 These infrastructure problems are not restricted to cities however. The Alberta Association of Municipal Districts and Counties notes that rural municipalities are responsible for 85 per cent of all municipal roads and 95 per cent of municipal bridges.14 Municipal Finance Overview Municipalities face a restrictive financing environment, where provincial governments choose the tools available. A general reluctance on the part of the provinces to allow municipalities a wide range of revenue sources has led to heavy dependence on the property tax – a tax which municipalities often have to share with school boards and the province. The following is a brief overview of spending and revenue in Canada and Alberta with a focus on the property tax. Operating Expenditures15 The largest municipal spending categories in Alberta are for transportation (30.6 per cent), recreation and culture (13.9 per cent), protection (13.9 per cent), environment (12.5 per cent), administration (11.1 per cent) and debt charges (7.6 per cent). Generally speaking, these are the most important categories across the country. Taken together, transportation, protection, and environmental services account for over 50 per cent of

6
municipal expenditures in every province except Ontario, which has a relatively large share of social spending.16 Social services are almost entirely a provincial responsibility in every province, save Ontario, where social services represented one-quarter of all municipal spending in 2000. When Ontario took over school spending, it transferred responsibility for an expanded set of services to municipalities, in an attempt to make the entire change revenue neutral.17 Capital Expenditures18 Alberta municipalities spent $419 per person on capital projects in 2000. Year-to-year and interprovincial comparisons are not offered here due to the limited value of such comparisons because of accounting differences, different spending responsibility of developers, and the fact that capital expenditures are not smooth over time.19 Nonetheless, the data do reveal some interesting points. In 2000, transportation accounted for 41.5 per cent and environment for a further 19.2 per cent of capital spending by Alberta municipalities. In 1988, the transportation share was essentially the same, but environment spending accounted for 27.0 per cent. Continued urbanization and the increasing prominence of environmental issues explain why these two categories accounted for between 50 and 80 per cent of all capital expenditures in 2000,20 depending on the province. Operating Revenues (Excluding School Board Revenue) Own-source revenues were 84.3 per cent of the total for Alberta municipalities in 2000, up from 78.0 per cent in 1988. Over the 1988 through 2000 period, unconditional grants fell from 6.8 to 1.3 per cent of the total, federal conditional grants increased slightly from 0.5 to 0.7 per cent and provincial conditional grants fell from 14.7 to 13.7 per cent. Grants in total for Canadian municipalities decreased over this period, with the largest drops in the unconditional category for most provinces. For Canada as a whole, the property tax21 accounted for 53.3 per cent of municipal government revenues in 2000.22 At 42.7 per cent in 2000, Alberta had the lowest ratio of property tax to total revenue, but this tax was still the single most important source of municipal revenue in the province. Property taxation accounted for 36.3 per cent of Alberta municipal revenue in 1988, compared to the provincial average of 48.6 per cent. The ratio in other provinces ranged from a low of 47.1 per cent in Newfoundland and Labrador to a high of 73.0 per cent in Nova Scotia. User fees,23 the second most important source of municipal revenue in 2000 for Canada as a whole, and for Alberta, accounted for 21.3 per cent and 28.3 per cent respectively of municipal revenues. These fees were the second most important source of 2000 revenue in seven other provinces, with user fee to total revenue ratios ranging from a low of 14.6 per cent in Newfoundland and Labrador to a high of 28.9 per cent in British Columbia. The number two source in Ontario and Newfoundland and Labrador was provincial transfers with user fees a close third.

7
Municipalities in Alberta had twice the national average of investment income24 in 1988 and 2000. The only other provinces with above average investment income were Manitoba, Saskatchewan, and British Columbia.
Although the property tax, used to fund a bundle of municipal services that provide collective benefits to the local area, is appropriate as a central feature of municipal revenue generation, it has some weaknesses, which make it insufficient as the only major tax allowed to municipalities.25 In particular, property tax revenues are slow to respond to economic growth, so it is necessary to raise the rate in order to maintain revenues in real terms (adjusting for inflation) or to increase revenues. Property taxes are more difficult to increase because they are generally paid in a lump sum once a year, which makes it much more visible to the taxpayer. Municipal revenues, in general, and property tax revenue, in particular, cannot easily or rapidly adjust to local demands arising from economic growth. The taxes available to senior orders of government however, have bases that respond to the full range of economic activity, so that GDP growth corresponds more closely to revenue growth. An analysis focused on western cities,26 showed that real per capita revenues for all senior orders of government27 increased between 1990-2000, while revenues fell in Vancouver, Saskatoon, Calgary and Regina. Revenues increased in Edmonton due to unique sources (EPCOR and the EDTel Endowment Fund) and in Winnipeg because it was spared operating grant cuts. In 1971/72, municipal property taxes were equal to 3.7 per cent of GDP in Alberta, while provincial income taxes were 3.3 per cent and provincial consumption taxes only 1.3 per cent. By 2001/02, provincial income and consumption taxes relative to GDP in Alberta increased to 4.3 and 1.8 per cent respectively, but municipal property taxes fell to 1.6 per cent.28
8
Property taxes also have the potential to discourage investment in property, as improvements lead to higher assessed values and a higher tax bill.29 Another weakness of the property tax, is that although there is generally a strong connection between property values and the services funded by the tax, this connection is weak for commuters and visitors who use municipal services, but do not pay property taxes in the municipality.30 In a reverse of the situation that prevailed prior to the automobile era, the main benefits of economic growth accrue to senior orders of government through income taxes or resource revenues, while local governments get responsibility for providing the infrastructure that facilitates economic growth. The main municipal revenue sources since the end of the second World War have been property taxes, user fees and provincial and federal transfers.31 Transfers from senior orders of government went from 17.2 per cent of Canadian municipal revenues in 1947 to 22.9 per cent in 1955, 38.7 per cent in 1965 and reached 55.2 per cent in 1980. Transfers fell to 45.7 per cent by 1990 and then plummeted to 25.4 per cent in 1994 and 17.9 per cent in 2000. Between 1947 and 2000 senior government support of municipalities, as measured by transfers, came full circle to rest below 20 per cent of revenue after having provided at least 45 per cent of revenues from 1970 through 1990.32 Local Government: International Comparing the Canadian local government sector with a representative sample of five US states reveals that relative to Canada: per capita property taxes tend to be lower in the US, property taxes are less important as a revenue source, US municipalities make more use of other taxes (including sales and income), grant funding is a more important revenue source. In the US, federal government grants represent a larger share of total grants.33 Local governments in 16 states use income taxes and a sales tax is used in 31 states and the District of Columbia.34 In general, US cities have access to an extremely wide array of tax bases.35 With local taxes at 9 per cent of all taxes (federal, provincial, municipal, schools and social security), Canada was in the middle among the seven federal states in the Organization for Economic Cooperation and Development (OECD) and equal to the average of these countries. The other countries used for this comparison and their shares are: Australia (3.5 per cent), Belgium (4.8 per cent), Germany (7.9 per cent), Austria (10.2 per cent), the United States (12.0 per cent) and Switzerland (14.8 per cent).36 Property taxes are the primary source of local government revenue in Canada, but not in many other OECD countries. Property taxes accounted for less than 10 per cent of local tax revenues in 9 of the 27 OECD countries reviewed and more than 90 per cent in five countries (including Canada). Income taxes, both corporate and personal, were the most important source in 13 countries. Only eight countries do not allow local governments access to the income tax. Local sales taxes generate between 14 and 76 per cent of local tax revenue in 11 countries, but for less than 2 per cent of local tax revenues in 10

9
countries (including Canada). Municipal governments in 7 OECD countries have access to a wide variety of taxes.37 Transfers to Local Governments in the 1990s A common theme in discussions of recent government fiscal affairs in Canada is that local governments bore a disproportionate share of the spending reduction witnessed in the mid to late 1990s. In some sense, municipal governments paid for the relative success of provincial controls on their fiscal behavior, because local governments were seen to have more room to tax and borrow and were thus seen to be able to deal with a relatively large share of provincial financial problems.38 For a variety of reasons, federal and provincial governments embarked upon efforts to eliminate deficits and reduce debt in the 1990s. These efforts brought about reductions in federal transfers to provinces, which in turn, reduced their local government transfers. One estimate claims that cuts to provinces contributed between one-third to one-half of federal deficit elimination.39 Not only were provincial transfers to local government cut significantly, these cuts were often large and sudden and were focused on unconditional grants leading to a reduction in flexibility for local governments.40 Own-source revenues for the entire local government sector in Canada went from 77.1 per cent of the total in 1998 to 82.1 per cent in 2000 and from 78.0 to 84.3 per cent in Alberta.41 Real per capita local transfers in Alberta were cut by over forty per cent in 1993, were cut again in 1998, but increased in 1999 and 2000 as provincial government transfers increased. Among the provinces, Alberta shows the strongest correlation between cuts in federal transfers to provinces and cuts in provincial transfers to local government.42 Local governments in Alberta faced high levels of stress between 1993 and 1998, based on population growth and the size and frequency of transfer cuts. One response was that local government spending on infrastructure fell by fourteen per cent over this period. This finding supports the perception that fiscally stressed governments may delay infrastructure investments.43 Infrastructure Deficit and Debt There has been much discussion of Canada’s current infrastructure deficit and as well as an infrastructure “debt” resulting from many years of under-investment. The debate around this topic is focused on which order of government is going to pay for it and, to a lesser extent, which municipalities will benefit from increased spending by senior orders of government, rather than the existence of it or its relative size, which is difficult to determine. There are many estimates of Canada’s infrastructure debt. These estimates usually focus on either the entire government sector, just the combined local government sector or one type of service area such as highways. One estimate of Canada’s all-government infrastructure debt is $125 billion, rising to between $200 and $300 billion over the subsequent 20-25 years.44 Another recent estimate of only Canada’s local government

10
infrastructure debt put it at $57 billion in 2002, rising to $110 billion by 202745 in the absence of remedial action. Using population share to distribute this debt and assuming it remains a reasonable estimate in 2005, Alberta faces a $5.7 billion debt currently and the prospect of an $11.0 debt in 2027 if corrective action is not taken.46 Estimates from Alberta’s main centres seem to support this rough estimate. The City of Edmonton expected a $1.55 billion infrastructure funding shortfall over a five year period (2003-2008) and the City of Calgary estimated a $1.12 billion infrastructure funding shortfall over 2003-2008.47 The costs of failing to act on infrastructure issues are already being felt and can be expected to worsen as projects continue to be put off. The direct costs include increasing operating costs and a higher proportion of structures requiring replacement rather than maintenance or remediation, environmental degradation and public safety threats. DeSitter’s “Law of Fives” notes that one dollar spent on maintenance of infrastructure, when it is in good condition, delays five dollars of spending for rehabilitation, which then delays twenty-five dollars of spending to replace the asset.48 Beyond these direct and obvious costs, the historical and ongoing under-investment in crucial supportive infrastructure has significant effects for our economy and well-being. A recent TD Economics report49 explains:
“Although the negative impacts of a deficient infrastructure are only starting to mount – and become visible to Canadians on a day-to-day basis – we believe that an ongoing neglect of the nation’s stock of public capital represents one of the greatest risks to the country’s overall quality of life. Notably, with the state of a region’s infrastructure weighing more heavily on location decisions of highly-mobile businesses and individuals, a deteriorating capital stock will increasingly cut into gains in productivity and living standards.”
Although Alberta’s productivity level is consistently the best in Canada and it has the highest living standard as measured by real personal disposable income per capita, there is much room for improvement. While Alberta’s productivity level within Canada is high, annual growth has been weak over the last decade. Also, a high productivity level and standard of living in Canada does not look nearly as strong when one looks south. Canada’s productivity is roughly 85 per cent of that in the US and the provinces occupy the bottom ranks in state-provincial comparisons of real disposable income per capita. The exact size and scope of the municipal infrastructure problem are open for discussion, but there does seem to be a consensus that it exists, is substantial and is a serious threat to quality of life and economic prosperity in Alberta and in Canada as a whole. Recent federal interest and the commitment in the budget is a welcome acknowledgement of the problem. Unfortunately, the federal government will not be the solution to this problem, as federal interest in this issue may not extend beyond the current commitment and at $600 million this fiscal year and approximately $2 billion by 2009/10 the gas tax sharing will not be adequate on its own.

11
Demographic Outlook and Emerging Risks The Vision 2020 project is designed around a long-term focus on how demographic changes may impact Alberta’s economic, social and policy landscape and aims to track how government responds to the challenges that these changes present. Phase I of this research project introduced the Vision 2020 concept and underlying demographic model, as well as the first set of results from the model.50 The first report was focused on how demographics may affect Alberta’s provincial finances over the next twenty years. A brief summary of the demographic information from Phase I is included here to add some perspective on the magnitude of recent and expected population growth and where the population is expected to concentrate. Alberta’s population grew at an annual average rate of 2.0 per cent, from 1.7 to 3.2 million, between 1971 and 2003. Canada’s population grew by an annual average rate of 1.1 per cent over this time period. Under Statistics Canada’s high population growth pro-jection, Alberta’s population growth rate slows to an average of 1.1 per cent and population reaches 4.1 million by 2026. The Social and Economic Forces Driving Change Rural to urban migration, commonly referred to as agglomeration, can be seen in Alberta and throughout the world. People are drawn to urban areas for a variety of reasons; among them are: employment opportunities, to get better access to services, to reduce commute time, and for access to a broader selection of cultural and entertainment activities. Some of the important factors that influence where people choose to locate in Alberta are related to the natural resource base of the economy and ongoing rationalization in agriculture. Strong natural resource performance focused on energy products (oil, gas, oil sands and heavy oil) as well as forestry has helped provide strong GDP and income growth in Alberta. This strong performance has fueled growth in the Regional Municipality of Wood Buffalo, as well as in the Calgary to Edmonton Corridor. The corridor benefits because firms and much of the labour supply for the oil patch are located there. The strong natural resource performance shows no signs of dissipating. Increases in farm size are characterized by a relative shift away from labour towards capital, which encourages people to leave rural areas to find employment. This exodus affects the economy and provision of government services in rural areas. Smaller populations are generally more expensive for governments to serve and businesses are more likely to fail when there are fewer consumers in the area. These pressures encourage the growth of central (usually urban) centres, at the expense of smaller rural centres. Agglomeration in Alberta is highlighted by the performance of the Calgary to Edmonton corridor. This corridor is generally defined51 as extending roughly 260 kilometers along Highway 2 encompassing the Edmonton and Calgary Census Metropolitan Areas (CMAs) as well as Spruce Grove, Leduc, Wetaskiwin, and Red Deer. With

12
approximately 1.9 of the region’s 2.2 million people, economic activity is concentrated in the Calgary and Edmonton CMAs although the rest of the region benefits from their proximity to the main centres. The corridor had one of the strongest job creation records in North America over the 1992 – 2001 period and population growth (12.3 per cent between 1996 and 2001) exceeding Alberta (5.3 per cent), other Canadian urban agglomerations (5.5 per cent) and US metropolitan areas (5.3 per cent). The corridor has benefited from inter-provincial migration from BC, the rest of the Prairies and the Atlantic provinces. The majority of these new migrants are aged 25 to 44 years, which has helped keep the average age of the corridor’s population at 35.2 years. This is younger than the Canadian average by 2.4 years and is close to that found in the US. As part of Phase I research, Statistics Canada generated population projections for the nineteen Census Divisions in Alberta. Nine are expected to see an increase in population share through 2026, although the largest increase is expected in the Calgary CD. Calgary’s share of population is expected to increase by 2.4 percentage points from 34.1 per cent in 2001 to 36.5 per cent in 2026. Edmonton’s share is expected to decrease by 1.7 percentage points from 32.6 per cent in 2001 to 30.8 per cent in 2026 although its population is expected to increase in absolute terms. Taken together, the increases in the Calgary and Edmonton Census Divisions account for 70.9 per cent of the increase expected in Alberta. Other significant increases in the percentage of population are expected in Fort McMurray, Slave Lake, Red Deer and Rocky Mountain House, while significant decreases are expected in Hanna, Edson and Grande Cache.
Census Division Census Division Name 1996 2001 2006 2011 2016 2021 2026
2001 - 2026
Change
2001 - 2026
Percent Change
1 Medicine Hat 2.3 2.3 2.3 2.3 2.3 2.3 2.3 0.0 1.42 Lethbridge 4.6 4.6 4.6 4.6 4.6 4.6 4.6 0.1 1.43 Fort MacLeod 1.4 1.3 1.3 1.2 1.2 1.2 1.2 (0.1) (8.3)4 Hanna 0.4 0.4 0.3 0.3 0.3 0.3 0.3 (0.1) (32.2)5 Drumheller 1.6 1.6 1.6 1.6 1.5 1.5 1.5 (0.1) (5.0)6 Calgary 32.6 34.1 34.9 35.5 35.9 36.2 36.5 2.4 7.17 Stettler 1.5 1.4 1.3 1.2 1.2 1.2 1.2 (0.2) (16.3)8 Red Deer 5.1 5.2 5.3 5.4 5.4 5.5 5.5 0.4 7.09 Rocky Mountain House 0.7 0.7 0.7 0.7 0.7 0.7 0.7 0.0 5.710 Camrose-Lloydminster 2.9 2.8 2.7 2.7 2.7 2.7 2.7 (0.1) (4.0)11 Edmonton 33.2 32.6 32.2 31.8 31.5 31.2 30.8 (1.7) (5.3)12 St. Paul 2.2 2.1 2.0 1.9 1.9 1.8 1.8 (0.3) (15.0)13 Athabasca 2.3 2.2 2.1 2.0 2.0 2.0 1.9 (0.2) (10.8)14 Edson 1.0 0.9 0.8 0.8 0.7 0.7 0.6 (0.3) (32.0)15 Banff 1.1 1.1 1.0 1.0 0.9 0.9 0.9 (0.2) (20.1)16 Fort McMurray 1.3 1.4 1.6 1.7 1.8 1.8 1.9 0.5 34.117 Slave Lake 2.1 2.0 2.0 2.0 2.1 2.1 2.2 0.1 7.118 Grande Cache 0.6 0.5 0.5 0.4 0.4 0.4 0.4 (0.1) (26.4)19 Grande Prairie 2.9 2.9 2.9 2.9 2.9 3.0 3.0 0.0 1.4
Alberta Census Division Population Shares, percent
Sources: Abacus Economics; Statistics Canada Population growth in Alberta’s Rural Metro-Adjacent (RMA)52 areas between 1996 and 2001 was 15.5 per cent, well above the growth of the urban cores at 11.6 per cent. An RMA is defined as those regions not classified as part of the urban core, but that are directly adjacent to those urban cores and/or within a reasonably short commuting

13
distance. While rural areas experience economic difficulties and minimal population growth, RMA regions are flourishing and are becoming younger, more family-orientated places, with diverse incomes and high levels of non-farm employment.53 The available evidence suggests that Alberta’s population will continue to grow, but that this growth will not be evenly distributed throughout the province. Growth is expected to be concentrated in the Calgary to Edmonton Corridor with a continued emptying of the truly rural, as opposed to metro-adjacent, areas of the province. Emerging Risks in the Outlook The relevance of the current topic to the Vision 2020 focus rests on the fact that since local governments bore a large share of the deficit elimination burden in the 1990s they may be forced to do so again if provincial and/or federal finances face another significant stress. The most likely provincial stress appears to be the risk from a continued escalation of health care costs. Real per capita health expenditures increased by 2.2 per cent per year on average between 1980/81 and 2003/04, while real GDP per capita has only grown an average of 1.5 per cent per year between 1982 and 2003. Large annual increases in health spending have not solved the fundamental problems in the provision of health care and without reform, high health spending poses a significant risk to our fiscal future. Other risks for Alberta as identified in the Phase I report are that resource revenues may fall. Large fiscal surpluses at the provincial order may also cause provincial government spending growth to accelerate and create a new level of spending expectation by the electorate. Even though provincial grants currently represent a relatively small share of municipal revenue, there is no guarantee that they will not fall further if the province faces a serious fiscal problem.
Provincial and Federal Government Initiatives Provincial government initiatives directly or indirectly related to municipal concerns have a short-, medium-, and long-term focus and begin to address some of the problems faced by Alberta’s municipalities. The following is a brief overview of major initiatives and plans of the senior orders of government. Provincial Government MLA Steering Committee for Rural Development Established in 2002 with the goal of developing a framework for rural development that could be linked to Alberta’s economic development strategy. Water for Life Strategy The main report outlining the provincial government’s short-, medium- and long-term water strategy, Water For Life: Alberta’s Strategy For Sustainability,54 was released in

14
November 2003. This paper makes the following commitments to Albertans: their drinking water will be safe; the province’s aquatic ecosystems will be maintained and protected; and that water will be managed effectively to support sustainable economic development and lays out short- medium- and long-term outcomes, which will be used to guide and measure the strategy.55 Under the goal of a safe, secure drinking water supply, the province’s short-term (2004/05-2006/07) action plan includes the establishment of municipal grant criteria to support the development of regional water systems and one long-term (2010/11-2013/14) outcome is for Alberta’s drinking water infrastructure to meet emerging standards and be managed for long-term sustainability.56 Although details are understandably absent, these plans do provide guidance as to the standards expected of Alberta’s municipal water systems. Budget 2004 Alberta’s 2004 budget contained descriptions of how municipalities fit into the provincial government’s 20-year plan. In general terms the main budget document, the business plan,57 notes that:
“Strong municipalities are an essential part of a strong Alberta. The provincial government will continue to work toward enhancing its relationships with its local governments - ensuring that the roles and responsibilities of local governments are well defined so that these governments can continue to be responsive to the needs of their communities and remain financially strong and viable.”58
And that:
“The Alberta government, through the Minister's Provincial/Municipal Council on Roles, Responsibilities and Resources in the 21st Century, will continue to look at how the provincial and municipal governments can best work together. Building the capacity of municipalities to provide efficient and effective services will foster financially strong municipalities that are better able to keep pace with the province's economic growth.”59
These general statements are expanded upon somewhat in the Municipal Affairs business plan,60 where the plan makes the explicit link to goal 6 in the overall government business plan to have an effective, responsive and well-managed local government sector, which aligns with opportunity 4 of the 20-year plan to make Alberta the best place to live, work and visit. Municipal Affairs notes that it provides support for these goals with:
• systems, programs and partnerships that foster excellence in local governance, management and service delivery;
• processes to assist municipalities in resolving disputes; • initiatives that help coordinate the provincial government approach toward
municipalities; • a legislative framework that enables municipalities to operate successfully and meet
the local needs of Albertans; • services and systems that contribute to financially sustainable and accountable
municipalities;

15
• financial support that enhances local government financial capability; • a framework and systems that support an assessment and property tax system that is
accurate, understandable, predictable, transparent and timely; and, • an independent appeal process for municipalities and individual Albertans through
the Municipal Government Board.61 In addition, through the provision of grants in place of taxes to municipalities, Municipal Affairs makes a link to goal 8 to have a financially, stable, open and accountable government and a strong intergovernmental position in Canada, which is in turn linked to Opportunity 3 of the 20-year plan of competing in the global marketplace.62 Alberta’s Rural Development Strategy Alberta’s recently announced rural development strategy “A Place To Grow” “…is designed to make sure all parts of our province – rural and urban – are able to benefit fully from Alberta’s continuing prosperity in the years to come.”63 The initiatives introduced in this paper are built around the four pillars identified in Rural Alberta: Land of Opportunity64 and include the following communication tools intended to create a strong voice for rural Alberta:
• the creation of a Rural Alberta Citizens’ Voice of a representative group of people from rural Alberta to advise the Minister of Agriculture, Food and Rural Development;
• a Rural Development Unit to bring services directly to rural Albertans; • a Rural Alberta Gateway to provide one-stop information about government and
other services; and, • a Rural Dialogue consisting of meetings between government caucus and rural
citizens. Other priority actions identified in this paper include:
• promoting economic development in rural communities; • building community capacity; • improving access to health care; • expanding learning and skill development opportunities; • sustaining and enhancing the quality of rural Alberta’s environment; • providing opportunities for rural youth; and, • engaging and supporting seniors and encouraging the participation of Aboriginal
people. Some of the specific action commitments in support of the above include:
• ensuring that all businesses and homes in rural Alberta are linked to the SuperNet; • the development and implementation of access standards and guidelines for
essential health services; • expanded use of technology to improve access, teaching and learning in rural
communities; • the creation of a rural development institute;

16
• the implementation of the Water for Life Strategy and working with rural communities to maintain a safe and secure supply of water;
• the creation of a land use database for the province; and, • expansion of the range of assisted living options for seniors in rural communities.
While these initiatives are positive news for rural municipalities, this paper is careful to point out that the strategy is not designed to be the solution to every challenge in rural Alberta. One of the founding principles for the Rural Development Strategy is that “All Albertans should have access to a minimum level of essential services”65 – this understandably vague principle does not offer any suggestion about the location of these services, nor does it state that Albertans will have access. Although the strategy outlines actions that are “…to act as a catalyst for action… …that will sustain a rural way of life that was vital to our past and is just as vital to the future of our province,” the paper does not explicitly offer support for all current rural communities and recognizes that “…many rural communities are facing declining populations and uncertain futures.” 66 Budget 2005 Budget 2005 contained a three-year, $9.2 billion capital spending agenda, which includes $3.1 billion for municipal infrastructure, $2.0 billion for provincial highways, $1.6 billion for health facilities and equipment and $1.1 billion for education. Municipalities will receive $600 million per year ($3 billion over the five year life of the plan), which can be used for new roads, repaving, bridge repairs, sewer upgrades, water treatment facility expansions and recreational facilities, among others. Federal Government Budget 2005 In their 2005 Budget the federal government reiterated its commitment to “…provide cities and communities with long-term, reliable sources of funding to meet their needs.”67 Specific plans include sharing $5 billion of the federal gas tax over the next five years, with $600 million flowing to communities in 2005/06 and $2 billion by 2009/10, representing 5 cents per litre. By adding a “renewal” of existing infrastructure programs, the GST rebate implemented in Budget 2004, and new Green Municipal Funds to the gas tax revenue transfer, the federal government plans to “…provide Canadian communities with over $9 billion over the next five years.”68 With an agreement announced on May 14, 2005 Alberta became the second69 province to solidify a federal gas tax transfer under the New Deal for Cities and Communities. The agreement means $477 million in new funding over the next five years for “…environmentally sustainable municipal infrastructure to help ensure cleaner air, cleaner water and reduced greenhouse gas emissions.”70 Funding is to be distributed mainly by population, as the formula is based on the $3 billion Alberta Municipal Infrastructure Program.

17
Summary Municipal government has become increasingly important to Canadians’ daily interactions with government and their receipt of what are seen as essential public services. However, since municipal governments have no constitutionally designated spending responsibilities or revenue generating authority, their provincial governments have full discretion on what they can do and how they do it. In relative terms, municipal governments’ share of total government spending is smaller now than at the end of World War II. Municipal spending went from 18.3 per cent of total government spending in 1947 to 23.2 per cent in 1965, but was down to 17.2 per cent of all government spending in 2000. Canada’s municipal finance system has gone through changes over the years, but the basic structure has remained intact from the time of Confederation. When railways were the dominant transportation mode in Canada, the federal and provincial governments underwrote the costs of growth while municipalities benefited from increased property values and rising incomes. However, the automobile era brought a change in infrastructure needs, a shift in spending responsibility towards municipal governments, and limitations on the usefulness of their main revenue source – the property tax. Population growth and economic prosperity are now more of a burden for municipal governments, while the provincial and federal governments capture more of the rewards because their taxes respond better to economic growth than property tax. Own-source revenues were 84.3 per cent of the total for Alberta municipalities in 2000, up from 78.0 per cent in 1988. At 30.6 per cent, transportation was the largest spending category in Alberta municipalities’ operating budget in 2000. Transportation accounted for 41.5 per cent and environment for a further 19.2 per cent of capital spending by Alberta municipalities in 2000. The property tax, at 42.7 per cent of the total in 2000, was the single most important source of municipal operating revenue in the province. User fees, the second most important source accounted for 28.3 per cent of municipal operating revenues in Alberta in 2000. Investment income’s revenue share in Alberta, at 10.3 per cent, was twice the national average in 2000. In contrast to Canada, property taxes are not the primary source of municipal government revenue in many other OECD countries. Municipal governments in seven of twenty-seven OECD countries have access to a wide variety of taxes and municipal taxes on income and sales are common. Federal deficit reduction efforts in the 1990s brought about reductions in federal transfers to provinces, which in turn, reduced their local government transfers. Provincial transfers to local government were cut significantly, were often large and sudden, which led to a reduction in flexibility for local governments. Provincial unconditional grants in Alberta were 1.3 per cent of total revenue in 2000, down from 6.8 per cent in 1988. Similarly, conditional grants were 13.7 per cent in 2000, versus 14.7 per cent in 1988.

18
Canada has an infrastructure deficit as a result of current under-investment and an infrastructure “debt” from many years of under-investment. The exact size and scope of the municipal infrastructure problem are open for discussion but there does seem to be a consensus that it exists, is substantial and is a serious threat to quality of life and economic prosperity in Alberta and Canada as a whole. The available evidence suggests that Alberta’s population will continue to grow but that this growth will not be evenly distributed throughout the province. Growth is expected to be concentrated in the Calgary to Edmonton Corridor, with a continued emptying of the truly rural, as opposed to metro-adjacent, areas of the province. Population growth, aging, and location patterns have implications for the future cost of government services. Even though provincial grants currently represent a relatively small share of municipal revenue there is no guarantee that they will not fall further if the province faces a serious fiscal problem, possibly related to the consistent increases in real per capita health care costs. Provincial government initiatives directly or indirectly related to municipalities reflect short-, medium and long-term issues and are meant to address the problems faced by Alberta’s municipalities. Alberta’s 2005 Budget contained a three-year, $9.2 billion capital spending agenda, which includes $3.1 billion for municipal infrastructure, $2.0 billion for provincial highways, $1.6 billion for health facilities and equipment, and $1.1 billion for education. A recent federal-provincial agreement will provide $477 million in new federal infrastructure funding for Alberta over the next five years. 1 Bird and Tassonyi (2002). 2 Statistics Canada, Canada’s e Book. 3 Emery (2003), page 12. 4 Here, local refers to municipal plus school board spending. 5 Kitchen (2002), page 16. 6 Tanzi and Schuknecht (2000). 7 Kitchen (2002), page 3. 8 Emery (2003), page 7. 9 Boothe and Edwards (2003). 10 Emery (2003), pages 7 and 8. 11 Emery (2003), page13; Vander Ploeg (2001), page 24. 12 Emery (2003), pages 11 and 12. 13 Emery (2003), pages 6 and 12. 14 Gibbons et al (2004), page 6. 15 Operating expenditures are those necessary for day-to-day operations

19
16 Kitchen (2002), page 19. 17 See Kitchen (2002), pages 30-32 and Graham and Phillips (1998) for more information. 18 Capital expenditures are those for capital assets that have a life expectancy beyond the current year. Examples include buildings, infrastructure, large equipment and vehicles. 19 Kitchen (2002), page 32. 20 Kitchen (2002), page 35. 21 Taxes on real property; developers contributions and lot levies; special assessments; grants in lieu of taxes; and, business property taxes. 22 Excluding school board revenues. 23 Fees for water and sewage; rentals; concessions; and, franchises. 24 Profits from own enterprises, interest and penalties from taxes. 25 Kitchen (2002), pages 59 and 98. 26 Vander Ploeg (2001), page 24. 27 The federal government and provincial governments in BC, Alberta, Saskatchewan and Manitoba. 28 Kitchen (2003), pages 26 and 27 and Table 4. 29 Slack (2004), page 4. 30 Slack (2004), page 4. 31 Kitchen (2003) page 15. 32 Kitchen (2003), table 2.2. 33 Kitchen (2002), pages 35 and 36. 34 Kitchen (2002), page 39. 35 Vander Ploeg (2002b). 36 Kitchen (2002), pages 37 and 39. 37 Kitchen (2002), page 39. 38 Emery (2003), page 9. 39 Kneebone and Chung (2003). 40 Kitchen (2003), pages 24 and 25; Kneebone and McKenzie (2003), page 52. 41 Kitchen (2002), tables 2.7 and 2.8. 42 Kneebone and McKenzie (2003), page 55. 43 Kneebone and McKenzie (2003), pages 56 and 57. 44 Mirza and Haider (2003), pages 1, 6, 7. 45 Canadian Society for Civil Engineering (2002), page 1. 46 Gibbons et al (2004), page 4. 47 Vander Ploeg (2003) pages 15 and 17. 48 Gibbons et al (2004), page 9. 49 TD Economics (2004), page 1. 50 Emes (2004). 51 TD Economics (2003). 52 An RMA is defined as those regions not classified as part of the urban core (therefore outside the core city part of a census metropolitan agglomeration (CMA)), but that are directly adjacent to those urban cores and/or within a reasonably short commuting distance. 53 Azmier and Dobson (2003). 54 Government of Alberta (2003a). 55 Government of Alberta (2003a), page 7. 56 Government of Alberta (2003a), page 25. 57 Government of Alberta (2004a). 58 Government of Alberta (2004a), page 24. 59 Government of Alberta (2004a), page 45. 60 Government of Alberta (2004b). 61 Government of Alberta (2004b), page 350. 62 Government of Alberta (2004b), page 350. 63 Government of Alberta (2005a), page ii. 64 Government of Alberta (2005a). 65 Government of Alberta (2005a), page 5.

20
66 Government of Alberta (2005a), page 1. 67 Government of Canada (2005), Chapter 5. 68 Government of Canada (2005), Chapter 5. 69 The BC government and the Union of British Columbia Municipalities signed a deal with the federal government on April 15th, 2005. 70 Governments of Alberta and Canada (2005).

21
III. Municipalities Under Stress Identifying stresses and how they impact the long-term viability of a municipality can focus a government’s attention and suggest possible courses of action. The analysis presented in this paper focuses on how recent changes in a municipality’s population and fiscal situation indicate potential threats or stresses to municipal financial viability and community viability related to local government’s service role.71 Recent Population and Fiscal Changes in Alberta Municipalities For the purposes of this analysis, Alberta’s municipalities are divided into five groups based on their population growth performance over the period 1995 through 2003 relative to Alberta’s population growth of 16 per cent over this period. For reference, Canada’s population grew by 8.8 per cent over this time period. The five groups are those with negative, between 0 and 8 per cent, over 8 to 16 per cent, over 16 to 32 per cent and over 32 per cent population growth. Overviews based on Alberta’s census divisions and on the Calgary to Edmonton Corridor (CEC) are also included. Although they are included in the database and analysis, villages and summer villages are left out of the discussion to keep it manageable. The purpose behind the review of population changes is to allow the identification of two groups of municipalities facing stresses due to population change. The first includes those that are likely to be faced with particularly acute infrastructure and service provision difficulties, currently and moving forward, because of population declines. The second are those that are likely to be faced with the same problems because of the rapid growth of their populations. Municipalities with growth between the provincial average of 16 per cent and double the average of 32 per cent are described as being under moderate population stress, while those with growth above 32 per cent are described as being under high population stress. In addition to population changes, fiscal changes are reviewed for the negative and strong population growth sets, to determine if these municipalities also face fiscal stress. The measure used to indicate fiscal stress is a simple comparison of the growth in operating revenue versus operating spending, over the period 1995 through 2003. Data on capital revenues and expenditures are in the analysis dataset, but due to the fact that these data display large variations from year to year, they are not included in the analysis. Alberta Municipal Structure There are three main groups of municipalities in Alberta: urban, rural and specialized. The following descriptions, although abbreviated, abide by those found on the Alberta Municipal Affairs website. A more detailed discussion is included in the appendix.
Urban municipal governments consist of cities, towns, villages and summer villages. There are 15 municipalities with city status, which requires a population of over 10,000 people and 110 towns, which requires a population of 1,000. There are 102 villages in

22
Alberta, which requires a population of over 300 and a request from 30 per cent of electors. The 51 summer villages in Alberta have essentially the same provisions as villages, but they can no longer be created. Rural municipal governments consist of municipal districts and special areas and are not exclusively farm or resource based areas; some of these municipalities contain substantial residential populations. There are 64 municipal districts in Alberta. Special area refers to a rural area in southeast Alberta, which covers most of the area of Census Division 4 (Hanna). Technically, there are three Special Areas in southeast Alberta, but for simplicity and in accordance with the common usage these will be referred to as one unit. The areas were established under the Special Areas Act in 1938 due to extreme hardship of the drought years of the 1930s; the Act has more or less remained intact, although there were some amendments in 1966 and 1985. There are a number of agreements between the Special Areas and the urban municipalities within it to cover fire protection, ambulance, libraries, recreation, regional waste collection, some limited family and community services, and the development and operation of medical centers. Alberta also features hamlets, improvement districts, Métis settlements and reserves. Among these, improvement districts were the only ones specifically included in this analysis. Further information on Alberta’s municipalities is included in Appendix A. Specialized municipalities are unique municipal structures that can be formed without resorting to special Acts of the Legislature. Often, specialized municipalities allow urban and rural communities to coexist in a single municipal government. The Regional Municipality of Wood Buffalo and Strathcona County are two examples and are the only ones with sizeable populations. Population Changes By Census Division Alberta is divided into 19 Census Divisions (CDs) by Statistics Canada. Five census divisions saw population growth above the provincial average of 16.0 per cent and well above the national average of 8.0 per cent between 1995 and 2003 (the green areas of the map). These CDs and their period growth are: Wood Buffalo (CD 16, 53.2 per cent), Calgary (CD 6, 25.8 per cent), Red Deer (CD 8, 21.8 per cent), Drumheller (CD 5, 18.9 per cent), and Grande Prairie (CD 19, 17.2 per cent). Only CD 4, Hanna saw a population decline (5.7 per cent) between 1995 and 2003 (blue). Populations increased by between 0.4 per cent (CD 18, Grande Cache) and 12.4 per cent (CD 2, Lethbridge and CD 9, Rocky Mountain House).

23
Census Division
Population Share, 2003,
Percent
Population, 1995
Population, 2003
Population Change,
1995 - 2003
Population Change,
1995 - 2003, Percent
1 Medicine Hat 2.2 60,597 67,402 6,805 11.22 Lethbridge 4.6 123,870 139,268 15,398 12.43 Fort MacLeod 1.1 31,125 32,224 1,099 3.54 Hanna 0.4 12,044 11,356 (688) (5.7)5 Drumheller 1.5 39,106 46,497 7,391 18.96 Calgary 35.3 849,308 1,068,704 219,396 25.87 Stettler 1.3 40,306 40,668 362 0.98 Red Deer 5.1 127,832 155,705 27,873 21.89 Rocky Mountain House 0.6 16,269 18,279 2,010 12.410 Camrose-Lloydminster 2.8 79,570 84,219 4,649 5.811 Edmonton 32.4 894,832 981,359 86,527 9.712 St. Paul 1.7 50,552 51,428 876 1.713 Athabasca 2.1 58,624 63,181 4,557 7.814 Edson 0.9 26,079 27,101 1,022 3.915 Banff 1.1 30,599 33,708 3,109 10.216 Fort McMurray 1.9 37,508 57,468 19,960 53.217 Slave Lake 1.6 42,872 47,915 5,043 11.818 Grande Cache 0.4 13,407 13,460 53 0.419 Grande Prairie 2.9 76,162 89,274 13,112 17.2
Alberta n/a 2,610,662 3,029,216 418,554 16.0Canada n/a 29,302,000 31,660,000 2,358,000 8.0
Sources: Abacus Economics; Alberta Municipal Affairs.
Population by Census Division

24
Alberta Census Divisions
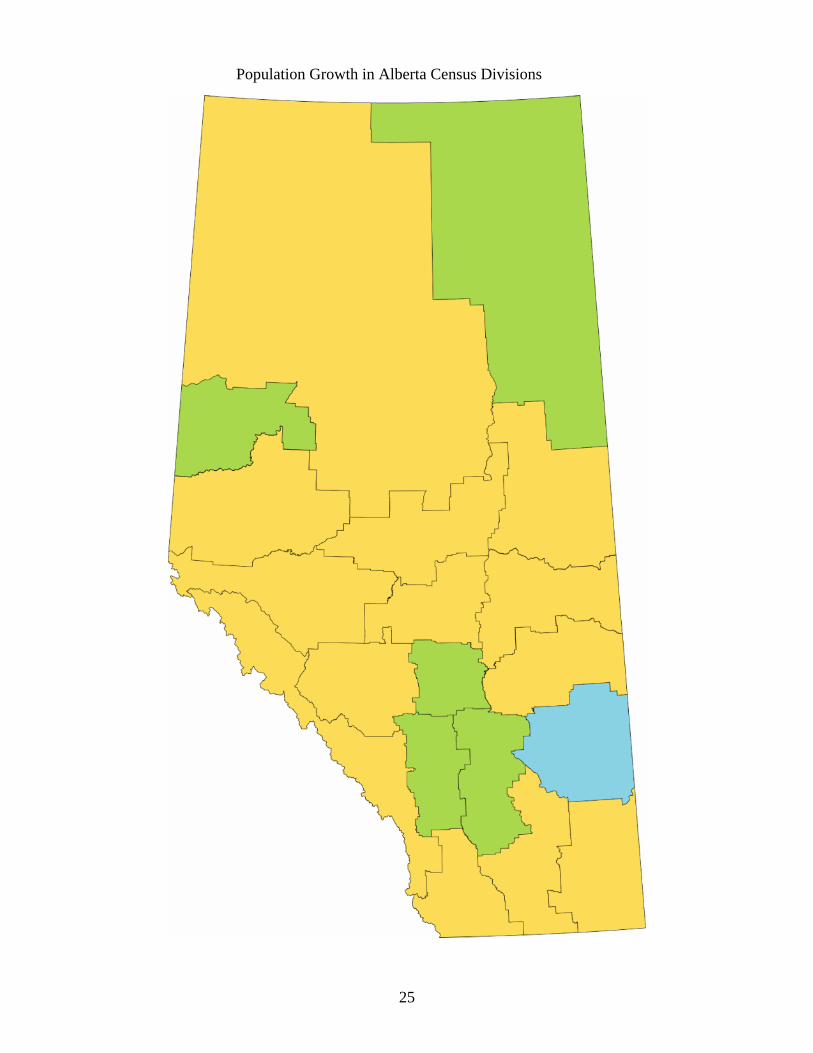
25
Population Growth in Alberta Census Divisions

26
Although interesting, these changes do not provide enough detail for the current analysis. As introduced above, the following sub-sections provide information on individual municipalities with negative and strong population growth as well as the Calgary-Edmonton Corridor (CEC). Negative Population Growth Municipalities There are 21 municipal districts (MDs) and special areas (SAs) and 22 towns that saw population declines between 1995 and 2003. For ease of discussion, the special areas are referred to as municipal districts in this section. Taken together, the MDs lost 4,738 people (5.6 per cent) from 84,540 in 1995 to 79,802 in 2003. Few people in these districts commute to a CMA or CA for work. In 15 of the MDs, fewer than 5 per cent of the municipality’s residents commute to an urban centre. In 4 of the MDs (Lamont, Vermillion River, Westlock and Saddle Hills counties), between 5 and 30 per cent of residents commute. More than 30 per cent of the residents in Camrose County commute and Bonnyville MD is considered a non-tracted Census Agglomeration. All of the MDs are classified as rural areas. In addition to losing population over the analysis period, eight of the 21 municipal districts, representing 31 per cent of the aggregate population, saw spending grow faster than revenues. These MDs with fiscal stresses indicated have negative values in the right most column of the table below. However, all but two municipal districts (St. Paul and Clear Hills) show surpluses for 2003 and these two MDs have deficits for only two of the last nine years.72
Population, Change
Operating Revenue
Operating Expenditure
MD FORTY MILE NO. 8, COUNTY OF 1 3,460 3,432 (0.8) 15.9 0.6 15.2MD CARDSTON COUNTY 3 4,490 4,325 (3.7) 45.3 3.4 41.9MD PAINTEARTH NO. 18, COUNTY OF 7 2,324 2,192 (5.7) (14.7) (11.1) (3.6)MD FLAGSTAFF COUNTY 7 4,099 3,697 (9.8) 27.6 43.3 (15.7)MD TWO HILLS NO. 21, COUNTY OF 10 2,830 2,614 (7.6) 41.0 18.8 22.2MD MINBURN NO. 27, COUNTY OF 10 3,599 3,436 (4.5) 28.6 24.2 4.4MD LAMONT COUNTY 10 4,266 4,167 (2.3) 79.4 83.3 (3.9)MD CAMROSE NO. 22, COUNTY OF 10 7,475 7,294 (2.4) 52.1 27.8 24.3MD VERMILION RIVER NO. 24, COUNTY OF 10 7,714 7,524 (2.5) 36.7 25.3 11.5MD ST. PAUL NO. 19, COUNTY OF 12 6,489 6,145 (5.3) 50.4 62.5 (12.1)MD WESTLOCK COUNTY 13 6,994 6,859 (1.9) (16.8) (17.4) 0.6MD NORTHERN SUNRISE COUNTY 17 2,445 2,324 (4.9) 78.1 114.4 (36.2)MD CLEAR HILLS NO. 21, M.D. OF 17 2,903 2,772 (4.5) 106.5 216.8 (110.4)MD NORTHERN LIGHTS NO. 22, M.D. OF 17 3,789 3,636 (4.0) 93.2 65.2 28.0MD PEACE NO. 135, M.D. OF 19 1,559 1,496 (4.0) 44.2 58.5 (14.3)MD BIRCH HILLS COUNTY 19 1,778 1,644 (7.5) 12.6 28.4 (15.8)MD FAIRVIEW NO. 136, M.D. OF 19 1,812 1,806 (0.3) 64.3 39.2 25.1MD SMOKY RIVER NO. 130, M.D. OF 19 2,613 2,379 (9.0) 3.8 (3.0) 6.8MD SADDLE HILLS COUNTY 19 2,722 2,566 (5.7) 54.4 46.6 7.7SA SPECIAL AREAS (2, 3 AND 4) 4 5,765 5,314 (7.8) (1.9) (4.0) 2.1SM JASPER, MUNICIPALITY OF 15 5,414 4,180 (22.8) 812.2 734.1 78.1
Population, 2003
Change in Revenue
less Change in
Expenditure
Census Division
Percent Change, 1995-2003
Population, 1995
Negative Population Growth, Municipal Districts and Special Areas
Sources: Abacus Economics; Alberta Municipal Affairs.

27
Taken together, the towns lost 2,867 people (5.2 per cent), from 54,762 in 1995 to 51,895 in 2003. Few people in these towns commute to a CMA or CA for work. In 16 of the towns, fewer than 5 per cent of the municipality’s residents commute to an urban centre. In Fort Macleod and Killam between 5 and 30 per cent of the residents commute. Bruderheim and Gibbons are considered part of the Edmonton CMA. Most of these towns (17) are considered urban outside of metropolitan areas. Four of the towns (Oyen, Coronation, Bruderheim and Crowsnest Pass) are considered rural areas, and Gibbons is considered to be urban fringe. In addition to losing population over the analysis period, 17 of the 21 towns, representing 75 per cent of the aggregate population, saw spending grow faster than revenues. These fiscally stressed towns have negative values in the right most column of the table below. Six towns (Cardston, Coronation, Bruderheim, Smoky Lake, Swan Hills and Fairview) had 2003 deficits. However, the 2003 deficit was the only in the most recent nine years for all but Smoky Lake, which had two and Cardston which had four.73
Population, Change
Operating Revenue
Operating Expenditure
3 3,112 2,990 (3.9) 38.9 26.9 11.93 3,480 3,475 (0.1) 16.5 25.3 (8.8)4 1,106 1,103 (0.3) 31.0 28.8 2.24 2,996 2,986 (0.3) 15.1 28.0 (12.9)7 1,053 1,004 (4.7) 18.9 15.1 3.87 1,184 1,074 (9.3) (15.1) 24.4 (39.5)10 1,109 1,052 (5.1) 35.7 54.9 (19.2)10 1,108 1,091 (1.5) (10.4) (8.1) (2.3)10 1,208 1,202 (0.5) 6.5 41.3 (34.8)11 2,762 2,730 (1.2) 34.5 37.9 (3.4)12 1,057 1,011 (4.4) 1.4 36.6 (35.2)13 1,692 1,570 (7.2) 25.1 18.4 6.715 6,679 6,262 (6.2) 124.9 81.6 43.317 2,348 1,807 (23.0) (33.3) 6.3 (39.6)17 2,932 2,820 (3.8) 43.9 61.7 (17.8)18 2,039 1,856 (9.0) 15.4 16.8 (1.4)18 3,842 3,828 (0.4) 9.5 55.3 (45.8)19 1,102 1,100 (0.2) 16.1 23.6 (7.5)19 1,183 1,109 (6.3) 27.5 50.7 (23.3)19 2,812 2,435 (13.4) 18.0 19.4 (1.3)19 3,262 3,150 (3.4) 37.9 79.8 (42.0)19 6,696 6,240 (6.8) 23.6 24.0 (0.3)
Sources: Abacus Economics; Alberta Municipal Affairs.
Negative Population Growth, Towns
Census Division
Population, 1995
Population, 2003
Percent Change, 1995-2003 Change in Revenue
less Change in
Expenditure
FORT MACLEODCARDSTONOYENHANNAKILLAMCORONATIONVIKINGTWO HILLSBRUDERHEIM
VALLEYVIEWGRANDE CACHE
GIBBONSSMOKY LAKEMAYERTHORPECROWSNEST PASS
PEACE RIVER
SPIRIT RIVERFALHERGRIMSHAWFAIRVIEW
SWAN HILLSHIGH PRAIRIE
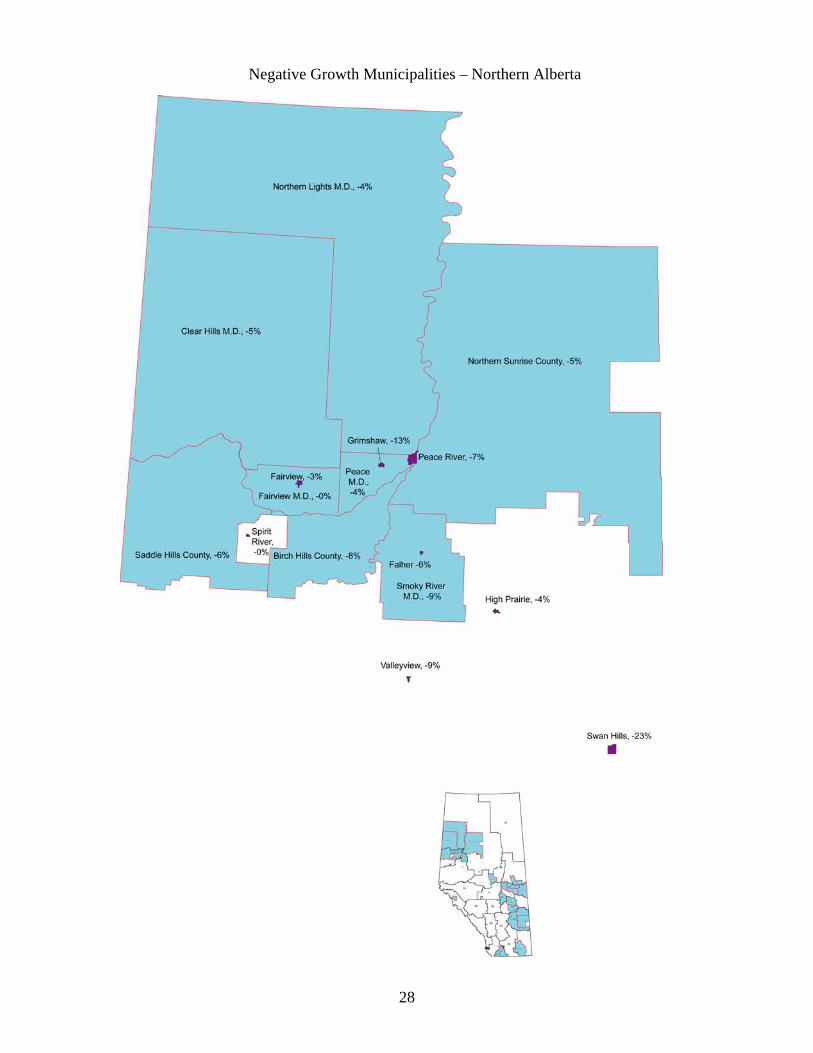
28
Negative Growth Municipalities – Northern Alberta

29
Negative Growth Municipalities – Southern Alberta

30
High Population Growth Municipalities Two cities, two municipal districts, two specialized municipalities, and 11 towns saw population increases more than twice the provincial average between 1995 and 2003. In contrast with the municipalities that lost population, the strong growth group tended to have a strong relationship with a CMA or a CA, often within the Calgary-Edmonton Corridor (CEC). Airdrie (63 per cent growth) is a secondary urban core in the Calgary CMA. The Rocky View municipal district (54 per cent) is the rural area around the Calgary CMA, and the Foothills municipal district (36 per cent growth), although not entirely contained in the Calgary CMA has more than 30 per cent of its residents commuting to a CMA or CA. Chestermere (256 per cent) and Cochrane (82 per cent) are in the urban fringe of the Calgary CMA. Strathmore (80 per cent), Okotoks (50 per cent), and High River (36 per cent) are urban outside of the metropolitan area and more than 30 per cent of Okotoks’ residents commute to a CMA or CA, while between 5 and 30 per cent of Strathmore and High River residents commute. Canmore (50 per cent) is urban outside of a metropolitan area and fewer than 5 per cent of its residents commute to a CMA or CA for work. Blackfalds (115 per cent) and Sylvan Lake (56 per cent) are urban outside of the metropolitan area and between 5 and 30 per cent of their residents commute to a CMA or CA. Stony Plain (42 per cent) is in the urban fringe of the Edmonton CMA. However, not all of the strong growth areas are close to the CEC. The Regional Municipality of Wood Buffalo is considered a non-tracted census agglomeration and grew by 53 per cent between 1995 and 2003. Grande Prairie (38 per cent growth) is the urban core of a non-tracted CA. The municipal district of Mackenzie (33 per cent) is a rural area with fewer than 5 per cent of its residents commuting to a CMA or CA for work. Two towns in this MD also have high growth (High Level, 42 per cent and Rainbow Lake, 35 per cent) and between 0 and 5 per cent of their residents commuting to a CMA or CA. In addition to rapid population growth over the analysis period, nine of the seventeen municipalities, representing 62 per cent of the aggregate population, saw spending grow faster than revenues. These fiscally stressed municipalities have negative values in the right most column of the table below. However, none of these municipalities had 2003 operating account deficits.

31
Population, Change
Operating Revenue
Operating Expenditure
City AIRDRIE 6 14,506 23,680 63 74.5 84.8 (10.4)City GRANDE PRAIRIE 19 29,242 40,226 38 57.1 71.5 (14.4)Mun. Dist. ROCKY VIEW NO. 44, M.D. OF 6 19,888 30,688 54 60.1 48.8 11.4Mun. Dist. FOOTHILLS NO. 31, M.D. OF 6 13,022 17,682 36 45.5 45.1 0.4Spec. Mun. REG MUN OF WOOD BUFFALO 16 37,222 57,099 53 88.4 90.0 (1.6)Spec. Mun. MACKENZIE NO. 23, M.D. OF 17 7,260 9,687 33 102.7 96.3 6.3Town CHESTERMERE 6 1,603 5,712 256 188.7 253.1 (64.4)Town BLACKFALDS 8 1,769 3,812 115 239.1 215.3 23.8Town COCHRANE 6 6,612 12,074 83 133.7 164.6 (31.0)Town STRATHMORE 5 5,088 8,640 70 105.2 97.5 7.8Town SYLVAN LAKE 8 4,815 7,493 56 131.9 118.6 13.3Town CANMORE 15 7,632 11,458 50 137.3 96.8 40.5Town OKOTOKS 6 7,789 11,664 50 126.3 112.2 14.0Town STONY PLAIN 11 7,405 10,544 42 41.0 61.9 (20.9)Town HIGH LEVEL 17 2,921 4,159 42 65.4 81.6 (16.2)Town HIGH RIVER 6 6,893 9,345 36 32.9 63.9 (31.1)Town RAINBOW LAKE 17 880 1,186 35 35.9 42.0 (6.1)
Change in Revenue
less Change in
Expenditure
Sources: Abacus Economics; Alberta Municipal Affairs.
Strong Population Growth
Census Division
Population, 1995
Population, 2003
Percent Change, 1995-2003

32
Strong Growth Municipalities

33
The Calgary to Edmonton Corridor The three Census Divisions around Calgary (CD 6), Red Deer (CD 8) and Edmonton (CD 11) contained 73 per cent of Alberta’s population in 2003 and accounted for 80 per cent its population growth over the period 1995 through 2003. These three CDs are often referred to as the Calgary to Edmonton Corridor (CEC). Census Division 6: Calgary The Rocky View MD is the border for the Calgary CMA and contains the urban core of Calgary, the secondary urban core of Airdrie and the urban fringe towns of Cochrane, Crossfield and Chestermere. The Foothills MD is a strongly-influenced rural area (more than 30 per cent of its residents commuting to a CMA to work). Within this MD Okotoks and Black Diamond are strongly-influenced zone urban areas (outside of the metropolitan area), High River is urban (outside of metropolitan) and is a moderately-influenced zone (between 5 and 30 per cent of its residents commuting) and Turner Valley is a strongly- influenced rural area. Mountain View County is a moderately-influenced rural area with four urban areas, two of which (Carstairs and Didsbury) are moderately-influenced zones and two of which (Sundre and Olds), which are weakly-influenced zones. With over 86 per cent of the population, the City of Calgary dominates this CD. It does not however, have the largest percentage population growth. Calgary’s population grew by 23 per cent between 1995 and 2003, while population as a whole for the CD grew by 26 per cent. Among others, Calgary’s population growth was exceeded by that in Airdrie (63 per cent), Chestermere (256 per cent), Cochrane (83 per cent), Crossfield (27 per cent) and High River (36 per cent). The City of Airdrie and these towns are singled out because, in contrast to Calgary, they saw spending growth outstrip revenue growth. Spending growth in excess of revenue growth is the norm for most (15 of 20) of the municipalities in this CD, although due to Calgary’s relative size, this only affects eight per cent of the population. The relevance is that this CD has several municipalities with greater population stress than the City of Calgary and which, unlike Calgary (at least using the definitions contained herein), also have fiscal stresses. Further, many municipalities in this CD, both urban and rural, are considered to be strongly-influenced zones, meaning that more than 30 per cent of their residents commute to work in a CMA or CA.
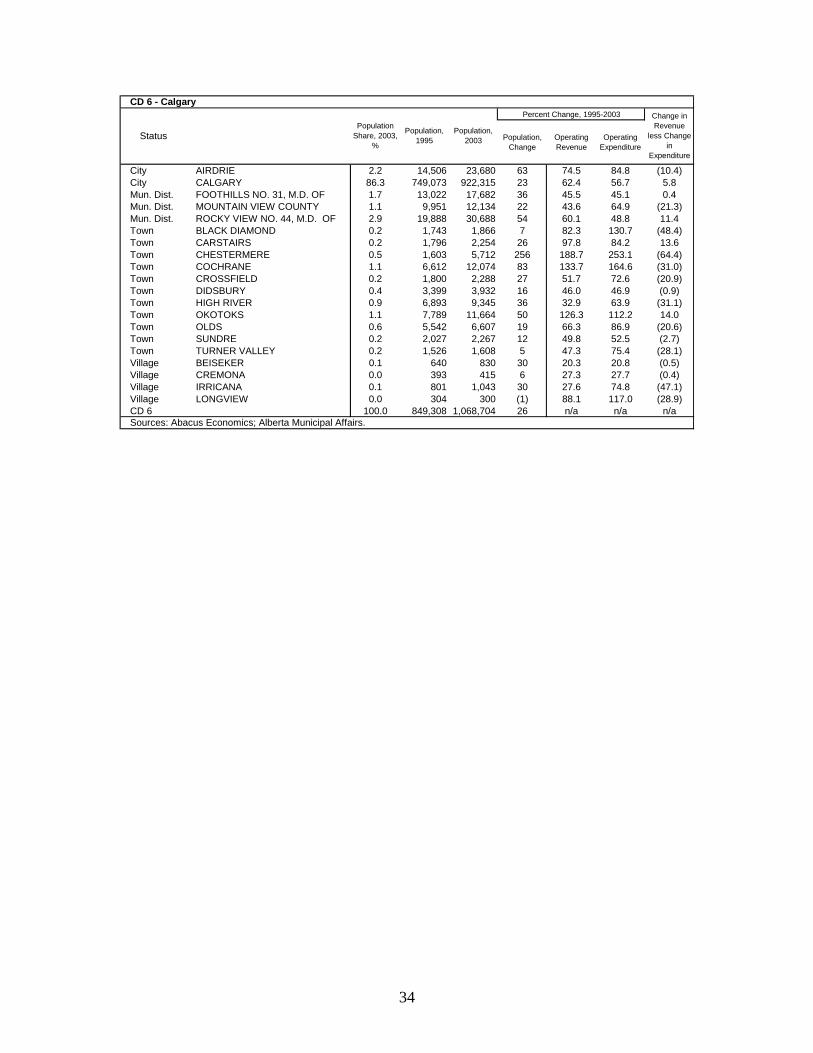
34
Population, Change
Operating Revenue
Operating Expenditure
City AIRDRIE 2.2 14,506 23,680 63 74.5 84.8 (10.4)City CALGARY 86.3 749,073 922,315 23 62.4 56.7 5.8Mun. Dist. FOOTHILLS NO. 31, M.D. OF 1.7 13,022 17,682 36 45.5 45.1 0.4Mun. Dist. MOUNTAIN VIEW COUNTY 1.1 9,951 12,134 22 43.6 64.9 (21.3)Mun. Dist. ROCKY VIEW NO. 44, M.D. OF 2.9 19,888 30,688 54 60.1 48.8 11.4Town BLACK DIAMOND 0.2 1,743 1,866 7 82.3 130.7 (48.4)Town CARSTAIRS 0.2 1,796 2,254 26 97.8 84.2 13.6Town CHESTERMERE 0.5 1,603 5,712 256 188.7 253.1 (64.4)Town COCHRANE 1.1 6,612 12,074 83 133.7 164.6 (31.0)Town CROSSFIELD 0.2 1,800 2,288 27 51.7 72.6 (20.9)Town DIDSBURY 0.4 3,399 3,932 16 46.0 46.9 (0.9)Town HIGH RIVER 0.9 6,893 9,345 36 32.9 63.9 (31.1)Town OKOTOKS 1.1 7,789 11,664 50 126.3 112.2 14.0Town OLDS 0.6 5,542 6,607 19 66.3 86.9 (20.6)Town SUNDRE 0.2 2,027 2,267 12 49.8 52.5 (2.7)Town TURNER VALLEY 0.2 1,526 1,608 5 47.3 75.4 (28.1)Village BEISEKER 0.1 640 830 30 20.3 20.8 (0.5)Village CREMONA 0.0 393 415 6 27.3 27.7 (0.4)Village IRRICANA 0.1 801 1,043 30 27.6 74.8 (47.1)Village LONGVIEW 0.0 304 300 (1) 88.1 117.0 (28.9)CD 6 100.0 849,308 1,068,704 26 n/a n/a n/a
CD 6 - CalgaryChange in Revenue
less Change in
Expenditure
Population Share, 2003,
%Status Population,
1995Population,
2003
Percent Change, 1995-2003
Sources: Abacus Economics; Alberta Municipal Affairs.

35
The Calgary to Edmonton Corridor

36
Census Division 8: Red Deer Red Deer County is rural and a strongly-influenced zone which contains the city of Red Deer (urban core area and tracted Census Agglomeration) and the towns of Sylvan Lake, Penhold (strongly-influenced urban area outside metropolitan areas), Innisfail (moderately-influenced urban area outside metropolitan area) and Bowden (moderately-influenced rural area). Lacombe County is rural and a moderately-influenced zone, which contains the towns of Blackfalds (strongly-influenced urban area outside metropolitan area), Lacombe (moderately-influenced urban area outside metropolitan area), Bentley and Eckville (moderately-influenced rural areas). Ponoka County is rural and a weakly-influenced zone, which contains the towns of Ponoka and Rimbey (moderately-influenced rural areas). The City of Red Deer, with 47 per cent of the 2003 population had 1995-2003 population growth of 21.5 per cent, slightly less than the CD average of 21.8 per cent. Among others, Red Deer’s population growth was exceeded by that in Red Deer County (24 per cent), Bowden (25 per cent), and Lacombe (31 per cent). Red Deer County and these towns are singled out here because, in contrast to the City of Red Deer, they saw spending growth outstrip revenue growth. Spending growth in excess of revenue growth is the norm for fewer than half (10 of 25) of the municipalities in this CD and these municipalities account for twenty-seven per cent of the population. Among the twenty-five municipalities in the Red Deer CD, six are under moderate stress from population growth and a further seven are under high stress, although many of these are summer villages with small starting populations. Eleven of the municipalities are under fiscal stress because spending growth has outstripped revenue growth over the analysis period. Five municipalities (Red Deer County, Bowden, Lacombe, Clive and Delburne) are facing both population stress and fiscal stress.
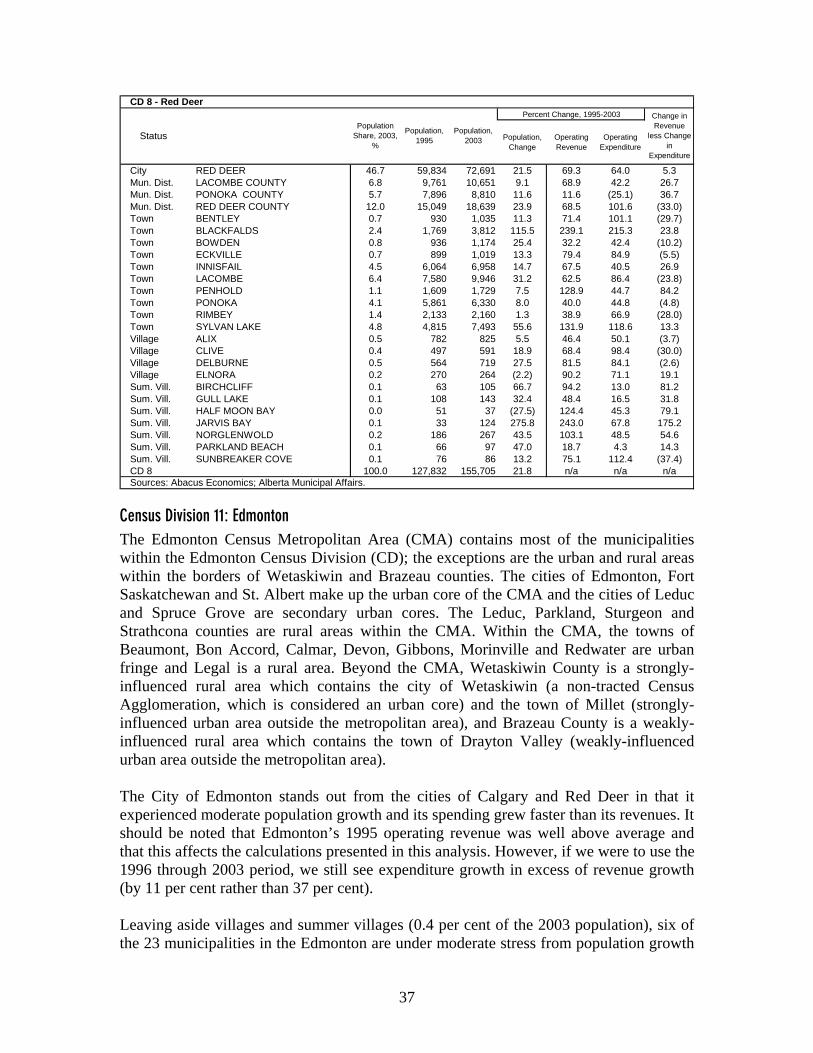
37
Population, Change
Operating Revenue
Operating Expenditure
City RED DEER 46.7 59,834 72,691 21.5 69.3 64.0 5.3Mun. Dist. LACOMBE COUNTY 6.8 9,761 10,651 9.1 68.9 42.2 26.7Mun. Dist. PONOKA COUNTY 5.7 7,896 8,810 11.6 11.6 (25.1) 36.7Mun. Dist. RED DEER COUNTY 12.0 15,049 18,639 23.9 68.5 101.6 (33.0)Town BENTLEY 0.7 930 1,035 11.3 71.4 101.1 (29.7)Town BLACKFALDS 2.4 1,769 3,812 115.5 239.1 215.3 23.8Town BOWDEN 0.8 936 1,174 25.4 32.2 42.4 (10.2)Town ECKVILLE 0.7 899 1,019 13.3 79.4 84.9 (5.5)Town INNISFAIL 4.5 6,064 6,958 14.7 67.5 40.5 26.9Town LACOMBE 6.4 7,580 9,946 31.2 62.5 86.4 (23.8)Town PENHOLD 1.1 1,609 1,729 7.5 128.9 44.7 84.2Town PONOKA 4.1 5,861 6,330 8.0 40.0 44.8 (4.8)Town RIMBEY 1.4 2,133 2,160 1.3 38.9 66.9 (28.0)Town SYLVAN LAKE 4.8 4,815 7,493 55.6 131.9 118.6 13.3Village ALIX 0.5 782 825 5.5 46.4 50.1 (3.7)Village CLIVE 0.4 497 591 18.9 68.4 98.4 (30.0)Village DELBURNE 0.5 564 719 27.5 81.5 84.1 (2.6)Village ELNORA 0.2 270 264 (2.2) 90.2 71.1 19.1Sum. Vill. BIRCHCLIFF 0.1 63 105 66.7 94.2 13.0 81.2Sum. Vill. GULL LAKE 0.1 108 143 32.4 48.4 16.5 31.8Sum. Vill. HALF MOON BAY 0.0 51 37 (27.5) 124.4 45.3 79.1Sum. Vill. JARVIS BAY 0.1 33 124 275.8 243.0 67.8 175.2Sum. Vill. NORGLENWOLD 0.2 186 267 43.5 103.1 48.5 54.6Sum. Vill. PARKLAND BEACH 0.1 66 97 47.0 18.7 4.3 14.3Sum. Vill. SUNBREAKER COVE 0.1 76 86 13.2 75.1 112.4 (37.4)CD 8 100.0 127,832 155,705 21.8 n/a n/a n/a
StatusPopulation
Share, 2003, %
Population, 1995
Population, 2003
Percent Change, 1995-2003 Change in Revenue
less Change in
Expenditure
CD 8 - Red Deer
Sources: Abacus Economics; Alberta Municipal Affairs.
Census Division 11: Edmonton The Edmonton Census Metropolitan Area (CMA) contains most of the municipalities within the Edmonton Census Division (CD); the exceptions are the urban and rural areas within the borders of Wetaskiwin and Brazeau counties. The cities of Edmonton, Fort Saskatchewan and St. Albert make up the urban core of the CMA and the cities of Leduc and Spruce Grove are secondary urban cores. The Leduc, Parkland, Sturgeon and Strathcona counties are rural areas within the CMA. Within the CMA, the towns of Beaumont, Bon Accord, Calmar, Devon, Gibbons, Morinville and Redwater are urban fringe and Legal is a rural area. Beyond the CMA, Wetaskiwin County is a strongly-influenced rural area which contains the city of Wetaskiwin (a non-tracted Census Agglomeration, which is considered an urban core) and the town of Millet (strongly-influenced urban area outside the metropolitan area), and Brazeau County is a weakly-influenced rural area which contains the town of Drayton Valley (weakly-influenced urban area outside the metropolitan area). The City of Edmonton stands out from the cities of Calgary and Red Deer in that it experienced moderate population growth and its spending grew faster than its revenues. It should be noted that Edmonton’s 1995 operating revenue was well above average and that this affects the calculations presented in this analysis. However, if we were to use the 1996 through 2003 period, we still see expenditure growth in excess of revenue growth (by 11 per cent rather than 37 per cent). Leaving aside villages and summer villages (0.4 per cent of the 2003 population), six of the 23 municipalities in the Edmonton are under moderate stress from population growth

38
and an additional one is under high stress. More than half (13 of 23) of the municipalities are under fiscal stress because spending growth has outstripped revenue growth over the analysis period. Five municipalities (Parkland, Sturgeon and Strathcona counties as well as the towns of Devon and Stony Plain) are facing both population stress and fiscal stress. Including villages and summer villages 20 of 44 municipalities in the Edmonton CD, representing 87 per cent of the population, are under fiscal stress.

39
Potential Transportation and Energy Corridors Beyond the Calgary to Edmonton Corridor, Alberta has regions that may experience strong population growth due to the energy industry and/or transportation links. Corridors in the north running east-west and north-south, as well as a southern corridor running north-south, may see strong growth due to the combination of continued urbanization and increasing economic activity. Global trade is growing at a rapid pace. Between 1990 and 2003, world GDP grew at an average annual rate of 2.2 per cent while worldwide exports grew by 6.7 per cent per year. Growth in China and India is expected to continue to drive this growth. Alberta’s exports to other countries were equal to 37.2 per cent of GDP in 2003 and total exports74 were equal to 60.8 per cent. Alberta’s main international exports – oil and gas – accounted for 61.5 per cent of total shipments abroad, on average, between 2000 and 2004. Continued growth in China and India and elsewhere are keeping demand for energy products high, which is helping to keep prices relatively high. Northern East-West Corridor Northern Alberta will likely continue to see strong energy-related growth in the Regional Municipality of Wood Buffalo. In addition, the recent announcements from Alberta, British Columbia and the federal government about substantial improvements to the Port of Prince Rupert holds the promise of strong growth in energy-related and general merchandise trade. The port at Prince Rupert offers the shortest land-sea transportation route to Asia (by two days) and is located at the North American entry point of the Northwest transportation corridor. In contrast to the east-west transportation corridor along the 49th parallel, which is at or near capacity, the Northwest corridor is underutilized.75 The northwest corridor is a modern, uncongested, well-connected network of highways, railways, airports and marine port facilities, which spans the four Western provinces along the 54th parallel. Terasen Inc. (formerly BC Gas) and Enbridge are both in discussions with China about pipeline expansion from the Alberta oil sands to the BC coast. Enbridge recently announced a memorandum of understanding with PetroChina, China’s largest oil company, for about half of the anticipated capacity of the Gateway pipeline. Gateway is intended to run nearly 1,200 km to either the Kitimat or Prince Rupert port and supply Asia and California. As global trade continues to grow, traffic on the underutilized northern corridor is likely to increase. Potential local benefits beyond the sorting and shipping of goods include construction employment for improvements, and tourism as links and service improve. Northern North-South Corridor Potential for a northern north-south corridor is based on planned pipelines from the Arctic into Alberta’s energy hub. These pipelines are intended to supply the US with a secure energy supply that can meet growing demand. Alberta accounts for almost 80 per cent of Canada’s natural gas production and roughly 94 per cent of all US imports of natural gas from Canada run through the Alberta Hub. The Alberta Hub is a point of

40
handling, storing and exchange for primary energy products and facilitates upgrades of these products to higher-value manufactured products.76 Enbridge has two major north-south pipeline proposals, both running from Prudhoe Bay, Alaska to connect with the NOVA gas transmission system. The Alaska Highway (or Southern) route runs through Alaska, the southern Yukon Territory and Whitehorse, north-eastern British Columbia and then into Alberta. The Mackenzie Valley pipeline runs from Inuvik through Fort Simpson in the Northwest Territories into Alberta and connects to Prudhoe Bay via the Over-the-Top (or Northern) pipeline.
Calgary-Lethbridge-US Corridor Population growth in CD 2 (Lethbridge) was 5th highest among the 19 CDs over the period 1995-2003. Population grew by 12.4 per cent in the Census Division, by 12.0 per cent in the City of Lethbridge, 17.6 per cent in the County of Lethbridge, and 18.7 per cent in the County of Newell. The US accounted for 88.3 per cent of Alberta’s international exports in 2003. Energy demand in the US is expected to remain strong and most of Canada’s natural gas exports flow through Alberta. Proximity to both Calgary and the US border suggest the area around Calgary to Lethbridge to the US will continue to post strong growth in Alberta.

41
Summary The problems faced by the local government sector extend well beyond those in Canada’s cities. They result from a number of stresses, which could threaten the long-term viability of some municipalities. A number of potential stresses can be identified and reviewed: stresses caused by population declines or rapid growth, as well as expenditure growth in excess of revenue growth. There are 21 municipal districts (MDs) and special areas (SAs), and 22 towns that saw population declines between 1995 and 2003. Taken together, the MDs and SAs lost close to 5,000 people between 1995 and 2003 (a decrease roughly equal to 5.6 per cent). In addition to losing population over the analysis period, eight of the 21 jurisdictions, representing 31 per cent of the aggregate population, saw spending grow faster than revenues. Taken together, the towns lost close to 3,000 people between 1995 and 2003 (roughly 5.2 per cent of aggregate population). Most of these towns (17) are considered urban outside of metropolitan areas, four are rural areas and one is urban fringe. In addition to losing population over the analysis period, 17 of the 21 towns, representing 75 per cent of the aggregate population, saw spending grow faster than revenues. Two cities, two municipal districts, two specialized municipalities and 11 towns saw population increase by more than twice the provincial average between 1995 and 2003. In addition to rapid population growth over the analysis period nine of the 17 municipalities, representing 62 per cent of the aggregate population, saw spending grow faster than revenues. Few people in the towns, municipal districts, and special areas, that lost population between 1995 and 2003, commute to a Census Metropolitan Area (CMA) or a Census Agglomeration (CA) for work. In contrast with the municipalities that lost population, the strong growth group tended to have a strong relationship with a CMA or a CA, often within the Calgary-Edmonton Corridor (CEC). Only one municipality in the CEC, the town of Gibbons, had a 1995-2003 population decrease. However, not all of the strong growth areas are close to the CEC. The Regional Municipality of Wood Buffalo grew by 53 per cent between 1995 and 2003 while Grande Prairie saw 38 per cent growth and the municipal district of Mackenzie expanded by 33 per cent. A considerable amount of recent attention has been focused on the fiscal and infrastructure problems faced by large cities in Alberta and Canada. Not surprisingly, many non-metropolitan municipalities face stresses and threats to their viability equal to or greater than those faced by large cities.

42
71 See Appendix for an expanded discussion of municipal capacity and viability. 72 This refers to the operating account only. 73 This refers to the operating account only. 74 International plus interprovincial trade. 75 Northwest Corridor Development Corporation website. 76 Alberta Energy (2004).

43
IV. Reform Options The section begins with a brief introduction to a set of guiding principles for reform, followed by a discussion of the division of responsibilities between the provincial and municipal orders of government. Reform options discussed are as follows:
• structural reforms – changes to accounting and administration systems and increased use of privatization;
• tax and fee changes – municipalities already have the ability to reform their property and user fee arrangements and senior orders of government can grant them access to additional revenue fields;
• borrowing – senior orders of government could give municipalities greater flexibility in capital finance to encourage greater use of borrowing; and,
• transfers – the federal and provincial governments could increase transfers or share revenues.
Overview and Guiding Principles Before turning to an overview of individual reforms it is important to provide a framework within which to guide any reform. The framework is based on work by Kitchen (2002, 2003, 2004). It is presented with the acknowledgement that all of the changes required must be fully consistent with the framework, may never be implemented, depending on the degree to which the relevant policymakers and constituents agree with it, and owing to the fact that determining who benefits from a government service is often difficult.77 To put it more simply and to reinforce a recurring theme of this paper, there is no single solution to the problems with municipal finance in Alberta. Nevertheless, the framework is presented because it helps to align the total set of policies proposed with what the reform is intended to accomplish, and serves as a reference for future changes. Also, such a framework makes it clear what ideas are driving the overall reform package suggested and thus facilitates discussion of the appropriateness and applicability of these ideas. The benefits-based model of intergovernmental finance is based on the principle that those who benefit from a service should pay for it. It embodies the concepts of efficiency, accountability and fairness. Economic efficiency is achieved when the per unit price of an output equals the cost of producing the last unit of the output. Accountability refers to how direct a connection exists between those who pay for and those who benefit from a government service. It is also linked to transparency or how clear government actions are to residents. Fairness refers to the degree to which beneficiaries pay for the services provided. 78 Define Who Does What The first task in deciding which municipal finance reforms to undertake is to determine which government services should be supplied by the various orders of government. This process is often referred to as disentanglement or local service realignment. A thorough

44
discussion of the roles and responsibilities of the local and provincial orders of government is presented in Kitchen (2002).79 Generally, a service should be provided locally, unless is generates spillovers or involves the redistribution of income. Spillovers occur when services in one municipality affect residents in other municipalities and can be positive or negative. The presence of spillovers need not involve the provincial government as they can be dealt with through bi- or multi-lateral cooperation among the municipalities or perhaps through the creation of a regional body to deal with issues of interest to the region.80 Programs aimed at income redistribution, although they can be administered locally, should be funded by the provincial and federal governments, as opportunities for income redistribution increase as jurisdiction size increases.81 The current division of responsibilities is treated as fixed for the purposes of this paper. Structural Reform Options Administrative and Accounting Changes Beneficial administrative and accounting changes are often overlooked in reform proposals but accounting, budgeting, and information retrieval systems that permit the collection of all necessary costing and usage data are important to the full implementation of the benefits principle. An example of an improved information system is the Asset Management Division recently created in the City of Cambridge, Ontario. Defining Municipal Infrastructure Needs and Managing Infrastructure Assets best practices82 helped Cambridge develop a system to manage municipal assets statistics and led to the creation of the aforementioned management division.83 The “best practices” used by the City of Cambridge are the result of work by the National Research Council and the Federation of Canadian Municipalities, begun in 2000, to create a set of best practice guidelines for municipalities. The guide is much too detailed to summarize effectively here, but is built around several main themes: decision making and investment planning, potable water, storm and wastewater, roads and sidewalks, environmental protocols, multi-discipline and transit. Charging residents less than full cost for services leads to too high a level of service provision, which means that the overall tax rate is too high. Without relatively easy access to a full accounting of the cost of a given service to different groups of taxpayers it is unlikely that appropriate prices will result. Unfortunately, the cost of collecting the required information can often be exorbitant and provide little benefit, especially for smaller municipalities. Alternatives to Public Sector Service Provision Infrastructure in Alberta and Canada has traditionally been designed, built, operated and owned by the public sector. Municipalities that continue using this model exclusively in the current environment of uneven growth, advanced engineering and smaller government may be foregoing the benefits available from private sector involvement.

45
Contracting Out Canadian municipalities have used contracting out, especially for construction projects and legal and engineering services, for some time. The list of services that are contracted out has diversified in recent years to include: environmental management, administration, transportation, social and cultural services and protection of persons and property.84 Allowing public employees, the private sector, and not-for-profit sector to bid for contracts to supply government services is intended to increase efficiency and reduce per unit operating costs. Contracting out is most applicable to services where costs and outputs can be measured and performance standards established – solid waste and recycling for example. Research from Canada, the US, and Europe have shown savings from increased competition of between 15 and 30 per cent.85 Studies on contracting out conclude that savings arise from the increased competition, which encourages providers to be more efficient – not simply because the provider was private. Public Private Partnerships The Public-private partnership (P3) model is growing in popularity in Europe and the US and, given the amount of spending needed to eliminate the infrastructure debt, will likely expand in Canada as well.86 A public-private partnership consists of an arrangement for a private entity to perform a service, such as extensions to existing water supply systems that are traditionally performed by a government entity. An essential element of a successful P3 is a transfer of risk from the public to the private sector. Public-private partnerships offer many possible advantages. First, private sector involvement is often associated with greater efficiency and innovation.87 Second, P3s offer access to private sector expertise and innovative technology; this may be particularly helpful to small municipalities with limited internal expertise. Third, the private partner will have a wider range of financing alternatives and using private capital frees up municipal resources for other purposes. There are also several possible disadvantages. First, accountability can be diminished if agreements are not transparent. Second, there may be little interest in projects where the development phase extends beyond the current government’s mandate, or if the private sector is concerned the contract may be terminated without compensation. Third, the project may have higher financing costs, which must be at least offset by savings in other aspects of the project to keep overall costs at least equal to the pure public provision of the service. One potential roadblock to P3s is the current state of subsidized services in many municipalities. User fees above the subsidized level may be required to obtain private financing.88 Fee increases may be politically uncomfortable but moving towards pricing that reflects the true cost of service provision is important not only for P3s but, as discussed above, to ensure appropriate levels of service are provided. The Canadian experience with P3s suggests that they can provide cost savings. Although P3s are clearly not appropriate for all government services, in Canada they have been popular for projects with substantial infrastructure costs.
46
Taxation and User Fees This subsection summarizes some of the options for reform to local government finance, which have been proposed recently. These reforms are intended to help municipalities deal with current and future challenges. Potential reforms are presented in two groups: those that can be implemented within existing arrangements and those that would require provincial and/or federal approval and actions. Reform proposals are usually focused on larger cities, although many rural and small-urban municipalities in Alberta face stresses even greater than those in the Canada’s large metropolitan areas. This focus is understandable as population is concentrated in these cities and data at the local order are hard to come by. Nevertheless, many of the tax changes would be of little benefit to municipalities outside of the cities as administrative costs are likely to be higher and the potential revenue yield is likely to be smaller or nonexistent in non-metropolitan municipalities. Tax changes as suggested in the relevant literature are discussed here in light of the fact that there appears to be little interest, at either the federal or provincial order of government, for new or expanded tax powers for municipalities. Some of the more technical aspects of fiscal reform (the Ramsey Rule and vertical and horizontal tax externalities for example) and potential distributional impacts have been left out of this discussion. Interested readers will find references in the bibliography that provide further background. Fiscal Reforms That Could be Implemented by Municipalities The property tax remains popular because beneficiaries of local government services cannot always be identified, so the property tax serves as a general “user charge” for services. Suggested reforms for the property tax are focused on eliminating the over-taxation of non-residential properties and trying to better match the tax paid with the cost of services received in general. Businesses benefit from local services and, according to the benefits principal, they should pay for them. Kitchen and Slack (1993) estimate that the business share of benefits of non-educational local government expenditure is about 40 per cent on average. Businesses are generally considered mobile factors and thus poor candidates for local taxes unrelated to benefits. However, political realities suggest that businesses will continue to be taxed for the simple reason that they do not vote.89 Kneebone and McKenzie (2003)90 suggest there is reason to believe that, in Alberta, the current level of taxes levied by cities on businesses is too high due to the split mill rate (non-residential property is subject to a higher tax rate than an equally valued residential property) and the fact that businesses are also subject to special business taxes. Beyond appeals to the benefits principle, higher taxation of non-residential properties is criticized because of the misallocation of resources it creates. Demand for a good priced below its full cost is higher than demand for an appropriately priced good. When business property taxes are higher than what is necessary to cover the cost of services to

47
businesses and, as a result residential taxes are lower than they would otherwise be, the level of services demanded by residential taxpayers is above where it should be. When the level of services demanded is higher more infrastructure is built and more services are supplied, which result in taxes as a whole being higher than they would be with appropriate prices. This suggests that there are cost savings to be had for all taxpayers from an appropriate alignment of costs and prices.91 As with the property tax, concerns about efficiency, accountability and fairness figure prominently in the justification put forward to alter and expand user fees. The main argument used against including efficiency considerations in the calculation of user fees, is that they are regressive, has led to unplanned redistribution. For example, a fixed price for water justified on the assertion that low-income households cannot afford variable rates provides an implicit subsidy to higher income households that use more water for activities such as washing cars and watering larger lawns.92 Local governments currently have a good deal of flexibility in setting user fees and could set them so as to encourage individuals to consume efficient amounts of services. A fixed charge could be used to cover fixed costs and a variable charge could cover marginal costs. At a broader level, user fees could be structured so that all fees together raise the required revenue in the most efficient way. Taking a broad view of fees would lead to relatively low fees on price-sensitive goods and services and relatively high fees on those that are less sensitive to price.93 However, the information required to implement this broad view approach would probably be prohibitive for most municipalities.94 Fiscal Reforms Requiring Provincial Support Several proposals would have to be approved by senior orders of government, usually just the province. As noted above and detailed below, these reforms seem unlikely to be implemented at the current time due mainly to the lack of federal and provincial interest in expanding municipalities’ ability to tax. Further, new or expanded taxation powers for the municipal sector would likely provide little benefit to municipalities outside of Canada’s large cities. Municipalities could be allowed access to the income tax again, either piggy-backed on the provincial structure or a separate structure. Piggy-backing would lower administration costs and still give municipalities autonomy in setting rates. Potential drawbacks of a local income tax include: higher cost to the economy relative to consumption based taxes, increased income taxation would be counter to recent federal and provincial efforts to lower taxes to enhance international competitiveness, and that current practice in many developed countries, consistent with most of the economic literature, is to move away from reliance on income and toward consumption-based taxes.95 A one per cent surtax on 2000 provincial personal income tax payable is estimated to yield $18.6 million for Calgary, $9.2 million for Edmonton and $18.5 million for all other Alberta municipalities.96 Several consumption-based taxes have been proposed including a general sales tax, hotel and motel occupancy taxes and fuel and vehicle taxes. A sales tax at the local order

48
could piggy-back on the federal or provincial tax with points determined locally and would give some flexibility and autonomy and be less costly than setting up a new tax.97 A broader reform for Alberta would see all or most current provincial transfers cut and replaced with a province-wide sales tax. The rate may need to be as little as two per cent and could be distributed based on sales, population or a combination of the two. Recent research suggests that the elimination of the provincial personal income tax and replacement with a sales tax would be economically beneficial to Alberta.98 Municipal finance reform could be incorporated with such a change and could provide municipalities with more stable revenue.99 One wrinkle that would have to be worked out is that given the political power of rural Alberta any distribution of sales tax revenue is likely to favour them at the cost of Calgary and Edmonton.100 The prospects for a municipal income or sales tax in Alberta or anywhere in Canada are weak currently. Senior governments in Canada are reluctant to create competition in their tax jurisdictions by enacting any tax reform that moves substantially away from the status quo in municipal finance. Further, it has been suggested that any effort to significantly increase local taxes would be political suicide.101 Even if significant tax reforms were made revenue-neutral, on the whole there would likely be an outcry from those who end up paying more and from those who perceive they are paying more. A Hotel/Motel Occupancy Tax, such as those in existence in Vancouver and Montreal and allowed in Manitoba, are usually piggybacked on the existing retail sales tax. Revenue is collected by the province and returned to municipalities. This type of tax is usually justified on the grounds that it covers increased local costs for services to tourists and visitors.102 Alberta’s Tourism Levy, recently renamed from the Hotel Room Tax, was introduced in 1987 and is added to the purchase price paid for temporary accommodation for both personal and business use. Allowing municipalities to “add on” to this tax in Alberta poses a problem because an occupancy tax levied by selected municipalities but not others provides an incentive to stay in the lower tax municipalities. Although the effect is uncertain convention arrangements are often highly sensitive to price which could lead to losses for businesses in the taxing jurisdiction.103 Also, this tax would not likely be a large revenue generator at a reasonable rate. Calgary and Edmonton could expect $2.2 million and $2.6 million, respectively, from 1.0 per cent tax on hotel and motel rooms.104 There is broad support for municipal access to fuel tax revenues among the papers reviewed, because it is consistent with the benefits principle, road infrastructure is a large spending requirement for municipalities and it has many positive attributes. Some of the positives of the fuel tax are that it is more responsive to changes in population than the property tax, its impact on consumption is relatively small, and it is levied on a relatively immobile base. The cities of Calgary and Edmonton currently receive five cents of the nine-cent provincial gas tax. Sharing fuel tax revenue is not unique to Alberta and the federal government recently began working out the details of sharing its gas tax revenue with municipalities. No cities in Canada currently set the rate and revenues are often earmarked for public transit or road infrastructure.

49
Capital Finance Reform Capital finance reform is often overlooked in discussions of ways to help municipalities generate the revenues they need, even though municipalities are generally below provincial guidelines for debt service charges due to a general reluctance to borrow and a focus on pay-as-you-go funding.105 Federal and/or provincial support would have to be secured in order to bring about these reforms and make borrowing a more attractive option by lowering costs. Kitchen proposes several options for giving municipalities additional flexibility in how they borrow for infrastructure and suggests that there are solid arguments for greater use of borrowing, especially where capital projects benefit future generations.106 Revenue Bonds are applicable to projects, such as water systems, that generate a revenue stream and have identifiable beneficiaries. Bonds are backed by the revenue stream from the project. The bonds are marketable if the revenue stream is adequate, predictable and spread over the life of the project. Revenue bonds are often regarded as being riskier than general government issues, but municipalities may avoid higher interest rates by guaranteeing the bonds.107 Tax-Exempt Bonds are not taxed under personal or corporate income tax, which lowers the cost of borrowing for cities.108 Although some claim tax exempt bonds to be inequitable because they provide more income tax relief to high than low income taxpayers, the author counters that the same is true of RRSPs and RPPs, and that the small cost in tax expenditure by the provincial and federal governments may be a way of internalizing positive spillovers created by economic activity generated in cities.109 Tax Incremental Financing Districts are intended to stimulate private sector investment in urban areas that need revitalization. Property tax revenue is split into two parts: one part is based on pre-development assessed values for general purposes and the other part is based on increased assessed values and is used to repay bonds issued to fund the development. This separation is maintained until the costs of public funds used for the redevelopment are recovered.110 Transfers Some municipalities are able to meet their needs with few or no transfers from senior orders of government while others rely on these revenues. An important characteristic of municipal finance – efficiency – demands that users are charged the correct price and that they are charged directly when possible. Municipal finance, in general, and transfers, specifically, should be designed to aid the goal of efficiency by ensuring that those delivering the services have a clear mandate, are accountable and have sufficient resources and flexibility.111 If municipal governments were given access to additional tax tools, it would likely strengthen the case for transfers to some municipalities. This is because many of the potential reforms discussed above would likely benefit large cities, but would provide

50
less revenue to rural and small urban areas. The existence of fiscal gaps, externalities and inequalities form the justification for transfers from senior orders of government. A fiscal gap means simply that a municipality’s own-source revenue is not sufficient to meet its expenditure responsibilities. Since provincial governments have significant say over the quality and quantity of services municipalities must provide and also over which revenue tools are available to them, they should ensure that revenues and expenditures match either by lowering service requirements or by providing transfers to close the gap.112 An externality exists when the costs or benefits of services provided by a municipality extend to those outside the municipality. For example, if the provincial government values the expansion of a service beyond a given municipality’s boundaries, it can provide a conditional matching grant to the municipality providing the service to cover the cost of expansion. Equalization grants are provided toward the goal of reducing inequalities among municipalities, by allowing reasonably comparable levels of service at reasonably comparable tax levels. Inequalities among municipalities’ ability to generate own-source revenue and in service provision costs reinforce the theme that one solution does not fit all municipalities. These inequalities are centered around three factors.113 One, a municipality with a small per capita tax base needs to levy a higher tax rate than a municipality with a larger base. There is a limit to how high a tax rate can go before its revenue yield begins to diminish. Two, the costs of providing comparable levels of service vary by municipality due to a variety of factors. Service provision in small rural areas is often more expensive than in urban areas for example. Three, demands for services vary based on factors such as personal income and the demographic make-up of the resident population. The use of transfers blurs accountability as one level of government pays for a service that another delivers. Transfers may also create inefficiencies by distorting local decision-making, but they do not necessarily interfere with a municipality’s ability to follow the benefits principle and charge the right prices where appropriate. The fuel tax “revenue sharing” between the provincial government and Calgary and Edmonton, where the province sets the base and tax rate and remits a share to the cities, is a transfer as the cities have no say in the base or in setting the rate. Other provinces have similar sharing agreements. Manitoba shares a portion of its personal and corporate income taxes with its municipalities. Recent discussions around fixing the municipal finance system in Alberta generally identify access to one or several new tax bases for municipalities. The senior orders of government show no signs of implementing such changes, which suggests that any increase in federal or provincial support for municipalities will be provided as transfers.
51
Summary Municipal finance reform options proposed recently often centre on municipal access to new revenue sources, generally a personal income, sales, motel/hotel occupancy or fuel tax. Other options include structural changes, adjustments to property taxation and user fees, and access to new capital finance tools. Increased transfers from the federal and provincial governments are another option to increase municipal revenue. Municipal finance reforms, to affect the expenditure side of the budget equation, generally focus on structural and capital finance modifications. Structural changes, guided by the benefits principle, built around privatization, and changes to accounting and administration policies can be enacted without provincial approval. Municipalities have room to borrow and may be interested in expanding their use of capital financing for infrastructure spending, if costs could be reduced through the use of revenue bonds, tax-exempt bonds and tax-incremental financing districts. Changes to the rules around municipal borrowing would require federal and/or provincial support. Municipal finance reform options to affect the revenue side of the budget equation include tax and user fee reforms, as well as increased federal and provincial transfers. Tax reform is broken into actions that municipalities take on their own and those that would require federal and/or provincial approval. Following the benefits principle, municipalities can adjust property taxes and user fees to better match costs with benefits received. However, the information required to better align costs and benefits can be prohibitively expensive for municipalities to acquire. Provincial and/or federal approval would be required to grant municipalities the ability to levy a tax on: personal income, sales, hotel/motel occupancy or fuel. Tax reform holds the potential to not only increase municipal revenues and provide a more stable base than the current property-tax focus allows, but also to improve efficiency, transparency and accountability. However, many of the “new” tax sources would likely not provide significant revenue outside of Calgary and Edmonton and there is little federal or provincial interest in allowing municipalities access to these tax bases. Transfers to the municipal order of government from the provincial and federal orders are provided to close a fiscal gap, to alleviate an externality or to provide equalization among municipalities.

52
77 Kitchen (2002), page 46. 78 Kitchen (2004), page 9 and Duff (2003). 79 Kitchen (2002), Chapter 3, pages 43-55. 80 Kitchen (2002), page 44. 81 Kitchen (2002), page 44. 82 Best Practices from the National Guide to Sustainable Municipal Infrastructure. 83 InfraNet, Volume 2, No.2 (Lead Story). 84 Kitchen (2002), pages 274 and 275. 85 Vander Ploeg (2004), page 32. 86 Vander Ploeg (2004), page 32. 87 Kitchen (2002), page 286. 88 Vander Ploeg (2004), page 33. 89 Kneebone and McKenzie (2003), page 66. 90 Kneebone and McKenzie (2003), pages 66 and 67. 91 Kitchen (2003), page 28. 92 Kitchen (2003), page 29. 93 Kneebone and McKenzie (2003), pages 63 and 64. 94 Dahlby (2003), page 82. 95 Kitchen (2003), page 30. 96 Kitchen and Slack (2003), page 2236. 97 Kitchen (2003), page 31. 98 Dahlby (2000). 99 Kneebone and McKenzie (2003), pages 69-71. 100 Dahlby (2003), page 82. 101 LeSage (2003), pages 40 and 41. 102 Kitchen and Slack (2003), page 2247. 103 Kitchen and Slack (2003), page 2248. 104 Kitchen and Slack (2003), page 2249. 105 Kitchen (2002), Chapter 8. 106 Kitchen (2003), pages 31 and 32. 107 Kitchen (2003), page 32 and Kitchen (2002), pages 212 and 213. 108 Kitchen (2003), page 32. 109 Kitchen (2003), page 33. 110 Kitchen (2003), pages 34 and 35. 111 Kitchen and Slack (2003), page 2261. 112 Kitchen and Slack (2003), page 2263. 113 Kitchen and Slack (2003), pages 2264 and 2265.

53
V. Summary, Conclusions and Policy Recommendations Summary Rural to urban migration, commonly referred to as agglomeration, can be seen in Alberta and throughout the world. People are drawn to urban areas for a variety of reasons; among them are: for employment opportunities, to get better access to services, to reduce commute time, and for access to a broader selection of cultural and entertainment activities. Strong natural resource performance focused on energy products (oil, gas, oil sands and heavy oil), as well as forestry has helped provide strong GDP and income growth in Alberta. This strong performance has fueled growth in the Regional Municipality of Wood Buffalo, as well as in the Calgary to Edmonton Corridor. Increases in farm size and the accompanying shift away from labour towards capital encourages people to leave rural areas to find employment. These pressures encourage the growth of central (usually urban) areas at the expense of rural areas. Taken together, the Calgary and Edmonton Census Divisions account for 70.9 per cent of the population increase expected in Alberta through 2026. As in other developed and developing jurisdictions, Alberta’s population is increasingly concentrated in urban areas. This transformation, whereby roughly 81 per cent of the population lives in urban areas, has been coupled with a decrease in the local share of total government spending. The municipal share of total government spending has fallen and – in a reversal of the situation prevailing in the rail era, where senior orders of government paid for economic development and municipalities reaped the benefits – municipalities now largely pay the costs associated with economic growth and senior orders of government reap the rewards. The automobile era brought a shift in spending responsibility towards municipal governments and limitations on the usefulness of their main revenue source, the property tax. Population growth and economic prosperity are now more of a burden for municipal governments, while the provincial and federal governments capture more of the rewards because their taxes are more responsive to economic growth than the property tax. These changes and actions by the federal and provincial governments in the 1990s have seen the development of a large infrastructure debt in Alberta and Canada as a whole. Federal transfers to provincial governments were cut in the 1990s, as the federal government eliminated its deficit. In turn, the provinces cut transfers to local governments. These cuts were often large and unpredictable. Even though provincial grants currently represent a relatively small share of municipal revenue, there is no guarantee that they will not fall further if the province faces a serious fiscal problem, possibly related to consistent increases in real per capita health care costs. Based on population, Alberta’s share of the estimated infrastructure debt ranges from $5.7 billion for the local sector alone to $12.5 billion for all governments. Not only does the debt need to be addressed, but the underlying causes of the annual infrastructure
54
deficit needs to be dealt with as well. Failure to deal with this problem will affect Alberta’s quality of life, as it will continue to affect productivity performance, the single most important determinant of long-term increases in standards of living. Provincial control over municipal government revenue sources and service requirements carries with it a duty to ensure that municipalities have the resources to discharge their public service responsibilities. When a systematic gap between revenues and necessary expenditures exists, the provincial government needs to take action to eliminate the gap. The provincial government is taking action to address the infrastructure debt and the federal government has announced that it will share its gas tax revenue with municipalities. The provincial government has short-, medium- and long-term goals for drinking water infrastructure and has specific links for municipalities to the goals in the 20 year plan. Alberta’s Rural Development Strategy aims to make sure that all parts of the province benefit from Alberta’s prosperity. These actions are being undertaken within the existing municipal finance structure and do not include allowing any changes to how municipalities fund the services they provide. Municipalities Under Stress The problems faced by the local government sector extend well beyond those in Canada’s cities and result from a number of stresses, which could threaten the long-term viability of some municipalities. A number of potential stresses can be identified and reviewed; stresses caused by population declines or rapid growth as well as expenditure growth in excess of revenue growth are reviewed in this paper. There are 21 municipal districts (MDs) and special areas (SAs) and 22 towns that saw population declines between 1995 and 2003. Taken together, the MDs and SAs lost close to 5,000 people between 1995 and 2003 (a decrease roughly equal to 5.6 per cent). In addition to losing population over the analysis period, eight of the 21 jurisdictions, representing 31 per cent of the aggregate population, saw spending grow faster than revenues. Taken together, the towns lost close to 3,000 people between 1995 and 2003 (roughly 5.2 per cent of the aggregate population). Most of these towns (17) are considered urban outside of metropolitan areas, four are rural areas and one is urban fringe. In addition to losing population over the analysis period, 17 of the 21 towns, representing 75 per cent of the aggregate population, saw spending grow faster than revenues. Two cities, two municipal districts, two specialized municipalities, and eleven towns saw population increase by more than twice the provincial average between 1995 and 2003. In addition to rapid population growth over the analysis period, nine of the 17 municipalities, representing 62 per cent of the aggregate population, saw spending grow faster than revenues. Few people in the towns, municipal districts, and special areas that lost population between 1995 and 2003, commute to a Census Metropolitan Area (CMA) or Census
55
Agglomeration (CA) for work. In contrast with the municipalities that lost population, the strong growth group tended to have a strong relationship with a CMA or a CA, often within the Calgary-Edmonton Corridor (CEC). Only one municipality in the CEC, the town of Gibbons, had a 1995-2003 population decrease. However, not all of the strong growth areas are close to the CEC. The Regional Municipality of Wood Buffalo grew by 53 per cent between 1995 and 2003, while Grande Prairie saw 38 per cent growth and the municipal district of Mackenzie expanded by 33 per cent. Canada has an infrastructure debt problem, which is receiving attention and, in Alberta at least, action is being taken to eliminate the debt. A considerable amount of attention has been paid to the infrastructure problems faced by large cities. To no surprise, many small municipalities face stresses and threats to their viability equal to or greater than those faced by large cities. Recent provincial and federal infrastructure spending commitments for Alberta appear to be large enough to address a significant share of the existing infrastructure debt, based on recent estimates. However, this spending is not accompanied by any reform proposals aimed at addressing the underlying cause of the problem, an outdated and inefficient local government finance model and thus will not provide a long-term solution. Local governments shared the pain of fiscal retrenchment in the 1990s and could face large and unpredictable cuts to their funding again if senior orders of government run into another funding crunch, perhaps related to financing health care for our aging population. Reform Options Municipal finance reform options proposed recently, often centre on municipal access to new revenue sources, generally a personal income, sales, motel/hotel occupancy or fuel tax. Other options include structural changes, adjustments to property taxation and user fees and access to new capital finance tools. Increased transfers from the federal and provincial governments are another option to increase municipal revenue. Municipal finance reforms to affect the expenditure side of the budget equation generally focus on structural and capital finance modifications. Structural changes guided by the benefits principle, built around privatization, as well as changes to accounting and administration policies can be enacted, without provincial approval. Municipalities have room to borrow and may be interested in expanding their use of capital financing for infrastructure spending if costs could be reduced through the use of revenue bonds, tax-exempt bonds and tax-incremental financing districts. Changes to the rules around municipal borrowing would require federal and/or provincial support. Municipal finance reform options, to affect the revenue side of the budget equation include tax and user fee reforms and increased federal and provincial transfers. Tax reform is broken into actions that municipalities take on their own and those that would require federal and/or provincial approval. Following the benefits principle,

56
municipalities can adjust property taxes and user fees to better match costs with benefits received. However, the information required to better align costs and benefits can be prohibitively expensive for municipalities to acquire. Provincial and/or federal approval would be required to grant municipalities the ability to levy a tax on: personal income, sales, hotel/motel occupancy or fuel. Tax reform holds the potential to not only increase municipal revenues and provide a more stable base than the current property-tax focus allows, but also to improve efficiency, transparency, and accountability. However, many of the “new” tax sources would likely not provide significant revenue outside of Calgary and Edmonton and there is little federal or provincial interest in allowing municipalities access to these tax bases. Transfers to the municipal order of government from the provincial and federal orders are provided to close a fiscal gap, to alleviate an externality or to provide equalization among municipalities. Conclusions and Recommendations Future productivity gains and standard of living improvements will need a reliable, efficient infrastructure system. Although the recent infrastructure spending commitments in Alberta cover a large share of the estimated infrastructure debt, there is no firm commitment to ensure we do not accumulate another debt after the current high level of interest in this issue fades. All orders of government need to craft long-term solutions to the underlying cause of Alberta’s and Canada’s infrastructure deficit and debt – an inadequate local government finance model. While groups of municipalities face similar stresses – such as declining or rapidly increasing population coupled with fiscal problems – the solution to the difficulties facing a particular municipality require unique solutions, for the set of circumstances in the municipality. The more flexibility that is made available to a municipality the more likely it is to find the best solution for its unique situation. Given the provincial and federal government’s apparent lack of interest in allowing municipalities the ability to levy additional taxes and the fact that all orders of government must contribute to a solution recommendations are split two ways. First, they are divided into actions that municipal governments can take on their own and those that require action by the federal and/or provincial government. Second, the changes that require action by the senior orders of government are split into those that should be enacted in short order and those with a longer-term horizon. Municipal Order of Government As a start, municipal governments can reform their accounting and information systems to better allow the calculation of the full cost of delivering services to different groups of taxpayers, including such factors as cost variations based on time of day or season of consumption. Full cost information, or at least the best information available given collection costs, coupled with the benefits principle suggests reforms to property taxes and user fees.
57
The current discrimination against non-residential properties should be ended. Taxation should reflect the actual full cost of providing services to the property or group of properties, taking into account factors that affect cost such as density and distance from city centre. Local governments currently have a good deal of flexibility in setting user fees and could set them so as to encourage individuals to consume efficient amounts of services. A fixed charge could be used to cover fixed costs and a variable charge could cover marginal costs. The appropriate alignment of costs and price, provided the cost of collecting the necessary data is reasonable, should generate cost savings for municipalities. Senior Orders of Government Municipal governments have more responsibility for growth-facilitating infrastructure than when the Canada’s municipal finance system was designed and their primary revenue source, the property tax, responds slowly to economic growth. The widespread benefit of an efficient infrastructure system is captured more effectively by provincial and federal taxes, as revenue from the income and sales taxes grow with the economy. The provincial government controls which revenue sources municipalities have access to and sets the division of services between the provincial and municipal orders of government. This control carries with it an obligation to ensure that municipalities have the resources to provide the services they are responsible for. There are widespread economic benefits from stable revenue for municipalities as infrastructure projects are likely to be delayed when funding is uncertain. Delays in large-scale maintenance projects are costly as they shorten the effective life of the asset and delays in new projects aimed at facilitating the flow of goods and people can be a drag on productivity growth. The province needs to reform the current municipal finance structure to one that provides a sufficient, stable, predictable revenue stream, which responds reasonably well to growth. There are potential advantages in terms of accountability, efficiency and transparency in allowing municipalities access to additional taxes. However, the province appears to have no interest in expanding the variety of tax bases that municipalities can access. There would also be difficult issues to address such as the usefulness of new revenue sources to non-metropolitan municipalities and who sets the rates and bases. This is not a solution that can be implemented in the short-term; its complexity and wide-ranging impacts require a public consultation to gauge public and municipal interest and opinions. Some of the issues that should be addressed by the consultation are discussed after the suggested near-term solution. Other than allowing municipalities additional tax sources the provincial government can provide greater flexibility to municipalities by:
• reducing municipal spending obligations by taking on additional responsibility at the provincial level;
58
• allowing municipalities greater flexibility in capital finance to encourage greater use of borrowing; and/or,
• reform and increase transfers. The split of responsibilities between the provincial and municipal orders of government were not considered in detail in this report, as it appears to be stable for the foreseeable future. The province should work with the federal government, where necessary, to allow municipalities greater flexibility in capital finance, by allowing them to make use of revenue bonds, tax-exempt bonds and tax-incremental financing districts. The fuel tax revenue sharing agreement in Alberta is a transfer as the municipalities involved, Calgary and Edmonton, have no say in the tax base or rate. The provincial government should expand its gas tax sharing beyond Calgary and Edmonton, to include all municipalities using a combination of sales and population for the distribution. The provincial government should also tie transfers to personal income tax revenue to provide a stable, predictable source of revenue, which grows with the economy. These changes would not fully insulate the municipal sector from economic shocks – nor should they – but, coupled with a firm commitment from the provincial government to not download future fiscal problems to the municipal order, they offer an improvement from the status quo. Consultation and Longer-Term Reform As mentioned above, there are potential benefits to be had from allowing municipalities access to additional tax sources but these benefits must be considered in light of the fact that there is a general intolerance for tax increases and the provincial and federal governments have little interest in sharing their tax bases with municipalities. Such a dramatic shift away from standard municipal practice in the 20th century should include a widespread public consultation to get Albertans’ views about what services they expect from their municipal governments in the future and how they would prefer government be organized. The ultimate objective of the consultation would be to establish a new framework to support growth and development through to 2020 in all regions of the province. Consultations are often used in Alberta and represent an opportunity for Albertans to express their opinions to the government and help form policies and legislation that reflects Albertans’ concerns and preferences. Feedback is usually provided to the government via email, online forms, surveys, phone lines and/or town hall meetings throughout the province. Recent consultations have addressed such diverse topics as the revised Canada-Alberta Agreement on Environmental Assessment; early childhood development and child care as they relate to possible funding under the national child care initiative; and, It’s Your Future which asked Albertans to rate their priorities for a debt-free Alberta.

59
Such a consultation would need to cover a wide range of topics including, but not limited to, the following:
• As part of overall reform and in the interests of competitiveness, should Alberta consider following the global trend away from income taxation in favour of consumption taxes? In effect, should Alberta replace its provincial personal income tax with a sales tax?
• Should the province simply transfer a portion of a tax’s revenue and set the base and rate itself or, in the interest of accountability, should municipalities set the base, the rate or both?
• If municipalities are granted the power to add tax points to an existing provincial tax, what type of limits will there be on the total tax and will tax rates be coordinated among neighboring municipalities?
• If municipalities are granted access to additional revenue sources, will those municipalities that are unlikely to benefit from the new revenue tool see equalization transfers?
• To what degree are new municipal taxes likely to affect: business location, primary residence, and retail sales?
Final Note Population migration to concentrated corridors of economic activity will continue to change our provincial landscape over the next twenty years – affecting public service delivery capacity and finance in the magnet areas, as well as the areas losing population. The current municipal finance structure needs reform to allow municipalities the flexibility and resources to deal with these changes.

60
Appendix A – Methodology
Database Overview The fiscal and population data are from Alberta Municipal Affairs MIFS dataset (Municipal Financial Information System). Urban/rural classifications and municipal-specific commuting data come from Statistics Canada’s GeoSuite 2001 CD-ROM. The database was set up with these main sources, augmented by a variety of supplemental information sources such as Statistics Canada’s Community Profiles and Alberta Municipal Affairs’ Municipal Profiles.
Alberta Municipalities There are three main groups of municipalities in Alberta: urban, rural and specialized. The following descriptions, although abbreviated, abide by those found on the Alberta Municipal Affairs website.
Urban Municipal Governments Cities There are 15 municipalities in Alberta that have been granted city status. To qualify as a city, there must be sufficient population size present with over 10,000 people. Cities may establish ward systems with the same number of councilors in each ward. Candidates, or those elected to the municipal council, are required to be residents of the wards they represent. A mayor, who is elected at large, and an even number of councilors or aldermen govern cities. There should always be an odd number of people on council to avoid tie votes. Elections for cities and all local government units are held every three years.
Towns A town can be formed when the population is at least 1,000 people and may exceed 10,000 people, unless it requests a change to city status. Under the Municipal Government Act, a mayor and 6 councilors govern a town, unless otherwise specified. The mayor and councilors are elected at large. The size of the council is set by municipal bylaw and presently ranges from 5 to 7 councilors. Councilors are required to be resident in their municipality. There are a total of 110 towns.
Villages Villages may be formed upon request by 30 per cent of electors in a community with a population of at least 300 people. They may apply for town status when the population reaches 1,000 people. The council of a village consists of 3 councilors, one of whom is the mayor. There are 102 villages in Alberta.
Summer Villages

61
Generally, the provisions related to a village apply to a summer village, except that in the latter, elections and annual meetings are required to be held in the summer. Those who own property in the summer village and others over age 18 and resident in the village on election day are entitled to vote. However, electors for school representation, if any, must be defined as resident. A summer village is the only type of municipality where a person can vote twice in municipal elections: once in the summer village and once in the municipality where their permanent residence is located. There are 51 summer villages in Alberta. Summer villages can no longer be created in Alberta.
Rural Municipal Governments There are 75 rural municipalities in Alberta. The designation “rural” does not mean these areas are farm or resource based areas only. Some of these municipalities contain substantial residential populations. Municipal Districts A municipal district (often referred to as a county) is a government form in rural areas of the province. It includes farmlands as well as unincorporated communities such as hamlets and rural residential subdivisions. The council consists of one councilor per ward, one of who is elected by council as reeve. Presently the number of wards varies from 4 to 11, with the most common being 7. Hamlets The council of a municipal district or specialized municipality can designate an unincorporated community that is within its boundaries to be a hamlet. A community can be a hamlet if it consists of 5 or more dwellings, has a generally accepted boundary and name, and contains land that is used for non-residential purposes. Improvement Districts The provincial government, through Alberta Municipal Affairs, is responsible for all functions of local government in the improvement districts, including the levy and collection of taxes. The residents of an improvement district (ID) elect representatives, who are subsequently appointed by the Minister, to an advisory council which assists in the administration of each district. Six of the eight IDs are located in national parks – ID No. 4 (Waterton), ID No. 9 (Banff), ID No. 12 (Jasper), ID No. 13 (Elk Island) and ID No. 24 (Wood Buffalo) – and two are provincial parks: Kananaskis Improvement District (including Kananaskis Provincial Park) and ID No. 25 (Willmore Wilderness). The provincial and federal governments have the primary responsibility in these areas, except for school affairs. Formal power rests with the Minister of Municipal Affairs, but most power and responsibility has been delegated to the councils. Métis Settlements There are eight Métis settlements in Alberta, covering a total area of approximately 1.25 million acres (0.5 million ha). There are presently 5,146 Métis residing in the settlements.

62
These are the only Métis settlement corporations established under the Métis Settlements Act. Special Areas Special Area refers to a rural area in southeast Alberta administered by a board of three people appointed by the Lieutenant Governor in Council. Technically, there are three Special Areas in southeast Alberta, but for simplicity and in accordance with the common usage these will be referred to as one unit. The areas were established under the Special Areas Act in 1938 due to extreme hardship of the drought years of the 1930s. The Special Areas Act of 1938 has more or less remained intact, although there were some amendments in 1966 and 1985. An advisory council of 13 is elected in accordance with the Local Authorities Election Act. The population of the Special Areas is 5,314 people. The land area of about 5 million acres (2,024,292 ha) is comprised of 2 million acres (809,717 ha) of privately held land, 1.5 million acres (607,287 ha) of crown land and 1.5 million acres (607,287 ha) of tax recovery land. There are a number of agreements between the Special Areas and the urban municipalities within it. These agreements cover fire protection, ambulance, library, recreation, regional waste collection, some limited family and community services and the development and operation of medical centers. The Special Areas is also involved in the Prairie Association for Water Management, which has membership extending from the City of Calgary to Kindersley, Saskatchewan. The Association will examine, in concert with government agencies, rural and urban needs and develop water resource plans and strategies. Reserves A reserve is not a part of any municipality. The British North America Act, 1867, places exclusive legislative authority on matters related to aboriginal peoples and reserves with the national parliament. The reserves, which range in size from 1,089 acres (441 ha) to 354,667 acres (143,532 ha), have a total area of 1,622,630 acres (656,669 ha). All but two of the smallest reserves are occupied. Specialized Municipalities Specialized municipalities are unique municipal structures that can be formed without resorting to special Acts of the Legislature. Often, specialized municipalities allow urban and rural communities to coexist in a single municipal government. The Regional Municipality of Wood Buffalo and Strathcona County are two examples.
Statistics Canada Definitions The Statistical Area Classification (SAC) The Statistical Area Classification (SAC) groups census subdivisions according to whether they are a component of a census metropolitan area, a census agglomeration, a census metropolitan area, and census agglomeration influenced zone (strong MIZ, moderate MIZ, weak MIZ or no MIZ), or the territories (Northwest Territories, Yukon Territory and Nunavut). A SAC code is assigned to each Census Sub-Division (CSD). Coding Definitions (SAC Type):

63
1 CMA 2 Tracted CA 3 Non-tracted CA 4 Strongly Influenced (zone) 5 Moderately Influenced (zone) 6 Weakly Influenced (zone) 7 Not Influenced (zone) 8 Territories
• Strongly Influenced (code 4) more than 30 per cent of the municipality’s residents commute to work in any CMA or CA
• Moderately Influenced (code 5) from 5 per cent to 30 per cent of the municipality’s residents commute to work in any CMA or CA
• Weakly Influenced (code 6) from 0 per cent to 5 per cent of the municipality’s residents commute to work in any CMA or CA
• Not Influenced (code 7) fewer than 40 or none of the municipality’s residents commute to work in any CMA or CA
Urban and Rural Areas An urban area has a minimum population concentration of 1,000 and a population density of at least 400 per square kilometre, based on the current census population count. All territory outside urban areas is classified rural. Taken together, urban and rural areas cover all of Canada. Urban population includes all population living in the urban cores, secondary urban cores and urban fringes of census metropolitan areas (CMAs) and census agglomerations (CAs), as well as population living in urban areas outside of CMAs and CAs. Rural areas include all territory lying outside urban areas. Rural population includes all population living in the rural fringes of census metropolitan areas (CMAs) and census agglomerations (CAs), as well as population living in rural areas outside CMAs and CAs. Note: In 2001, five UAs straddled provincial boundaries: Campbellton (New Brunswick-Quebec), Hawkesbury (Ontario-Quebec), Ottawa - Hull (Ontario-Quebec), Flin Flon (Manitoba-Saskatchewan) and Lloydminster (Alberta-Saskatchewan). When the geographic level selected is all of Canada, the totals include the UA on both sides of the provincial border. If a province has been selected, only the part of the UA in the province chosen is included in the totals. Coding Definitions (UARAType): For urban areas (UAs) the type code indicates the relationship of the UA to the census metropolitan area/census agglomeration (CMA/CA) structure. The values are: 0 Rural Area 1 Urban core 2 Urban fringe 4 Urban outside metropolitan area 6 Secondary urban core
64
Quantifying Municipal Capacity and Viability Municipalities face a number of stresses, both positive and negative, on an ongoing basis. How a municipality deals with these stresses reveals information about its reactive and proactive capacity. Reactive capacity refers to the ability to respond to problems or opportunities while proactive capacity refers to the ability to take action before problems or opportunities appear.114 If a municipality has insufficient capacity its viability is at risk. While stresses, capacity and even the viability of a municipal unit can be quantified, a single or overarching measurement of viability is not possible for a number of reasons: stresses may have similarities among municipalities but their timing, duration, intensity, scope and exact definition may vary, there is no uniform set of municipal accounting standards and much of the necessary data, while possibly available to the individual municipality, are unavailable in aggregate or are outdated.115 The inability to create a single measurement of viability for all municipalities is not the last word however. Marshall and Douglas (1997) create a useful conceptual matrix of the stresses acting on municipal viability featuring how financial, governance, and community stresses impact municipal government’s two basic roles of service provider and local democratic representative. The matrix is recreated below116.
Municipal Financial Viability
Municipal Governance
Viability
Community Viability
Governance Role Service Role
Municipal financial, municipal governance and community viability are defined in terms of the municipality’s ability to sustain and/or expand its capacity and resist, adapt to and anticipate the stresses that are placed upon the capacity. A third dimension indicating whether the stress is short-, medium-, or long-term could also be added to this matrix.117 This matrix illustrates the complexity in trying to build a composite index of municipal viability, but it also provides a useful method of quantifying the stresses an individual municipality faces. Identifying stresses and how they impact the long-term viability of a municipality can focus a government’s attention and suggest possible courses of action. While an individual municipality could utilize the Marshall-Douglas matrix the limitations of municipal order data do not allow a province-wide analysis with it. The analysis presented in this paper focuses on how recent changes in a municipality’s population and fiscal situation indicate potential threats or stresses to municipal financial viability and community viability related to local government’s service role.

65
114 Marshall and Douglas (1997), page 25. 115 Marshall and Douglas (1997), page 25. 116 Marshall and Douglas (1997), pages 25 and 26. 117 Marshall and Douglas (1997), page 28.
66
References Alberta Energy (2004) The Alberta Hub: Gateway to North America’s Natural Gas and
Petrochemical Markets, Government of Alberta Azmier, Jason J. and Sarah Dobson (2003) The Burgeoning Fringe: Western Canada’s
Rural Metro-Adjacent Areas, Canada West Foundation Azmier, Jason J. and Liam Stone (2003) The Rural West: Diversity and Dilemma, Canada
West Foundation Bird, Richard M. and Almos Tassonyi (2002) Constraining Subnational Fiscal Behaviour
in Canada: Different Approaches, Similar Results?, in Decentralization and Hard Budget Constraints (J. Rodden, G. Eskeland and J. Litvack, Editors), MIT Press
Boothe, Paul and Heather Edwards (2003) in Eric J. Hanson’s Financial History of
Alberta: 1905-1950, University of Calgary Press Bird, Richard M. and Almos Tassonyi (2002), Constraining Subnational Fiscal
Behaviour in Canada: Different Approaches, Similar Results? In Decentralization and Hard Budget Constraints, (J. Rodden, G. Eskeland and J. Litvack, Editors), MIT Press
Canadian Society for Civil Engineering (2002) Critical Condition: Canada’s
Infrastructure at the Crossroads Dahlby, Bev (2000) Tax Reform and Economic Growth in Alberta, Canada West
Foundation Paper 200015 Dahlby, Bev (2003) Comments on “Removing the Shackles”, in Paying for Cities: The
Search for Sustainable Municipal Revenues (Paul Boothe, Editor), Institute for Public Economics
Duff, David G. (2003) Benefit Taxes and User Fees in Theory and Practice, Research
Paper 45, Panel on the Role of Government in Ontario Emery, J. C. Herbert (2003) Controlling the Creatures: An Historical Perspective on
Financing Cities, in Paying for Cities: The Search for Sustainable Municipal Revenues (Paul Boothe, Editor), Institute for Public Economics
Emes, Joel (2004) Demographic Impacts On Alberta’s Provincial Budget: Fiscal
Projections through 2026, Vision 2020, Phase I Report, Alberta Chambers of Commerce and Certified General Accountants Association of Alberta

67
Gibbons, Roger, Loleen Berdahl and Casey Vander Ploeg (2004) Creating a Sustainable Municipal-Provincial Partnership to Meet the Infrastructure Challenge of Alberta’s 2nd Century, CWF Report 2004-15, Canada West Foundation
Government of Alberta (2003a) Water For Life: Alberta’s Strategy For Sustainability,
November, 2003. Government of Alberta (2004a) Government of Alberta Strategic Business Plan, part of
Budget 2004, On Route, On Course, March 3, 2004. Government of Alberta (2004b) Municipal Affairs Business Plan 2004-07, part of Budget
2004, On Route, On Course, March 3, 2004. Government of Alberta (2005a) A Place to Grow: Alberta’s Rural Development Strategy,
February 5, 2005. Government of Canada (2005) Budget 2005: Delivering on Commitments, February 23,
2005. Governments of Alberta and Canada (2005) Agreement Signed on the New Deal For
Cities and Communities, Joint Press Release, May 14, 2005. Graham, Katherine and Susan Phillips (1998) Who Does What in Ontario?: The Process
of Provincial-Municipal Disentanglement, Canadian Public Administration, vol. 42, no. 2, pg. 175-209
Groover, Joel (2004) Small Towns, Big Ideas, American City and County, October 2004 Hodge, Gerald (1993) Canada’s Aging Rural Population, The Role and Response of
Local Government, Intergovernmental Committee on Urban and Regional Research.
Kitchen, Harry M., and Enid Slack (1993) Business Property Taxation, Discussion Paper
Series 93-24, Government and Competitiveness, School of Policy Studies, Queen’s University: Kingston, Ontario
Kitchen, Harry M. (2002) Municipal Revenue and Expenditure Issues in Canada,
Canadian Tax Paper No. 107, Canadian Tax Foundation. Kitchen, Harry M. (2003) Financing Cities and Fiscal Sustainability, in Paying for
Cities: The Search for Sustainable Municipal Revenues (Paul Boothe, Editor), Institute for Public Economics
Kitchen, Harry M., and Enid Slack (2003) Special Study: New Finance Options for
Municipal Governments, Canadian Tax Journal, Vol. 51, No. 6, Canadian Tax Foundation

68
Kitchen, Harry M. (2004) Financing City Services: A Prescription for the Future, AIMS Urban Futures Series, Paper #3, Atlantic Institute for Market Studies
Kneebone, Ronald D. and J. Chung (2003) Where Did the Debt Come From?, in Is The
Debt War Over?: Lessons From Canada’s Battle Against Government Budget Deficits (C. Ragan and W. Watson, Editors), Institute for Research on Public Policy
Kneebone, Ronald D. and Kenneth J. McKenzie (2003) Removing the Shackles, in Paying
for Cities: The Search for Sustainable Municipal Revenues (Paul Boothe, Editor), Institute for Public Economics
LeSage, Edward C. (2003) Comments on “Financing Cities and Fiscal Sustainability”, in
Paying for Cities: The Search for Sustainable Municipal Revenues (Paul Boothe, Editor), Institute for Public Economics
Marshall, John A. and David J. A. Douglas (1997) The Viability of Canadian
Municipalities: Concepts and Measurements. ICURR (Intergovernmental Committee on Urban and Regional Research) Press.
McFarlane, Susan (2001) Building Better Cities: Regional Cooperation in Western
Canada, Canada West Foundation Mirza, Saeed M. and Murtaza Haider (2003) The State of Infrastructure in Canada:
Implications for Infrastructure Planning and Policy, Department of Civil Engineering at McGill University.
Mitchelson, Ronald L. and James Fisher (1987) Long Distance Commuting and
Population Change in Georgia, 1960-80. Growth and Change 18: 44-65. National Guide to Sustainable Municipal Infrastructure (2002) Alternative Funding
Mechanisms: A Best Practice By the National Guide to Sustainable Municipal Infrastructure, Federation of Canadian Municipalities and National Research Council
Slack, Enid (2004) Revenue Sharing Options for Canada’s Hub Cities, prepared for the
Meeting of the Hub City Mayors, Toronto, September 17-18 Stabler, Jack C., M. Rose Olfert and Jonathan Greuel (1996) Spatial Labor Markets and
the Rural Labor Force. Growth and Change 27:206-230. Stabler, Jack C. and M. Rose Olfert (2002) Functional Economic Areas of the Canadian
Prairie Region, Prepared for Agriculture Canada-PFRA, Canadian Rural Partnership (CRP) and Rural Development Division of Alberta Agriculture, Food and Rural Development.
69
Tanzi, Vito and Ludger Schuknecht (2000) Public Spending in the 20th Century: A Global Perspective, Cambridge University Press.
TD Economics (2003) The Calgary-Edmonton Corridor, Take Action Now to Ensure the
Tiger’s Roar Doesn’t Fade, TD Bank Financial Group TD Economics (2004) Mind The Gap: Finding The Money to Upgrade Canada’s Aging
Public Infrastructure, TD Bank Financial Group Vander Ploeg, Casey (2001) Dollars and Sense: Big City Finances in the West, 1990-
2000, Report 2001-12, Canada West Foundation Vander Ploeg, Casey (2002a) Framing a Fiscal Fix-Up: Options for Strengthening the
Finances of Western Canada’s Big Cities, Report 2002-01, Canada West Foundation
Vander Ploeg, Casey (2002b) Big City Revenue Sources: A Canada-U.S. Comparison of
Municipal Tax Tools and Revenue Levers, Report 2002-10, Canada West Foundation
Vander Ploeg, Casey (2003) A Capital Question: Infrastructure in Western Canada’s Big
Six, Western Cities Project Report #27, Canada West Foundation Vander Ploeg, Casey (2004) No Time to be Timid: Addressing Infrastructure Deficits in
the Western Big Six, Western Cities Project Report #30, Canada West Foundation

www.albertavision2020.ca