In a longitudinal study of preretirement education, one of two … · 2013. 12. 2. · DOCUMENT...
129
DOCUMENT RESUME ED 024 869 By-Hunter, Woodrow W. A Longitudinal Study of Preretirement Education. Michigan Univ., Ann Arbor. Div. of Gerontology. SPons Agency- Welfare Administration, Washington, D.C. (DHEW). Report No- Proj-151 Pub Date 68 Note- 128p. EDRS Price MF-$0.75 HC-$6.50 Descriptors-*Adiustment Problems, *Adult Education Programs, Bibliographies, Changing Attitudes, Decision Making, Family Relationship, Group Discussion. Health, Laborers, Leisure Time, Money Management, *Research, *Retirement, Social Relations, Work Attitudes Identifiers-*Detroit In a longitudinal study of preretirement education, one of two groups had a group discussion program for 10 weekly sessions. Volunteer participants were male, hourly-rated workers, 60-68 years old, employed in the Detroit area automobile assembly plants. Discussion centered on work and retirement, money management, physical and mental health, living arrangements, relationships with family and friends, legal issues, free time and community programs. Data were collected by interviews with all subj.pcts before retirement, six to 12 months, and 18 to 24 months after retirement. Results showed that the preretirement education significantly reduced retirement dissatisfaction and health worries, and encouraged participation in activities with family and friends. With both experimental and control groups, there was an increase in the husbands' power in family decision making after retirement. Certain tentative findings, such as the suggestion that the program was more effective with well educated whites, indicate that further study is needed. (10 AC 002 912
Transcript of In a longitudinal study of preretirement education, one of two … · 2013. 12. 2. · DOCUMENT...

DOCUMENT RESUME
ED 024 869By-Hunter, Woodrow W.A Longitudinal Study of Preretirement Education.Michigan Univ., Ann Arbor. Div. of Gerontology.SPons Agency- Welfare Administration, Washington, D.C. (DHEW).Report No- Proj-151Pub Date 68Note- 128p.EDRS Price MF-$0.75 HC-$6.50Descriptors-*Adiustment Problems, *Adult Education Programs, Bibliographies, Changing Attitudes, DecisionMaking, Family Relationship, Group Discussion. Health, Laborers, Leisure Time, Money Management,*Research, *Retirement, Social Relations, Work Attitudes
Identifiers-*DetroitIn a longitudinal study of preretirement education, one of two groups had a
group discussion program for 10 weekly sessions. Volunteer participants were male,hourly-rated workers, 60-68 years old, employed in the Detroit area automobileassembly plants. Discussion centered on work and retirement, money management,physical and mental health, living arrangements, relationships with family and friends,legal issues, free time and community programs. Data were collected by interviewswith all subj.pcts before retirement, six to 12 months, and 18 to 24 months afterretirement. Results showed that the preretirement education significantly reducedretirement dissatisfaction and health worries, and encouraged participation in
activities with family and friends. With both experimental and control groups, therewas an increase in the husbands' power in family decision making after retirement.Certain tentative findings, such as the suggestion that the program was moreeffective with well educated whites, indicate that further study is needed. (10
AC 002 912

7,7771, -
U.S. DEPARTMENT OF HEALTH, EDUCATION & WELFARE
OFFICE OF EDUCATION
THIS DOCUMENT HAS BEEN REPRODUCED EXACTLY AS RECEIVED FROM THE
PERSON OR ORGANIZAT!ON ORIGINATING IT. POINTS OF VIEW OR OPINIONS
STATED DO NOT NECESSARILY REPRESENT OFFICIAL OFFICE OF EDUCATION
POSITION OR POLICY.
A LONGITUDINAL STUDY
of
PRERETIREMENT EDUCATION
Department of Health, Education, and WelfareWelfare AdministrationResearch Grants Branch
Project #151
Woodrow W. Hunter
DIVISION OF GERONTOLOGY
THE UNIVERSITY OF MICHIGAN
1968

ir
A Longitudinal Study
of
Preretirement Education
Department of Health, Education, and WelfareWelfare AdministrationResearch Grants Branch
Project #151
Woodrow W. Hunter
Division of GerontologyThe University of Michigan
1968
The study reported herein bas supported by a grant from the ResearchGrants Branch, Division of Research, Welfare Administration, Departmentof Health, Education, and Welfare, Uashingten,

Actn.lowetements
The author owes a great deal to many individuals end organisations
including the Research Grants Branch, Division of Research, WelfareAdministration, Department of Health, Education, and Welfare for making
available under grant number 151 the major share of support for the study,
and the Division of Gerontology and the Institute of Labor and Industrial
Relations of the University of Michigan for providing the additional funds
that were needed to conduct the study. Of equal importance was the
financial assistance provided by the Cooperative Research Branch of the
United. States Office of Education for the preliminary development and
assessment of preretirement education materials upon which this study was
based.
The United Automobile Workers International Union and several ofits local unions in the Metropolitan Detroit area deserve special crteitfor identifying subjects and encouraging their participation in pre-retirement education programs in local union halls.
Sushil Kumar and Peter Kunsman, graduate students working onadvanced degrees at the University of Michigan deserve special credit fortheir capable assistance in the various aspects of the research. Miss
Esther Schaeffer of the University of Michigan's Statistical ResearchLaboratory gave considerable help as a statistical consultant to theproject. Judith 7loyd cave excellent help as a statistical assistant.
The author also wishes especially to thank Mr. Al Rightley, coordi.nator, Older and Retired Workers Department, UAW Internatiomal Unica,without whose help local union cooperation would not have been what itwas. In addition, Mr. Rightlay found time to serve as co-leader withthe author at each of the preretirement edmcation sessions.t Hie capablehandling of all aspects of program planning and orgaazation was indisftpensable.
The author was fortunate indeed to have an assistant as capable anddependable as Mrs. Lois Spaide who was directly responsible for the manyadministrative, clerical and secretarial aspects of the project. She,
together with her co-morkers Sue Miller and Karen Baxter, never failedto give of themselves beyond the call of duty in order to see the jobfinished, whatever it might 'be.
In the last analysis, however, the study would not have been under..taken without the support of Dr. Wilma Donahue, Chairman of the Universityof Michigan's Division of Gerontology, who invariably found time to counsel,implement and encourage.
.Woodrow W. Hiuiter
Ann Arbor, Michigan
June, 1968
ii

TABLE OF CONTENTS
I. The Problem
The Need for Retirement EducationOrigins and Status of Preretirement EducationNumbers and Characteristics of ProgramsSurveys of IndustryPreretirement Education in Labor UnionsPreretirement Education in European CountriesPreretirement Education ResearchFrame of Reference for the Study
Page
2
. .458
. 9. 10
11
II. Purposes and Methods of the Study
Purposes of the Longitudinal Study 21Review of a Preliminary Study 22Subjects for the Longitudinal Study 24Comparability of Study Groups Before Retirement 25Comparability of Study Groups One Year After Retirement 36Summary of Statistical Comparisons of Study Groups 43Hypotheses of the Study 45Measures of Personal and Social Adjustment in Retirement 45Organizational Procedures 53The Preretirement Education Program
. 54
III. Findings of the Study
Methods of Analysis 63Analysis of Mean Scores 64Analysis of Mean Change Scores 73The Adjustment of Sub-groups 76The Social Structure of the Family in Retirement 78Summary of Findings 84
117. Summary of the Study and Implications for Further Research 87
Appendix 1: Tables
Appendix 2: Indexes
Table 1.Table 2.Table 3.
LIST OF TABLES
Subjects for the PreliminaryOld and New Subjects for theNumber of Subjects Availableof the Study
. . . . 94
113
Study 24Longitudinal Study. . 25at the Various Phases
. . . 25

List of Tables (conit.) Page
Table L. Comparison of Experimental and Control Populations on theBasis of Age (Pre-R1) 27
Table 5. Comparison of Experimental and Control Subjects on theBasis of Marital Status (Pre-R1) 27
Table 6. Experimental and Control Populations Compared on theBasis of Race (Pre-R1) 28
Table 7. Experimental and Control Subjects Compared on the Basisof Birthplace and Language Spoken at Place of Birth (Pre.R1) . 28
Table 8. Experimental and Control Subjects Compared by Educationalstatus (Pre-R1) . . . 29
Table 9. Experimental and Control Subjects Compared by Length ofResidence in the Community (Pre-R1) 30
Table 10. Experimental and Control Subjects Compared by Home Owner-ship,Problems with the Home and Plans to Move (Pre-R1) . . . 31
Table U. Self-Rating of Health of Experimental and Control Subjects(Pre-R1) 31
Table 12. EXperimental and Control Subjects Compared on the Basisof IkTry About Health (Pre-R1) 32
Table 13. Experimental and Control Subjects Compared on the Basisof Recent Change in Health and Having Health Problems(Pre-R1) . 32
Table 14. EXperimental and Control Subjects Compared byOccupations (Pre-R1) , 33
Table 15. Experimental and Control Subjects Compared by TheirAttitudes Toward Their Jdbs (Pre-R1) 314
Table 16. Experimental and Control Populations Compared by TobalIncome (Pre-R1) . 3k
Table 17. Study Populations Compared on the Basis of OtherIncome (Pre-R1) 35
Table 18,,, Attitudes of Study Populations Taward Present and FutureIncome (Pre-al) 4 0000000000 0 35
Table 19. A Summary of Statistical Comparisons of Experimental andControl Subjects One Year After Retirement (R-1) 37
Table 20. Comparison of Experimental and Control Subjects on theBasis of Age (R-2) 11 37
Table 21. Comparison of Experimental and Control Subjects on theBasis of Marital Status (R-2) 38
Table 22. Experimental and Control Sdbjects Compared oa the Basisof Race (R-2) . 38
Table 23. Experimental and Control Sdbjects Compared on the Basis ofBirthplace and Language Spoken at Place of Blrth (R-2). . . 39
Table 24. Experimental and Control sdbjects Oompared by EducationalStatus (R-2) 39
Table 25. Experimental and Control Sdbjects Compared by Home Owner-ship, Prdblems With Home and Plans to Move (R-2) 0 40
Table 26. Experimental and Ccatrol Subjects Compared by HealthStatus (1-2) 41
Table 27. Experimental and Control Subjects Compared on the Basis
Table 28.of Total Retirement Income (R-2) *******Experimental and Control Subjects Compared by Adequacyof Retirement Income (R-2) . . .
iv
42
42

N
List of Table (conit.) Page
Table 29. Experimental and Control Subjects Compared by GainfulEmployment, Wbrry Over Money and Standard of Living (1-2) 111 43
Table 30. A Summary of Statistical Comparisons of Study Samples . . 44
Table 31. Information About the Battery of Indexes Used to MeasureGeneral and specific Aspects of Adjustment to Retirement 46
Table 32. Experimental and Control Subjects Compared on the Basisof Mean Scores on General Adjustment Measures 65
Table 33. Experimental and Control Subjects Compared on the Basis ofMean Scores on Self-Concept Measures 66
Experimental and Control Subjects Compared on the basis ofMean Scores on Attitude Toward Retirement Measures 67
Summary of Mean Score Differences on Eleven General Indexes . . 68
Experimental and Control Stibjects Compared on the Basis ofMean Scores on Health MeasuresExperimental and Control Subjects Compared on the Basis ofMean Scores on Financial MeasuresExperimental and Control SUbjects Compared on the Basis ofMean Scores on Family and Friends Measures 70Experimental and Control Subjects Compared on the Basis ofMean Scores on a Home and Community Measure. . . 71Experimental and Control Subjects Compared on the Basis ofMean Scores on Activity- Measures 72
Tests of Significance of the Differences in Mean ChangeScores on Eighteen Indexes Which Were Administered Duringthe Year Prior to Retirement, the Year After and Two YearsAfter Retirement
Table 34.
Table 35.Table 36.
Table 37.
Table 38.
Table 39.
Table 40.
Table 41.
Table 42,
Table 43,
Table 44.
Table 45.
Table 46.
Table 47.
Table 48.
Table 49.
Table 50.
Table 51.
. . 69
70
. 74Tests of Significance of the Differences in Mean Change Scoreson Eighteen Indexes Which Were Only Administered During theYear After Retirement and Again Two Years After Retirement . 75
A Summary of the Effects of the Preretirement EducationProgram on Various Sub-groups of SUbjects as Measured byMean Scores .
A Summary of Effects of the Preretirement Education Programon Various Sub-groups of Subjects as Measured by Mean Change
Scores . / 78
Husbandls Mean Decision Making Power One Year and Two Yearsafter Retirement 81
The Division of Labor between Husbands and Wives as Measuredby the Wife's Mean Task Performance Score Before Retirement,One Year and Two Years After Retirement. 83
. 77
Comparisons of Experimental and Control Groupsof Marital Status, Home Ownership and Plans toComparisons, of Experimental and Control Groupsof Health Status (R-1)Comparisons of Experimental and Control Groupsof Financial Status (1-1)Distribution of Pawer in Decision-Making Amongand Control Families One Year After RetirementDistribution of Power in Decision-Making Among Experimentaand Control Families Two Years After Retirement
on the BasisMove (R-1) 94on the Basis
95on the Basis
Experimental97
l98

List of Table (conft.)
Table 52. Division of Labor Between Husbands alid Wives Prior to
RetirementTable 53.
Table 54.
Table 55.
Table 56.
Table 57.
Table 58.
Table 59.
Table 60.
Table 61.
Table 62.
Table 63.
Table 64.
Table 65.
f , 99Division of Labor Between Husbands and Wives (ne YearAfter Retirement 100Division of Labor Between Husbands and Wives TAID Years
After Retirement 101Source Data From Which Z Values Were Computed on 18Indexes (Pre-R1 to R-1) 102Source Data from Which Z Values were Computed on 18Indexes (Pre-R1 to R-2) 102Source Data from Which Z Values were Computed on 36 IndexesWhich Were Administered One Year and Two Years AfterRetirementA comparison of the Effects of the Preretirement EducationProgram on White and Negro Subjects as Measured by MeanScoresA Comparison of the Effects of the Preretirement EducationProgram on Subjects Born in an English Speaking Countryand Stibjects Born in a Non-English Speaking Country asMeasured by Mean Scores 105A Comparison of the Effects of the Preretirement EducationProgram on Stibjects Who Were Married and SUbjects Who WereNot Married as Measured by Mean Scores 106A Comparison of the Effects of the Preretirement EducationProgram on Stibjects Who Completed Eight or More Grades andSubjects Who Completed Fewer Than Eight Grades in Schoolas MeasurediNriflean.S.cores 107A Comparison of the Effects of the Preretirement EducationProgram on SUbjects with $61000 or More Income and SUbjectswith Less than $6,000 Income as Measured by Mean ScoresA Comparison of the Effects of the Preretirement Education
108
Program on Subjebts Who Were Engaged in Skilled Jobs and.Subjects Who Were Engaged in Umskilledabs as Measured byMean ScoresA Comparison of the Effects of the Preretirement EducationProgram on White and Negro Subjects as Measured by MeanChange Scores. OOOOOOOO ... .110A Comparison of the Effects of the Preretirement EducationProgram on Stibjects Born in English Speaking Countries andSubjects Born in Non-English Speaking Countries as Measuredby Mean Change Scores 111
Table 66. A Comparison of the Effects of the Preretirement EducationProgram on Stibjects with $6,000 and More Income and SUbjectswith Less than $61000 Income as Measured by. Mean Change
Scores
vi
I. THE PROME1I
In a society which places primary value upon Gainful employment,
major chances are taking place uhich make it imperative that educators
accelerate efforts toward creative opportunities for adult learning. The
change uhich is documented better than most is the enforced retirement at
an ever younger age of an unprecedented number of older persons and their
committment to an important class o people for whom leisure rather than
work is the prevailing way of life.'
Presuma'ay, this is no problem if the older individual is prepared to
make wholesome use of his time in retirement. If, on the other hand, the
individual does not possess the requisite knowledge and skills for replacing
gainful employment with other valued activities, retirement will almost
surely create problems not only for the individual but also for the com-
munity in uhich he lives.
Hore specifically, the transition from a work tR a leisure way of
life is almost always accompanied by reduced income.4 Uhether or not the
individual successfully copes with this situation depends on many factors
not the least of which are the extent to which he is fully informed about
his financial situation and the extent to uhich he possesses skills for
managing his retirement income effectively. Individual initiative
although a prerequisite in financial matters, cannot replace broader
social mechanisms which society must create to reduce poverty and eco-
nomic stringency in old age.
An abundance of leisure and reduced income are further aggravated
by the fact that retirement in our modern industrial society brings with
it a marked loss of status and the implication that once a man is no
longer a productive member of society he becomes a second-rate citizen
of whom very little is expected.3 There is evidence that this impli-
cation is rejected by a growing number of older people. As a matter of
fact, one of the most important developments during the past decade has
been the tendency of older people to band together in organizations to
reinforce their demands for the economic, social and psychological means
by utich indivj.duals may make satisfactory adaptations to retirement.
The social implications of this trend aro clear. Our educational
institutions have the opportunity to enter into a unique partnership with
older people for purposes of helping them obtain information, develop
skills and create acceptable retirement roles.
Still other difficulties confront the individual who is retiring
from a lifetime of work. Retirement inevitably disrupts well established
patterns of daily living. Opportunities for satisfying social relation-ships uill eventually undergo change; and, with increasing age, there is
almost surely to be a gradual decline in health and energy reserve.4
1

The problems of aginc are most often chought of in terms of the olderman who retiree from uork. However, tne acinc woman faces critical periodsof adjustment when her family is raised, when her husband stops uork oruhen, as is so often the case, she becomes vidaued. Uhen the family israised and the last child has left home the uomen is confronted in manyrespects uith the same situation which will confront her husband somewhatlater. She must relinquish her major adult role and replace it with othersatisfactory activities. Uhen the husband retires and is in the homeall day instead of at uork, the uife is confronted with the necessity ofreorganizing long-standing habits of daily activity. Uidouhood createsa new set of problems: the need to take responsibility for financialaffairs, to realign social relationships, and to make different livincarrangements.
The responsibility of educators for equipping older men and womenfor adapting to the situational changes brought about by acing andretirement is clear cut. Not so well understood is the importance ofeducating the individual to understand the internal physiological processeswhich accompany acinc. Fortunately, educators nau have an entirely nauappraisal of the psycholocical and physiological processes of aging uponuhich to base a positive educational program about aging and retirement:
1. There is potential for personal growth throughout most ofthe life span.
2. It is possible to retard many of the psycho-physiological, ,
processes of acing.
3.- The physical and mental changes which'accompany aging occur
gradually and they.need not became a serious impairment untiladvanced old ace.
4. The health sciences have extended life expectancy and theyare making it possible to live the added years in relativelyGood health.
Some observers view retirement as a waste of human resources and adenial of basic satisfactions which come from doing useful work. Otherssee retirement as a valuable achievement of modern industrial,s9ciekyAUbatever their point of vieu toward retirement most observer0J0,7.0),Yagree on one thing: older people are often poorly prepared to makeuholesome, satisfying use of the superabundance of time which retirementsuddenl:y puts at their disposal.. Students of retirement also acree onthe difficulties which many people have livinc on a reduced income,handling the changes 'which occur in family relationships, accepting lessstatusl'counteracting the tendency toward a restricted lire space, andtaking up residence eventually in a new and different environment.
Thelleed for Preretirament Education
Hence, there is urgent need for preretirement education desicnedto help older people understand the aging process, to impart knowledge and

777-7_ 77:7
problem solving skills that will enable older people to maintain better
health, foster contacts with other people, use their time meaningfully,
manage-their financial resources effectively, to promote good family
living, encourage citizenship, encourage a positive attitude toward aging
and retirement, to present a variety of solutions to practical problems
of living, to encourage older people to select and try those solutions
which appeal to them most, and to explore new roles for the later years.
At the same time as preretirement education helps the older irlividual
make better adjustment to aging and retirement it must share responsibility
for encouraging social change by involving key leaders and by making known
resources needed by older people in the community. In fact, educators
could perform a disservice were they to fail to encourage opportunity in
the community for older people to practice what they have learned or
decided upon in preretirement education programs.
Origins and Status of Preretirement Education
Preretirement programs have been designated in various ways: pre-
paration for retirement, preretirement counseling, preretirement education,
and retirement planning. Nhatever their designation they have utilized
for the most part one of two approaches: the individual approach by
which the employee and occasionally his spouse are invited to talk over
with the employer or his representative such things as terminal pay,
pension benefits or various forms of insurance; and the group approach by
which a number of employees are brought together at one time to participate
in retirement planning discussions.
Very little is known about the origins of the individual type ofprogram except that early surveys indicate that many companies alreadyhad well established programs prior to 1950, and that these efforts wereoften related to the development of a pension program.
The origins of the group type of preretirement planning program, onthe other hand, can be traced to the pioneering work of two Americanuniversities: The University of Chicago and The University of Michigan.At The University of Chicago, where work was begun in 1951, the programdrew heavily on the research findings of a number of social scientists atthe University who were engaged in some of the first studies of theproblems and adjustments of older people. 10, 11 212
At present the Industrial Relations Center of The University of
Chicago has a well developed program titled "Making the Most of Maturity"which it offers to industries throughout the country, 13/14 and it trains
personnel men and others as discussion leaders for programs. The Uni-versity's Union Research and Education Projects unit also has developed
a program titled "Lo9king Ahead to Retirement" which it offers primarily to
labor organizationsl); it has served effectively as a ccmsultant to laborunion groups in the development of materials, and it has a training
program for discussion leaders.
The University of Michigan conducted it9 first educational programfor older people during the spring of 1948.10 Although it was not called
3

. ,777771,77,7,74,177)!7, .;. Tf
preretirement education, it was concerned with and titled "Problems andAdjustments in Later Maturity and Old Age" and was essentia4y designedto assist persons to adapt to the socio-psychological changes concomitantwith aging and retirement. This program, like those at The University of-Chicago, was based on earlier studies of the needs and problems of adjust-ment of older people and was conducted by Clark Tibbitts. Later the programwas adapted for use with hourly-rated workers.17 Other programs-were addedincludiw a liberal education type discussion program for middle-agedpeople1° and programs to train union, industrial and other personnel asdiscussion leaders for preretirement programs.19Y 20
These first attempts at two American universities to develop edu-cational programs for those on the verge of retirement were based for themnst part on the premise that people, as they grau older, face certaincrises or problems, and that a fuller understanding of these problemsituations should result in better adjustment during the later years.The emphasis on the problems of older people, or as Breen21 puts it, thedysfunctional aspects of retirement, is no accident. Studies reportedat about the same time as the first preretirement programs were makingtheir appearance reveal a wide range-of old age problems--reduced income,decreasing physical vigor and health, inadequate housing, a vast increasein leisure time, social isolation, and a lack of opportunity in a societywilich places a low premium on the older individual. Max Kaplan 22 believesthat the situations of older people have not changed much, and that "byfar the larger share of attention has to do with issues of health,economic welfare, housing and other social and medical aspects."
Pioneering programs at The Universities of Michigan and Chicagogave impetus to the development of programs at other American universitiesincluding Cornell University, Prudue University, University of Connecticut,University of Florida, St. Louis University, and California Institute ofTechnology. PUblic school adult education departments, government depart-ments, libraries, MA's and churches, as well as an increasing number ofindustries throughout the United States, are following the lead of theuniversity groups. A few of the larger labor organizations such as theUAW (AFL-CIO); the International Association of Machinists; the UnitedSteelworkers; the Community Services Department, AFL-CIO; the UpholsterersInternational Union; and District 65 of the Retail, Wholesale andDepartment Store Union, AFL-CIO, established programs for their membersat the local union level. In'a few instances labor and management havejoined forces in order to develop and sponsor retirement educationprograms.19
Number and Characteristics of Programs
A number of surveys of preretirement education have been made duringthe past two decades: Equitable Life Assurance Society, 1950; Tuckmanand Lorge, 1952; Edwin Shields Hewitt and Associates, 1952; Baker, 1952;B. K.-Davis Advertising Service, 1953; National Industrial ConferenceBoard, 1955; the Welfare Federation of Cleveland, 1957; Perraw, 1957;Reich, 1958; the National Council on the Aging, 1958; the Philadelphia
-
11
-
Health and Welfare Council, 1958; Walker, 1958; Mack, 1959; Naef, 1960;
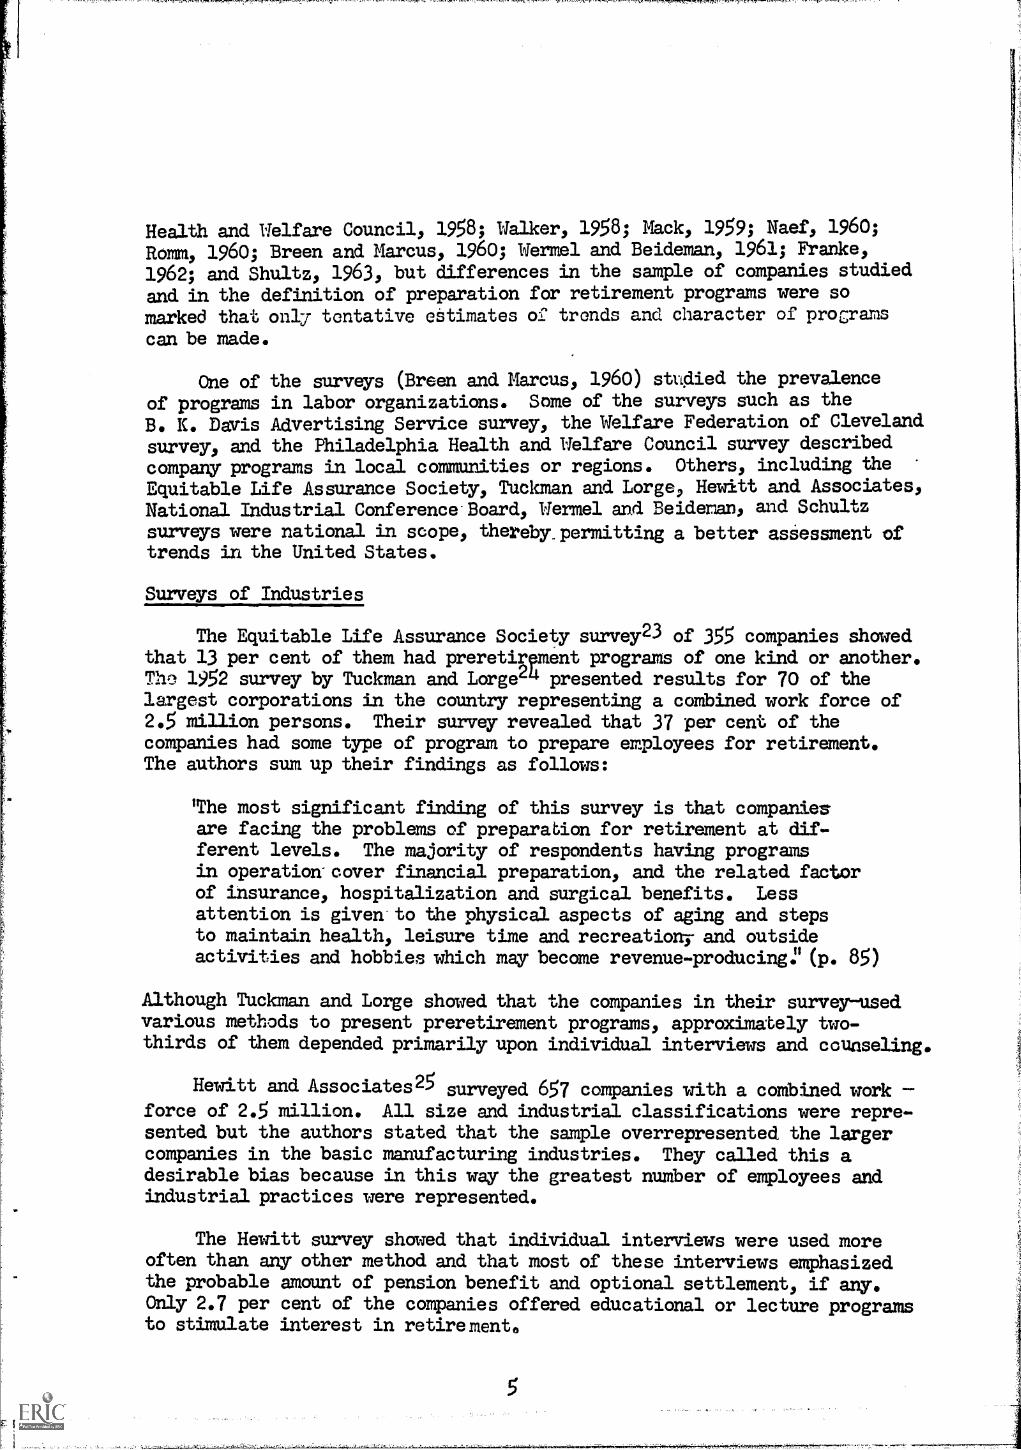
Romm, 1960; Breen and Marcus, 1960; Wermel and Beideman, 1961; Franke,1962; and Shultz, 1963, but differences in the sample of companies studiedand in the definition of preparation for retirement programs were somarked that only tentative estimates of trends and character of procrams
can be made.
One of the surveys (Breen and Marcus, 1960) studied the prevalence
of programs in labor organizations. Some of the surveys such as the
B. K. Davis Advertising Service survey, the Welfare Federation of Cleveland
survey, and the Philadelphia Health and Welfare Council survey described
company programs in local communities or regions. Others, including the
Equitable Life Assurance Society, Tuckman and Lorge, Hewitt and Associates,National Industrial Conference Board, Wermel and Beidenan, and Schultz
surveys were national in scope, thereby.permitting a better asSessment oftrends in the United States.
Surveys of Industries
The Equitable Life Assurance Society survey23 of 355 companies showedthat 13 per cent of them had preretirement programs of one kind or another.The 1952 survey by Tuckman and Lorge24 presented results for 70 of thelargest corporations in the country representing a combined work force of2.5 million persons. Their survey revealed that 37 per cent of thecompanies had some type of program to prepare employees for retirement.The authors sunup their findings as follows:
'The most significant finding of this survey is that companiesare facing the problems of preparabion for retirement at dif-ferent levels. The majority of respondents having programsin operation-cover financial preparation, and the related factorof insurance, hospitalization and surgical benefits. Lessattention is given to the physical aspects of aging and stepsto maintain health, leisure time and recreation; and outsideactivities and hobbies which may become revenue-producing:1(p. 85)
Although Tuckman and Lorge showed that the companies in their survey-usedvarious methods to present preretirement programs, approximately two-thirds of them depended primarily upon individual interviews and counseling.
Hewitt and Associates25 surveyed 657 companies with a combined workforce of 2.5 million. All size and industrial classifications were repre-sented but the authors stated that the sample overrepresented the largercompanies in the basic manufacturing industries. They called this adesirable bias because in this way the greatest number of employees andindustrial practices mere represented.
The Hewitt survey showed that individual interviews were used moreoften than any other method and that most of these interviews emphasizedthe probable amount of pension benefit and optional settlement, if any.Only 2.7 per cent of the companies offered educational or lecture programsto stimulate interest in retirement*
5

One of the larger surveys of preretirement eduotion was the one made
in 1954 by the National Industrial Conference Board' which studied 327
companies with 4.1 million employees. In answer to the question, "Does
your company have any kind of preretlrement counseling?" 214 (65,4 per
cent) replied in the affirmative. Larger companies were moro likely
to have preretirement counseling than smaller companies because in this
as in the two previous surveys individual counseling dealt for the most-
part with pension benefits, and the larger companies were more likely to
have pension programs.
'Whereas in the previous surveys the definition of a preretirement-
program was left to the respondent, or a single definit4In such as pre-retirement counseling was employed, Wermel and Beidemancl stated explicitly
in their survey of 161 firms (6.0 million employees) that preretirementplanning programs-consisted of activities beyond those of administering apension or profit-sharing program and in so doing placed emphasis upon
content rather than on method. This survey like the Tuckman.and Lorge
and the Hewitt and Associates surveys purposely overemphasized the large
manufacturing industries.
Results presented in the Nermel and Beideman survey are based on 161
firms which returned questionnairms. Of these 40 per cent reported having
a preretirement program. Further, the authors state:
By far the greatest number of companies reported as offeringretirement planning programs to their employees relied pri-
marily upon personal interviews. In 107 of the 161 surveyedfirms with programs, analysis of the responses indicated thatindividual counseling or discussion interviews formed thechief method. . . (p. 75)
For the first time in surveys of preretiremmt..programs, however,one sees evidence that individual counseling had been broadened out tocover more than a discussion of pensions. Nermel and Beideman reportedthat in the case of 107 companies with individual counseling programs84 of them scheduled sessions formally and included a broad coverage oftopics which were developed in advance of the interview. Only 41 orabout one-fourth of the companies reported that their programs were basedon the group counseling method.
One of the morearecent surveys of company preretirement programs,conducted by Franke2°, is also one of the most trenchant assessments ofpreretirement education. He identified 43 firms around the countrywhich were reported as having had preretirement programs for a number ofyears. Franke, like the other authors, found that the most commonapproach to preretirement planning was through individual interview orcounseling with wide variation in the subject matter covered.
One of the special values of Franke's survey is its analysis ofcompany attitudes toward the program and the essential requirements ofa preretirement program. The companies in his survey named method moreoften than any other factor as the most essential requirement of a
6

successful preretirement program. His discussion of criteria for the futuredevelopment of retirement preparation is an outstanding contribution to the
field.
In one of the more recent studies of preretirement programs in indus-_
trial settings Shultz° found that 1) plants without pension programsrarely, if ever, have preretirement programs, 2) programs are much morelikely to be established in large than in small industries (programsrarely occur in plants of less than 500 employees), and 3) programsoccur somewhat more frequently in plants with a compulsory retirementage and in non-union plants.
As in previous surveys of preretirement programs in industry Shultzfound that personal counseling was used more commonly than any othermethod for conducting the programs. Approximately half of the programsconsisted of only one, two, or, at the most three individual counselinginterviews. In this connection Shultz observes: "When one considersthe drastic changes in income, interests, activities, motivation, andpersonal relationships which usually accompany retirement one cannotbut have questions concerning the effectiveness of many of these programsto help employees comprehend the problems and opportunities which willbe theirs."
On the basis of these surveys of company programs the followingtentative conclusions can be reached about trends in preretirementeducation:
1. The development of preretiremsat programs is a recent onewhich parallels closely the growth of pension programsfollowing World War II. Larger industries tend more thansmaller ones to offer the service.
2. There appears to have been an increase in the number ofprograms during the past decade, especially in the numberof individual type programs, but the magnitude of theincrease is difficult to determine. On the other hand,awareness of the program and interest in exploring itspossibilities are fairly widespread. There appears to beilore interest on the part of companies than labor unions.
Whereas many companies deal with the individual in retire-ment matters, there are probably in the United States fewerthan 50 company-sponsored gruup discussion type programsin which a wide range of topics are discussed.
3. Current programs exhibit extreme variability in contentand methods. The individual approach predominates. Some
programs consist of merely a single interview with anemployee; some consist of several interviews; othersconsist of weekly group discussion sessions for as manyas ten or twelve weeks. Emphasis is most frequently

Tr',4,44,74747. 1 :^
placed on financial matters. There appears to be a trend,
however, in both individual and group programs toward including
other topics for discussion.
4. There is little, if any, effort to control the quality of
programs or to evaluate results. Companies tend to prefer
to utilize their own staff including personnel officers,
pension experts, or an industrial relations official to conduct
the interviews or lead the discussions and few of them have
developed any system for evaluating the effectiveness of their
programs. Franke (1963, p.38) suggests this is probably due
to the fact that most companies do not view a preparation for
retirement program as a major element in the management of'
the company.
S. Evidence of community involvement in company-sponsored programs
is very meager.29 The fact has already been noted that most
companies are concerned with discussing pension benefits with
the employee rather than such topics as opportunities in the
community for the effective use of leisure time or resourcesin the community to which the retired employee can turn for
help. In the group discussion programs, however, these topics
are more likely to be discussed and the company is more likely
to request the assistance of staff people from Social Security
and State Employment Service, public libraries and localrecreation, adult education, and health departments toconduct the program. Under these circumstances one mightexpect considerably more orientation toward the community.
Preretirement Education in Labor Unions
Breen and Marcus30
have made the only comprehensive survey of pre-retirement programs in labor unions. Their objective was to obtaininformation about existing programs and the Atitudes toward preretire-ment programs on the part of labor officials thiroughout the country.A questionnaire was mailed to all national and international laborunions and to a randomly selected sample of local unions throughout thecountry. Some of the respondents were followed up with personal interviews.
Questionnaires were mailed to 796 unions. Twenty-two per cent (173)
of these responded. Only four unions, two nationals and two locals,reported that they were doing anything in the field of preretirementeducation. Accordingly, much of the analysis deals ulth those unionswhich do not have programs. Some of the conclusions reached are:
1. Relatively few unions had plans to initiate programs duringthe twelve months following the survey.
2. It was apparent that almost 85 per cent of the respondentsknew virtually nothing about existing union programs, butthat nationals uere more aware of other unions' activitiesin the field than were locals.

3. Uhen asked who should conduct the program respondents were
equally divided between unions and universities.
I. The largest proportion of unions thought a program should
be offered during the year on off hours.
5. There appeared to be no significant relationship between
respondents' attitudes toward preretirement education and
size of the city in which union was located, regional
location of the union, and size of union.
Breen and Marcus30
sum up their survey by saying:
!Rather than be discouraged by the lack of information, the dearth
of existing prograns, or the seeming disinterest in this area as
a service of union concern, it is more accurate to describe the
present state of union awareness of the problems of older workers
as reflective of the uhole soaety. For many unions concern
with preretirement education is premature. A union without an
adequate comprehensive pension program will naturally place a
priority on this benefit Preretirement education is in its
infancy; in time it will become an integral part of the labor
union movement in the United States, compatible with the gials,
principles and other multiple functions of trade unioniamP tp. 46)
Somewhat later than Breen's study the United Auto Workers Inter-
national Union placed the issue of preretirement education on the barcaining
table, but eventually ulthdreu it in favor of other bargaining issues.
Cther Sponsorship
A review of programs sponsored by companies and labor unions fails
to reflect the growth of programs which are being sponsored by uni-
versities and colleges, public schools, libraries, the various branches
of the military eervice, governmental agencies at both the federal and
state levels, YNI-YWCA's and church organizations. Information about
the extent to uhich these types of organizations are developing pre-paration for retirement programs-is not available on a nationwide
basis. It would appear, however, that the growth of programs under
same of these types of sponsorship may be equal to or even greater than
it is under company and union sponsorship.
Preretirement Education in European Countries
A survey made by the author of preretirement education in countries
of Western Europe revealed very little awareness of the program in most
countries on the continent but a well developed prrretirement education
program in England and Scotland.31 In England there is a Preparation
for Retirement Committee of the National Old Peoples' Welfare Council
which is a central clearing house of information and a source of much
program stimulation, and in some communities there are local counterparts
9

of the national committee called Retirement Councils. Unlike the Americanprogram the program in Great Britain is supported for the most part withpublic funds and adult education is the primary sponsor of the program.The program in Great Britain was also found to be more comprehensive thanthe American program especially in the presentation of ways to use leisuretime. British programs were most likely to be offered on company time;the lecture approach was used more often than any other and wives werenot encouraged to participate in programs with their husbards.
Preretirement Education Research
Despite an impressive growth in the number and kinds of preretirementeducation activities during the past two decades, not much is known aboubtheir effectiveness. The surveys described in the previous section indi-cated that there was little, if any, effort to evalute results of programsand only three reports could be found in which a systematic attempt wasmade to study effects of participation in programs.320304
Mack32 evaluated the effectiveness of preretirement educationprograms by combining data from 281 subjects who participated in 16different programs in the Chicago area. The subjects ranged in age from55 to 82 years with a majority of the subjects between the ages of 60and 65. They represented various occupational levels, but the authorstates that skilled and white-collared levels were over represented.Each subject filled out a "Retirement Planning Inventory" at the firstand the final sessions of the program. Statistical tests were appliedto the differences between the percentages-of favorable responses toeach statement of the inventory on the pre-test and those of the post-test situations. Mack concluded that the program reduced fear andincreased positive attitudes toward retirement, increased constructiveplanning for retirement, and effected desirable behavior changes inretirement preparation.
At the request of the Niagara Fals Board of Education, the author33conducted a program with a mixed group of 73 hourly-rated and salariedemployees who ranged in age from 60 to 65 years. These subjects wereemployed by three Niagara Falls industries, two of which manufacturedchemical products and the other, different kinds of business forms.Before and after data were obtained in order to study change in 1)retirement attitudes, 2) retirement planning information, 3) plans farretirement, and 4) plans put into action. It was concluded that sig-nificant changes took place in each area investigated except that ofretiremeht attitudes.
Burgess34 reported results of a research project which comparedchanges in-attitudes and behavior among 200 subjects who participatedover a two-year period in a series of preretirement discussion programsas against changes in attitudes and behavior among subjects with noexposure to a program. The highest gains resulting from the program werein retirement planning, financial planning, retirement anticipation, andretirement living. Burgess concluded that there is little doubt that
10

successful adjustments in these four areas are practical oonditions to a
satisfactory retirement. As in the previous two studies gains did not
appear in retirement attitudes. Burgess report is part of a generalstatement describing the University of Chicago "Making the Most ofMaturity" retirement planning program rather than a detailed researchreport. Nevertheless, it appears that his study was the first in whicha control group was used in preretirement education research.
The finding which was common to the three studies is that it wasmuch more difficult to bring about improvement in retirement attitudesand mental outlook than in retirement information, planning and pre-paratory behavior, but this has generally been the case in attempts tochange peoples' attitudes.
These studies represent the total of research directed to thedbjective evaluation of the effectiveness of preretirement education.The stwdent of preretirement education will be interested, however, ina growing number of articles which present the opinions of practitionersand otherd interest in various aspects of retirement. All but one ofthe articles, that by C. Perrow, claim one or more kinds of benefitsfrom preretirement education.(see references 30 through 47).
Limitations of Previous Research
The research studies cited above showed some dbvious shortcomings.Only one of them used a control-group. The three studies were concernedi.with immediate rather than long-term effects. In two of the studi802134salaried employees predominated. Hence, there remains considerablequestion about the effectiveness of preretirement education with manualor hourly-rated workers. Finally, it is not clear to what extentleadership, materials and methods were standardized for each of the pre-retirement education programs. Neither was information supplied toindicate attempts to tailor-make materials or methods for special groupsof older people including those who are foreign born and cannot read orWrit9 English with ease. In this respect, Burgess and his associatesin their study of occupational differences in attitudes toward agingand retirement concluded that different kinds of preretirement materialsare required for at least two occupational levels: one kind for higherlevel supgrvisory and executive personnel and anothwfor manual or hourlyworkers.4°
Frame of Reference for the Study
Theoretical treatment of preretirement education has been exceedinglymeager, if not altogether lacking, but from reviewing preretirement edu-cation literature it may be implied that good adjustment in retirementis predicated upon role substitution and the maintenance of activity duringthe later years. The reasoning behind this assumption is something asfollows.
Retirement is a by-product of technological advances which givesevery evidence of having become an established facet of American life.
11

In spite of major efforts to make possible the continuing employment of
workers for as long as they are physically able and want to engage in
productive work, the trend for the past several decades has been a stead/
decrease in the proportion of older workers employed. Mith the continued
application of technology, there appears little or no likelihood that the
trend will be reversed, and there is some good evidence that the age of
normal retirement will be revised still bother downward.
One outcome of this trend is that 3n increasing nuMber of persons
are being forced from membership in the productive economy to the status
of consumer. The transition from worker with a potentially expandingincome to consumer on a fixed and frequently reduced income represents
a period of critical adjustment for most people. Studies also show that
the transition from a working to a nonsvorking way bf life is furtheraggravated by a-loss of status, a vast increase in leisure time, the disimruption of well-establialedpatterns of daily living, and restricticesin social life space.
Role Theory
Stated in these terms, retirement is viewyd largely in terms ofrole theory from which may be derived the hypothesis that satisfactoryadjustment in retirement will depend on the extent to via& the indi.vidual is able to replace the work role with other roles which he andsociety find acceptable. Thus, it can be argued that preretirementeducation is concerned, among other thimak with helping. the Saidlivisinalto understand role changes, to assess his potential for asiumtng difrferent roles, and to anticipate specific ways by whi9h preferred rolescan be learned and substituted. A stuctr by Thompson49 makes it evident,to use his words, that "adjustment to a new status, including thecreation of a correlative role, is facilitated and success made moreprobable if one holds an accurate anticipatory 'cognitive map.' Knowingwhat to expect, the retiree can more quickly and more successfullyprogram a pattern of living which he can satistactoily accept." (p. 42)
Implicit in all of this is the assumption as people grow older andretire that they desire or that it is beneficial to change and expandtheir role activity rather than to be relegated to what Ernest Burgesscalled the "roleless role" of the retired. In other words, the moreactive a person is after he retires, the happier and better adjustedhe will be. Accordingly, in preretiremont education programs older - /people have been urged to develop new interests, make new social con-tacts, seek out ways of relating themselves to other people and to thecommunity in which they live, develop a forward looking orientation tolife, and stay mentally alert and. N.iysically active.
Disengagement Theory
More recently the student of preretirement education has beenconfronted with a somewhat different conceptualization of the agingprocess and adjustment to retirement, namely, the disengagement theory
12
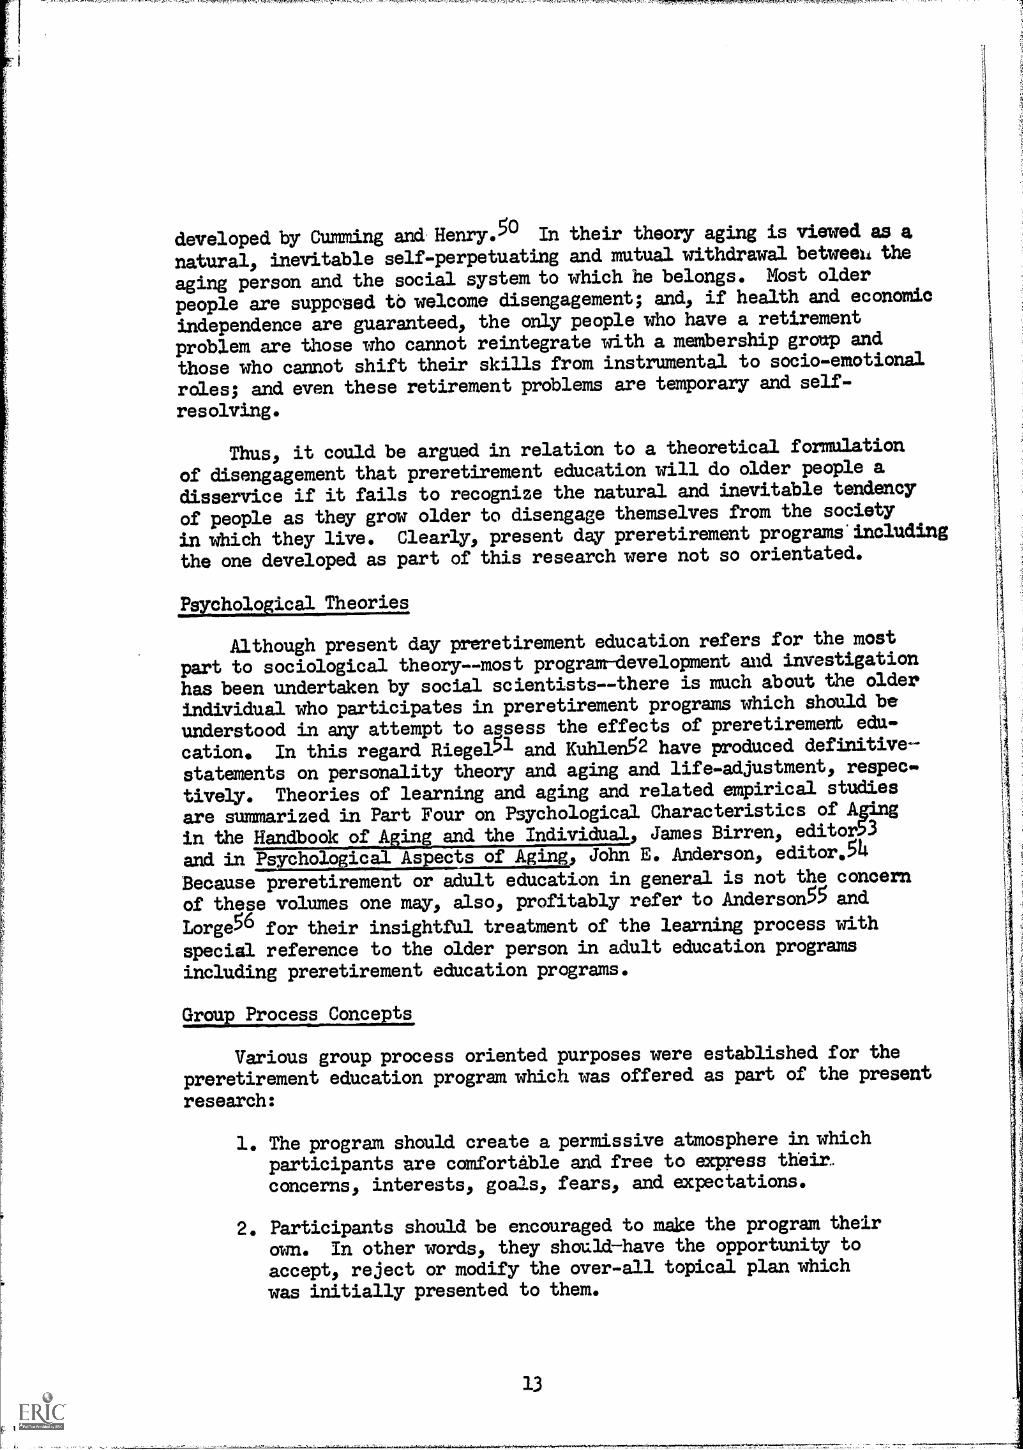
developed by Cumming and Henry.5° In their theory aging is viewed as a
natural, inevitable self-perpetuating and mutual withdrawal betweeu the
aging person and the social system to which he belongs. Most older
people are supposed tO welcome disengagement; and, if health and economic
independence are guaranteed, the only people who have a retirement
problem are those who cannot reintegrate with a membership group and
those who cannot shift their skills from instrumental to socio-emotional
roles; and even these retirement problems are temporary and self-
resolving.
Thus, it could be argued in relation to a theoretical formulation
of disengagement that preretirement education will do older people a
disservice if it fails to recognize the natural and inevitable tendency
of people as they grow older to disengage themselves from the society
in which they live. Clearly, present day preretirement programs'including
the one developed as part of this research were not so orientated.
Psychological Theories
Although present day preretirement education refers for the most
part to sociological theory--most program-development and investigation
has been undertaken by social scientists--there is much about the older
individual who participates in preretirement programs which should be
understood in any attempt to assess the effects of preretirement edu-
cation. In this regard Riege151 and Kuhlen52 have produced definitive-
statements on personality theory and aging and life-adjustment, respec.
tively. Theories of learning and aging and related empirical studies
are summarized in Part Four on Psychological Characteristics of Aging
in the Handbook of Agag and the Individual, James Birren, editor 3
and in psychologicang, John E. Anderson, editor.%
Because preretirement or adult education in general is not the concern
of these volumes one may, also, profitably refer to Anderson55 and
Lorge56 for their insightful treatment of the learning process with
special reference to the older person in adult education programs
including preretirement education programs.
Group Process Concepts
Various group process oriented purposes were established for the
preretirement education program which was offered as part of the present
research:
1. The program should create a permissive atmosphere in which
participants are comfortable and free to express their
concerns, interests, goals, fears, and expectations.
2. Participants should be encouraged to make the program their
own. In other words, they should-have the opportunity to
accept, reject or modify the over-all topical plan which
was initially presented to them.

3. Husbands and wives should be encouraged to share their viewsof retirement and to make joint decisions about the future.
4. Members of the group should be encouraged to recognize thatthe problems of aging are fairly common, and that a good manypeople share fears and concerns about retirement.
S. The.program should provide opportunity for people to inter-change ideas and experiences.
6. Misinformation and misconceptions about aging and retirementshould be vigorously challenged.
7. Ample opportunity should be provided for meMbers'to acquirecomplete, accurate, up-to-date information about a varietyof retirement situations. For example, it was decidedthat members of the preretirement groups should obtainaccurate information about the amount of inoome from allsources they would have to live on in retirement.
8. The program should expose participants to the gamut ofretirement problems and situations which has been foundamong older people in the United States.
9. Members should be made aware of different solutions toretirement problems and encouraged to select one or moresolutions which seem to be appropriate as a basis fordeveloping plans of action.
10. Members should be encouraged to put their decisions aboutthe future into effect.
11. Participants should be given problem-solving experiences inthe group.
12. The program should stimulate continued learning, planningand decision-making between sessions and following com-pletion of the program.
13. Finally, the program should present a positive view ofretirement and encourage participants to develop orreinforce an anticipatory attitude toward retirement.
It was presumed that discussion in a group setting was the mosteffective method for achievim many of the above goals. In this regardBond157 Hill.58 and McKeachieY have reviewed the important studies ofthe past decade which compared the discussion method with the lectureand other methods. Although these reviewers show that the results ofmost of the studies were consistent with our presumption of the greatereffectiveness of the discussion method, it should be noted that theevidence was not overwhelmingly in favor of one method or anothere
114

Perhaps of even greater import is the fact that none of these studies were
conducted wlth older adults as subjects or in adult education settings.
Problems in Conceptualization
Although common sense appears to support many of the currant theo-
retical formulations, investigators of preretirement education are plagued
by pressing issues. In the absence of clear-cut cultural definitions of
roles for the later years, how is it possible to help older people acquire
a "cognitive map" of the road ahead? What is the evidence that activity
enhances adjustment during the later year6?
With respect to cultural prescriptions for roles in retirement
Donahue et OP() dbserved that issues arise because the institutionali-
zation of retirement has created role changes which as yet have not been
assimilated into the normative structure of society. Thus, they maintainthat the role transition to retirement is one involving a large degree of
ambiguity and uncertainty. This means that the establishment of criteriafor preretirement planning programs is likely to be difficult. Even so,
the position was taken that preretirement education could become animportant setting in which to encourage older people to discuss social
roles and to visualize ways by which they could be practiced.
Related also to the situation as Donahue et al described it isthe thorny problem of what is meant by adjustment during the lateryears. A valid definition of adjustment in retirement is of primaryimportance because in the long run, unless one can define adjustmentand is able to apply valid measures to reveal either the presence orabsence of adjustment, he is in the disadvantaged position of studying
the effects of a program without acceptable meanp with which to do .so.This was the issue, in effect, which Cavan et al°1 had in mind when they
postulated that their adjustment inventory had immense practical valuein measuring the effects of many kinds of programs for older people.
The validity of this and other adjustment indexes such as moralescales and self-image scales, moreover, are being subjected to seriouscriticism. For example, Rosow62 questioned their validity on the basisthat each of them regards adjustment as a state or condition at a pointin time. He maintains that adjustment is also a process and that "theonly way to evaluate conditions in later life is to comare them withsome earlier patterns. These are-value-free criteria, the best availableobjective standards for interpreting stability and change. It alsofollows that in the dbsence of significant cultural or group norms, theindividnal himself must be taken as the source of standards." (p. 25)
What does this mean for research in preretirement education? Ifthe fact is accepted that most basic research in this field will inevi-tably come to grips with the question of adjustment, and haw to measureit, then careful attention is required to the instruments which areemployed. This much is required even though research needs of themoment force a selection from what is now available. In addition,
15

Rosow's penetrating analyses of the situation with special reference toa time perspective prompts serious consideration of the use of intensiveinterviews, life history data on a longitudinal basis and in the interestsof economy, the use of retrospective data.
Summary
In sum, the content of the educational program which participantsin this research were asked to accept or modify in the light of theirown need and concerns was conditioned initially by findings of a numberof creditable studies which concluded that as people grow older they arelikely to be confronted with certain crises, changes, problems, or tasksof everydgy living which must be resolved if retirement is going to bea satisfying period of one's life. Accordingly, the program was designednot only to make participants aware of the gamut of retirement con-tingencies, but also to provide them with as much information as possibleabout each contingency.
Having encouraged participants to come to grips ahead of time withthe reality of retirement, the basic premise underlying the program wasthat each participant would benefit from exploring various substitutesfor the work role including roles uithin such institutional settings asthe church, school, union, social club, citizenship roles, communityservice roles, and others. To facilitate the acquisition of substituterole; workers-in the program discussed the possibility of cultivating-new interests, making new friends, helping other people, taking partin public election6; becoming involved'in the social issuesvithin .
their neighborhood and community, anciso forth: Continuation of thework role after iietirement, at least on a part-time basis, was ofinterest to a few older people; and, accordingly there was the oppor-tunity to discuss job opportunities and techniques for finding employment.
References
1. Donahue, Vilma, Hunter, W.W.-,-Coons, Dorothy H., and Maurice, Helen K.(eds.). 1958. Free time--challenge to later maturity. Ann Arbor:'Univétsity of Michigan Press.
2. Corson, J. J., and McConnell, J. W. 1956. Economic needs of olderpeople. New York: Twentieth Century Fund.
3. Friedmann, E. A., and Havighurst, R. J. 1954. The meaning of morkand retirement. Chicago: University of Chicago Press.
4. Coll ins, S. D. 19550 A review of illness from chronic disease andits variations with age,- sex, and season, with some trends.J. Chronic Dis., 1, 412-41.
5. Donahue, Wilma (ed.). 1955. Education for later maturity. New York:Whiteside, Inc., and William Morrow & Co.
16

6. Hunter, W. W. 1960. Preretirement education. Geriatrics, 21, 793-800.
7. Groombridge, B. 1960. Education and retirement. London and Exeter:
William Chudley ez Son Ltd.
8. Shultz, E. B. 1963. A study of preparation for retirement in industry.
Ithaca, New York: Cornell University, New York State School of
Industrial and Labor Relations. (Mimeographed)
9. Odell, C. 1959. Employment and preretirement problems-of the older
workers, Part III: Retirement preparation education--an ounce of
prevention. Geriatrics, 14, 591-94.
10. Cavan, Ruth S., Burgess, E. W., Havighurst, R. J.5- and Goldhamer, H.
1949. Personal adjustment in old age, pp. 143-48. Chicago:
Science Research Associates, Inc..
11. Havighurst, R. J., and Albrecht, Ruth. 1953. Older people. New York:
Longmans, Green & Co.
12. Friedmann, E. A., and Havighurst, R. J. 1954. The meaning of work and
retirement. Chicago: University of Chicago Press.
13. Burns, R. K. 1960. Meeting the challenge of retirement. Chicago:
Industrial Relations Center, University of Chicago.
14. Burgess, E. Er. 1960. A case study of a retirement preparation program.
("Guideposts to effective action in aging. Case study No. 5:The Chicago retirement planning and preparation program.")
15. . 1959 Looking ahead to retirement--a retirement education
program--discussion guide. Chicago: University of Chicago,
Union Research and Education Projects.
16. Tibbitts, C. 1948. Aging and living, a report of the first courseoffered to assist people in making adjustments to old age. Adult
Education Bull., 12, 204.
17. Hunter, W. W. 1956. A study of methods for developing a pre-retirement
conditioning program for use by the Upholsterers: International
Union locals. (Paper read at the First Pan-American Congress of
Gerontology, Mexico City.) Ann Arbor: The University of Michigan
Division of Gerontology. (Mimeographed)
18. Tibbitts, C., and Donahue, alma. 1960. Aging in todayls society.
New York: Prentice-Hall.
19. Hunter, U. W.education.Gerontologr.
20. Hunter, W. Er.
1965. Cooperation between industry and labor in retirement
Ann Arbor: The University of Michigan, Division of
(Mimeographed)
1960. Pre-retirement education. Geriatrics, 15, 793-800.
17

21. araieen, L. Z. 1962.. Retirement: norms, behavior and functional aspects.
In R. 1-17. Williams, Wilma Donahuel.and-6. Tibbitts (eds.), Psycho-
logical and social:processes of aging--an international seminar.
New York: Columbia University Press.
22. Kaplan, H. 1961. Toward a theory of leisure for social gerontology.
In R. Kleemeier (ed.), Aging and leisure, pp. 389-412. New York:
Oxford University Press.
23. Equitable Life Assurance Society. 1950. Survey of retirement practices.
New York: The Society. (Mimeographed)
24. Tuckman, J., and Lorge I. 1952. Retirement practices in business
and industry. J. Gerontol., 7, 77-86.
25. Hewitt, Edwin Shields, and Associates. 1952. Company practices
regarding older workers and retirement. Libertyville, Ill.:
Edwin Shields Hewitt & Associates.
26. National Industrial Conference Board. 1955. Retirement of employees--
policies, procedures, prac4ices. ("Studies in Personnel Policy,"
No. 148.) pp. 31-36. New York: The Board.
27. Wermell H. T., and Beideman, Geraldine. 1961. Retirement preparation
programs: a study of company responsibilities. Pasadena, Cal.:
California Institute of Technology, Industrial Relations Section.
28. Franke, W. H. 1962. Preparing workers for retirement, p. 26. Univ.
of Ill. Bull., Vol. 591 No. 53.
29. Hunter, W. W. 1967. Cooperation between industry, labor and the
community in retirement education. Community Development, n.s.
17-18, pp. 103-118.
30. Breen, L. Z., and Marcus, P. N. 1960. Pre-retirement-education
among labor unions in the United States. Lafayette, Indiana:
Purdue University, Department of Sociology.
31. Hunter, U. W. 1965. A cross-national appraisal of preretirement
education, Ann Arbor: The University of Michigan, Division of
Gerontology. (Mimeographed)
32. Mack, Marjory J. 1958. An evaluation of a retirement-planning
program. J. Gerontol., 13, 198-202.
33. Hunter, U. W. 1957. Preparation for retirement of hourly wage employees
in Niagara Falls, New York. Ann Arbor: The University of Michigan,.
Division of Gerontology. (Mimeographed)
34. Burgess, E. W. 1960. A case study of a retirement preparation
program. ("Guideposts to effective action in aging. Case study
No. 5: The Chicago retirement planning and preparation program.")
18

35. 1951. Preparing employees for retirement. New York: American
Management Association.
36. Boyle, C. P. 1952. Helping employees adjust to retirement. Personnel,
29, 261-74.
37. Delaney, H. B. 1953. Fte -retirement aid, retirement aid and counselingIn The problem of making a living while-growing old: proceedings
of the Second Joint Conference, pp. 330-37. Philadelphia: Temple
University School of Business Administration.
38. Donahue, Wilma. 1950. Preparation for living in the later years.
Adult Education, 1, 43-51.
39. Douglas, Martha A. 1955. A preparation for retirement program.(Publication No. 109.) Chicago: Research Council for EconomicSecurity.
40. Hunter, W. W. 1956. A study of methods for developing a pre-retirement conditioning program for use by the Upholsterers'International Union locals. (Paper read at the First Pan-AmericanCongress of Gerontology, Mexico City.) Ann Arbor: The Universityof Michigan, Division of Gerontology. (Mimeographed)
41. Mack, Marjory J. 1954. A retirement planning program. J. Businessof University of Chicago, 27, 169-76.
Ncetzel, A. 1952. Preparation of industrial workers for retirement.Pittsburgh: Health and Welfare Federation of Alleghany County.(Mimeographed)
43. Odell, C. 1959. Employment and pre-retirement problems of the olderworkers, Part III: Retirement preparation education--an ounce ofprevention. Geriatrics, 14, 591-94.
44. Perrow, C. 1957. Are retirement adjustment programs necessary?Harvard Business Rev., 35 (July-August), 109-15.
45. Segal, M. E. 1959. A program of retirement counseling for publicemployees. New York: Retirement Advisors, Inc. (Mimeographed)
46. Shultz, E. B. 1959. Selective retirement and pre-retirementcounseling in the T.V.A. Industrial & Labor Relations, 12 206,13.
47. Breen, L. Z., and Marcus, P. M. 1960. Pre-retirement educationamong labor unions in the United States. Lafayette, Indiana:Purdue University, Department of Sociology.
48. Burgess, E. W., Corey, L. G., Pineo, P. C., and Thornbury, R. T.1958. Occupational differences in attitudes toward aging andretirement. J. Gerontol., 13, 203-6.
19

49. Thompson, W. E. 1958. Pre-retirement anticipation and adjustment inretirement. J. Social Issues, l41 No. 2, 35-45.
5o. Cumming, Elaine, and Henry, q. E. 1961. Growing old: the processof disengagement. New York: Basic Books, Inc.
51. Riegel, K. F. 1959. Personality theory and aging. In J. Birren(ed.), Handbook of aging and the individual, pp. 797-851.Chicago: University of Chicago Press.
52. Kuhlen, R. G. 1959. Aging and life adjustment. In J. Birren (ed.),Handbook of aging and the individual, pp. 852-897. Chicago:University of Chicago Press.
53. Breen, L. Z. 1962. Retirement: norms, behavior, and functionalaspects. In C. Tibbitts (ed.), Aging around the world, Vol. 1.New York: Columbia University Press.
54. Anderson, J. E. (ed.). 1956. Psychological aspects of aging.Washington, D. C.: American Psychological Association, Inc.
55. Anderson, J. E. 1955. Teaching and learning. In Wilma Donahue (ed.),Education for later maturity, pp. 60-94. New York: Whiteside,Inc. and William Morrow & Company, Inc.
56. Lorge, I. 1955. Capacities of older adults. In Wilma Donahue (ed.),Education for later maturity, PP. 36-59. New York: Whiteside,Inc. and William Morrow & Company, Inc.
57. Bondy Betty W. 1956. Group Discussion--decision. Minneapolis,Minnef,ota: Minnesota Dept. of Health.
58. Hill, R. J. 1960. A comparative study of lecture and discussionmethods. White Plains, New York: The Fund for Adult Education.
59. McKeachiel W. J. 1963. Research on teaching at the college anduniversity level. In N. L. Gage (ed.), Handbook of research onteaching. Chicago: Rand McNally and Co.
60. Donahue, Nilma, Orbach, H. L., and Pollak, O. 1960. Retirement: theemerging social pattern. In C. Tibbitts (ed.), Handbook of socialgerontology, pp. 399-406. Chicago: University of Chicago Press.
61. Cavan, Ruth S., Burgess, E. W., Havighurst, R. J., and Goldhamer, H.1949. Personal adjustment in old age, pp. 143-148. Chicago:Science Research Associites, Inc.
62. Rosow, I. Adjustment of the normal aged: concept and measurements.1963. In R. H. Williams, C. Tibbitts, and Wilma Donahue (eds.),ProceafP-s of aging: social and psychological perspectives ofaging--an international seminar, Vol. 2, pp. 195-223. New York:Atherton Press.
20

II. PURPOSES AND METHCDS OF THE STUDY
The previous chapter described retirement as a process by whichindividuals at increasingly younger ages change from a umrk focused to a
leisure focused way of life. Although the transition creates tensionand problems of adjustment, the position was taken that the period of
retirement need not become a period of uselessness, frustration and
dissatisfaction; and, it was reported that a few gerontologist-educatorshad developed preretirement education programs which were presumed tohelp adults adjust to the retirement years.
Several techniques were employed to offer the programs including
group discussions, lectures by experts, and the use of films, auto-biographical experiences, exhibits, and reading materials. The surveys
of preretirement education which were reviewed showed, however, that
many more individual type counseling programs than group discussion
programs have been offered, that industrial organizations have predomi-
nated as sponsors of programs, that the content and methods of individualand group discussion type programs have varied considerably and thatthe most recent emphasis in the field is that of providing preretirementprograms for hourly-rated industrial workers in contrast with earlier
efforts to develop programs for salaried personnel.
Despite the new emphasis, preretirement education for lower-leveloccupational groups was shown to be an untested program. Accordingly,the Division of Gerontology undertook, with support from the U.S. Officeof Education, to develop and test special program raterials and methodsfor hourly-rated workers and to conduct an experimental study of theireffectiveness with hourly rated workers in a eandardized group dis-cussion type preretirement education program. Having made the firststep in a systematic preparation of materials and their assessment inpreretirement education, the present study was designed to assess programeffects during the years after retirement. For example: Is the olderworker who participates in a preretirement education program more likelythan the worker who does not participate in a program to manage hisretirement income effectively? Is he more likely to find satsifactoryways to utilize his leisure time? Is he less likely to become isolatedfrom friends and community? Is he more likely to take steps to main-tain good physical health? Is he more likely to maintain satisfactoryfamily relationships?
The present study proposed to seek answers to these questions byextending the earlier study of preretirement education to additionalgroups of hourly-rated workers and to conduct a longitudinal evaluationof the effects of preretirement education on attitudes and behavior afterretirement of two panels of older workers, one of which participated ina preretirement program.
It appears that the majority of older people eventually achieveadjustment to retirement which i$ more or less satisfactory, but there is
21

little evidence in the professional literature to indicate how long ittakes to achieve a new equilibrium, whether some people take less timethan others, or whether a preretirement education program can shortenthe time that is required to make satisfactory adaptations to a non-working way of life.
Hence, the present longitudinal study was concerned with assessingthe effects of an educational program on both the temporal and quali-tative aspects of adjustment following separation from work.
The Preliminary Study
Before discussing the design of the longitudinal study a briefconsideration of the preliminary research project seems indicated becausemany of the procedures for the longitudinal study were the same as thoseused in the preliminary study. The purposes of the earlier study asstated above were to develop and test materials and methods and todetermine their effectiveness with hourly-rated workers in a groupdiscussion type preretirement education program. To achieve the firstof these goals, five types of materials were prepared especially for usewith hourly-rated workers--a series of subject matter booklets dealingwith such topics as health, leisure time, and financial planning; ahandbook of short stories based on case histories of older people andtheir way of handling different retirement situations;2 a series ofseven 16mm sound films, each approximately 4 minutes in duration;3 aseries of 20 still pictures14 and a leader's manual covering methods fororganizing and conducting the program.5 The content booklets and theshort stories were prepared at an eighth grade level of reading diffi-culty. The purpose of the reading material was to prompt thinkingbetween sessions and to raise questions for discussion. The films andthe still pictures were developed along Thematic Apperception Testlines. Thus, the viewer was expected to elaborate on what was happeningand to decide haw things would work out. The reading and the visualmaterials were intended to complement each other as means by whichparticipants in a preretirement education program, some of whom wouldnot be easily able to read English, would be alerted to a range ofretirement contingencies, and, more importantly, would be given practicein thinking through typical situations and deciding on approporatesolutions.
Following their preparation, the various kinds of materials weretested in an experimental study of two groups of hourly-rated workerp,one of which used the materials in a group discussion type preretire-ment education program. The group discussion program consisted of tenweekly sessions which both the worker and his spou9e were eligible to
attend. Participants helped to determine the content of the discussions.In addition to the author, who served as discussion leader for all ofthe programs, various kinds of resource people such as a lawyer, physi-cian, a librarian, and a retired worker and his wife took part to answerquestions and to react to plans and problems presented by the retiringworkers.
22
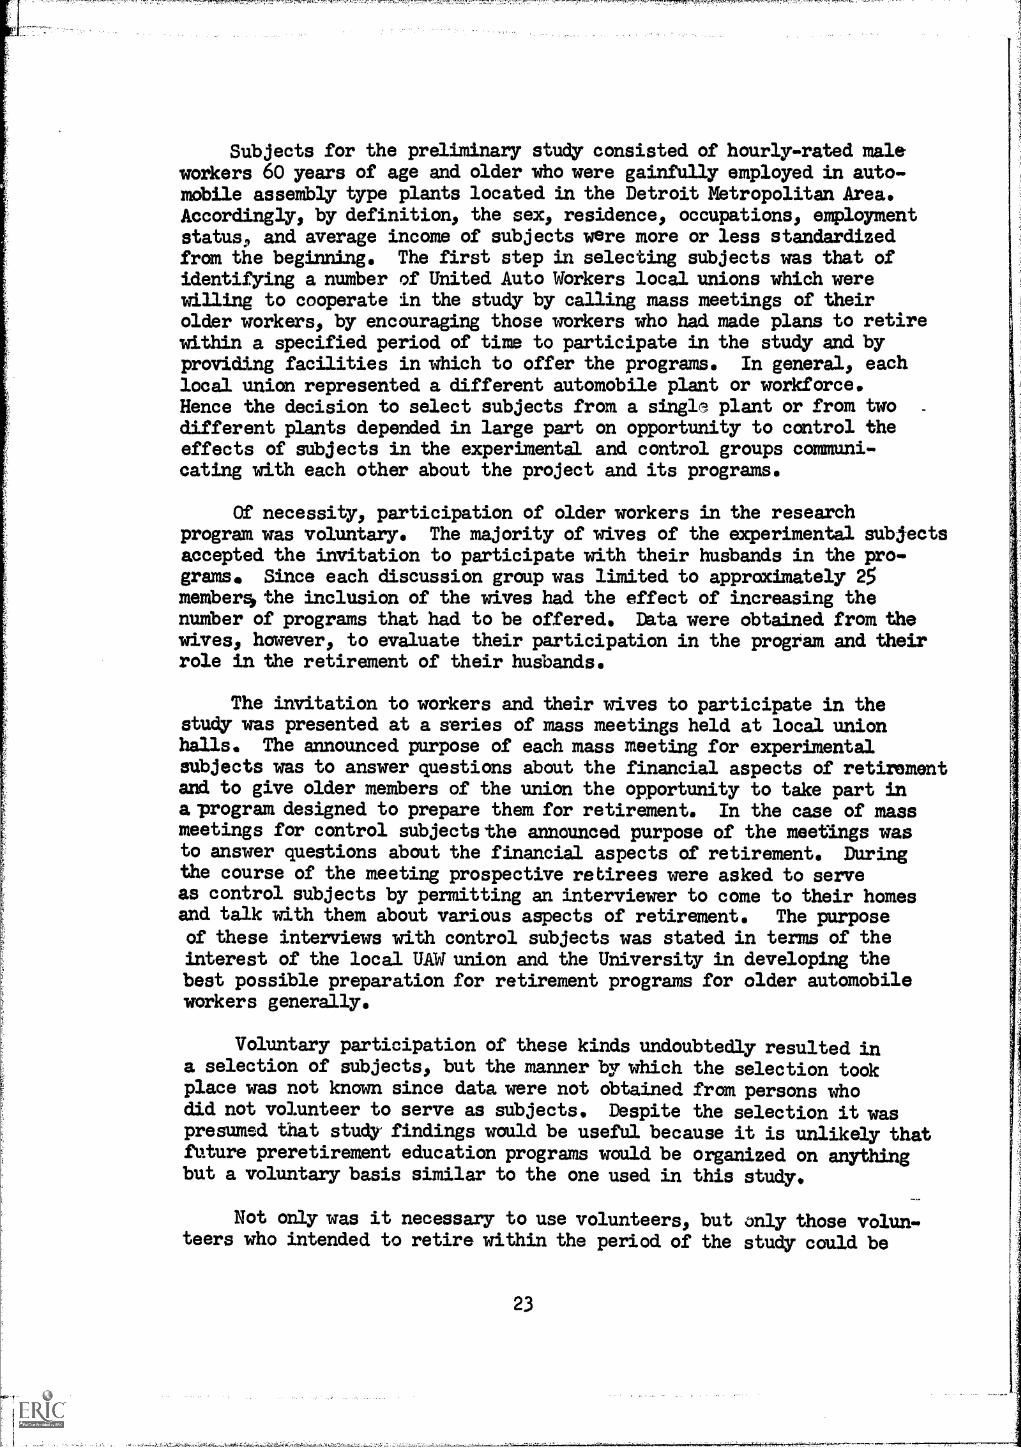
Subjects for the preliminary study consisted of hourly-rated maleworkers 60 years of age and older who were gainfUlly employed in auto-mobile assembly type plants located in the Detroit Metropolitan Area.Accordingly, by definition, the sex, residence, occupations, employmentstatus:, and average income of subjects were more or less standardizedfrom the beginning. The first step in selecting subjects was that ofidentifying a number of United Auto Workers local unions which werewilling to cooperate in the study by calling mass meetings of theirolder workers, by encouraging those workers who had made plans to retirewithin a specified period of tine to participate in the study and byproviding facilities in which to offer the programs. In general, eachlocal union represented a different automobile plant or workforce.Hence the decision to select subjects from a singla plant or from two _
different plants depended in large part on opportunity to control theeffects of sUbjects in the experimental and control groups communi-cating with each other about the project and its programs.
Of necessity, participation of older workers in the researchprogram was voluntary. The majority of wives of the experimental subjectsaccepted the invitation to participate with their husbands in the pro-grams. Since each discussion group WAS limited to approximately 25member4the inclusion of the wives had the effect of increasing thenumber of programs that had to be offered. Data were obtained from thewives, however, to evaluate their participation in the program and theirrole in the retirement of their husbands.
The invitation to workers and their wives to participate in thestudy was presented at a series of mass meetings held at local unionhalls. The announced purpose of each mass meeting for experimentalsubjects was to answer questions about the financial aspects of retiramentand to give older members of the union the opportunity to take part ina 'program designed to prepare them for retirement. In the case of massmeetings for control subjectsthe announced purpose of the meetings wasto answer questions about the financial aspects of retirement. Duringthe course of the meeting prospective retirees were asked to serveas control subjects by permitting an interviewer to come to their homesand talk with them about various aspects of retirement. The purposeof these interviews with control subjects was stated in terms of theinterest of the local UAW union and the University in developing thebest possible preparation for retirement programs for older automobileworkers generally.
Voluntary participation of these kinds undoubtedly resulted ina selection of subjects, but the manner by which the selection tookplace wss not known since data were not obtained from persons whodid not volunteer to serve as subjects. Despite the selection it waspresumed that study findings would be usefUl because it is unlikely thatfuture preretirement education programs would be organized on anythingbut a voluntary basis similar to the one used in this study.
Not only was it necessary to use volunteers, but only those volun.teers who intended to retire within the period of the study could be
23

accepted. To forestall negative reactions on the part of those whowere denied the opportunity to participate, it was stated that identicalprograms would be offered as soon as possible following the originalprograms. This promise has been kept in each of the locals whichsupplied subjects for the reaearch project.
Three out of a group of eleven local unions were selected as themost appropriate sources of subjects for the preliminary study, two assources of control subjects and one as a source of experimental subjects.The distance between the locals which supplied experimental and controlsubjects was approximately 10 miles.
Table 1 shows that 183 subjects volunteered initially for the
TATES 1. suBJECT8 FoR THE PREMINARY STUDY
Categories Experimental subjectS Cohtrol subjects All Subjectsfrom from
local. union A local unions A. & B
Total initial volunteersWorkers
48 60 108Wives33 42 75Totals ET 102 163
Subjects lost to the studyWorkers 12 8 20Wives 8 13 21TOTS.13 20 21 tuf
Study populationWorkersWives
36 885225 29 54Totals U. ET. 1:42
preliminary study but that 41 subjects were lost to the study for onereason or another, leaving 142 subjects in the final study population,88 workers and 54 wives. The principal reasons for losing subjectsduring the preliminary study were refusal to be interviewed or failureto attend at least seven of the ten discussion meetings.
Subjects for the Longitudinal Sj.idy
It was anticipated that not all of the 88 workers from the pre-liminary study would be available for as long as two years followingretirement. Some of them would move away, there would be refusals tocooperate in the interviews and others would die. Accordingly, toinsure an adequate number of workers for a longitudinal panel of experi-mental subjects, preretirement education programs were offered to 49
24

new subjects who were selected and included in the research project inthe same manner as the original or old group of experimental subjects.Wives of new experimental subjects took part in the programs but theywere not included in the longitudinal study.
Similarily, 37 new control subjects were added to the 52 old controlsubjects already on hand (see Table 2). Thus, it was expected that an
TABLE 2. OLD AND NEW SUBJECTS FOR THE LONGITUDINAL STUDY
Subjects Experimental Control Both graups
Old subjects 36 52 88New subjects 49 37 86
Totals 85 89 174
initial longitudinal study population of 174 subjects would yield a finalstudy population of at least 100 subjects, approximately fifty in theexperimental and control categories. As a matter of fact, attritionwas less than expected. Table 3 summarizes the number of subjects wbich
TAME 3. NUIDER 07 SUJECTS AVAILABLE AT THE VARIOUS PHASES 07 THE STUDY
Phases of thelongitudinal study
Number of subjectsExperimental Control Both groups
11.10
Pre=study phase 85Pre-retirement interview phase (Pre=Rlaa 70First retirement interview phase (R-1) 70Second retirement interview phase (R-2)c 63
397070
59
During the year prior to retirement.° 6 to 12 months after retirement.
18 to 24 months after retirement.
was available at various phases of the longitudinal study. The maximumnumber of subjects for whom data were available at the pre-retirementand also at the first retirement interview phase was 140 subjects. Bythe time the second or final retirement interview was completed thisnumber had decreased to 122 subjects, 63 experimental and 59 controlsubjects.
Comparability of Study Groups Before Retirement
It was not feasible, as pointed out earlier, to determine arbitrarily
25
the specific composition of the experimental and control groups for thestudy or to randomly select subjects. On the other hand, certain controlswere exercised which were intended to increase the comparability of thetwo groups and justify the statistical evaluation of program effects.All subjects were males, $0 to 68 years of age, who expected to retirewithin a uniform period of time under provisions of the same negotiatedpension system: Also, by definition, all subjects were employed fulltime on hourly-rated jobs in assembly type automobile plants. Allsubjects lived and worked in the Metropolitan Detroit Area.
Presumably, initial controls of these kinds could have the effectof increasing the comparability of the experimental and control popu-lations on such other socio-economic variables as standard of living,income while working, income after retirement, attitudes toward retire-ment, educational status and health status.
All subjects volunteered to take part in the study during a massmeeting which had been called by their local union on the subject ofretirement. What effect selection of this kind would have on thecomposition of the experimental and control groups was not known. It
was presumed, however, that the effects of self-selection, whateverthey might be, would operate similarly in the two groups because identicalpurposes were announced for the meetings. Moreover, testing the programwith volunteer subjects was presumed to be acceptable because in practicemembership in preretirement education programs is most likely to be ona voluntary rather than a compulsory basis.
During the initial interview with experimental and control subjects,data were collected for purposes of comparing the study populations.In addition, attempts were made to obtain from employers similar datadescribing automobile workers generally in the Detroit area, but with-out success. Thus, it was not possible to compare the study sampleswith the larger population of Detroit automobile workers from whichthey were drawn.
Age Comparisons
The age of the older workers ranged from 56 to 68 years with meanages of 63.5 and 62.0 for the experimental and control populationsrespectively. The difference of 1.5 years is due probably to the factthat the new cohort of control subjects was added following nego-tiations which made retirement as early as age 55 possible and moreattractive. Although the control group tended to be significantlyyounger than the experimental group, Table 4 shows that most of thesubjects in either category were 60 to 64, or 65 to 69 years old.This is understandable because at the time of the study most automobileworkers expected to retire at ages 62 or 65, or to wait until age 68when it was mandatory to retire. As pointed out earlier, all subjectsexpected to retire within a specified period of time. This ratherthan age was considered to be the important independent variable (see
Table L. on follouing page).
26

TABLE L. COMPARISON OF EXPERIMENTAL AND CONTROLPOPULATIONS ON THE BASIS OF AGE (PRE-R1)a
Age categoriesb Experimental Control Both groups(n-70) (n-70) (n-140)
55 ... 59 years 1% 14% 8%
60 - 64 64 67 66
65 - 69 34 19 26
Totals 99 100 100
Mean age 63.5 62.0 62.0
a (Pre-R1) indicates data were collected during the year priorto retirement,
b t = 3.63, df = 138, p< .01
Nhrital Status
As shown in Table 5 the experimental and control groups were well
TABLE 5, COMPARISON OF EXPERIMENTAL AND CONTROL SUBJECTSON THE BASIS OF MARITAL STATUS (PRE-R1)
Marital status Experimental Control Both-groups(n-70) (n-70) (n-140)
Never married 10% 6% 8%
Married, living with spouse 84 87 86
Separated, widowed or divorced 6 7 6
Totals 100 100 100
Chi-square = .96, cif = 2, p > .05
matched on the basis of marital atus. The majority of the subjects
were married. Both groups contaiaed a few subjects, however, who hadnever married, or were separated, widowed or divorced.
Nearly three-fourths of the wives of experimental subjects attendedthe preretirement education programs with their husbands.
Race
Racial composition was comparable in the two study populations
(see Table 6 on following page). The majoriV of subjects in both groupswere uhite.
27

TABLE 6. EXPERIMENTAL AND CONTROL SUBJECTSCOMPARED ON THE BASIS OF RACE (PRE-R1)
Race Experimental Control Both groups
(n-70) (n-70) (n-140)
NegroWhite
11% 14% 13%
89 86 87
Totals 100 100 100
Chi-square = .06, df = 1, p> .05
Birthplace
It was presumed that the birthplace of subjects and its relation-ship to their ability to read and understand the English language mighthave a bearing on program results. Table 7 shows that observed dif-
TABLE 7. EXPERIKENTAL AND CONTROL SUBJECTS COMPARED ON THE BASIS OFBIRTHPLACE AND LANGUAGE SPOKEN AT PLACE OF BIRTH (PRE-R1)
Birthplaceand Experimental Control Both groups
language spoken (n-70) (n-70) (n-140)at place of birth
BirthplaceaIn the United States 49%In a foreign country 48No informationc 3
Totals 100 100 WLanguage spoken at place of birthb
English 66% 81% 73%Non-English 31 19 25No informationP 3 1
Totals MT Tr 97
70% 59%30 39
1
a Chi-square = 3.33, df = 1, p .05
b Chi-square = 2.77, df = 1, p> .05
c Unless otherwise stated the "no information" category was notincluded in these or subsequent chi-square computations.
ferences between experimental and control subjects in regard to birth-place or the language spoken in the country where they were born were
not significant.
28

Educational Status
Four factors were used to compare the educational status of experi-
mental and control subjects: 1) number of grades completed in school,2) other schooling completed, 3) difficulty reading and writing English,and 4) ability to read or write another language. As shown in Table 8,
TABLE 8. EXPERIMENTAL AND CONTROL SUBJECTS COMPAREDBY EDUCATIONAL STATUS (PRE-R1)
Educational status Experimental Control Both-groups(n-70) (n-70) (n-140)
Number of school grades completedaElementary school 73% 67% 70%High school 19 29 24College 7 3 5No information 1 1 1
Totals 100 100 100Average number of grades 8.2 7.6 7.9
Other schoolingbYes 245 33% 29%No 71 67 69No information 4 2
Totals 33 loo 100
Difficulty reading and writing EnglishcNo trouble 605 835 715Very little trouble 21 4 13Some trouble 14 10 12A lot of trouble 4 3 4
Totals W loo 100
Ability to read or write another languageYes 335 31% 32%No 67 69 68
Totals 100 100 100
a chi.square = 2.93, df = 2, p > .05b Chi=square = .60, df = 1, p > ;05c Chi-square = .49, df = 1, p > .05, "No trouble" category combined with
"Very little trotible," and "Some trouble" combined with "A lot of trouble."
differences between experimental and control subjects were not significant.
Table 8 also shows that the average educational level of the subjectsin this study is almost identical with the educational attainment level
29

of the general older population in the United States. One-fourth of theexperimental subjects and approximately one-third of the control subjectshad had Some other schooling. The most frequent other schooling was forpurposes of learning a trade or industrial skill. Sixteen per cent ofthe total study population had some or a lot of trouble reading andwriting English. This does not mean, however,- that subjects havingtrouble reading English were illiterate. One-third of the total popu-lation was able to read or write a foreign language.
Residential Status
Information describing the types of dwellings in which subjectslived, the number of problems they had with their dwellings, the lengthof residence in the community, and plans to move or not to move weredbtained for purposes of comparing the residential status of experi-mental and control subjects. The length of residence is compared inTable 9, while the other residential factors are presented in Table 10.
TABLE 9. EXPERIMMTAL AND CONTROL SUBJECTS eOMPARED BY YEARSOF RESIDENCE IN THE COMMUNITY (PRE-R1)
Years of residence Experimental Control Both-groupsin (n-70) (n-70) (n-140)
the communitya
0 - 9 years 16% 16% 16%10 = 19 29 14 2120 29 11 30 21
30 = 39 17 9 1240 - 49 17 18 18
50 = 59 6 6 660 - 69 3 3 3No information 1 4 3
Totals 100 100 100Average years of residence 26.1 25.8 26.0
a t = .13, df = 134, p> .05
Length of residence ranged from a maximum of 55 to a minimum of twoyears. The average for experimental and control groups was approximately26 years of residence.
Not only were both groups of subjects equally well established intheir present homes, it appears from Table 10 on the next page that theGroups were comprised for the most part of homemmers. In general, subjectsin this study expressed feu problems uith their homos. There were statistically
30

TABLE 10. EXPERIMENTAL AND CONTROL SUBJECTS COMP/6m, BY HOME
OWNERSHIP, PROBLELIS WITH THE HOE AND PLANS TO PIOVE (PRE-R1)
Residential status Experimental Control Both-groups(n-70) (n-70) (n-140)
aM.O....
Home ownershipOwn home 845Rent home or other arrangements 16
Totals 100
84% 84%16 16
100 100
Problems with homeNo problems 79% 80% 79%One, two or three problems 21 19 21
Totals 100 97
Plans to movea'Yes 105 18% 13%No 4o 59 49Undecided 50 24 37
Totals 100 101 99
a Chi-square = 10.00, df = 2, p .01
significant differences in their attitude toward moving after theyretired. Control subjects tended more to state plans to mave, whilea larger proportion of experimental subjects were undecided dbout moving.
Health Status
A significantly larger proportion of control than of experimentalsubjects assessed their health as good,(see Table 11). Not only did
TABLE 11. SELF-RATING OF HEALTH OF EXPERIMENTALAND CONTROL SUBJECTS (PRE-R1)
Self-rating of health Experimental Control Both-groups(n-70) (n-70) (n-140)
Poor
FairGood
Totals
7% 55 7%59 34 4634 60 47
100 99 loo
Chi-square = 9.47, df = 2, p < .01
31
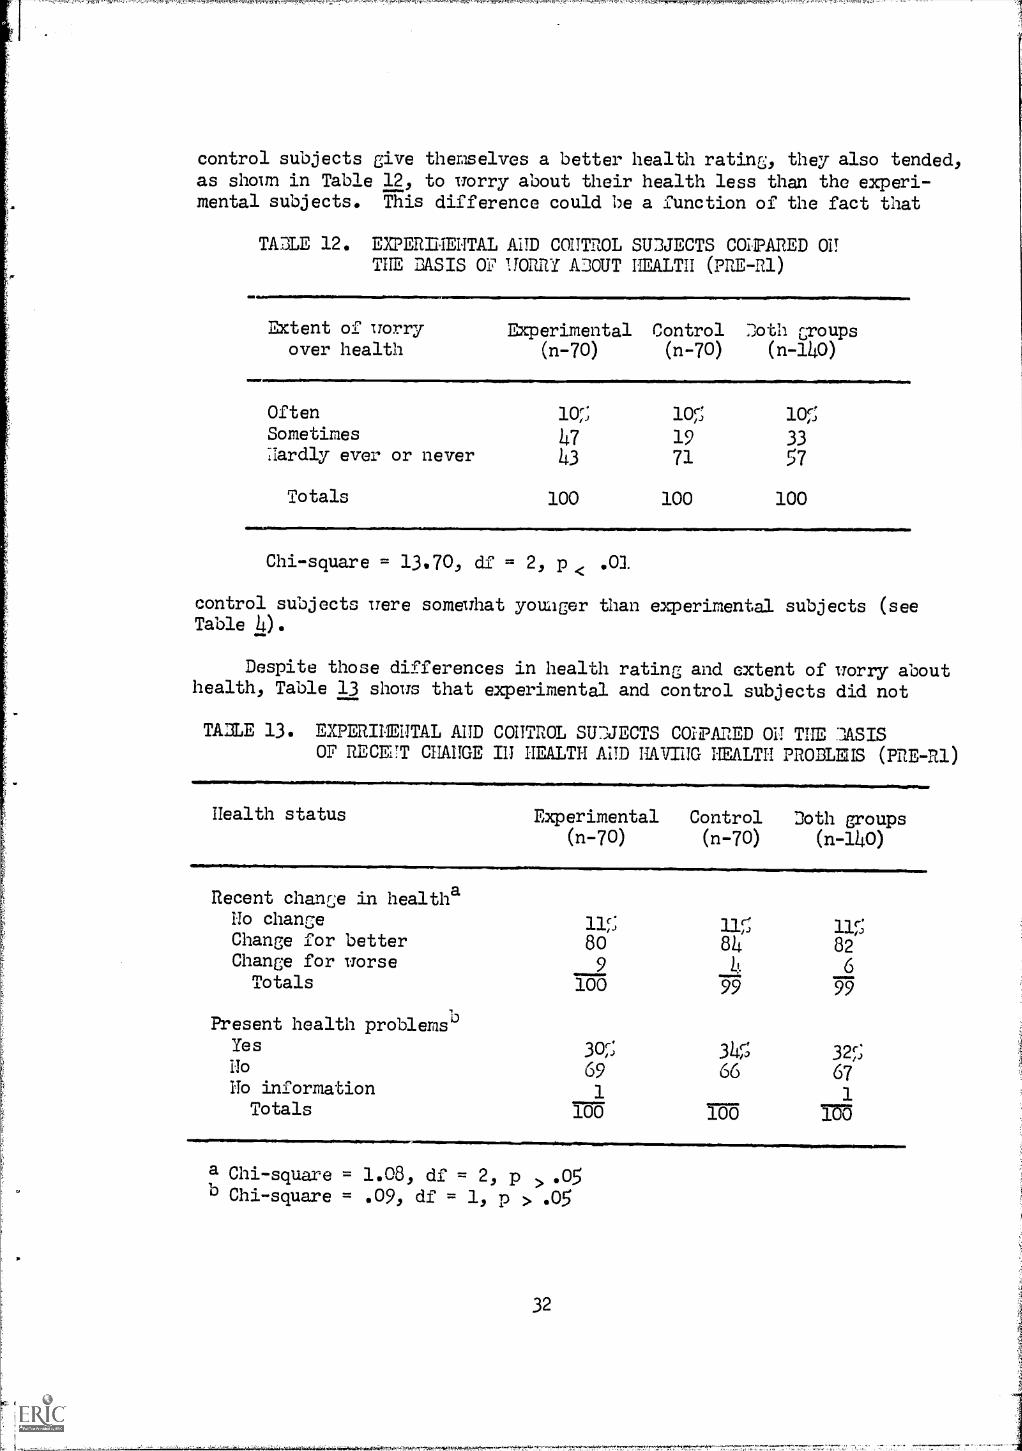
control subjects give themselves a better health rating, they also tended,as shown in Table 12, to uorry about their health less than the experi-mental subjects. This difference could be a function of the fact that
TABLE 12. MERE,IENTAL AHD CONTROL SUBJECTS COLIPAREDTHE BASIS 017 TiORRY ABOUT HEALTH (PRE-R1)
Extent of uorryover health
Experimental Control .-3oth croups
(n-70) (n-70) (n-140)
Often 105 105 105Sometimes 47 19 33Hardly ever or never 43 71 57
Totals 100 100 100
Chi-square = 13.70, df = 2, p .01
control subjects uere somewhat youager than experimental subjects (seeTable 4).
Despite those differences in health rating and extent of worry abouthealth, Table 13 shows that experimental and control subjects did not
TABLE 13. EXPERIENTAL AND CONTROL SUBJECTS CC:OARED OH THE :3ASISOF RECENT CHAIIGE HEALTH AHD HAVIUG HEALTH PROBLEMS (PRE-R1)
Health status Experimental Control :loth groups(n-70) (n-70) (n-140)
Recent chance in healthaHo chance 115 115 115Change for better 80 8/4 82Change for worse 9 14. 6Totals 100 7 7
Present health problemsbYes 305 345 325Ho 69 66 67Ho information 1 1
Totals 100 100 I'M
.1111INIEw
a Chi-square = 1.08, df = 2, p > .05b Chi-square = .09, df = 1, p > .05
32

differ significantly in their responses to the questions:
1. Has your health changed during the past year?2. Do you have any particular physical or health problems at
present?
Hence, it could be assumed that differences in health rating and worryover health were the result of long-standing rather than current healthproblems among the experimental subjects.
Occupational Status
The control group was engaged in a significantly higher proportionof skilled and sani-skilled jobs than the experimental group (see Table 14).
TABLE 14. EXPERIMENTAL AND CONTROL SUBJECTS COMPAREDBY OCCUPATIONS (PRE-R1)
Type of occupation Exper±mental Control Both-groups(n-70) (n-70) (n-140)
SkilledSemi-skilledUnskilledNo information
Totals
30% 415 36%23 34 29
47 23 351 1
100 99 101
Chi-square = 8.77, df = 2, P < .01
Data were also collected which showed that, on an average, experi-mental subjects had spent 19 years on the job while control subjectshad spent between 20 and 21 years on the job.
The attitude of the subjects toward their work was indexed bytheir responses to three questions:
1. How much do you enjoy your present job?2. Wbuld you like to change to some other job or department,
if given the chance?3. How often do you worry about being able to do your job?
Table 15 on the next page summarizes their responses and shows thatboth groups enjoyed their jobs equally well. There were significant dif-ferences, however, in the proportions of axperimental and control subjectswho were undecided about wanting to change their jobs or who were worried about
33
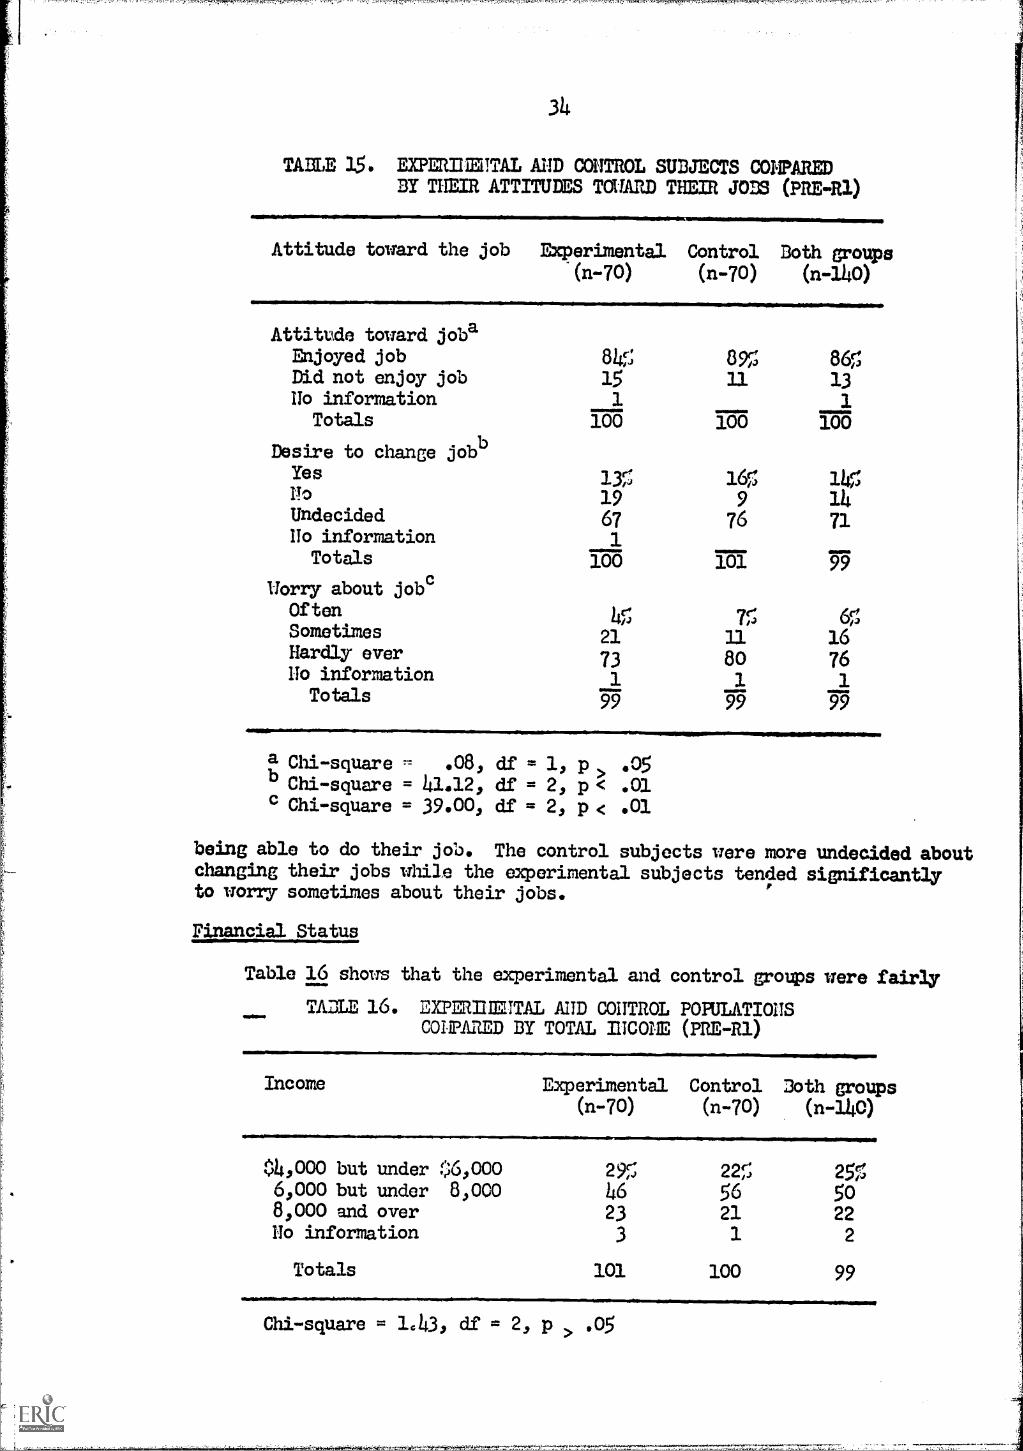
34
TABLE 15. EIPERIMITAL AHD coma SUBJECTS COMPAREDBY THEIR ATTITUDES TOWARD THEIR JOBS (PRE-R1)
egimagftisai.wii
Attitude toward the job erimental Control Both groups(n-70) (n-70) (n-140)
Attitude tauard jobaEnjoyed job 845 895 865Did not enjqy job 15 11 13Ho information 1 1
Totals 100 100 100
Desire to change jobbYes 135 165 145Po 19 9 14Undecided 67 76 71Ho information 1
Totals 100 101 93Worry about jobc
Often 45 75 65Sometimes 21Hardly ever
73Ho information 1
4111111111111M~s
Totals 99
11 1680 761 199
Chi-square - .08, df = 1, p .05° Chi-square = )41.12, df = 2, p < .01c Chi-square = 39.00, as = 2, p < .01
being able to do their job. The control subjects were more undecided aboutchanging their jobs while the experimental subjects tended significantlytO worry sometimes about their jobs.
Financial Status
Table 16 shows that the experimental and control groups were fairly
TABLE 16. EXPERIMITAL AHD =um POPULATIOHSCOI-FARED BY TOTAL IHCONE (PRE-111)
Income Experimental Control Both groups(n-70) (n-70) (n-14.0)
f)4,000 but under f:J6,000 295 225 2556,000 but under 8,000 46 56 508,000 and over 23 21 22Ho information 3 1 2
Totals 101 100 99
Chi-square = 1,430 df = 2, p .05

35
well matched on the income variable. Neither was there a significant dif-ference in the proportions of subjects who had income in addition to uhatthey earned on their jobs (see Table 17).
TABLE 17. STUDY POPULATIONS COI1PARED ON THEBASIS OF OTHM1 ICOHE (PRE-R1)
VONSIBINNMAMN.NII
Other income Experimental Control Both groups(n-70) (n-70) (n-140)
Yes 37 335 355o 61 67 64Ho information 1
Totals 99 100 99
Chi-square = .17, df = 2, p .05
Questions were asked of each subject to index his attitude toward hispresent income while working, his present standard of living, and hisfuture income after retirement. Responses are presented in Table 16.
TABLE 180 ATTITUDES OF STUDY POPULATIONS TOUARDPRESENT AND FUTURE INOUE (PRE-R1)
411111111.
Attitudes toward income Experimental Control Both groups(n-70) (n-70) (n-140)
Adequacy of income while workingaIncome enough to meet living expenses 865 945 9o5Income not enough to meet expenses 13 6 9Ho information 1 1
Totals 100 100 Ibb
Frequency of worry about mnney mattersbOften 45 35 45Sometimes 27 13 20Hardly ever 69 814. 76
Totals 100 loo ,T55
Standard of livineBUtter today 35 65 45Same as it was 20 14 17Better during most of lifetime 77 80 79Totals 100 100 100
Adequacy of retirement income (anticipated)d
Uill run a little in the red 65 35 45Will barely break even 21 17 19Will be able to meet living expenses 61 47 541111.1 have more than enough to meet expenses 11 33 22
Totals 99 100 99
a Chi-square =b Chi-square =
Chi-square =d chi-square =
1.42, df = 1, p .05
4.901 df = 2, p > .05
1.37, df = 2, p > .05
9.57, df = 3, p < .02

There was considerable correspondence between experimental and
control subjects in their estimate of the adequacy of their income while
working, the frequency of worry ovtr money matters and their appraisal
of their standard of living. Host subjects reported that they had enough
to meet living expenses, that they hardly ever worried about money matters,
and that their standard of living vas better than it had been most of their
lifetime.
On the other hand, Table 18 shous that a significantly larger per-
centage of control than experimental subjects expected to havt more
than enough retirement income to meet expenses.
In sum, before retirement experimental and control subjects were
well matched on such variables as marital status, race, birthplace,
educ...tional status, residential status except for plans to move, attitudes
toward the job, income, attitudes toward income, worry over money matters
and attitude toward standard of living. The two groups were signifi-
cantly different, houever, on such other variables as age, plans to move,
health status and occupational status, a situation which should be taken
into account in the analysis of program effects.
ComparabiliV of Study Groups One Year After Retirement
One hundred and forty was the maximum number of subjects (70 experi-
mental and 70 control) for whom data were available for both the first
(Pre-R1) and second (R-1) phases of the study. The previous section
compared the 70 experimental and 70 control subjects one year before
retirement. In this section the same subjects are compared on the
basis of data collected during the first year after retirement. Of
course, characteristics such as race, year completed in school, birth-
place could not have changed while characteristics such as age would havt
changed uniformly. Hence, only those characteristics which could havt
changed during the period of one year following retirement are examined
in Table 19 on the following page.
The study groups appear to have become better matched during the
first year of retirement, especially in regard to the health variables.
The tuo groups became less comparable, however, in the extent of worry
over money matters. The control subjects tended one year after retire
ment to be less worried about money.
Comparability of Study Samples Two Years After Retirement
The previous two sections were concerned with the comparability of
the experimental and control populations at the pre-retirement phase of
the study and again at the time of the first retirement interview 6 to
12 months after retirement. Houever, by the time the second and final
interview was conducted 18 to 24 months after retirement, 18 subjects had
been lost to the study. The purpose of this section of the report is to
assess what effect, if any, the loss of these subjects-hid on the compara-
bility of the study groups tuo years after retirement.
36

37
TABLE 19. A SUNITARY OF STATISTICAL coinnisons OF EXPERIMITALAND CONTROL SUBJECTS OITE YEAR AFTER RETIRE:MITT (R-1)a
Results of chi-square comparisons ofCharacteristics experimental and control subjectsb
Chi-square values df
Ehrital status .43
Residential statusHome olinership .11Plans to move .42
2
1
2
Health statusSelf-rating of health .55 2Ubrry over health 2.40 3Changes in health .39 2Present health problems .76 2
Financial statusIncoms 6.00 6Earning money .00 1Adequacy of income .00 1liorry over money matters 8.69c 2Standard of living 3.20 2
a (R-1) i dicates that the data were collected during the firstyear of retirement.
Source tables showing percentages are. presented in Appendix 1.Significant at the .02 level of confidence.
Age Comparisons
At the time of the pre-retirement intervieu there was a significantdifference of 1.5 years in the average age of experimental and controlsubjects. Table 20 shows at the time of the second and final retiremant
TABLE 20. COUPARISOU OF EXPERMENTAL AND CONTROL POPULATIONSON THE BASIS OF AGE (R-2)a
Age comparisonsb
IMMIN,Experimsntal Control Both groups
(n-63) (n-59) (n-122)
55 59 years 25 145 8560 - 6464 65 6465 - 6935 22 28
Totals 101 101 100Hean ago 63.5 62.2 62.9
a(R-2) indicates data were collected during the second and finalretirement intervieu 18 to 24 months after retirement.t = 2.88, df = 120, p .01

interview (R-2) that the difference had decreased to 1.3 years, indicatingthat the age compositions of the study populations, although significantlydifferent, had remained relatively stable despite the loss of 18 subjects.
harital Status
At the time of the second retirement interview the study populationswere still well matched on the basis of marital status (see Table 21).
TABLE 21. COITARISON OF EXPERITIGHTAL AHD COHTROL SUBJECTSOH THE BASIS OF HARITAL STATUS (n-2)
harital status Experimental Control Both groups(n-63) (n-59) (n-122)
Hever married l05harried, living with spouse 83Separated, widowed, divorced 8
VOMIN1.1.1111.
Totals
8583
9 9
9'583
101 100 101
Chi-square = .05, cif = 2, p > .05Race
Ole
AN,
As shown in Table 22 the tuo study populations were similarly wellmatched on the basis of racial composition.
TABLE 22. EXPERLMITAL AND CONTROL SUBJECTS COMMOH THE BASIS OF RACE (R-2)
Race Experimental Control Both groups(n-63) (n-59) (n-122)
NegroUhite
Totals
05 1953 25570
100
81
100
75
100
Chi-square = 2.18, df =
Birthplace
At R-2and controlthe country
1, p .05
there were no significant differences between experimentalsubjects in regard to birthplace or the language spoken inwhere subjects were born (see Table 23 on the next page).
38

TABLE 23.
39
EXPERIMITTAL AND CONTROL SUBJECTS COIMARED OU THE BASISOF BIRTHPLACE AND LANGUAGE SPOKEN AT PLACE OF BIRTH (R-2)
Birthplace and language$ oken at place of birth
BirthplaceaIn the United StatesIn a foreign countryNo information
Totals
Language spoken at place of birthbEnglishNon-EnglishNo information
Totals
Experimental Control Both gi717531..IP(n-63) (n-59) (n-122
515
2
100
685302
100
69530
99
79520
605
391
100
745251
100
aChi-square = 3.33, df = 1, p .05bChi-square = 1.19, df = 1, p > .05
Educational Status
A comparison of Table 21 and Table 8 in the previous section shous
TABLE 24. EMRIIENTAL AND CONTROL SUBJECTS COMPAREDBY EDUCATIONAL STATUS (R-2)
Educational status1111111111.11I
Experimental Control Both groups(n-63) (n-59) (n-122)
Number of school grades completedaElementary school (0-8)High school (9-12)College (13-16)No information
TotalsAverage number of grades
Other schoolingb
YesNoNo information
Totals
Difficulty reading and writing EnglishcHo troubleVery little troubleSome troubleA lot of troubleTotals
Ability to read or write another languaged
YesNo
Totals
71520
68527
40111111111100101111
70522
8 4 62 2 2
101 101 1008.3 7.6 7.9
275 32570 68
3100 TOT5
62519145
100
33567
100
30569
2
101
835 7255 128 113 4
99 99
34566
100
34566
100
a t = 1.41, df = 118, p .05b
Chi-square .10, df = 1, p > .05cChi-square = 7.76, df = 3, p > .05
dChi-square = .00

_
that the study populations are as well matched on the educational variablesat the time of the R-2 interview as they were when interviewed prior toretirement. Educational status was described in both instances in termsof the number of school grades conpleted and whether subjects had otherschooling, had difficulty reading and writing English and had the abilityto road and write another language.
Residential Status
Table 25 compared the study populations on the basis of home owner-ship, problems with the home, plans to move, and years lived in theneighborhood.. none of the observed differences in regard to thesevariables is significant.
TABLE 25. EXPERIDENTAL AHD COUTROL SUBJECTS COIARED BY HOHE01.7ITERSHIP, PROBLEHS WITH HOLT, AIM PLAITS TO HOVE (R-2)
Experimental Control Both groups(n-63) (n-59) (n-122)
Residential status
Home ounershipaOwns home 845 835 845Rents home or other arrangements 14 17. 16no information 2 1Totals 100 100 101
Problems with homeb
Uo problemsOne or more problemsTotals
Plans to movecYes
UndecidedTotals
Median nurnber Of year§lived in neighborhood'
715 8o5 75529 20 24
10C 100
85 75 75
87 86 875 7 6
loo loo No
20.4 22.1 21.3
aChi-square = .01, df = 1, p> .05Chi-square = .71, df = 1, p> .05
cChi-square = .02, df = 1, p> .05 Subjects who were undecided werenot included.t = .70, df = 119, p .05
Health Status
Table 26 shows that there was considerable correspondence in thehealth status of experimental and control subjects as indexpd during thesecond year after retirement by a self-rating of health, extent of worryover health, recent changes in health and number of present physical orhealth problems. (see Table 26 on following page),

TABLE 26. EDI)! IMPEL= COHTROL SUBJECTS =PAREDBY HEALTH STATUS (R-2)
Health status Experimental Control Both groups(n-63) (n-59) (n-122)
Self-rating of healthaPoorFairGood
Totals
nt of worry over haalthbOftenSometimesHardly everHeveriio information
Totals
Recent changeHo changeChanged forChanged forTotals
in healthc
betterworse
Humber of present physical orhealth problemsd012
3Totals
7530
35415 3559 61
.93
5% 35 4513 3 8
14 1580 72
1Ira 165
16652
101
765
1410100
835107
100
62524132
101 100
805128
100
58%2712
3100
! Chi-square = 14.79, df = 2, p .05' Chi-square = 2.41, df = 1, p .05 "Often"and "hardly ever" combined with "never."Chi-square = .88, df = 2, p >.05Chi-square = .83, df = 2, p .05 Subjects
combined with
having 2 ez 3
hsometimes"
problems combined.
Financial Status
The financial status of experimental and control subjects was comparedon the basis of total income, adequacy of retirement income whether ornot subjects were working and earning money in retirement, worry overmoney matters and the subjects, estimate of their standard of living.
Table 27 shows that control subjects had a higher income than theexperimental subjects and that this difference mas significant. Nearlyhalf of the control subjects had !)5,000 or more income while only 35per cent of experimental subjects had as much income (see Table 27 onfollowing page).
141

TABLE 27. EXMIIIEITTAL AND CONTROL SUBJECTS =PARED ONTHE BASIS OP TOTAL RETIRED= INCONE (R-2)
Retirement income
..Nomm.MIMIMINIMMINIMExperimental Control Both groups
(n-63) (n-59) (n-122)Amm..1111111111111 :+111=1",
$2,000 but under $3,000 115 653,000 but under 4,000 224,000 but under 5,000 275,000 but under 6,000 136,000 but under 7,000 97,000 and more 13No information 5
Totals 100
a Chi-square = 78.46, df = 5, p < 01
255 2417 2224 18
5 719 1610 7
100 100
Despite the difference in income it is shown in Table 28 that there
TABLE 23. =OM EITTAL AUD COICTROL SUBJECTS COIIPAREDDY ADayaCY OF RETIRE.'TAT INCOME (R-2)
Adequacy of inccme a _ID ri t al Control Both groups(n-63) (n-59) (n-122).....11,,..m.~...1. ...111M114 .wavWy.OFINFAMly
Adequate for L7vIng e.:Tenses 925 865 895Not adequate for living eponses 8 14 11
Totals
,.... Iaavo ,.. F100 100 100
Chi-square = ,51, df = 1, p OS
mra,s very little difference in the experimental and control subjects/estimate of the adequacy of their reUrement income.
"tvorA! Mow
Table 29 combines the other three variables uhich were used tocompare the financial status of the study samples. The groups appear tobe similar in the extont to which subjects are gainfully employed and theextent of worry over moncy The czntrol group differs significantly,however, in the per cent who believed the.r standard of living was betterthan it had been (see Table 29 on ne4t page).
Thus, the earlier decision to take income differences into accountin the analysis of program effects was reinforced by the data presentedin Tables 27 and 29,
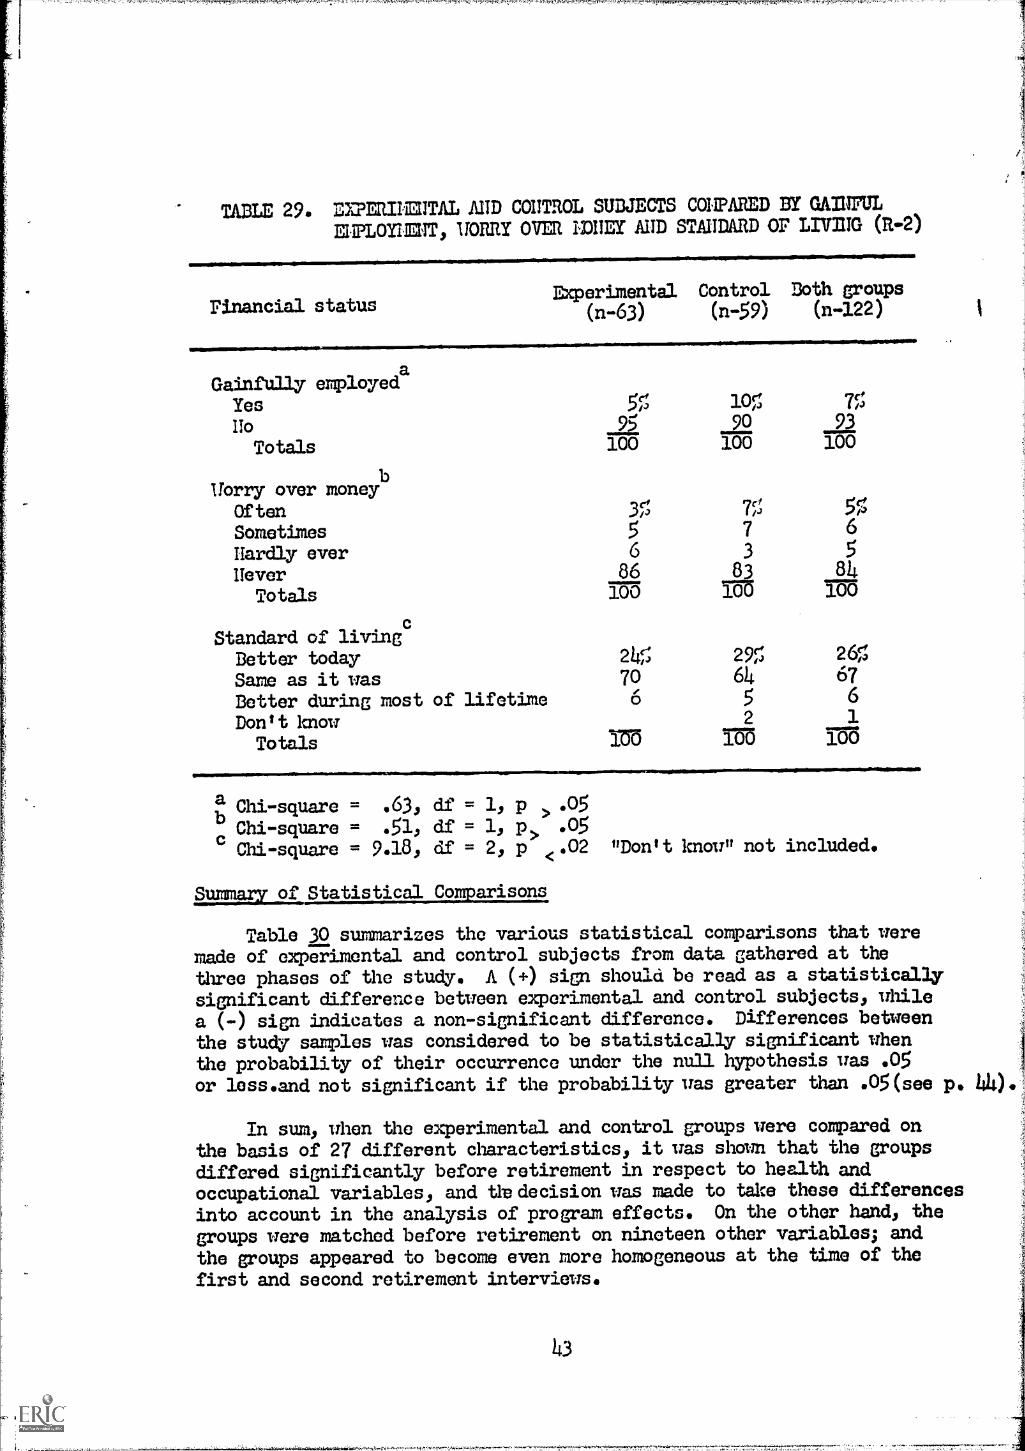
MINNOW
TABLE 29. E/TERITENTAL AND CONTROL SUBJECTS CODPARED BY GA111FUL
EIPLOYIENT, ITORRY OVER 'WHEY AIM STANDARD OF LIVIUG (R-2)
Financial statusExperimental Control Both groups
(n-63) (n-59) (n-122)
1111 011, .111NOMM, 10110101101100,
Gainfully employedaYesNo
Totals
Ubrry over moneyOftenSometimesHardly everNevtr
Totals
Standard of livingc
Better todaySame as it wasBetter during most of lifetimeDon't know
Totals
55 lo5 75
.9; 90 93
loo loo
35 75 555 7 6
6 3 586 83 84100 100 100
245 2957o 646 5
2
1n5 TOZ
2656761
100
a Chi-square = .63, df = 1, p .05b
Chi-square = .51, df = 1, p> .05c Chi-square = 9.18, df = 2, p <.02 uDon't knew!' not included.
Summary of Statistical Comparisons
Table 30 summarizes the various statistical comparisons that woremade of experimental and control subjects from data gathered at the
three phases of the study. A (+) sign should be read as a statisticallysignificant difference between experimental and control subjects, while
a (-) sign indicates a non-significant difference. Differences between
the stuOy samples was considered to be statistically signifieant whenthe probability of their occurrence under the null hypothesis uas .05
or less.and not significant if the probability was greater than 05(see p. 44).
In sum, uten the experimental and control groups utre compared on
the basis of 27 different characteristics, it was shown that the groupsdiffered significantly before retirement in respect to health andoccupational variables, and th)decision was made to take these differences
into account in the analysis of program effects. On the other hand, the
groups wtre matched before retirement on nineteen other variables; and
the groups appeared to become even more homogeneous at the time of thefirst and second retirement interviaus.
43
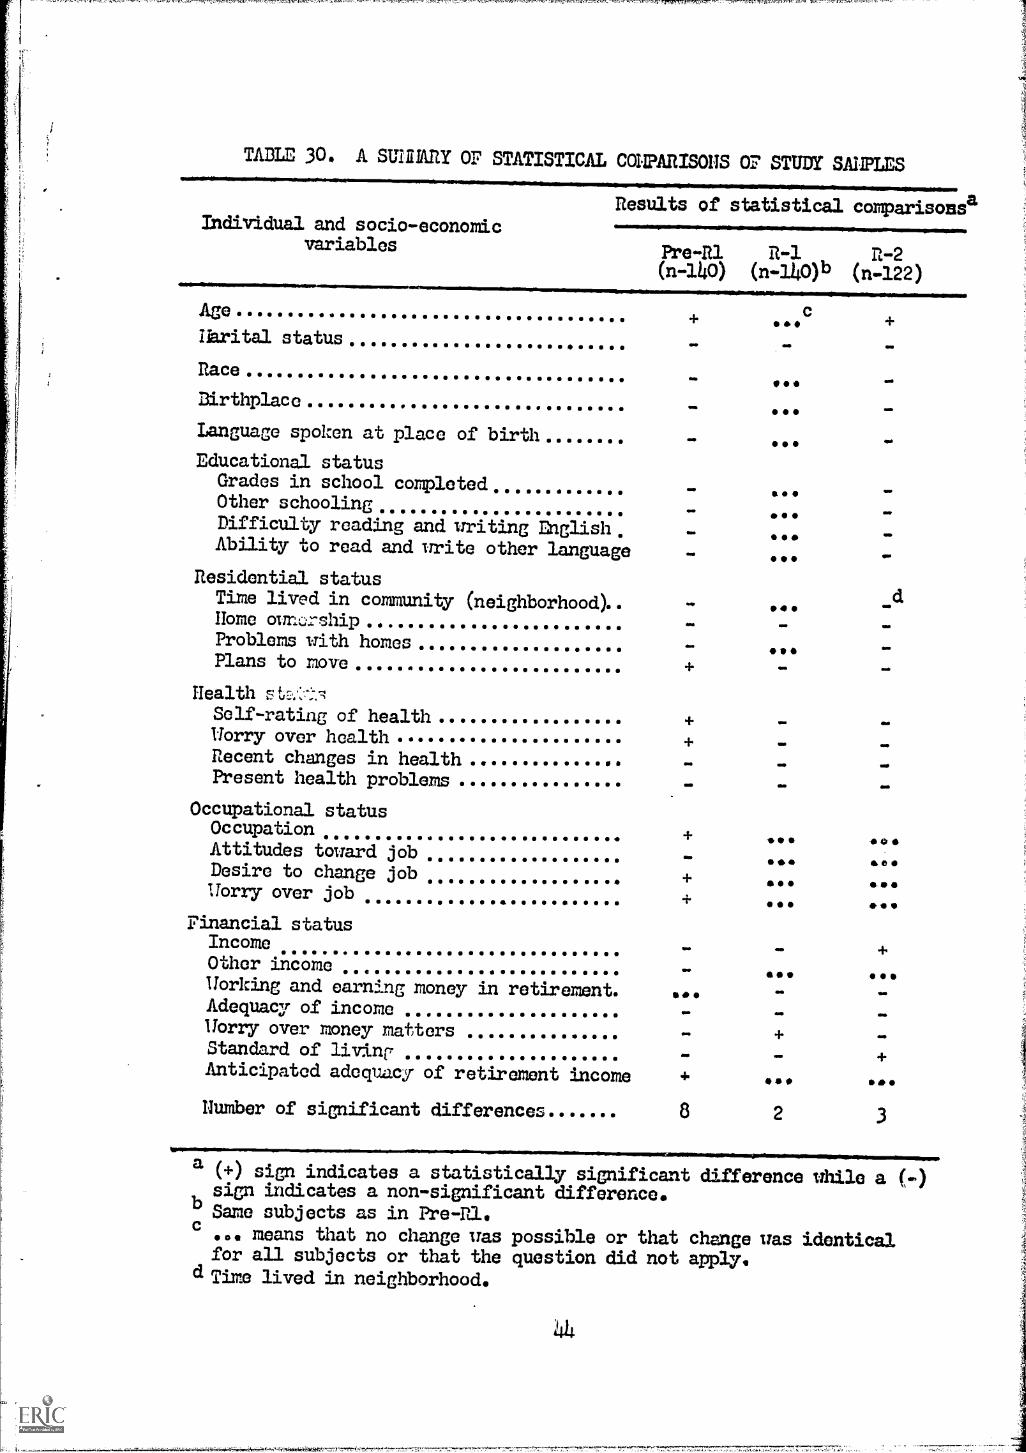
TABLE 30. A STARRY OF STATISTICAL COMPARISONS OF STUDY SAMPLES
Individual and socio-economicvariables
411161111111 .1.1111MININNIMMININIMMINIMMINNIMMIIIV
Results of statistical conparisossa
Pre -R1 R-1 11-2
(n-140) (n-140)13 (n-122)
Age
Marital status
Race
Birthplace
Language spoken at place of birth
Educational statusGrades in school conpletedOther schooling
Difficulty reading and uriting EnglishAbility to read and write other language
Residential statusTime lived in community (neighborhood).Home aunurship ..
Problens with homesPlans to move
HealthSelf-rating of healthWorry over healthRecent changes in healthPresent health problems
Occupational statusOccupationAttitudes tauard jobDesire to change jobWorry over job
Financial statusIncormOther incomeWorking and earning noney in retirementAdequacy of incomeWorry amr money mattersStandard of livingAnticipated adequacy of retirement income
Number of significant differences
1011101
000.0011100
000
IND
INN
+ .+ ....
... ... ... .
0
1100 000000 004SOO SO0
0,0 0000.0
... .... ..... + .+
ovoqo
8 2 3
Am ,4111111111a
k+) sign indicates a statistically significant difference while a (-)sign indicates a non-significant difference.Same subjects as in Pre-R1.
.0. means that no change was possible or that change was identicalfor all subjects or that the question did not apply.
d Time lived in neighborhood.

Uypotheses of the Study
Despite a steady growth in the number and kinds of preretirementeducation programs during the past twenty years, there has been onlyminimal effort, as reported in Chapter I, to define objectives and measureeffectivoness of the program, and no effort at all as far as could bedetermined to evaluate the effect of preretirement education during theyears after retirement. Thus, the major purpose of the present studyvas to compare the adjustment during tho first two years of retirementof two panels of automobile workerq, one of which had participated in apreretirement education program.
Three principal null hypotheses uere established as a basis formaking the comparisons:
1. that the pcznel of older workers who participated in the pre-retirement education programs did not make any different meanscores on a nunber of measures of adjustmont in retiremontthan a similar group of retired workers who had not been exposedto the preretirement education program;
2. that there were no differences between experimental and controlsubjects in mean change scores ovtr a period of two years onthe various measures of adjustment to retirement; and
3. that there utre no differences in me= scores and in mean changescores on the various adjustment measures betueen various sub-samples of the experimental and control study populations such aswhite and negro subjects, subjects with high and low educa-tion, subjects with high and lau income, and subjects who utremarried as against subjects who utre not married.
Ebasures of Personal and Social Adjustment in Retirement
Chapter I of this report discussed the problem not only of definingwhat is meant by adjustment in the later ytars but also of finding satis-factory measures with which to study adjustment of older people syste-matically. Because most students of aging agree that much conceptualwork and analysis renains to be dono before solutions will be found tothese problems, the decision was made to use measures of adjustment toretirement which had already been tested in tuo outstanding studies ofretired people: 1) the Cornell longitudinal study of occupationalretirement conducted by Gordon F. Streib and Wayne E. Thompson with asample of participants living in 48 states36 and 2) Bernard Kutnerlsstudy of 500 people 60 years of age and older living in Neu York City.7About ono-third of Kutner's sanple were foreign born. Less than one-half of 1 per cent uere non-white. A little less than 30 per cent camefrom the middle-class while 60 per cent were selected from the lauersocioeconomic group--proportions uhich Kutner believed prevail in almostany large urban center.
115

The panel of subjects for the Cornell study, an the other hand,consisted of feuer foreign born, a greater representation of professionalpersons, and fever people from the louer socioeconomic group. The largestproportions of the Cornell subjects came from the more heavily industrializedareas of Hew England, iliddle Atlantic and North Central states.
Tuo types of adjustment neasures uere borrowed from the Cornell andKutner studies; 1) general type satisfaction with life and morale indexeswhich were presumed to measure adjustment and 2) measures of one or morespecific aspects of adjustment in retirement such as difficulty in gettingused to not working or attitude tauard income.
One other source, the study of the dynamics of marriage byRobert O. Blood, Jr. and Donald II. Wolfe provided tuo indexes with whichto study changes in the social structure of the cader family, a decision-naking pouer index and a division of labor index.°
Finally, the inVestigator developed a number of indexes to measurevarious aspects of adjustment vhich uill be referred to hereafter aslachigan indexes in contrast uith those which will be designated asCornell, Kutner or Blood and Wolfe indexes.
Table 31 summarizes the 33 indexes which were used in the present
TAW, 31. INFORMATION ABOUT THE BATTERY OF INDEXES USED TO MEASUREGElm"L AND SPECIFIC ASPECTS OF ADJUSTMENT TO RETIREMENT
Number, categoryand
name of index
When administered Number Scoring DescriptionSource of system of
Pre-R1 R-1 R-2 itemd' ( or -)b indexc
General Adjustment easures
11 Satisfaction Cornell X
with life3 A general assessment
'of satisfaction,happiness and goodspirits which werepresumed to measureadjustment
4 Minimum and maximum scores can be read from this column except for indexes12, 22, 23 because each item of the scale vas given a score of 1. Thusscores for the Satisfactions ulth Life index could range from 0 to 3.
b A plus () sign indicates that positive responses were given a score of 1while a (-) sign means that a negative response uas given a score of 1.This difference is important in the interpretations of results because ahigh score is preferred on all measured "positively" scored while a lowscore is preferred on all measures "negatively" scored.Items and scored responses for each index are presented in Appendix 2.
46

TULE 31 (continued)
.,,.,Ffnwunrsr
Humber, categoryand
name of indexSource
Uhen administered Number Scoring Descriptionof system of
Pre-R1 R-1 R-2 items (+ or -) index
2 librale altner X X X 7 A measure of "morale"in terms of thepresence or absenceof satisfaction,optimism, andexpanding lifeperspective."Morale" was usedas a criteria of
Adjustment
3 Adjustment to Cornell X X X 2 Indexes tuo aspectsRetirementof adjustment--thetime it takes toget used to retire-ment and difficultyhaving things to doin retirement
Self Concept neasures
4 Self Concept Cornell X X X 1 + Indexes hou theof Ageindividual thinksof himself in termsof age
5 Self-Other ilichigan X X 4 fleasures the olderComparisons - Aperson's view ofhimself in contrastwith other olderpeop-.e in regard
to health, standardof living andrelatives
6 Self-Other nichigan X X 6 Same as above uithComparisons - 3
two additionalcomparisons inregard to spouseand children
147

TA:LE 31 (continued)
Humber, category When administered Number Scoring Descriptionand Source -.. of system ofname of index Pre-R1 R-1 11-2 items (+ or -) index
7 Attitude Touard Ilichigan X X X 18 Indexes whether theRetired Peopleindividual has a"positive" or"negative" view ofolder people
Attitudes Toward Retirement fleasures
8 Attitude Cornell X X X 1 + Indexes whether theTowardsubject thinksRetirementretirement is goodor bad
9 Dissatisfaction Cornell X X X 4 -Dissatisfaction isuith Retirementindexed by attitude,
toward work10 Negative
Aspects ofRetirement
Cornell X X 3 Heasures the effectof retirement onsubjecte feelings of)
usefulness, age,and satisfaction
11 Preparation lachigan X X X 1 + fleasures how wellfor Retirementsubject thoughthe was preparedfor retirement
Health Ebasures
12 Physical Health KutnerIndex
X X 16 A functional type oflindex based onconfinement to bed,deprivation due toillness, number ofminor illnesses andnumber of seriousillnesses
13 Health Self- Cornell X X X A- An index of healthAppraisalbased on self-rating, changes,existing healthproblems and careby doctor recently

TADLE 31 (continued)
Humber, categoryand
name of index
Uhen administered Humber ScoringSource of system
Pre-R1 R-1 11-2 itens (+ or -)
Descriptionof
index
14 Attitude IlichiganToward Health
15 Uorry AboutHealth
16 Hental HealthIndex
hichigan X X
XNichigan
X 5 This index asks thesubject to comparehis health with whatit has been, withthe health of otherolder people, and todecide whether oldage and sicknessare the same thing
X 1 Indexes amount ofworry over health
17 Knowledge Kutner X XAboutHealth Resource8
18 Disposition to Kutner X XUse HealthResources
19 Use of Health lachigan X XResources
Financial.Vbasures
20 Attitude CornellTowardIncome
7 Worry over health,nervousness,sleeplessness,exhaustion, deepsadness, emotionalupsets are used ascriteria of poormental health
neasures subject'sknowledge about oneor more local healtresources
4 Iridexes dispositionto use healthresources of varioukinds
5 + Indexes actual useof a variety ofhealth resources
X X X 3 A measure of thesubject's ability tmeet expenses, theextent of his womover money mattersand his vietr of hiE
standard of living
49
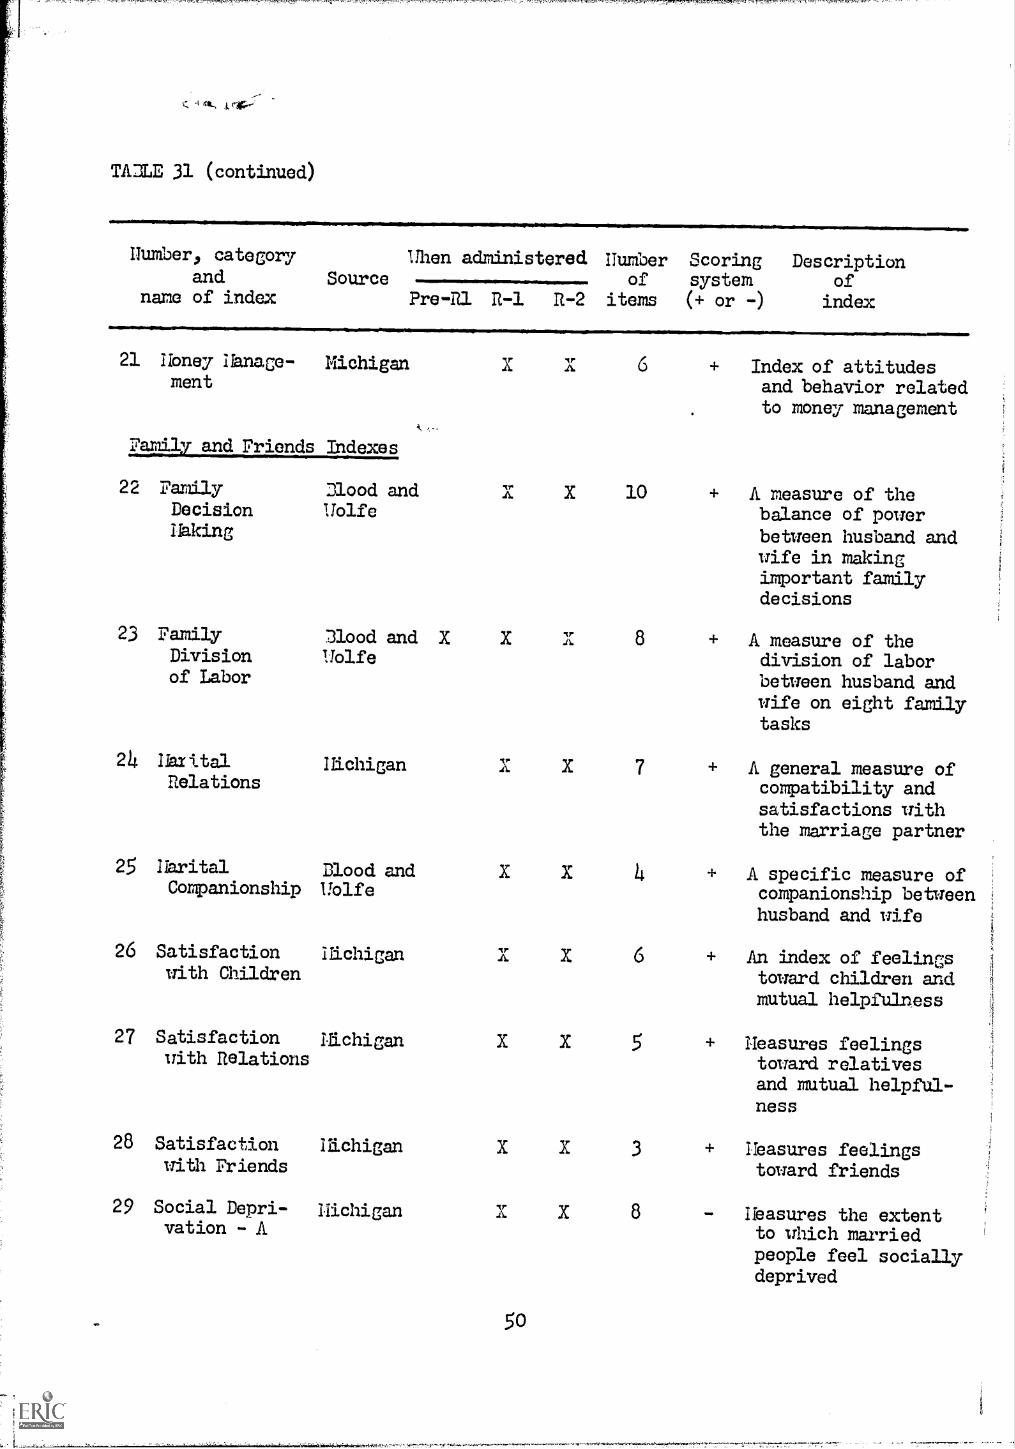
frt,
TADLE 31 (continued)
Number, category Uhen administered Number Scoringand Source of system
name of index Pre-R1 R-1 R-2 items (+ or -)
Descriptionof
index
21 Noney ihnace- Michiganment
X X 6 + Index of attitudesand behavior relatedto money management
Family and Friends Indexes
22 Family "Blood and X XDecision Wolfe'raking
23 Family Blood and X XDivisionof Labor
Wolfe
24 Narital Nichigan XRelations
25 Narita]. Blood and X XCompanionship Wolfe
26 Satisfactionwith Children
Hichigan .A. X
27 Satisfactionwith Relations
ichigan X X
28 Satisfactionuith Friends
achigan X X
29 Social Depri-vation - A
Nichigan X
50
10 A measure of thebalance of powerbetween husband andwife in makingimportant familydecisions
8 A mnasure of thedivision of laborbetween husband andwife on eight familytasks
7 A general measure ofcompatibility andsatisfactions uiththe marriage partner
4 + A specific measure ofcompanionship betueenhusband and wife
6 An index of feelingstoward children andmutual helpftlness
5 ' Measures feelingstouard relativesand mutual helpful-ness
3 + fleasures feelingstauard friends
8 Measures the extentto uhich marriedpeople feel sociallydeprived

TABLE 31 (continued)
Number, category When administered Number Scoring
and Source o f systam
name of index Pre-R1 R-1 R-2 items (+ or -)
Descriptionof
index
30 Social Depri- Michiganvation
Home and Community Index
31 Satisfactionwith Home andCommunity
Activity Measures
32 TctalActivities
33 SedentaryActivities
34 PhysicalActivity
35 Mass Media
36
37
38
X X 5 Measures the extentto which singlepeople feel sociallydeprived
Michigan X X
Michigan X X X
Michigan X X x
Michigan X A-Tr X
Michigan X A. X
Social Michigan X X XActivity - A.
Social Activitywith Family
and Friends
ichigan X X A.
Individual Michigan X X XActivity
51
+ easures feelingsabout home andcommunity
19 + Measures extent ofparticipation inall types ofactivities
8 + Indexes participationin eight sedentaryactivities
4 Indexos participationin activitiesrequiring physicalexertion
4 Measures extent oftime spent watchingTV, listening toradio, going tomovies and reading
9 + Measures participationin social type ofactivities
5 Measures axtent ofsocial activity withfamily and friends
11 + easures extent ofsolitary, activity

study to measure general and specific aspects of adjustment to retirement.
The iters in each index, method of scoring and other information about
the instruments is presented in Appendix 2.
Eight categories of indexes are listed in Table 31, as follows:
1. General adjustment measures2. Self concept measures3. Attitudes toward retirement measuresL. Health measures5. Financial status measures6. Family and friends indexes7. Home and community index8. Activity measures
These same categories will be used as a basis for presenting thefindings in the next chapter of the report. Thus, the analysis willproceed from data obtained by the use of general measures of adjustmentto data obtained by the use of specific measures of adjustment in variousareas of retirement living including health, use of leisure time, social
relationships and so forth.
Although there is some apparent overlap, each index was intended tomeasure a different aspect of adjustment to retirement. For example,there are eight health indexes described in Table 31. The first ofthese, number 12, is a physical health index developed by Kutner, which,unlike most measures of health in the later years, contains items whichassess four important dimensions of health--confinement to bed, depri-vations of various kinds due to illness, number and seriousness ofillnesses. Number 13 is a self-appraisal of health. Quite often insurveys of older people the point has been made that despite illnesseswhich may be revealed by medical examination, the important thing ishou older people evaluate their own health. Closely related to the olderperson's appraisal of his own health is the extent to which he mrriesabout his health (index number 15). It was important also to have somemeasure of the older subject's mental health (see index number 16).
Finally, one of the major purposes of this study was to examinenot only how older people feel about their health but also what they didabout it. Considerable emphasis was placed in the preretirement educationprogram ori individual responsibility for becoming informed about healthservices he could use in retirement to prevent illness and to maintaingood health and for taking specific steps on his oun to achieve betterhealth through regular physical examinations, adequate diet, propercare of the body, exercise, and so forth. Discussion was purposefullydirected toward encouraging members of the group to make decisionsabout their health and then to carry them out. Hence the inclusion ofindex numbers 17, 18 and 19 which measure in that order the older person'sknowledge about health services, his disposition to use them and theextent to which he did actually use health services of which he wasaware.
52

The problem of making a clear-cut presentation of data obtained with
the use of as many as 38 different indexes, at three different points
in title, for experimental and control groups, as well as a number of
sub-groups of experimental and control subjects, is a complicated one.
Under these circumstances, it is possible in this report to present
only the basic kinds of comparisons, leaving more complex analyses of
variables to subsequent reports. However, before turning to the section
on data analysis, a brief summary of the steps taken in the over-all
conduct of the study seems indicated, especially the methods that were
used to develop and conduct the preretirement education program.
Organizational Procedures
As stated earlier, a preliminary study was made for purposes ofdesigning preretirement education materials and methods especially forhourly-rated workers and testing them with groups of automobile workers
and their vivts. Thus, the present longitudinal study was an oxtension
of the earlier study and it used materials, methods, and measurementtechniques similar to those of the earlier study. For example, Table 31
shaus that 19 out of the 38 scales and indexes were administered to
subjects of the preliminary study. One of the first tasks in makingplans for this longitudinal !Audy was therefore one of deciding hau
best to supplement the original battery of indexes with others, which
would permit a more intensive analysis of adjustment in several areasof retirement living. As indicated, some of these indexes utre borrowedfrom other research studies while others were developed by the inves-tigator. Having made final decisions about the measuring instruments tobe used a questionnaire was devised for intervieuing subjects one yearafter retirement and again two years after retirement. Follouing fieldtrials of the questionnaire uith fifteen workers who were employed inan automobile assembly plant in Flint, lachigan, the questionnaire
was revised and made ready for the study. Soon there--
after, training sessions were conducted for a corps of 6 interviewers, whoutre hand-picked as the most experienced from a group of interviewersassigned tO periodic health studies conducted by another Universitydepartment. Also, during the initial phase of the longitudinal study,coding work on the questionnaire was started, and a series of interviewswith a number of local union leaders were initiated to make arrange-ments for conducting a neu series of preretirement education programswith their members, or for inviting their members to serve as neucontrol subjects.
The same procedures were used to invite the new cohorts of experi-mental or control subjects as were described earlier in the discussionof the preliminary program. Unions were selected which representedhourly-rated workers in assembly type automobile plants. The possi-bility of interchange between experimental and control was eliminated tothe extent possible and a series of mass meetings of older workers uasconducted at the local union hall at which time uorkers who plannedto retire within the period of the study were invited to participate.Those who ranted to participate but whose retirement date was severalyears away utre told that they could participate in a preretirementeducation program offered by the local union following completion ofthe research program.
53

The old and the new experimental subjects, who together made up
the longitudinal panel of experimental subjects, were interviewed prior
to their participation in the program and again upon completion of the
program. Similarly, the old control subjects were interviewed tuice,
once upon entry into the project and again just prior to the conpletion
of the project. The new control subjects, however, were interviewed
only once. Thus, old and new subjects who became part of the longi-
tudinal study population had all been interviewed within the year prior
to their retirement. This uas called the (Pre-Rl) intervieu. Two
subsequent interviews were conducted with all subjects, one 6 to 12
months after retirement, called the (11-l) intervieu, and the other 18
to 24 months after retirement, called the (11-2) interview.
The PrPretirement Education Program
The origins of the preretirecent education program used in this
research as well as adaptations uhich wore mode from time to time to
accommodate special groups of older adults including manual workers
and their wives have been described in Chapter I. Similarly, Chapter I
contains a summary of group discussion principles upon which the program
was based. Our purpose here is to outline the principles underlying
each of the discussion meetings and to summarize the techniques that
were used to encourage participants to discuss their expectations and
concerns about many aspects of retirement and to make decisions about
their living in retiremnnt.
The program consisted of ten ueekly sessions held in the evening
for two and one half hours for groups of workers and their wives. The
groups ranged in size from 20 to 30 participants including the wives
and in one or two instances an adult daughter or son of the worker.
Workers must have attended seven of the ten sessions in order to be
included as experimental subjectsr This did not create as Great a
problem as expected, because there was very little attrition following
the second session except for sickness or death.
Previous research on the needs and problems of older people, and
experience in offering older people preretirament education and other
programs made it possible to predict to sone extent what it was the
workers and their wives would consider f_nportant aspects of retirement
for discussion, and, accordingly, reading and visual materials were
prepared ahead of time to reflect the expected concerns and interests.
On the other hand, it was recognized that individuals night differ in
their recognition of some problems, and especially in their readiness
to discuss them. For this and other reasons, the first meeting was
a crucial one for purposes of establishing the content of the various
sessionse In this regard, participants and the leader shared in
making decisions about content of the program--participants on the
basis of needs the:y were willing and ready to talk about, and the leader
on the basis of needs he had heard expressed in previous discussion
programs for older peopler
.5 4

The tuo and one half hours devoted to each session was never enoughtime in vhich to talk out all aspects of an issue, problem or plan of
action. Neither were ten sessions adequate in vhich to cover everything
of interest to participants. The position vas taken that unansueredquestions or incomplete plans would stimulate the participants tothink and to make decisions between one session and the next and followingcompletion of the program. There vas evidence that the 25 hours spentin the group discussion vere, as a matter of fact, amplified many timesas workers, their wives, or other relatives and friends talked over theideas that had been generated through discussion. Some of this "extra"time spent preparing for retirement was prompted by husbands, wives,relatives or friends reading and discussing the "preparation for retire-ment" booklets and short stories which were made available to everyonein the program. Nevertheless, the time was all too short in utich todo more than initiate the process and hopefully the habit of thinkingthrough retirement situations and of ueighing as careftlly as possiblethe various alternatives. This point was made clear in the firstsession. The point vas also made clear that the leader vas not expectedto have all of the ansuers. This vas difficult for some participantsto accept because in their view a "professor" at the University ought tobe able to tell them all the answers. It was also difficult at firstfor many of the participants to share fesponsibility for the discussionvith the leader and to discipline themselves in order to give othersequal opportunity to participate.
In sum, the first session of the preretirement education programvas concerned vith the following specific objectives:
1. Creating a permissive atmosphere in which participants feltuelcome, at ease, and able to discuss their concerns.
2. Enabling participants to make decisions about the content of theprogram.
3. Encouraging participants to get acquainted vith each other andthe leader.
4. Encouraging participants to accept the need for shared responsi-bility in group discussion, responsibility for preparationbefore the meeting, and responsibility for the actual conductof the meeting.
5. Initiating the maximum interaction in terms of ideas, information,attitudes and ways of doing things.
6. Practicing the process of decision making in the group.
7. Encouraging older people to develop a positive frame of referencein regard to aging and retirement, and to create meaningful rolesfor retirement living.
55
8. Creating anticipation for future sessions, and the desire tocontinue the process of preparing for retirement betueen sessionsby reading, discussion, observation and self-analysis.
Beginning with the second session the program consisted of sevenmeetings in which specific issues uere discussed and a final sessiondevoted especially to a review of plans and to socialization among themembers. Here, then, is a brief statement of the principles whichguided the conduct of each of those sessions.
Uork and Retirement Issues
The second session was devoted to the meaning of work and retirementin our modern industrial society not only because the issues involvedare central to any understanding of the retirement process but alsobecause it gave the opportunity to discuss a positive view of retire-ment and its potentials. flbreover, experience in discussion programsindicates the need for a *uarm-up" period of at least two sessions inwhich participants have the opportunity to sit back, observe, makeestimates of each other, get better acquainted and practice partici-pation in a discussion settinge As might be expected automobile workersand their uives did not usually suggest the topic of work and retirement,at least in gerontological terms. On the other hand, they rarely failedto enter into the discussion of a comparison of uork and retirementulth considerable interest. A film, still pictures and a short essayon the subject were used to prompt discussion. One of the most effectivetechniqikt uas that of having retired automobile workers and their wivestell what it meant to be retired. The uife's account of her husband'sattempt at adjustment, his tendency at first to get in the way usuallybrought forth a good deal of humor. ora importantly, participantslearned from hearing about realistic life experiences of people theycould understand. Thus uhat could have been a rather gloomy geronto-logical recitation of all the problems of retirement and old age usuallyturned into an exciting encounter with retirement in real life. Ofcourse the responsibility of the discussion leader for choosing positivemodels in this and other sessions is self-evident.
By this tine it will have occurred to most readers that the leader-ship role in this program was sorething more than calling together agroup of people and asking: qlow what uould you like to talk about?"In this instance it uas the leader rather than the participant whosuggested a discussion of the meaning of work and retirement, and hetook the initiative to call on retired people to talk about theirexperiences. The first program shoved the value of the discussion ofwork and retirement, and it uas continued in all subsequent programs.
Income Issues
As might be expected the participants always suggested that theprogram should include a discussion of the sources and amounts ofretirement income, and usually for "strategic" reasons this discussionoccurred during the first half of the program. It will be recalled
56

47,
that participants came to the program by uay of attendance in a mass
meeting called by their local union on the questions of retirement,
social security, and pension benefits.
Every effort was made to give participants an opportunity to make
an accurate estimate of their retirement income. Conpany and union
personnel uere on hand to help compute pension benefits and a social
security resource person attended to answer questions. Follow-up
investigation was encouraged with these as well as other resourcepeople including the worker,s banker and insurance agent because there
was never enough time in one session to investigate all possible
circumstances. It was especially important to have company, union and
social security pemonnel go out of their way to encourage the parti-cipants to cantact them personally if they had further questions.
This session like the one on legal issues depended to a larger
extent than the others on the presentation of a good many facts using
the lecture method. In addition forms were handed out and a beginning
made on computing pension benefits. Other printed materials were
handed out to explain pension and social security benefits.
Ibney-Nanaqement Issues
There was the need not only of knowing how much income would beavailable for retirement from various sources but also hou much it wasgoing to cost to live, and if there wasn't enough money to go around,
what could be done about it. The money-management discussion waspurposefully scheduled far enough in advance to give participants theopportunity to keep an exact record for one month of al] expenditures.Usually a third of the participants decided to keep records and this
experience was adequate for purposes of comparing expenditures before
and after retirement.
The main object of the discussion was to move those participantswho were worried, concerned and feeling helpless to a position ofrecognizing certain practical steps which could be taken including
family budgeting. Retired couples uere often called in to tell how they
had managed financially.
Some of the participants expressed a desire to find gainfUlemployment after retirement because they anticipated the need tosupplement their regular retirement income, but also because theywanted to work for the sake of doing something useftl. When more than
a half-dozen were interested in mployment, time was found to discusswhat it means for an older person to look for a job, what kinds of jobs
are available, and how to approach an employer. Participants pointed
out that it had been a long time since they "had pounded the pavements"
looking for work. It was suggested that those others who did no4 express
an interest in the topic might take a cue from retired workers whosometimes return to work temporarily in order to buy a new stove, a
car or to carpet the living room.
57

Physical Health Issue
To be effective this session needs to involve people who can speak
with authority on questions of health such as a physician, a registered
nurse and a dietician. When a physician participates it is suggested
he discuss the meaning of symptoms, rules for good health, rehabili-
tation procedures, a positive philosophy of potential health, and,
especially the individual's responsibility for maintaining his own
health rather than give a medical school type lecture on the val,_ous
diseases of older people.
Another important consideration in any discussion of the physicalhealth issue is the reluctance of many people to seek out medicalattention, not only when they are sick, but also when they are well.
The style of this particular discussion owes a great deal toDr. Edwin Smith, Associate Professor of Physical fledicine, Universityof iiichigan: who served as a resource person in the experimental programs,prepared the written essay on health which participants read ahead oftime, and advised on the preparation of the film which was used withthis discussion.
Dut probably the most important goal of this discussion is that ofhelping older people recognize that aging is a normal process whichserves a useful biological purpose; that old age and sickness are not
one and the same, and that much can be done by the individual and thehealth professions working together to insure a healthy old age.
Ilental Health Issues
The point of view was taken that stress, strain, frustration and
uncertainty are common feelings of people especially at times of majorphysical and social change, but that the measure of a mentally healthyperson was the manner by which he accepted responsibility for his ownfuture and did something about it.
Uhat are the basic needs of people? What happens when needs arenot satisfied? Is it possible to anticipate our needs in the lateryears and to make decisions which in the long run will enhance ouradjustment to people and our environment? Ho'r would we characterizeolder people we know who have made a success of retirement living?Films, short storeis, still pictures, mental health and retiredresource persons, and discussion itself were intended to help partici-pants find answers to issues of these sorts. Ibreover, there was greatvalue to talking these things over in a group setting. There wasobvious lessening of anxiety in some cases when it was recognized thatmental health concerns were common-among all members of the group.
Finally, chancing mental capacities were discussed and potentialfor maintaining them at a maximum functional level in the later years.In this regard, it is of interest that several of the workers touchedoff the discussion of mental health in terns of the loss of memory inold age.
58

Issues of Familytariends and Living Arrangements
The mutually supportive behavior of husband and wife, relatives
and friends vas enphasized as a crucial element in any attempt to
achieve good adjustment in old age. Accordingly, the idea that we are
"social beings" who require interaction with alid the support of other
people to realize our full potential at all stages of the life cycle
including the retirenent stage was discussed at length as well as those
factors in the later years which mitigate against nu+ually satisfying
social relationships. Individual responsibility for trying to under-
stand the attitudes of children, the need to live one's own life, but
at the same time to accept help uhen it is needed, and the desirability
of sustaining or even expanding onds social life space uere concepts
which were fed into the discussion by the leader and others and reacted
to by the participants.
The questions of where to live in retirenent were discussed first
of all in terms of the changing needs of people from 60 to 90 and
seccmdly in terms of a place to live, having to be something more than a
roof over one's head. Lilling with one's children, living in a hone for
the aged and living alone were given special attention. Participants
uere urged to Observe first hand as many types of housing for older
people as possible. Check lists, essays and short stories uere made
available to help identify the important considerations when moving to
a aeu location, or living with children, in a home for the aged or alone.
The most valuable techniques for stimulating discussion of where to
live in retirement was that of asking tuo couples in the group with
different plans to present their viewpoints and plans to the group for
revieu and discussion.
Legal Issues
Uhen older people in the preretirement education programs were
asked to identify questions of a legal nature, fifteen to twenty
different questions litre frequently expressed uhich the leader put on
the blackboard. Despite this apparent concern the first reactions of
Professor Richard thalmln of the University of ilichigan law School,
who developed materials and served as resource person for this particular
discussion, was under no circunstances should the discussion of legal
affairs take the place of seeking actual legal counsel on an individual
basis.
Uith this injunction in nind what vas covered were such questions
as: Uhat happens if a person does not have a vial? What is the dif-
ference between an executor and administrator? Is it a good idea for
the individual to make his oun uill? Uhat does one need to know about
joint ownership of property? Uhat is the function of the_probate court?
How does one locate a reputable lawyer? Uhat does a lauyer need to know
to make a good will?
59

In this session more than almost any of the others, participants hadmuch misinformation about wills, lawyers, the probate process, what aperson can and cannot do with his property. For th:Is and the otherreasons given it was mandatory to have a lawyer on hand to inform andmonitor the discussion, especially one who was familiar uith wills andprobate procedures.
Issues on the Use of Free Time
The position was taken that the essential starting point for anydiscussion of the use of free time vas the individualls felt needs.Some of these needs are common to many people while others are specificto particular individuals.
Once individuals expressed such needs as the need to be useful,to be mentally alert in their later years, to have friends vho caredvhat happened to them, and to be financially secure it became possibleto discuss sulutions. 14any techniques were used to highlight thealternatives: retired people told about their use of time, a librarianbrought reading materials to the meeting and discussed the resourcesof the public library, an adult educator presented opportunities tolearn in the community, a MCA director presented his program, a scoutleader encouraged the men to volunteer their skills, a city recreationdirector discussed the range of possibilities throughout the community,members of an activitiy center for older people gave first hand experience,and so forth.
Tuo techniques for learning about alternate mays to satisfy personalneeds for activity stand out as more effective than any of the others:1) participants mere encouraged to visit various opportunities forretirement activity, including opportunities to render volunteer serviceand to report to the class on their findings and 2) participants plannedand conducted a "show and tell" kind of exhibit of their interests,activities, hobbies, or skills as part of the session on activity orthe final summary session of the project. Actually in a group of 20manual vorkers and their wives, it vas not unusual to find a wide rangpof activities and interests some of which uaited for expression untilmore time was available. Host of the men mere vorking six days a weekand some overtime each day at the time of the program. It was easy tounderstand, therefore, why frequently their first reaction to thequestions of free time was that they were eager to have more of it inwhich they would have to do nothing. This hurdle vas usually overcomeby asking participants to put on the blackboard what they thought atypical weekday in retirement mould look like and testing the contentsof a typical day against needs of the individuals in the group.
Issues in the Utilizatic-ounturces
The responsibility for adjustment in retiremenA should be shared bythe individual and the community in vbich he lives.7 Por this reasonevery effort vas made to maximize contacts betueen the older vorkers in
60
the program and leaders of community programs and services of special value
to older people. It is axiomatic in the first place that the present gen-eration of older people are not as auare of community resources astomorrauts generation of older people will be and todayfd older people
sonatimes have misgivings about using what community resources exist.
Tuo approaches were tested. One approach considered resources atthat session when it was appropriate to do so while the other approachwas having an entire session devoted to all kinds of community resources--health, recreation, financial, housing, education, employment, counselingand religions. The conclusion uas reached that it was more meaningfulto use the former approach, i.e., to discuss the health resources duringthe discussion of health.
The Final Session
Although certain things can be expected to happen at the finalsession, it, like the first sessions, requires careful planning by theleader. Participants like to talk about their participation in theprogram and to tell what it meant to them. Almost without fail parti-cipants will say they are sorry the program is ending, and sometimesthey take the initiative and maize plans to continue relationships withothers in the group after the meetings. Also participants frequentlyexpress their pleasure on having made neu friends in the program.
Thus the final session should be planned to achieve several purposes:1) to reinforce decisions which participants have made in reference toretirement living 2) to make it possible for participants to expresstheir feelings about the program and the participants in it and 3) toencourage participants to continue their preparation for retirement.
In sum, the purpose of these short summaries ima to convey the conceptsand principles which guided the leadership in th:,, conduct of the pre-retirement education programs, and at the same time to give a feelingfor what it was like for the participants and the leader to become involvedin the discussions. Issues were the focal point for discussion. Manyof the issues uere presented by the older workers; others were presentedby resource persons or the discussion leader. In this regard, it wasstated that the leaders shared responsibility for insuring that themaximum number of retirement issues came under scrutiny. It followsthat leadership no matter how skilled it may be in group discussiontechniques must have the additional skill of recognizing or presentingissues which are peculiar to older people about to retire. Hot onlyrust the leader know the issues, he must be in firm grasp of manyalternative solutions. For this reason one of the outgrowths ofthe present research at the University of iachigan has been a major movein the direction of training leaders to conduct preretirement educationprograms.

References
r 1. Hunter, U. U. 1965. Preretirement education for hourly-rated workers. w
Ann Arbor: The University of Hichigan, Division of Gerontology.
(Himeographed)
\lilt 2. Hunter, U. T. 1968. Preparation for retirement. Ann Arbor: The u
University of Hichigan, Division of Gerontology.
3. Films may be rented or purchased by uriting to the Audio-Visual
Education Center, The University of Hichigan, 416 Fourth Street,
Ann Arbor, Hichigan.
/;. Hunter, IT. U. (In Press) Thematic pictures of older people. Ann Arbor:
The University of Hialigan, Division of Gerontology.
kl 5. Hunter, U. IT. (In Press) Leader's guide for preretirement education.
Ann Arbor: The University of Hichigan, Division of Gerontology.
6. Thompson, II. E. 1958. Preretirement anticipation and adjustment in
retirement. J. Social Issues, 14, no. 2, 35-45.
7. Kutner, Bernard, Tanshel, D., Togo, Alice 11.1 and Langler, T. S.
1956. Five hundred over sixty. Hew York: Russell Sage Foundation.
8. Blood) R. 0.3 Jr. and Wolfe, D. II. 1960. Husbands and wivesthe
dynamics of married living. Glencoe, Illinois: The Free Press.
9. Hunter, IT. IT. 1967. Cooperation between industry, labor and the
community in retirement education. Int. Review of Community
Development, H.S. 17-18, pp. 103-118.
62

III. :INDIUGS 02 TIE STUDY
The present study was an attempt,to explore the effects of partici-
pation in a preretirement education program on the adjustment in retire-
ment of automobile workers living in the Detroit Hdtropolitan Area. The
criteria used to measure adjustment to retirement were of two kinds:
1) mean scores on general indexes of morale, satisfaction with life,
self-other concepts and attitudes toward retirement and 2) mean scores
on a number of indexes which were presumed to measure adaptive behavior
in specific areas of retirement living such as the health, financial and
family areas.
ethods of Analysis
flean scores on the various indexes were computed from data which were
collected from the experimental and control panel of subjects at three
times, once during the months prior to retirement, a second time 6 to
12 months after retirement and a third time 18 to 24 months after retirement.
A test was applied to the mean scores for each of the three periods
in order to test the null hypothesis that there were no differences in
the mean scores of experimental and control subjects. In regard to this
and the other statistical tests of significance which 'were used in the
study, the null hypothesis was rejected if observed differences were
significant at the .05 or greater level, and in these cases where experi-
mental subjects had significantly larger mean scores it was concluded
that the differences were due to their participation in the preretirement
education program.a
The formula which was used to test the differences between mean
scores is as follows:
t =
1)2
(N1+ N
2- 2
j1
-5.
degrees of freedom = N1+ N
Z- 2
Following the analysis of man scores a test was applied to the meanchange scores of experimental and control subjects on each of the indexes
and for each of the three periods of the study. The null hypothesis which
van tested in this instance was that there were no differences in mean
change scores of experimental and control subjects on the various indexes.
The formula which was used to make the test follows on the next page.
a It will be recalled in a few instances that a significantly smaller
mean score was in the desired direction.
63

-
u1
2u2
2
+NN
1 2
where :es = cftange scores
1
2= variance of change scores
Z is a normally distributed variableFinally the experimental and the control populations were divided
into six sub-groups based on race, language spoken in country of birth,years of school completed, income and occupation. Here the objective wasto test the null hypothesis that the differences between experimental andcontrol subjects on mean scores and on mean chance scores were equal foreach sub-group. The formula which was used in this instance is as follows:
7'4)
2 , 253
2S4
9
'31 °2+ + +
N1 N2 N3 N4
where X's = mean score or mean cliange score, S2 = variance of the scoreor change score, Z is a normally distributed variable, and for example
where Xi = mean scores of white experimental subjects, X2 = mean scores
of white control subjects, X3= mean scores of degro experimental subjects,
and X4= mean scores of Negro control subjects.
The Analysis of flean Scores
The mean scores for the three indexes which were used as generalcriteria for adjustment before and after retirement are presented inTable 32 on the following page. Before retirement control subjectsachieved higher mean scores on each of the measures and in one instance(morale) the difference in favor of the control subjects was significantat the .01 level. The data for each of the indexes also indicate thatdespite differences before retirement, the two groups differed very littleby the end of the first or the second year.
Table 32 also shaus that both experimental and control subjectsdeclined in satisfaction with life and in morale by the end of the firstyear, but that this decline was reversed by the end of the second year.Apparently, for these subjects retirement had the immediate effect ofreducing adjustment, but adjustment also appears to have improved astime went on.
Uhereas the satisfaction with life and morale scales were intendedto index overall adjustment, the adjustment to retirement index presented
614

TABLE 32. EXPERIIIENTAL AND CONTROL SUBJECTS COI,E3ARED OIT THE BASIS
OF HEM SCORES ON GENERAL ADJUSTIENT 1.1EASURES
Ho.a General adjustmentmeasures
lIean scores
Experimentalb Controlb NE-Licc value Sig.
1 Satisfaction with Life (Positive score: 0-3)2.23 2.43 -.20 1.38
1.54 1.54 -.00 .00
1.57 1.64 -.07 .60
Pre-R1R-1R-2
2 Horale (Positive score:Pre-R1R-1R-2
0-7)
4.233.793.86
4.903.993.93
-.67 2.73 .01-.20 .92
-.07 .34
3 Adjustment to Retirement (Positive score: 0-2)Pre-R1 1.00 1.23 -.23 1.57R-1 1.59 1.60 -.01 .14
11-2 1.71 1.71 .00 ,00
1111.
a For further information about measures see Table 31 and Appendix .2.b The numbers of experimental and control subjects at the three phases
of the study presented in this and the other tables in this sectionare as follows:Phase Experimental Control TotalPre-R1 70 70 -1E5-R-1 70 70 14072-2 63 59 122
c In this and in subsequent tables nellc should be read "mean scoreof experimental subjects minus the mean score of the control subjects."
in Table 2.2 measures two specific aspects of adjustment to retirement--the time it takes to get used to not working and the problem of keepingoccupied in retirement. It appears before retirement that both groupshad some misgiving about these particular aspects of retirement, but thatafter retirement the problems of not working and of keeping occupiedwere not as difficult to solve as had been anticipated.
In Table 33 on the following page, as in Table 32, the reader willobserve that nearly all of the differences betueen the mean scores ofexperimental and control subjects are negative, meaning, of course, thatcontrol subjects had higher mean scores than experimental subjects. Tuoof the differences in favor of the control subjects uwe significant atthe .05 level.
Self-concept of age as measured by the question "Hau do you thinkof yourself as far as age goes-middle-aged, elderly, old or what?"appears to have remained fairly constant during the first two years of

TABLE 33. EXPERIDENTAL AND CONTROL SUBJECTS COIPARED ON THE BASISOF MAN SCORES ON SELF-CONCEPT HEASURES
No. Self-conceptmeasures
OPIIMOMMINIMIL
Nem score
Dcperimental Control NE-IIc value Sig.
4 Self-Concept of AgePre-R1R-1R-2
(Positive.66
.71
.70
score: 0-1)
.76 -.10 1.29
.68 +.03 .40
.73 -.03 .37
5 Self-Other Conparisons - -A (All subjects; positive score: 0-4)R-1 1.64 1.91 -.27 1.41R-2 1.24 1.54 -.30 1.72
6 Self-Other Conparisons--B (iihrried subjects only; positive score: 0-6)R-1 2.34 2.90 -.56 2.10 .05
R-2 1.44 1.61 -.17 .85
7 Attitude Toward Retired People (Positive score: 0-13)-1.81 2.37 .05
.53 .89- .43 .62
Pre-R1 10.19 12.00R-1 11116 12.14R-2 11.40 11.83
retirement. On the other, hand, all subjects as well as only thosesubjects who were married shaued decreasing mean scores on the Self-Otherindexes numbers 5 and 6 which asked the subjt.ct to declare wheth3r whencompared with other older people he knew he felt advantaged or disad-vantaged in regard to several basic aspects of living including health,standard of living, and relationships with family and friends.
Subjects' attitudes tauard retired people in generOvere indexedby measure number 7 in Table 33. The attitude of experimental subjectsimproved over the tuo-year period while that of the control subjectsdid not improve. Change scores will be examined in later analysis totest whether this difference vas significant.
Table 34 contains mean scores in the four remaining general typeindexes used in this study. A preparation for retirement index askedsubjects before and after retirement hovrvell prepared they vere forretirement. Their responses indicat3 that after retirement they thoughtof themselves as better prepared than before retirement. This isinteresting because only in retirement could one test his state ofreadiness against reality.(see Table 3)4 on following page).
At all three stages of the study experimental subjects thought ofthemselves as being better prepared for retirement than control subjects.Similarly, before and after retirement the attitude of experimental subjectstoward retirement was better than that of control subjects as measured
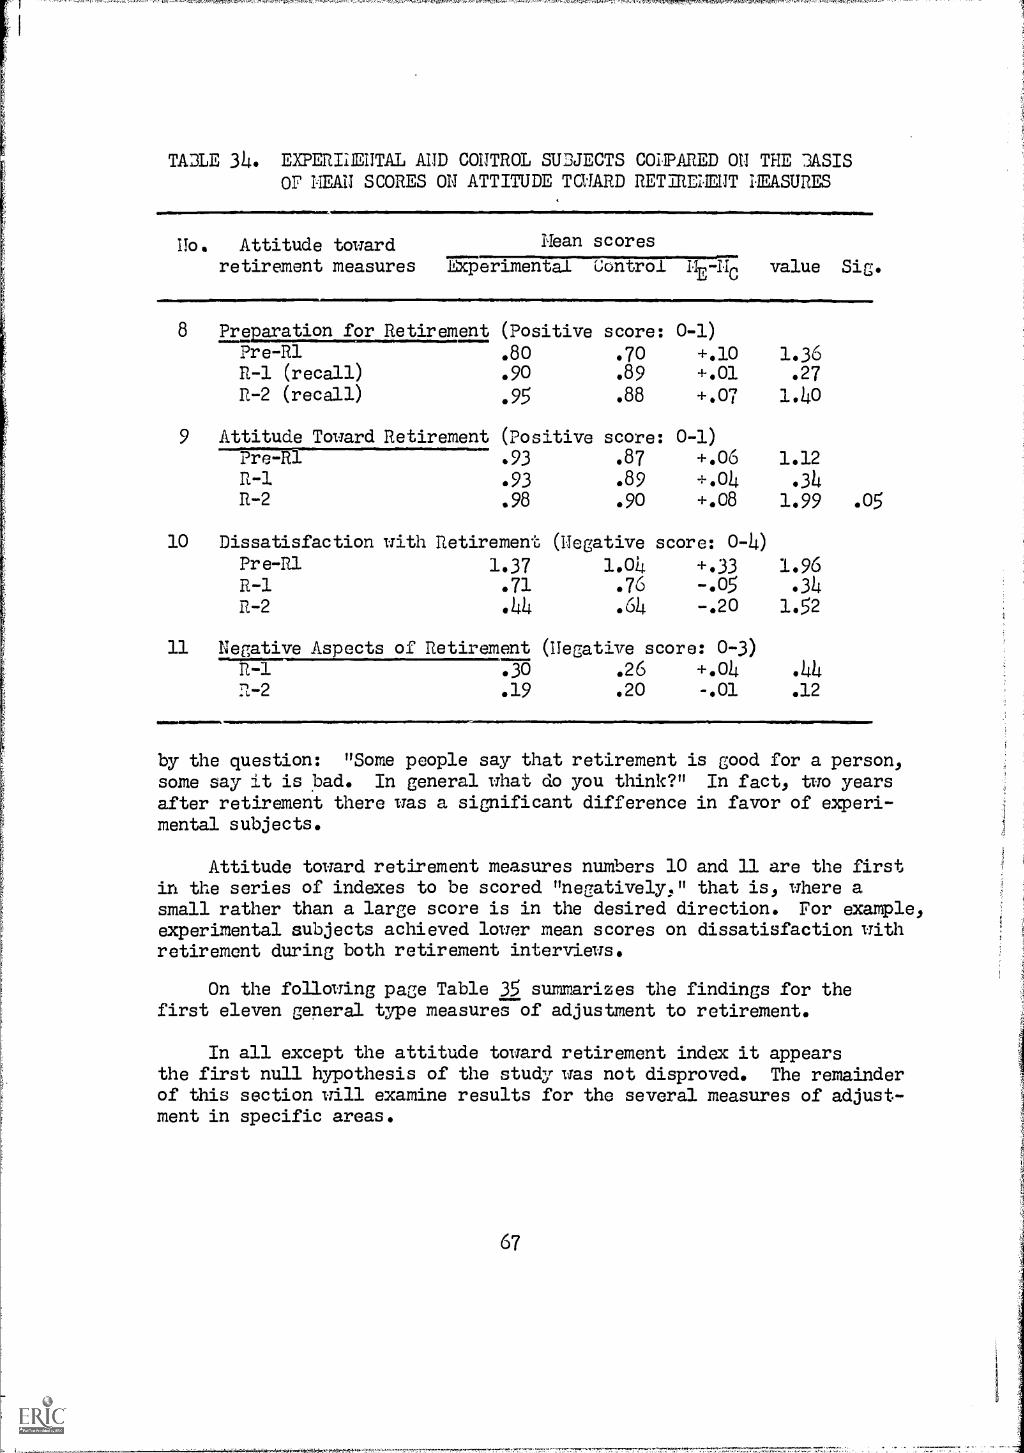
TULE 34. EXPERIMITAL AHD CONTROL SU3JECTS COMPARED ON THE 3ASISOF MEAN SCORES ON ATTITUDE TCUARD RETEZEIENT EASURES
No. Attitude tauard Mean scores
retirement measures Experimental Uantrol 14E-Uc value Sig.
8 pre aration for RetirementPre-R1R-1 (recall)R-2 (recall)
9 Attitude Toward RetirementPre-R1R-1R-2
10 DissatisfactionPre-R1R-1R-2
(Positive.8090.95
(Positive.93
.93
.98
with Retirement
1.37.71
.44
11 Negative Aspects of Retirement
score: 0-1)
.70 +.10 1.36
.89 +.01 .27
.88 +.07 1.40
score: 0-1). 87 +.06 1.12.89 +.04 .34.90 +.08 1.99
(Negative score: 0-4)
1.04 +.33 1.96.76 -.05 .34
.64 -.20 1.52
(Negative score: 0-3)R-1 .30 .26 +.04a-2 .19 .20 -.01
.44
.12
.05
by the question: "Some people say that retirement is good for a person,some say it is bad. In general what do you think?" In fact, tuo yearsafter retirement there was a significant difference in favor of experi-mental subjects.
Attitude touard retirement measures numbers 10 and 11 are the firstin the series of indexes to be scored "negatively:" that is, where asmall rather than a large score is in the desired direction. For example,experimental subjects achieved lauer mean scores on dissatisfaction withretirement during both retirement interviews.
On the following page Table 3.5 summarizes the findings for thefirst eleven general type measures of adjustment to retirement.
In all except the attitude touard retirement index it appearsthe first null hypothesis of the study was not disproved. The remainderof this section will examine results for the several measures of adjust-ment in specific areas.
67
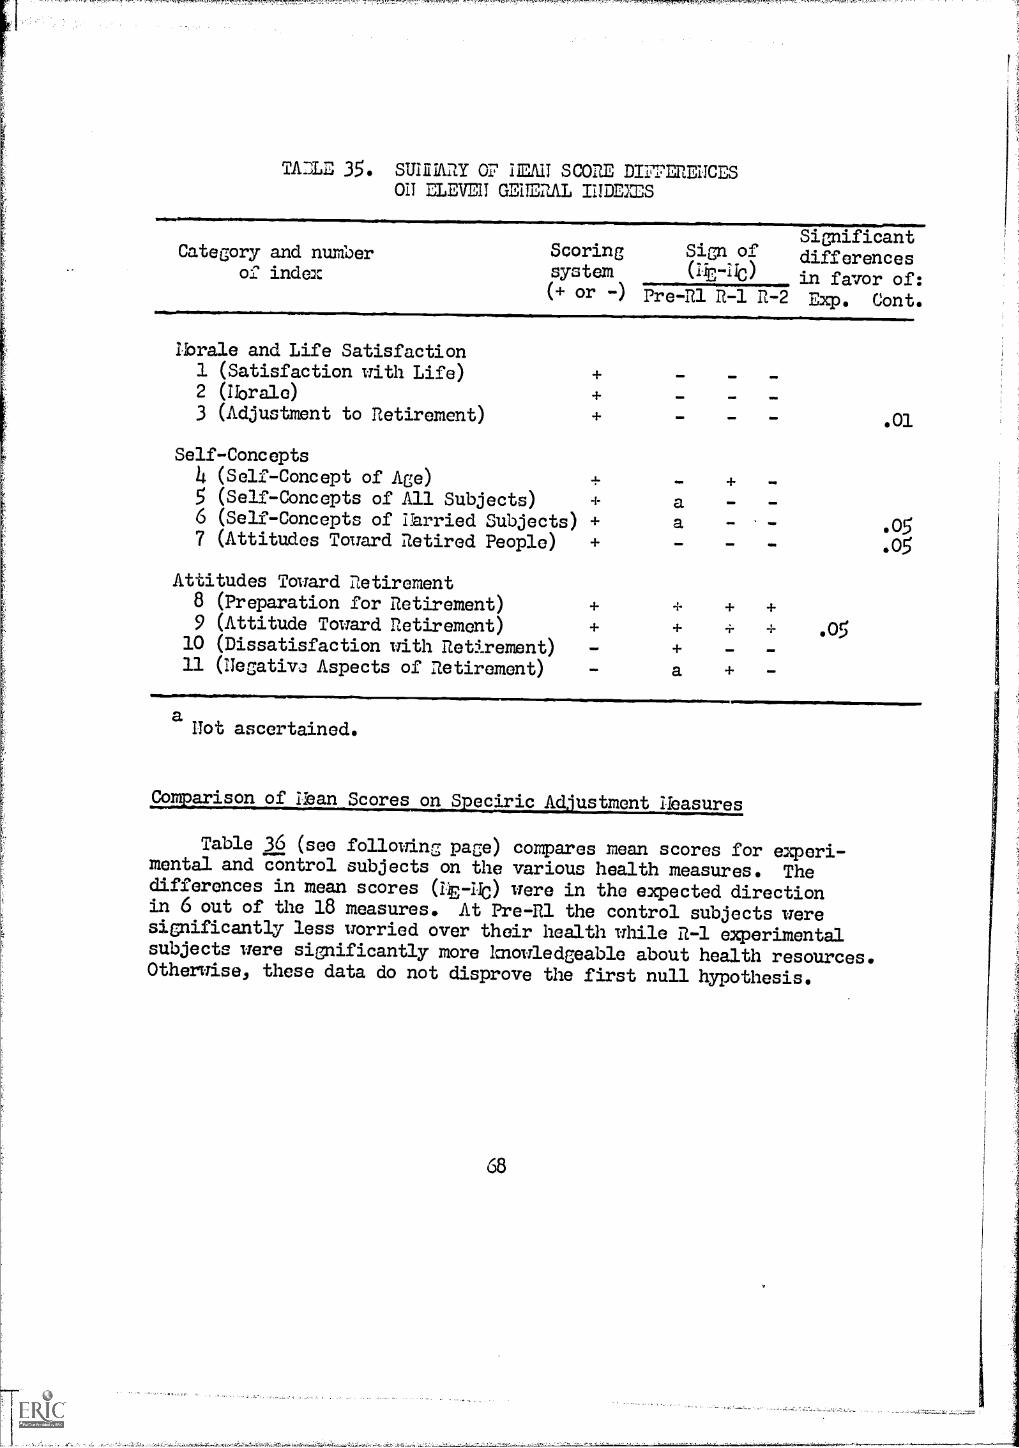
0.111.1.
TADLE 35. SUITIARY Or IOW SCORE DETERENCESOH ELEVEN GEITERAL IiiDDS
Category and numberof index
SignificantScoring Sign of differencessystem in favor of:(+ or -) Pre-R1 R-1 R-2 Exp. Cont.
flbrale and Life Satisfaction
1 (Satisfaction with Life)2 (ilbrale)
3 (hdjustment to Retirement)
Self-Concepts4 (Self-Concept of Age) +5 (Self-Concepts of All Subjects) +6 (Self-Concepts of Harried Subjects) +7 (Attitudes Toward Retired People) +
Attitudes Touard Retirement
a .11111
a
IMO
1110 .01
.05
.05
8 (Preparation for Retirement) + + + +9 (httitude Toward Retirement) + + + .05
10 (Dissatisfaction with Retirement) - + -
11 (Negativ3 Aspects of Retirement) - a + 11=11,
aHot ascertained.
arison of nean Scores on S eciric Ad ustment fleasures
Table 36 (seo followinc; page) compares nean scores for experi-mental and control subjects on the various health measures. Thedifferences in mean scores (11E-11c) were in the expected directionin 6 out of the 18 measures. At Pre-R1 the control subjects weresignificantly less worried over their health while R-1 experimentalsubjects were significanqy more knowledgeable about health resources.Otheruise, these data do not disprove the first null hypothesis.

TABLE 36. EXPERIMITAL AND CONTROL SUBJECTS CO:ARED OH THE BASISOF iTAIT SCORES OH HEALTH MASURES
LAIIIM.111.
No. Health measures 11/11.10NENOIIIMMONW1111I
Mean scores
Experimental Control hh-lic value Sig.
12 Physical Health Index (Hegative score: 0-16)R-1 1.96 1.43 +.53R-2 1.21 1.10 +.11
13 Self-Appriasal of Health (Positive score: 0-4)Pre-R1 2.29 2.44R-1 2.43 2.43R-2 2.17 2.29
-.15.00
-.12
14 Attitude Tauard Health (Positive score: 0-5)
3.81 3.77 +.04R-2 3.17 3.22 -.05
15 Worry Over Health (Negative score: 0-1)
.30
.20
.07
Pre-R1 .54R-1 .23R-2 .17
16 nental Health index (Negative score: 0-7)--h-1 1.77 1.47
R-2 1.48 1.14+.30+.34
1.56.29
.82
.00
.83
.21
.24
2.96 .01
.411.81
1.301.24
17 Knowledge AboutHealth Resources (Positive score: 0-1)R-1 .40 .23 +.17 2.19R-2
.25 .19 +.06 .89
18 Disposition to Use Health Resources (Positive score: 0-4)R-1R-2 3.01 2.81 +.20 1.32
3.11 3.02 +.09 .53
19 Use of Health Resources (Positive score: 0-5)R-1
3.79 3.67 +.12 .57a-23.68 3.83 -.15 .73
05
The data in Table 37 on the next page indicate that experimentalsubjects tended to achieve in time higher mean scores on measures ofattitude toward income and money management. Whether or not the trendis a significant one will be examined in the succeeding section ofthe report.
69

TAME 37. EXPERIDENTAL AND CONTROL SUBJECTS CO.NPARED ON THE BASISOP NEKO SCORES ON FINANCIAL NEASURES
No.Nean scores
t value Sig.Financial measuresExp. Cont. ITE-Nb
20 Attitude Toward Income (Positive score: 0-3)Pre-R1 2.43 2.73 -.30 2.46 .02R-1 2.63 2.76 -.13 1.24R-2 2.76 2.68 +.08 .66
21 Money flanagement (Positive score: 0-6)R-1 2.41 2.24 +.19 1.28R-2 1.41 1.37 +.04 .36
...111rw" ilmelaa=041.711101...NOINIMANW NON.M11.11001
Hean scores on social relationships with spouse, children, relativesand friends, as well as feelings of social deprivation, are presentedin Table 38. The data shou that in 7 out of the first 10 mean score
TABLE 38. EXPERINENTAL AND COUTRCL SUBJECTS COITARED ON THE BASISOF EAN SCORES ON FATIELY AND FRIENDS NEASURES
No. Family and friends ean scores Sig.measures Exp. Cont. NE-Eb value
24
25
26
27
28
29
30
Marital Relations (Positive score: 0-7)R-1R-2
CompanionshipR-1R-2
4.27 4.64 -.373.78 3.68 +.10 .30
1.00
in Yarriare (Positive score: 0-4)2.50 2.53 -.03 .132.62 2.47 +.15 .58
Satisfaction uith Children (PositiveR-1R-2
2.74 2.692.29 2.07
score: 0-6)
+.05+.22
Satisfaction with Relatives (Positive score: 0-5)R-1R-2
2.31 2.19 +.121.90 1.85 +.05
.18
.32
. %
.32
gatisfaction with Friends (Positive score: 0-3)R-1 1.39 1.36 +.03 .21R-2 1.19 1.27 -.08 .69
Social Deprivation Index A (Harried; Negative score: 0-8)
.391.20
1.84 1.93 -.09R-2 1.25 1.54 -.29
Social Deprivation Index B (Not married; Negative score: 0-5)1.46 1.51 -.05 .31
R-2 .94 1.19 -.25 1.23
70

differences, experimental subjects had a higher score than the controlsubjects, and also that experimental subjects felt less social depri-vation one year and two years after retirement. :jut, no one of thedifferences was significant at the .05 level of confidence. In additionto the above measures, fanny adjustment data uhich explore changes infamily decision making and division of labor arc presented at the endof this chapter.
Dean scores on tuo series of indexes renain to be examined. Table 39
TADLE 39. EXPE=MITTAL AND CONTROL SUDJECTS COIIPARED OH THE DASISOF liEAH SCMES OH A HOIE AHD COliilUITITY IlEASURE
Home and communityHo. measure
Hean scores
Experimental Control DE-11c valueSig.
31 Satisfaction withHome and Community (Positive score: 0-3)R-1 1.60 1.44 +.16 1.02R-2 .79 .93 -.14 1.09
shows that there was a narked decline in the extent of satisfaction withhome and community, but, unfortunately, the data were so combined thatit is not possible to tell whether it was the home, the community, orboth uhich figured in the decline in satisfaction.
Patterns of Activity
The final series of data, which will be exanined in order to testthe first null hypothesis, is presented in Table .4s2 on the followingpage. Subjects were asked to declare, in regard to approximately 20activities of all kinds, whether they engaged in each of them "often","sometimes", "hardly ever" or "never". The subject must have reportedthat he engaged in the activity "often" in order to be scored plus oneon the index.
As indicated earlier, there uas considerable discussion among theexperimental sul)jects in the preretirement education programs of thevalue of purposeful activity as a means touard achieving satisfactoryadjustment to retirement. The need to rest and relax was judged tobe equally inportant in order to restore physical strength and a senseof well-being. Reading books, magazines and newspapers, attending playsand movies, vatching television, and listening to the radio uereconsidered to be effective means for learning, keeping up with thetimes, identifying important social issues in our society or forappreciating the arts. Activity with other people including spouse,members of the family, friends, co-learners and co-uorkers was givenpriority. The desirability of engaging in a variety of activities is
71
,'

reflected in the various indexes shown in Table 40.
TABLE 40. EMPERIMITAL AND CONTROL SUBJECTS COI2ARED ON THE BASISOF LEAN SCORES ON ACTIVITY lEASURES
No. Activity measures-.Eban scores
averimental Control valueSig.
.4.0..11111
32 Total Activity IndexPre-R1R-111-2
(Positive score:
6.918.338.98
0-19)
7.99 -1.088.01 .328e49 49
33 Sedentary Activity Index )Positive score: 0-8)
34
Pre-R1 2,89 3.07 - .18R-1 3.08 3.16 - .08R-2 2.68 3.41 .27
Physical Activity Index (Positive score: 0-4)1.96 2.01 - .05
*7) 12.18 2.29 - .11
12-2 2.33 2.41 - .08
35 Hass Hedia Activity Index (Positive
36
score: 0-4)Pre-R1 1.31 1.71 - .40R-1
1.50 1.78 - .28R-2 2.10 2.00 + .10
Social_Activiti Index APre-R1 3.11 3.77 - .66R-1 )4.01 3.51 + .50R-2 4.03 3.66 + .37
37 Activity with Family and Friends (PositivePre-R1 2.10 2.66R-1 2.51 2.25R-2 2.60 2.39
38 Individual Activity Index (Positive score:Pre-R1 3.97 4.)47n-1
4.4)4 4.6312-2 5.13 4.98
amIll=11.=0111.mmlsele
1.91.61.92
.67
.26
1.05
.31
.60
.37
2.39 .02
1.57.58
1.921.641.05
score: 0-5)
- .56 2.21 .05+ .26 1.13+ .21 .84
0-11)
+ .50 1.46+ .19 .57+ .15 .44
The mean score of experimental subjects exceeded those of the controlsubjects in half of the instances. In two of the remaining cases, controlsubjects had significantly higher mean scores. Thus, it appears thatthe null hypothesis, with reference to each of these measures, was notdisproved.
72


TABLE 41. TESTS OF SIGNIFICANCE OF THE DIFFERENCES III AN CHANGE SCORESON EIGHTEEN INDEXES MICH UERE ADHINISTERED DURING THE YEARPRIOR TO RETIRENENT, THE YEAR AFTER AND TUO YEARS AFTER RETIREMENTa
Category, numberand
name of measuresPre-R1-to R -lb Pre-R1 to R-2c R-1 to R-2d
Z Sig. Z Sig. Z Sig.
General Adiustment heasures1 Satisfaction with Life 1.30 .11 1.382 ilbrale 1.74 .10 1.57 .003 Adjustment to Retirement 1.41 .89 .20
Self-Concept i]easures--4 Self-Concept of Age .71 .27 .02
7 Attitude Toward Retired People 1.61 .91 .45
Attitudes Toward Retirement8 Preparatibn for Retirement .91 .11 1.139 Attitude Toward Retirement .26 .38 .27
10 Dissatisfaction with Retirement 2.20 .05 2.24 .05 .86
Health ileasures
13 Self-appraisal of Health .82 .19 .8915 Ubrry over Health 2.32 .05 1.13 1.48
Financial fleasure20 Attitude Toward Income 1.36 2.28 .05 1.41
Activity fleasures32 Total Activities 2.34 .05 2.27 .0533 Sedentary Activities 1.49 2.10 .0534 Physical Activity .26 .1835 Hass Media Activity 1.17 2.42 .0536 Social Activity A 2.68 .01 2.26 .0537 Activity with Family 2.63 .01 2.37 .05
and Friends38 Individual Activity .148 1.66 .64
.381.03.05
1.57.03
.10
a A (Z) value of 2.58 is significant at the .01 level, 1.96 at the .05level, and 1.64 at the .10 level. Only those differences which weresignificant at the .05 or greater level were considered significant forthis study. On the other hand those differences which were significantat the .10 level or at approximately the .10 level are of interest becausethey indicate differences in the desired direction.
b See Table 55, Appendix 1.
c See Table 56, Appendix 1.d See Table 57, Appendix 1.
7)4

In addition, the comparison of change scores from Pre-R1 to R-1on the general adjustment measures, although not statistically significantat the .05 level, suggest that experimental subjects tended to scorebetter on these indexes as yell.
The results of the tests of mean change scores for the period Pre-R1to R-2 indicate that four of the first-year gains among experi entalsubjects persisted into the second year of retirement and that experi-mental subjects added a new gain by virtue of their larger scores onattitude tauard income. On the other hand, differences in favor ofexperimental subjects on the tuo activity indexes, number 36 and 37became less marked.
Table 42 presents similar results for the other 18 scales or indexesuhich were only administered one year and tuo years after retirement.
TABLE 42. TESTS 02 SIGNIFICANCE OF THE DIFFERENCES Ill TAN CHANGESCORES 011 EIGHTEEN INDEXES UHICH IMRE ONLY ADMINISTERED DURINGTHE YEAR AFTER RETIRMENT AHD AGAIN TITO YEARS AFT&I. RETIREMEHT
Category, number and name of measuresaR-1 to R-2b
Z value Sig.c
Self-Concept Neasures--7Self-Other Comparisons A
6 Self-Other Comparisons B (Harried)
Attitudes Toward Retirement-11 Negative Aspects of Retirement
Health fleasures12 Physical Health Index
14. Attitude Touard Health16 Hental Health Index17 Knowledge About Health Resources18 Disposition to Use Health Resources19 Use of Health Resources
Esaaltnammal
1,414
.23
1.07
.54
.511.140
. 37
.77
21 oney lianagement
FamilI and Friends and Livin Arran,ementsG,80
1.50ri a ions25 Companionship in liarriage .9726 Satisfaction uith Children .7627 Satisfaction with Relatives .2928 Satisfaction uith Friends .7729 Social Deprivation A (Narried)
.5430 Social Deprivation B (Hot married) .8331 Satisfaction uith Home and Community 1.72
a The other tuo indexes utich were administered at R-1 and R-2--theDecision 'raking Pouer Index and the Family Division of Labor Index--uere discussed in the proceeding section.
b See footnote (a) to Table 41.There were no differences significant at the .05 or greater level.
75

Tables 41 and 42 show that there were no differences in mean changescores of any significance during the period II-1 to R-2.
To summarize, an analysis of mean chillge scores disclosed significantdifferences between the experimental and control subjects and sonte ofthose differences persisted into the second year of retirement. Thus itwas possible to reject the null hypothesis and to credit the preretirementeducation program with having facilitated the adjustment of experimentalsubjects as measured by these particular indexes.
2212.A:ustrient of Sub-Groups of Older People
To explore the possibility that the preretirement education programhad different effects on different kinds of automobile workers, datawere analyzed to test the null hypothesis that there were no differencesin mean scores between six sub-groups of the experimental and controlpopulation on 23 measures of adjustment in retirement. The sub-groupswhose mean scores were compared in this fashion were as follows:
1. Uhite compared with negro subjects.
2. Subjects born in an English speaking country compared withsubjects who uere born in a non-English speaking country.
3. Subjects who were married compared with subjects who uerenot married.
4. Subjects who completed eight or more grades compared withsubjects who completed fewer than eight grades in school.
S. Subjects with $6,000 or more income compared with subjectswith less than 6,000 income.
6. Subjects who were engaged in skilled occupations comparedwith subjects who were engaged in unskilled occupations.
Table 43 on the following page presents significant differences inmean scores from among 414 tests uhich were computed on the basis of sixsub-groups and 23 indexes (results for all 414 tests are presented inTables 58 to 63 in Appendix 1). The results in Table 43 for all thesub-group analyses except those based on race and education could haveoccurred by chance. In regard to the comparisons on the basis of raceand education, the results suggest that the program may have been moreeffective for white subjects and subjects who had more education, andthat further study is needed to confirm or reject these possibilities.
76

TABLE 43. A SMEARY OF THE EFFECTS OF THE PRERETIREHENT EDUCATIONPROGRA ON VARIOUS SUB-GROUPS OF SUBJECTS AS HEASUREDBY lEAN SCORES
Sub-groups of subjectsa Significant Z valuesb
and name of index Pre-R1 R-1 R-2
1 florale 3.635 Attitude Toward Retirement 2.00018 Dispo ition to Use Health Resources 3.13824 Companionship in Harriace 2.632
EnRlishBorn in Non-English Speaking Country16 Eental Health Index 2.882
Harried vs. Not Harried3 Adjustment to Retirement 2.000
27 Satisfaction uith Relations
Subjects Ubo Completed 8 Grades vs.Subjects Uho Did Not Complete 8Grades of School11 Negative Aspects of Retirement 2.60032 Total Activities 2.47636 Social Activity 2.159
06,000 or Ebre Income vs.Less Than :X),UUU
5 Self-Other Comparisons A
Skilled vs. Unskilled Uorkers(no test was significant)
2.500
2.250
Sixty-nine tests were computed for each of the 6 sub-croups, or atotal of 414 tests.
b For results of all tests see Tables 58. to 63 in Appendix 1. Anormally distributed Z = 1.96 at .05 level; 2.58 at .01 level and3.29 at .001 level of sicnificance.
A number of additional tests were computed on the premise that meanchange scores might be a more sensitive measure of differential effectof the program on sub-croups. Table 44 presents only those tests ofmean change scores which were sicnificant. In each of the analyses ofthe sub-group data one could expect tuo results significant at the 05level. Uith this criterion in mind it appears that there was a notabledifference in favor of white subjects in money management propensity,

and it seems reasonable to conclude that observed differences in dis-satisfaction with retirement in favor of white subjects were in factsignificant ones.
TABLE 44. A SMEARY OF EFFECTS OF THE PRERETIREENT EDUCATION PROGRAIION VARIGUS SUB GROUPS OF SUBJECTS AS ITASURED BY LEAN CHANGE SCORES
Sub-groups of subjects,reference number andname of indexa
Significant Z valuesb
Pre-R1 Pre-R1to to
R-1 R-2
R-1to
R-2
White Subjects vs. Nepxo Subjects
2.179--T-elf-Concept of Age13 Self-Appraisal of Health 2.12421 Ebney I,Tanagement
aUects Dorn in Englighlualing
3.317
Country vs. Subjects Dorn in Hon-EnglishSpeaking Country
1.9879 Attitude Tauard Retirement10 Dissatisfaction with Retirement 3.43212 Physical Health Index 2.84718 Disposition to Use Health Resources 2.651
Subjects with %,000 or floreIncome vs. Subjects with LessThan lA5,000 Incomn
2.31632 Total Activities
aThirty-nine tests were computed for each of the three sub-groupsor a total of 117 tests.For results of all tests see Tables 64 to 66 in Appendix 1,A (Z) value of 1.96 is significant at the .05 level, 2.33 atthe .02 level, 2.58 at the .01 level and 3.29 at the .001 level.
Thus the comparison of sub-groups on the basis of mean scoresand mean change scores suggest the possibility that race and educationare important variables v'lich require further study with automobile andother kinds, qf ,pnual workers. On the basi$ ofprevious studies ofretirement''''' it vas presumed that incomn would have a strong effecton adjustment in retirement. This presumption is not supported by thefindings of this study.
Social Structure of the Family in Retirement
Previous investigations 14,5 as well as more informal contacts witholder people suggested the possibility that retirement produces changein family social structure. The social structure of a family has been
78

defined by Blood and Wolfe as the,positions which the marriage partnersoccupy in relation to each othor.4 The tuo most important aspects offamily social structure, according to Blood and Wolfe, are the powerpositions of the members and the division of labor between them.Together the pattern of power and division of labor determine the frame-work within which the family functions.
Blood and Wolfe define power as the ability of one partner toinfluence behavior of the other. Power is most clearly revealed in theability to make decisions affecting the life of the fam4y. The powerto make decisions may be divided equally between husband and wife or itmay be exercised predominantly by one or the other marriage partner.
The division of labor is revealed by the pattern of roles whichmarriage partners have developed. Typically, some roles are performedby the wife, others by the husband and some by either husband or wife.
Tuo indexes were developed by Blood and Wolfe to measure thebalance of power between husbands and wives and the division of laborbetween them. These indexes were adapted for use in the present studyto test whether or not family social structure among automobile workersand their wives changes after retirement.
It will be recalled that wives of experimental subjects wereencouraged to take part with their husbands in the preretirement educationprograms because the position was taken not only that husbands and wivosshould share in the task of making decisions about retirement but thatthey should be encouraged to develop patterns of retirement activity whichwere mutually satisfactory. Hence, in using Blood and Wolf's indexesutich measured power in decision making and division of libor betweenhusband and wife it was presumed that experimental subjects would in timemove more frequently tauard a middle position on the indexes than thecontrol subjects. As will be shown, the middle position on the indexesis that position where husbands and wives are equally involved in makingdecisions or performing a role.
The Power to flake Decisions
Ten decisions Imre used to index the relative balance of powerbetueen automobile workers and their wives, as follous:a
I. Uhat car to buy?
2. How much money the family can afford to spend weekly on food?
3. Uhat to have for meals?
L. Uhat repairs to make on the house?
aItems 1,2,5 and 10 are to be found in the original Blood and Wolfeindex. The other items were added for this investigation.
79

5. Where to go on a trip?
6. Whether to have children or relatives COMB for a visit?
7. Whether to go to a doctor when someone is sick?
8. What to do for children or relatives?
9. What to do when going out for Ihe evening?
10. Whether the husband should find work to do?
These particular decisions were selected because they applied to allsubjects, and they were relatively important decisions. Four of them(no. 1,2,10 and possibly 4) had to do with money decisions; two of themwere concerned with family matters (6,8); the use of leisure time wasinvolved in questions number 5 and 9; question nunber 7 was related to animportant health decision while question number 3 on meals reflects aconnon every day decision which has to be made. I'm other criterionwere applied to the questions used in the decision making index: 1) thedecisions should be important to the lives of both husband and wife,and 2) the list of decisions should include typical feminine and masculinedecisions. For example, what to have for meals and whether or not tohave relatives come for a visit were presumed to be decisions made pre-dominantly by the wives while what car to buy and whether or not thehusband should find work to do wera expected to be decisions madeprimarily by the husband.
The interviewer gave the following instructions prior to reading theten questions:
"In &very family somebody has to decide such things as wherethe family will live and so on. Many couples talk such thingsover first but the final decision often has to be made by thehusband or wife. For instance, who makes the final decisionabout ? Subjects were asked to select one of fivealternatives: 1) wife always, 2) wife nore than husband3) husband and wife exactly the samel 4) husband more thanthe wife, and 5) husband always.
The workers' responses one year and two years after retirement tothe ten questions aro shoun in Table 145 on the follouing page. Thedecisions arc arranged in order of decreasing male predominance. Threeof the decisions are ones which the husband tends to make more often thanthe wife (husband working, car, and house repairs). Three other decisionsare ones usually made by the wife (food expenditures, visits of relatives,and meals). The remaining decisions (trips, going to doctor, evening outactivity and helping out relations) are decisions which husbands and wivestend to share equally. These patterns of decision making are uniform forexperimental and control subjects. The prevailing patterns also appearto remain fairly constant in time.
80

VOLE 45. NUS:M.01S ULAIT DECISIOIT HAICETC. POITEROITE YEAR AHD TITO YEARS AFTER RETDELIEHT
Score DecisionsbI nv) made
the decisions?
Immo. Mar.
Husband's flban Pauera
Timtiamiliear_c ant11-1 R-2 lip R-1R2-R1
. Families_
R-2 R2-R1
(5) Husband always Husband morking
(4) Husband morethan wife
(3) Husband and.wife the.same
4.18 4.52
Car 4.13 4.40House repairs 4.00 4.51.
Trips 2.95 3.02Going to doctor 2.89 2.96Evening activity 2.88 2.94Doing for relatives 2.57 2.75
(2),ITife more than 7ood expenditure 2.46 2.69husband Visits of relatives 2.33 2.76
(1) Uife aluays Heals
+.34 3.90
+.27 3.82+.51 4.14
+.07 3.14+.07 2.66+.06 2.68+.00 2.68
+.23 2.13+.43 2.37
4.35 +.49
4.07 +.25
4.45 +.31
3.02 -.12
2.73 +.073.00 +.322.67 -.01
2.35 +.222.69 +.32
1.61 1.46 -.15 1.67 1.53 -.14
Average of the means 3.00 3.22 +.22 2.92 3.09 +.17
a The moan uas computed on the basis of ueights shaun in the left-handcolumn, e.g., husband always = 5, husband more than uife = 4, and soforth. A mean score of L. or greater was used to indicate that thedecision was made predominantly by the husbands, while a mean scorefrom 1 to 2.5 indicated a decision made predominantly by the mife.Scores in betueen 2.5 and 4.00 represented a middle position in whichhusbands and wives made decisions equally.See Appendix 1 for Tables 50 and 51 shouing distribution of scoresfor each decision.aim difference.
However, a close inspection of the data in Table 45 reveals thefollauing trends during the first tuo years of retirement:
1. The three decisions made most frequently by the husbandsbecame almost completely husband-dominated.
2. The four decisions which tended more than the others to bemade equally by husbands and wives tended to become evenmore equilateral, but this change mas due primarily to thehusbands becoming more active in making these decisions.
81
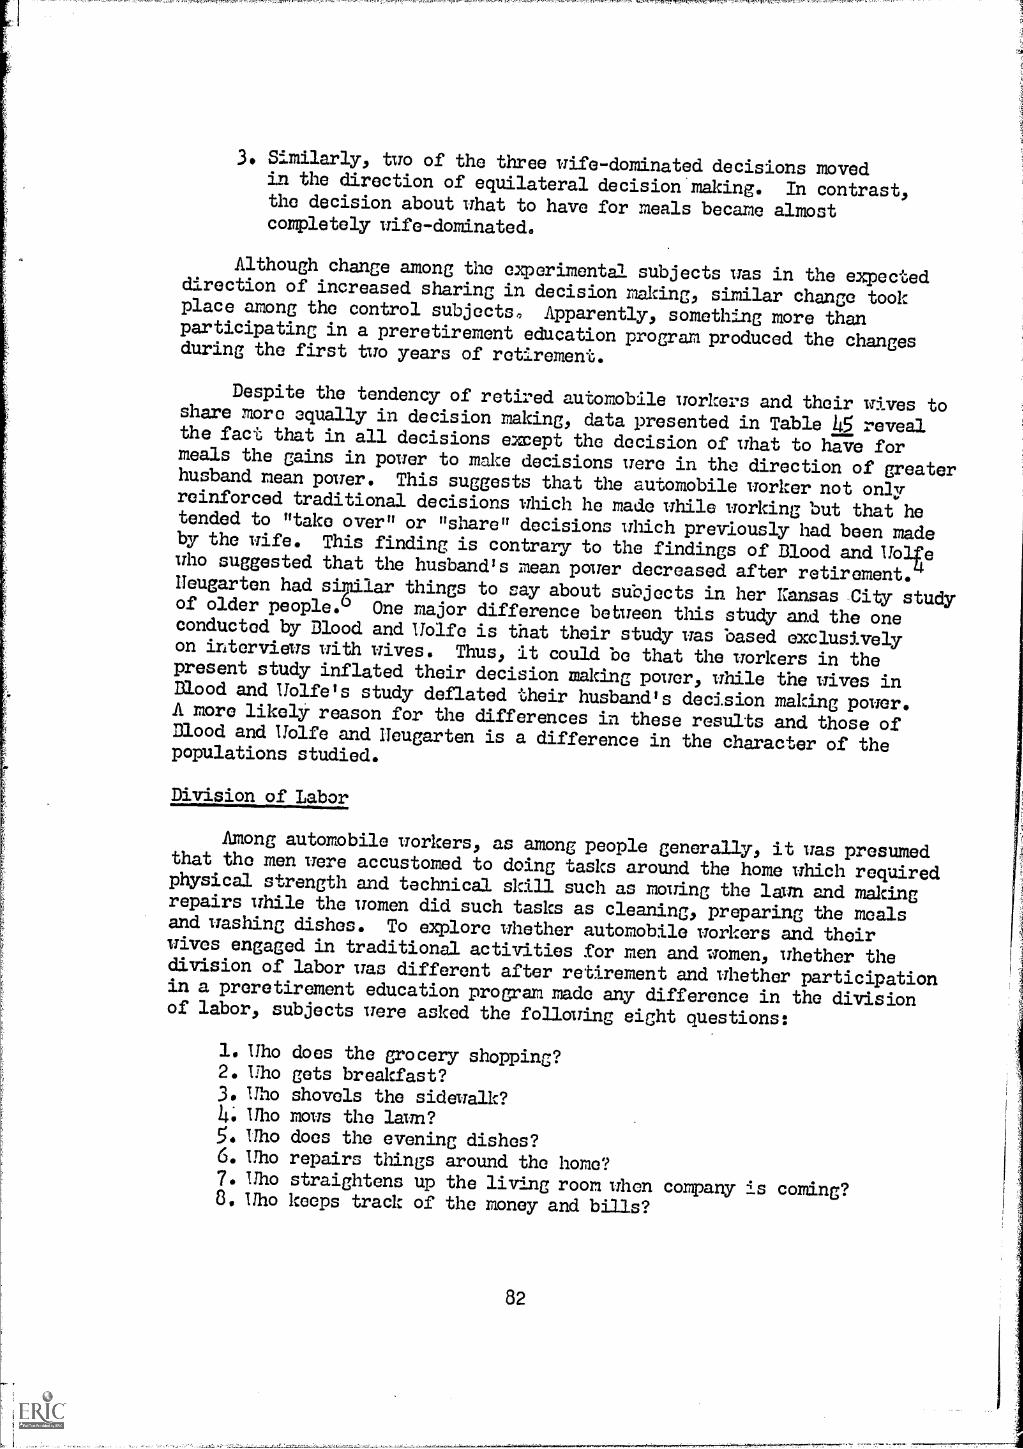
,-/7717-7,,77
3. Similarly, two of the three wife-dominated decisions movedin the direction of equilateral decision making. In contrast,the decision about what to have for meals became almostcompletely wife-dominated.
Although change among the experimental subjects vas in the expecteddirection of increased sharing in decision naking, similar change tookplace anong the control subjects Apparently, something more thanparticipating in a preretirenent education program produced the changesduring the first tuo years of retirement.
Despite the tendency of retired autonobile workers and their wives toshare more squally in decision making, data presented in Table 45 revealthe fact that in all decisions exrept the decision of what to have formeals the gains in power to make decisions were in the direction of greaterhusband mean power. This suggests that the autonobile worker not onlyreinforced traditional decisions which he made while working but that hetended to "take over" or "share" decisions which previously had been madeby the wife. This finding is contrary to the findings of Blood and Wolfewho suggested that the husband's mean power decreased after retirement."neugarten had sipilar things to say about subjects in her Kansas City studyof older people.° One major difference betueen this study and the oneconducted by Blood and 1Tolfe is that their study was based axclusivelyon interviews with wives. Thus, it could be that the workers in thepresent study inflated their decision making power, while the wives inBlood and Ublfe's study deflated their husband's decision making power.A more likely reason for the differences in these results and those ofBlood and 1Tolfe and Heugarten is a difference in the character of thepopulations studied.
Division of Labor
Among automobile workers, as among people generally, it was presumedthat the men were accustomed to doing tasks around the home which requiredphysical strength and technical skill such as mowing the lawn and makingrepairs while the women did such tasks as cleaning, preparing the mealsand washing dishes. To explore whether autonobile workers and theirwives engaged in traditional activities for nen and women, whether thedivision of labor vas different after retirement and whether participationin a preretirement education program made any difference in the divisionof labor, subjects were asked the follauing eight questions:
1. Ulo does the grocery shopping?2. Inlo gets breakfast?
3. U110 shovels the sidewalk?L. Ubo nous the laun?5. 1/110 does the evening dishes?6. Ubo repairs things around the home?7. Ulm straightens up the living room when company is coning?8. Ubo keeps track of the money and bills?
82

Compiled originally for the Blood and ITolfe study of the dynamics ofmarried living these questions uere selected because they represent taskswhich are connon to most families, and theoretically these tasks couldbe performed by either the husband or the uife. The same scoring systemwas used to score the division of labor index as was used in scoring thedecision making power index, except the weights Imre reversed giving thewife a score of 5 when she always performed the task (see Table 46). Hence,the division of labor uas expressed in terms of the wifels mean task per-formance.
TABLE 46. THE DIVISION or LABOR BETUEEII HUSBANDS AHD WIVES AS IIEASUREDBY THE =EIS ISM TASK. PERFOMIMICE SCORE BEFORE RETIREIIENT,ONE YEAR MID TITO YEARS AFTER RETIREMNT
Uho performedtask?
ITife's mean task perfornancea
Taskb
Exp. Families
Pre-R1 R-1 R-2
Cont. Families-' Blood andAblfe study
Pre-R1 R-1 R-2
(5) Wife always Living room 4:18 44:47 4.4.53 4.35 +4.514 4.+35 4.44
(4) Uife more Dishes 3.96 4.28 3.75 3.66 4.03 3.85 4.52than husband
(3) Uife andhusband thesame
Breakfast
Groceries
Bills
4. 4. 4. 4- 4. 4. 4. 4-
3.75 4.22 3,52 3.70 4.12 3.61 4.044 4 4 4- 4. 4 4 4-
3.18 3.50 3.25 3.25 3.58 3.06 3.724 4 4 4- 4 4 4. 4-
2.98 3.12 3.04 3.44 3.45 3.00 3.27(2) Husband more
than wife Walk4. 4. 4.
1.37 1.574-
1.24
4.
1.304'
1.464-
1.24 1.811- 4- 4- 4- 4- 4- 4- 4-
(1) Husband Repairs 1.31 1.27. 1.10 1.45 1.42 1.02_ 1.46always + + + 4- + + 4
Lawn 1.29 1.53 1.20 1.37 1.44 1.13 1.71
a The mean was computed on the basis of weights shown in the left-handcolumn, e.g., wife always = 5, wife more than the husband = 4, wifeand husband equal = 3, husband more than wife = 2, and husband aluays = 1.See Appendix 1 for Tables 52,53, and 54 showing distribution of scoresfor each tk.
Uhen one year after retirement subjects were asked the eight questionsthey were also asked to recall to uhat extent one or the other of tnemperformed the task before retirement. The same questions were asked twoyears after retirement. Thus Table 46 presents division of labor datafor the pre- and the poSt-retiremint periods.
83

Blood and Wolfe's data are presented in the richt-hand column ofTable 46. 'lost of the wives in this study clean the living room forcompany, do the dishes and prepare the breakfast while the hucbands shovelthe walk, make repairs and mow the lawn. Shopping for groceries andkeeping track of the money and bills are tasks shared by husbands and wivesthough they tend to be done more by wives. Blood and Uolfe concludedthat "the pattern of task performance is on9,of marked specialization.Taken task by task, six of the eight are usually performed in a completelyspecialized manner."
Generally speaking, our findings conform almost identically task bytask with Blood and Ublfe's findings. Automobile workers and their wivesapparently are as specialized in their division of labor as is the generalpopulation in Detroit.
The reader's attention is directed, however, to the system of arrowswhich have been superimposed over each set of data to indicate eitherincreased or decreased performance by the wife. Read horizontally thepattern of arrows is in the direction of increased performance by thewife from Pre-R1 to R-1 in evtry instance except that of making 'repairs.Generally speaking this means despite the specialization mentioned abovethat during the first year of retirement the wives did more while husbandsdid less of all sevtn tasks. On the other hand, the trend was reversedin all except one of the tasks (cleaning up the living room) during thesecond year of retirement. Husbands became involved to a larger extentin seven of the eight tasks including washing dishes and preparing thebreakfast. It appears, however, that the increased sharing of most ofthe tasks was a function of forces other than participation in the pre-retirement education program.
To summarize, husbands tended to increase their power to make familydecisions after retirement. This finding was contrary to results fromother studies which have suggested that women become more powerful asfamily decision makers during the retirement years. In regard todivision of labor husbands tended during the first year of retirement toturn over more of the household tasks to their wives than had been thecase before retirement. However, the trend vas reversed during thesecond year of retirement. The data failed to support the hypothesis thatexperimental subjects tended more than control subjects to share equallyuith the wives in family decision making and division of labor.
Summary of Findings
To summarize, some 38 different indexes were used to measure generaland specific kinds of adjustment and the social structure of the familyin retirement. The analysis procecided through three stages, with thefollowing results:
1. ?lean scores and mean change scores wtre computed on thevarious indexes for experimental and control subjects fromdata collected at three times, once during the months justprior to retirement, a second time during the year after
84

retirement and a third time during the second year of retirement.
2. A t-test was applied in order to test the null hypothesis thatthere mere no differences in the mean scores of experimentaland control subjects at each of the three phases of the study.These tests failed to produce conclusive evidence which wouldreject the null hypothesis.
3. A large sample test vas applied to test the null hypothesis thatthere were no differences in mean change scores of experi-mental and control subjects from Pre-R1 to R-1, Pre-R1 to R-2and R-1 to R-2.
The results of the analysis of mean change scores madeit possible to reject the null hypothesis and to credit thepreretirement education program uith having had a significanteffect of reducing dissatisfaction with retirement, of reducingworry over health, and of encouraging participants to engagein all kinds of activities including social activities withfamily and friends.
flost of the significant gains by experimental subjectswere achieved during the first year of retirement and theytended to persist into the second year of retirement, butat a somewhat diminishing level of significance. Furtherstudy is needed to determine uhether eains of these sortspersist during the first five years of retirement or whetherall subjects, those who participate and those who do notparticipate in a preretirement program eventually achieve equallevels of adjustment to retirement.
4. The final step in the analysis tested by means of a large sampletest the null hypothesis that there were no differences in meanscores or mean change scores of several sub-groups of theexperimental and control populations. The question being askedwas: Were there any differences in the effects of the programon white compared with negro subjects, on skilled workers comparedwith unskilled workers, on more educated workers compared withless educated workers, and so forth?
The results of the tests of mean scores and of mean changescores suggested the possibility that the program was moreeffective with white subjects and with subjects having the mosteducation. Further study is needed to confirm or reject thishypothesis.
5. The analysis of the social structure of the family in retirementwas based on indexes of the power to make family decisions andof the dividion of labor between husbands and wives in theperformance of typical tasks in and around the home. Thefindings showed during the first two years of retirement that
85

CHAPTER IV. SUMMARY AND IMPLICATIONS FOR FURTHER RESEARCH
Retired people have become a major element in American society, andyear after year thousands more join their ranks. As a matter of fact,retired people are being called the new leisure class in America. Someobservers view retirement as a waste of human resources, a denial of basicsatisfactions which come from being a productive member of society and aprecursor of poor health, frustration, dissatisfaction and maladjustment.An entirely different viewpoint underlay the present study--the view-point that retirement is a remarkable achievement of modern industrialsociety, a dividend of 10, 15 or as many as 20 years of living in whichadults should have the opportunity if they choose to relinquish theresponsibilities of the job and engage in other patterns of living, manyof which have been shown to be as useful, as productive and as stimula-ting as the work pattern of life,
Whether retirement is viewed as desirable or undesirable mostobservers agree that oldei-. people are often poorly prepared to makeworthwhile use of tLe super-abundance of time that is suddenly thrustupon them. For that matter, much the same indictmLnt is made of peopleof younger ages in our society so many of whom appear unable to utilizefree time purposefully. Knowledge, decf.sion and the skill to implementthem are what are needed, and it rcs presumed that the educationalprocess has already proven itself as the means of these importantobjectives. In any event, the position was taken that adult educationhas the opportunity and the responsibility to collaborate with anincreasingly important segment of our society in the important taskof enriching the retirement way of life in America.
Purpose of the Study
The present study, therefore, has attempted to contribute to anunderstanding of the effectiveness of an education program in the adjust-ment of automobile workers in retirement. Information-giving, discussion,decision-making and problem-solving in a group setting were the educationaltechniques used more often than any others to help older people adjustto retirement. Two aspects of adjustment in retirement were investigated--general, over-all adjustment as indexed by satisfaction with life andmorale measures and specific adjustment to retirement as measured by atti-tudes and behavior in relation to such areas of everyday living as theuse of leisure time, family and other social relationships, money manage-ment and maintenance of health. The effect of a preretirement educationprogram on the temporal as well as the qualitative aspects of adjustmentin retirement was investigated.
Selection of Subjects
This was the first time as far as could be determined that theattempt was made to study longitudinally the e2fects of preretirementeducation. It was also determined that the use of a control group inthe study of preretirement educati.on has been limited to one other study.
87

A previous investigation of the immediate effects of preretire-ment education conducted by the author made available two panels ofsubjects one of which had participated in a preretirement educationprogram. The experimental and control panels consisted of 36 and 52subjects respectively. It was anticipated that as many as one-thirdof these subjects would be lost during the two-year period of alongitudinal study. Thus one of the first steps in the present studywas to offer programs to 49 new experimental subjects and their wives;and, 37 new control subjects were added to the 52 old control subjects.The new subjects were motivated to volunteer for the research projectin exactly the same manner as in the earlier study, new experimentalsubjects participated in the same preretirement education program con-ducted by the same discussion leader, and equal care was exercised toreduce to the minimum opportunity for experimental and control subjectsto interact with one another. By definition, only male hourly-ratedworkers, who were employed in assembly type automobile plants, wholived in the Detroit Metropolitan Area, and who had made plans toretire within the stated period of the study were eligible to take parteither as experimental or control subjects. Interested workers whowere denied the opportunity to take part in a program were told onewould be offered to them once the research project was completed. Thiswas one of the conditions which labor unions said must be met if theywere to help the project by identifying pctential subjects and encourag-ing them to participate.
Considerable credit is due to the United Automobile Workers Inter-national Union and to several UAW local unions for their help. The UAWlocal union was the only avenue open to the investigator for contactinglarge numbers of manual workers who were about to retire. Even so, thelocal unions usually did not know the age or the expected date of retire-ment of their members. These deficiencies were over-shadowed, however, bythe fact that the local union had the capacity as did no other organiza-tion including the University to bring out large numbers of older membersto orientation meetings and to encourage them to cooperate in theresearch project.
Subjects who volunteered to participate in the research projectwere led to expect personal benefits from participation, but also theywere told that they were making a contribution to the well being ofother industrial workers who some day would be following in their foot-steps. The methodological position was taken that the study was bestmade with volunteers because, in fact, future programs were likely tobe offered on a volunteer basis. Many subjects decided not to participatein the project, but unfortunately a study of those who refused to partici-pate was not conducted.
Since it was not feasible to determine arbitrarily the compositionof the experimental and control groups except to control on certainvariables through rules of eligibility, it was important to dbtain asmuch information as possible about each subject in order to assess the
88

comparability of the experimental and control groups at three stagesin the study: the year before retirement, and one and two years afterretirement. The need frequently to refer to these phases resulted intheir designation as the Pre-H1, the R-1 and the R-2 phases of thestudy.
Comparability of the Study Groups
Experimental and control subjects were compared at each of the threestudy phases on the basis of age, marital status, race, birthplace, languagespoken at place of birth, educational status, residential status, healthstatus, occupational status and financial status.
To summarize, before retirement experimental and control subjectswere matched on such variables as marital status, race, birthplace, educa-tional status, residential status (except plans to move) income, worryover money matters and attitude toward standard of living. On the otherhand, control subjects mere significantly younger, healthier, and moreskilled as workmen than experimental subjects.
The degree of homogeneity of the experimental and control groupswhich was observed before retirement was maintained during the firsttwo years of retirement despite the fact that 18 subjects were lostbetween the second and third phases of the studyc Furthermore afterretirement the health status of the two groups became more homogeneous.
Hypotheses of the Study
Three principal null hypotheses were established as a basis forcomparing the adjustment of the two panels of automobile workers oneof which had participated in a preretirement education program:
1. that there were no differences in the mean scores of experi-mental and control subjects on various measures of adjust-ment,
2. that there were no differences in the mean change scoreson various measures of adjustment of experimental andcontrol subjects over three periods of time, Pre-R1 toR-1, Pre-R1 to R-2 and R-1 to R-2, and,
3. that there were no differences in the mean scores andthe mean change scores on various adjustment measures ofseveral sub-groups of the experimental and control populations.
89
A'
Measurement of Adjustment in Retirement
Thirty-eight indexes, some of them borrowed from other studiesof retired people and some of them developed especially for the presentstudy, were used to measure various aspects of adjustment in retirement.The indexes grouped themselves into 8 measurement categories:
1. General life satisfaction or morale measures2. Self- or age-concept measures3. Measures of attitudes toward retirement4. Health measures5. Financial status measures6. Family and friends indexes7. Home and community index8. Activity measures
The eight categories of measures were used as a basis for presentingthe findings of the study in terms of patterns of over-all adjustment aswell as patterns of adjustment to specific areas of retirement living.The measures also made it possible to study change in attitudes andbehavior over a period of time.
The two sources of most of the indexes of adjustment used in thepresent study - The Cornell Longitudinal Study and the KutnerStudy of 500 people living in New York City are recognized among studentsof aging as the major sources of validated measures of adjustment inretirement. However, the subjects of the present study resembled theKutner subjects to a larger extent than they did the Cornell subjects.In addition the point must be made that the indexes which were developedby the author especially for the present study have only logical validity.The extent to which they measure what they are thought to measure wasnot determined dbjectively exeept to ask a panel of experts to reactto their content, and to administer them to a trial group of automobileworkers before using them in the present study.
Statistical Methods
To determine the comparability of experimental and control groupsat various stages of the study a chi-square test was used when quanti-tative data such as race or marital status were involved and a t-testwhen data were distributed on a continuum such as years of schoolingor age.
As a first step in analyzing differences between the study groupsmean scores and mean change scores were computed for all indexes, forexperimental and control stibjects for six subgroups of experimentaland control subjects and for the three periods of the study.
A t-test was used to test observed differences between means, anda large sample test was used to test differences between mean scores and
90

mean change scores of sub-groups. When no statistically significantdifferences were revealed the groups being compared were considered tobe homogeneous in terms of the particular measure under consideration.Observed differences were considered statisticlly significant whenthe probability of their occurrence by chancywas .05 or less.
Major Findings_
From the analysis of mean scores it was dbserved that experimentalsUojects had higher mean scores on half of the indexes, but that noneof these differences were statistically significant. However, thetest of differences between mean change scores made it possible to rejectthe null hypothesis and to credit the preretirement education programwith having had the important effects of:
1. reducing dissatisfaction with retirement2. reducing worry over health, and,3. encouraging participants to engage in all kinds of
activity including social activity with friends andmembers of the family.
It appears that most of the statistically significant gains byexperimental subjects occurred during the first year of retirement, andthat they tended to persist into the second year, but at a somewhatdiminishing level of significance.
The analysis of the effects of the preretirement education programon the adjustment in retirement of sub-groups based on race, education,income and so forth suggested the possibility that the program was moreeffective with white subjects, with subjects who completed 8 or moregrades of school, and with subjects who were born in an English-speakingcountry. Further study is needed to confirm these tentative findings.
The study of the social structure of the family in retirement asindexed by measures of the power to make family decisions and divisionof labor in the performance of tasks in and about the home showed thathugbands increased their power to make decisions during the first twoyears of retirement. This finding is contrary to the commonly acceptedone that retirement from the work role tends to diminish the power of thehusband and increase the power of the wife.
During the first year of retirement, husbands tended to do less andwives to do more of ten typical tasks in and around the house. It isalmost as though the husbands had decided to relax and do less around thehouse after retirement. The trend of hugbands doing less was reversed,however, during the second year when husbands and wives tended to sharetasks more like they did before retirement. Two possible explanations arethat wives' prompted.their husbands to take more responsibility for house-hold tasks or that husbands reached the point where they needed more thingsto do uith their free time,
91
A hypothesis which was being tested was that after retirementexperimental subjects to a significantly larger extent than control subjectswould tend to share decision-making and the performance of tasks about thehome. The findings failed to support the hypothesis thereby suggestingthe possibility that forces stronger than the preretirement education programwere at work among the automobile families.
Limitations of the Study and Suggestions for Future Research
The most obvious limitations of the study is that it applies onlyto a particular group of automobile workers living and working in a largemidwestern metropolitan community who may or may not be representative ofall automobile workers living in the Detroit Metropolitan area. On theother hand, dealing with a homogeneous occupational group is to be preferredto dealing with a mixed occupational group. The fairly obvious need isthat of repeating the study with other groups of automobile workers,with other occupational groups and with manual workers living in otherregions of the country.
Subjects volunteered for the research and it is quite likely theydiffer from the automobile workers who refused to take part in the research.In future studies of preretirement education, it is suggested that as muchcould be learned from a study of those who refuse as those who accept theinvitation to enroll in the program.
On the basis of the present study, it was not possfble to separateout the value of the group discussion as against the lecture method. Althoughit was possible to credit the program with some important results, theseresults are not ones which applied consistently to the several areas of retire-ment living which were explored. Hence, further study with an emphasison program methods is urgently needed to test whether the lecture method-yields any different results with manual workers. What could have beendone in this research, but was not done, was to have added some preretire-ment education programs using the lecture rather than the group discussionmethod.
As indicated earlier in the chapter, many of the indexes of adjust-ment used in the study had only common sense validity. For this and otherreasons it is suggested prior to any future research of this kind withmanual workers that further attention be given to the systematic develop-ment of indexes to measure performance in typical tasks of everyday livingin retirement such as money management, socialization with people insideand outside the family, and the development of patterns of daily activity.In this regard further analysis of the dna obtained on the thirty-eightdifferent indexes used in the study would be a useful starting point.
Despite the significant gains whida experimental subjects madeduring the two years of the present study, the data suggest that differencesbetween experimental and control subjects were becoming less marked at theend of the second year. Hence there is the important unanswered question
92

of the persistence in retirement of the effects of participation in apreretirement education program. One way to answer this question wouldbe to conduct follow-up interviews with some of these same subjects atregular intervals during the next five years.
Toward the end of the preretirement education programs membersusually expressed satisfaction and the wish that the program couldcontinue. Behavior of this kind suggests the possibility of studyingthe effect of periodic follow-up retirement sessions in which new infor-mation would be supplied, unsolved problems discussed, reports ofsuccessful adaptations made to the group, and an exprit de corp, and mutualhelpfulness encouraged among the members. Also because participantswould be retired there would be time in which to encourage them to usethe community as a laboratory for learning dbout housing for the aging,health services, activity programs and so forth. And yet, those whodeal with older people in social clubs, church and library groups andactivity centers have made very little use of the group setting in whicholder people come together to solve problems of everyday living.
Hence, education for aging, may have come about full circle. Thefirst course offered in this country for older people was designed tohelp retired people solve the problems of later maturity. Now it appearsthe best way to help people adjust to the retirement years may be toprovide opportunity for learning before and after retirement.
93

APPENDIX 1
TA3L2S
TABLE 47. COMPARISONS OF EXPERIMENTAL AND CONTROL GROUPSON THE BASIS OF MARITAL STATUS, HOMEOWNERSHIP AND PLANS TO MOVE (R-1)
Various characteristics Experimental Control Both groups(n-70) (n-70) (n-140)
Marital statusaNever married 9% 6% 7%Married, living with spouse 83 86 84'Separated, widowed or divorced 9 8 9
Totals 101 100 100
Home ownershipbOwn homeRented home or other arrangement
73%25
70%29
71%29
No informationc 1 1Totals 99 99 101
Plans to moved
Yes 9% 11% 10%No 76 71 74Undecided 16 17 16
Totals 101 99 100
a Chi-squarc = .43, df = 2, p > .05
b Chi-square = .11, df = 1, p .05
No information category not included in Chi-square computations.d Chi-square = .42, df = 2, p> .05
94

TABLE 48, COMPARISONS OF EXPERIMENTAL AND CONTROL GROUPSON THE BASIS OF HEALTH STATUS (R-1)
Health status Experimental Control Both groups(t40) (n..70) (n-140)
Self-rating of healthaPoor 6% 5% 6%Fair 34 29 31Good 60 66 63
Totals 100 100 100
Worry over health')Often 4% 6% 5%Sometimes 19 14 16Hardly ever 31 23 27Never 44 56 50No informatione 1 1 1
Totals 99 100 99
Recent change in healthdNo change 64% 69% 66%Change for better 24 20 22Change for worse 11 11 11
Totals 99 100 99
Present health problemseNo problems 30% 40% 35%One problem 40 40 40Two or more problems 30 20 25
Totals 100 100 100
a Chi-square = 4155, df = 2, p > 05b Chi-square = 2,40, df = 3, g > ,05
No information category not included in Chi-square computations.d Chi-square = .39, df = 2, p > .05
e Chi-square = .76, df = 2, p > .05
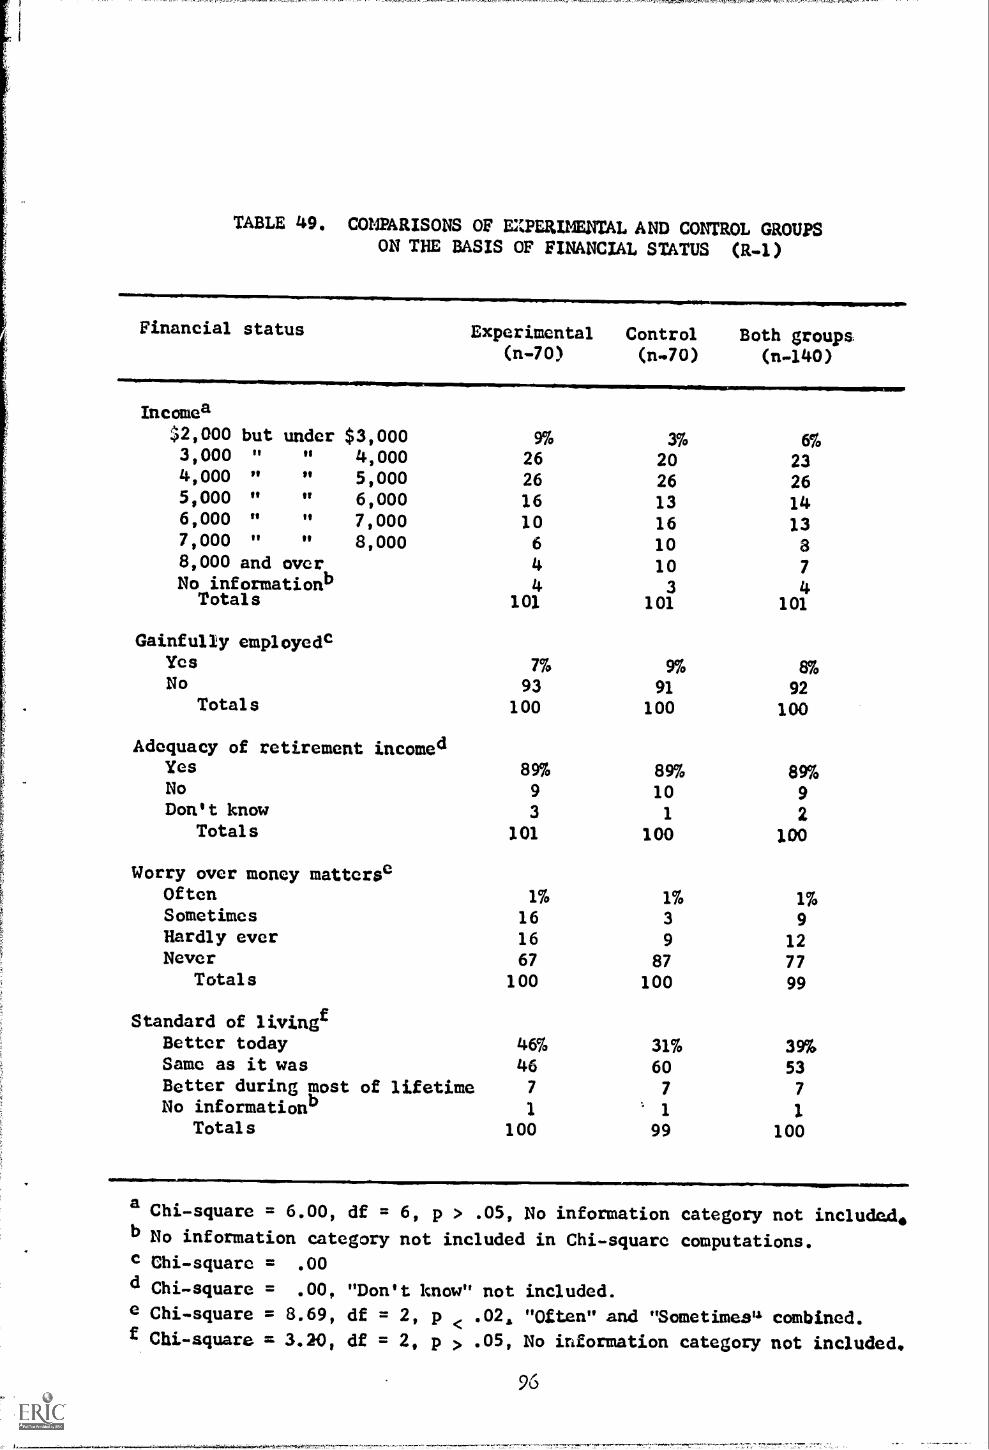
TABLE 49. COMPARISONS OF EXPERIMENTAL AND CONTROL GROUPS(R-1)ON THE BASIS OF FINANCIAL STATUS
Financial status Experimental(n-70)
Control(n.70)
Incomea
$2,000 but under $3,000 9%3,000 " " 4,000 26 204,000 " " 5,000 26 265,000 " " 6,000 16 136,000 " " 7,000 10 167,000 " " 8,000 6 108,000 and over 4 10No information') 4 3Totals 101 101
Gainfully employeeYes 7% 9%No 93 91
Totals 100 100
Adequacy of retirement incomedYes 89% 89%No 9 10Don't know 3
Totals 101 100
Worry over money matters°Often 1% 1%Sometimes 16 3Hardly ever 16 9Never 67 87
Totals 100 100
Standard of livingfBetter today 46% 31%Same as it was 46 60Better during most of lifetime 7 7
No informationb 1 1
Totals 100 99
Both groups(n-140)
APIO1 1111m,
6%23
2614
13a7
4101
92
100
89%9
2
100
1%9
12
77
99
39%53
1
no
a Chi-squarc = 6.
b No information
e Chi-square = .
d Chi-square = .
e Chi-square = 8
e Chi-square 3.
00, df = 6, p > .05, No information category not included,
category not included in Chi-square computations.
00
00, "Don't know" not included.
.69, df = 2, p .02, "Often" and "Sometimeau. combined.
10, df = 2, p > .05, No information category not included,
96

TABLE 50.
DISTRIBUTION OF POWER IN DECISION-MAKINGAMONG EXPERIMENTAL
AND CONTROL FAMILIES ONE YEARAFTER RETIREMENT
Who made
decisions
R-1
Decisionsa
Car
Food
expenses
Meals
House
repairs
Trips
Visits
Going
of
to
relatives
doctor
Doing
for
relatives
Evening-
out
activity
Husband
working
xEperimental families
(1)
Wife always
(2)
Wife more than
2%
25%
63%
2%
2%
21%
4%
17%
4%
2%
husband
416
20
211
25
11
11
13
4(3)
Husband-wife same
(4)
Husband more than
25
52
13
36
82
54
80
70
80
30
wife
20
25
15
24
24
(5)
Husband always
50
545
42
461
Total percent
101
100
101
100
101
100
101
100
101
101
Husband's mean
power
4.13
2.46
1.61
4.00
2.95
2.33
2.89
2.57
2.88
4:18
Control families
(1)
Wife always
(2)
Wife more than
970
45%
60%
5%
4%
30%
15%
18%
1570
5%
husband
10
23
22
712
512
5(3)
Husband-wife same
30
38
10
26
79
60
68
70
66
32
(4)
Husband more than
wife
21
39
93
23
312
(5)
Husband always
39
73
59
73
33
47
Total percent
99
100
99
101
101
100
100
99
99
101
Husband's mean
power
3.82
2.13
1.67
4.14
3.14
2.37
2.66
2.68
2.68
3.90
aSubjects who failed to answer questions were not included in this tabulation.
C \
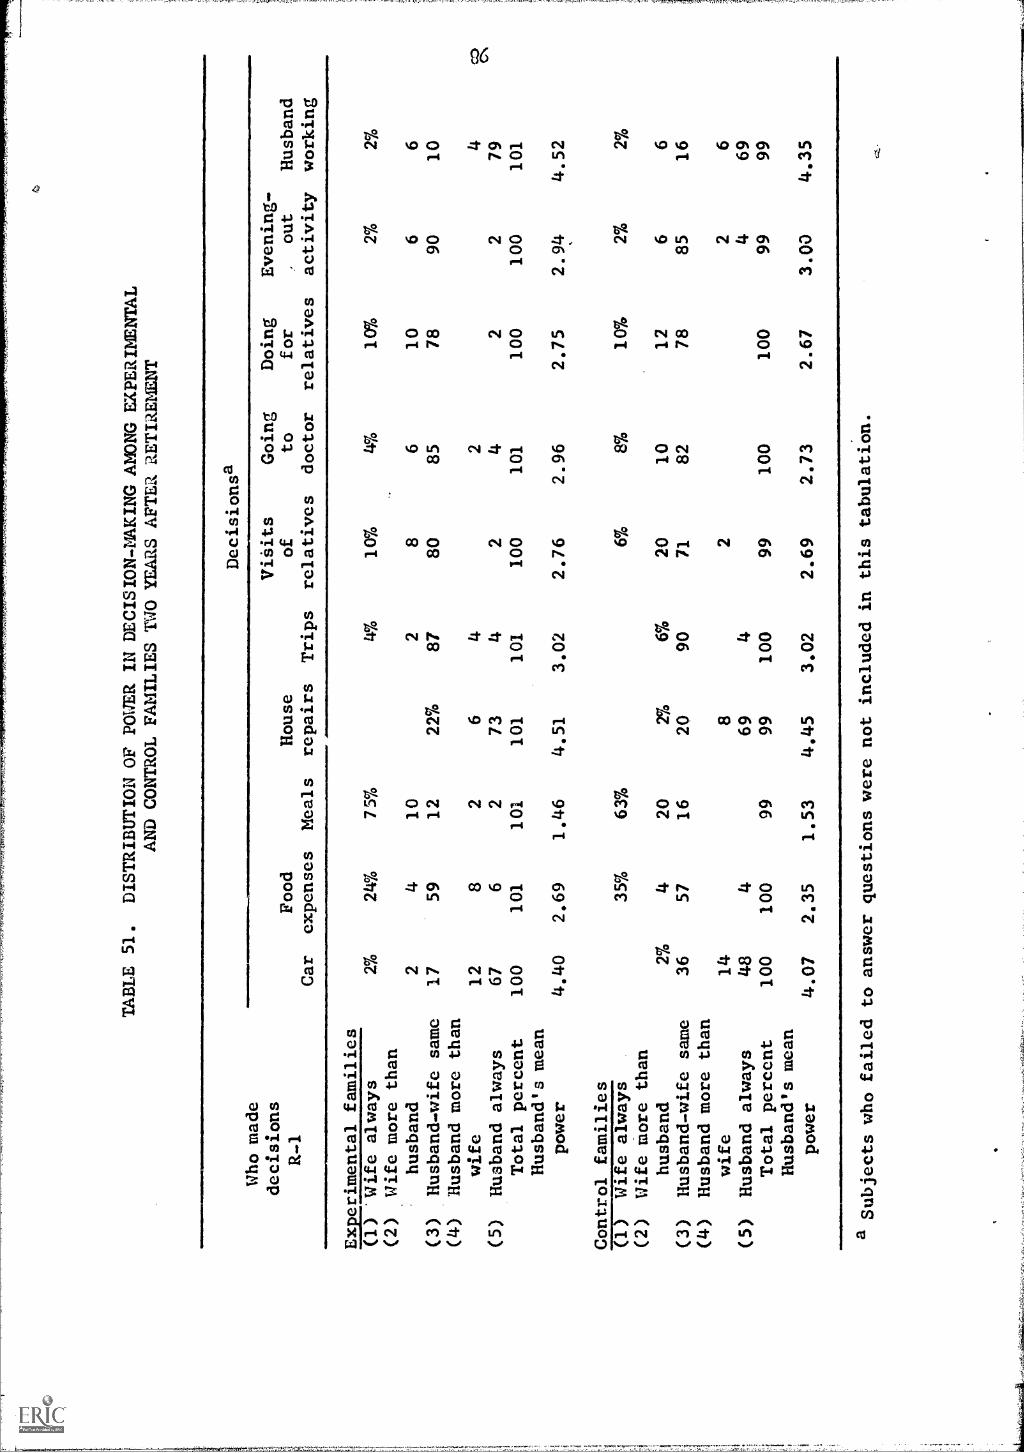
TABLE 51.
DISTRIBUTION OF POWER IN DECISION-MAKING AMONG EXPERIMENTAL
AND CONTROL FAMILIES TWO YEARS AFTER RETIREMENT
Decisionsa
Who made
decisions
R-1
Car
Food
expenses
Meals
House
repairs
Trips
Vi6its
of
relatives
Going
to
doctor
Doing
for
relatives
Evening-
out
activity
Husband
working
Experimental families
(1)
Wife always
2%
24%
75%
4%
10%
4%
10%
2%
2%
(2)
Wife more than
husband
24
10
28
610
66
(3)
Husband-wife same
17
59
12
22%
87
80
85
78
90
10
(4)
Husband more than
wife
12
82
64
24
co
(5)
Husband always
67
62
73
42
42
279
c.
Total percent
100
101
101
101
101
100
101
100
100
101
Husband's mean
power
4.40
2.69
1.46
4.51
3.02
2.76
2.96
2.75
2.94
4.52
Control families
(1)
Wife always
35%
63%
6%
8%
10%
2%
2%
(2)
Wife more than
husband
2%
420
2%
6%
20
10
12
66
(3)
Husband-wife same
36
57
16
20
90
71
82
78
85
16
(4)
Husband more than
wife
14
82
26
(5)
Husband always
48
469
44
69
Total percent
100
100
99
99
100
99
100
100
99
99
Husband's mean
power
4.07
2.35
1.53
4.45
3.02
2.69
2.73
2.67
3.00
4.35
aSubjects who failed to answer questions were not included in
this tabulation.
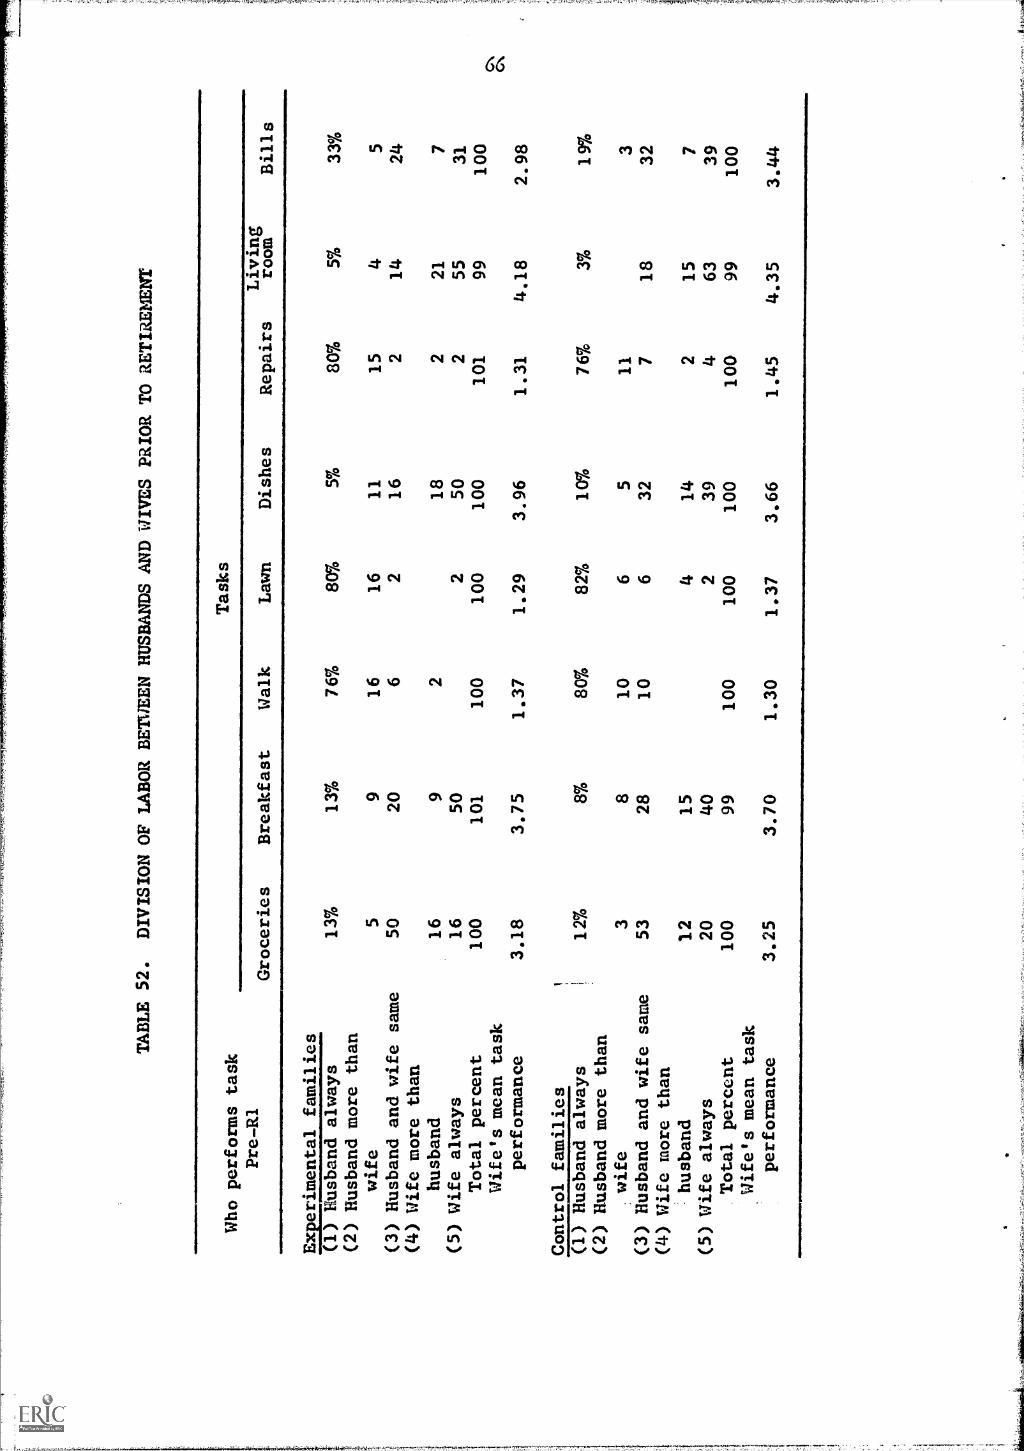
TABLE 52.
DIVISION OF LABOR BETWEEN HUSBANDS AND WIVES PRIOR TO RETIREMENT
Who performs task
Tasks
Pre-R1
Groceries
Breakfast
Walk
Lawn
Dishes
Repairs
Living
room
Bills
Experimental families
(1) Husband always
13%
13%
76%
80%
5%
80%
5%
33%
(2) Husband more than
wife
59
16
16
11
15
45
(3) Husband and wife same
50
20
62
16
214
24
(4) Wife more than
husband
16
92
18
221
7
(5) Wife always
16
50
250
255
31
Total percent
Wife's mean task
100
101
100
100
100
101
99
100
c\c\
performance
3.18
3.75
1.37
1.29
3.96
1.31
4.18
2.98
Control families
1
(1) Husband always
i ,12%
8%
8070
82%
10%
76%
3%
19%
(2) Husband more than
wife
38
10
65
11
3(3) Husband and wife same
53
28
10
632
718
32
(4) Wife more than
husband
12
15
414
215
7
(5) Wife always
20
40
239
463
39
Total percent
100
99
100
100
100
100
99
100
Wife's mean task
performance
3.25
3.70
1.30
1.37
3.66
1.45
4.35
3.44
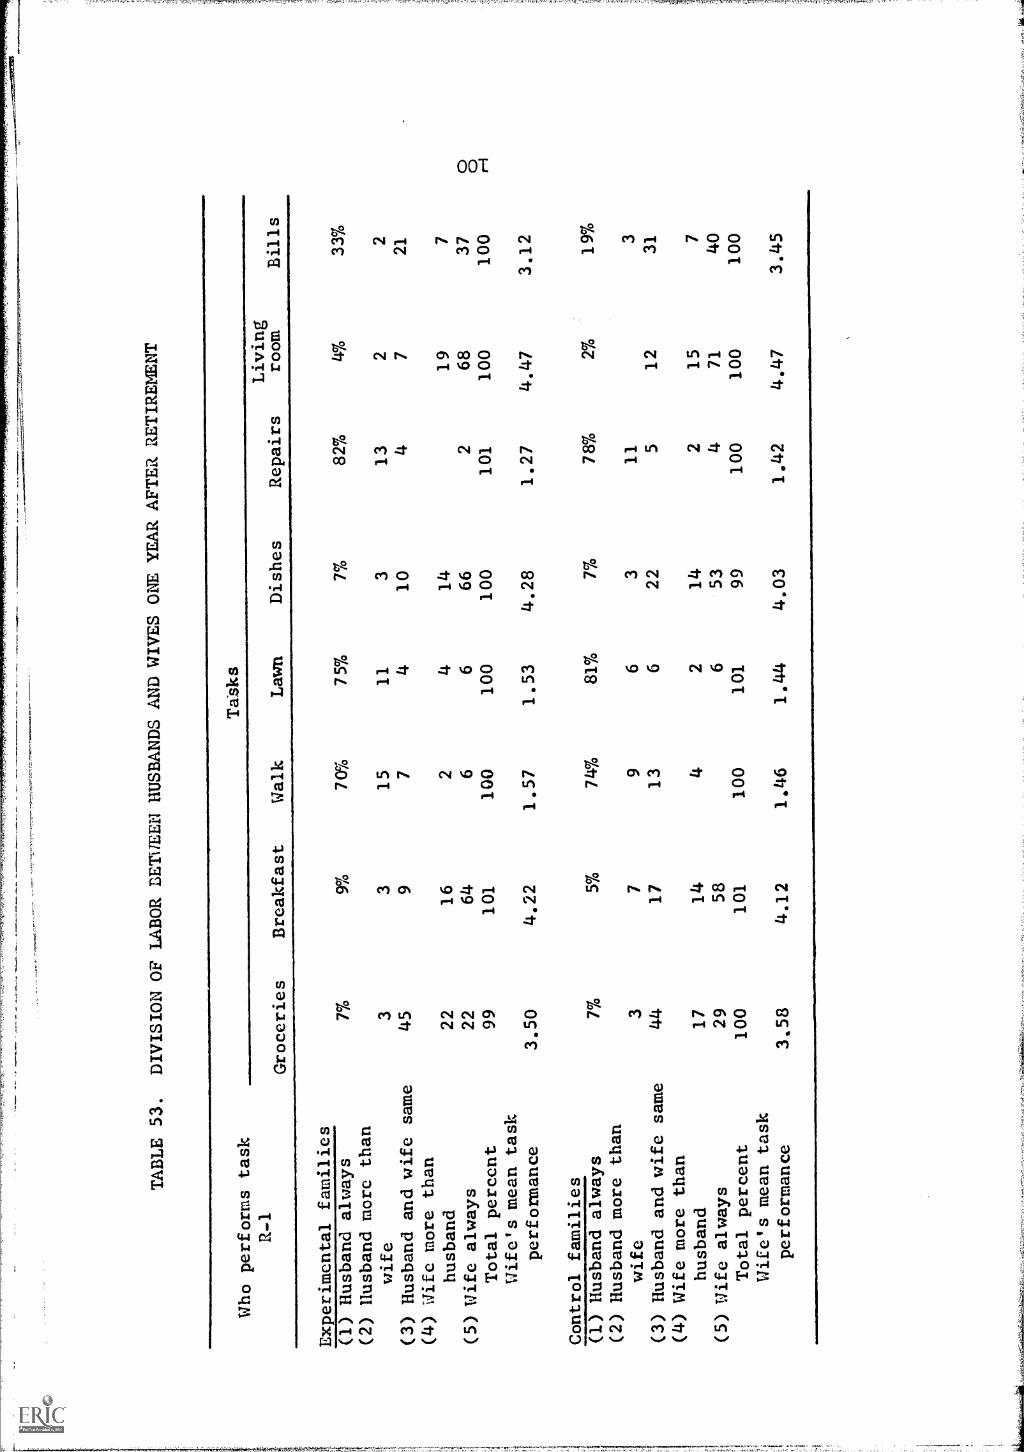
TABLE 53.
DIVISION OF LABOR BETWEEN HUSBANDS AND WIVES ONE YEARAFTER RETIREMENT
Who performs task
Ta-sks
R-1
Groceries
Breakfast
Walk
Lawn
Dishes
Repairs
Living
room
Bills
Experimental families
(1) Husband always
no
9%
70%
75%
7%
82%
4%
33%
(2) Husband more than
wife
33
15
11
313
22
(3) Husband and wife same
45
97
410
47
21
(4) Wife more than
husband
22
16
24
14
19
7
(5) Wife always
22
64
66
66
268
37
0 oTotal percent
99
101
100
100
100
101
100
100
r-i
Wife's mean task
performance
3.50
4.22
1.57
1.53
4.28
1.27
4.47
3.12
Control families
(1) Husband always
7%
5%
74%
81%
7%
78%
2%
19%
(2) Husband more than
wife
37
96
311
3
(3) Husband and wife same
44
17
13
622
512
31
(4) Wife more than
husband
17
14
42
14
215
7
(5) Wife always
29
58
653
471
40
Total percent
100
101
100
101
99
100
100
100
Wife's mean task
performance
3.58
4.12
1.46
1.44
4.03
1.42
4.47
3.45

TABLE 54.
DIVISION OF LABOR BETWEEN HUSBANDS AND WIVES TO YEARS AFTER RETIREMENT
Who performs task
Tasks
R-2
Groceries
Breakfast
Walk
Lawn
Dishes
Repairs
Living
room
Bills
Experimental families
(1) Husband always
10%
17%
89%
91%
15%
94%
4%
24%
(2) Husband more than
wife
13
22
42
28
(3) Husband and wife same
42
33
74
21
48
33
(4) Wife more than
husband
12
13
10
10
8(5) Wife always
23
37
22
50
76
27
Total percent
100
100
100
.99
100
100
100
100
Wife's mean task
performance
3.25
3.52
1.24
1.20
3.75
1.10
4.53
3.04
Control families
(1) Husband always
12%
14%
84%
91%
13%
98%
2%
24%
(2) Husband more than
wife
12
49
42
24
8(3) Husband and wife same
43
33
44
23
16
35
(4) Wife more than
husband
22
42
13
12
8(5) Wife always
10
45
50
65
24
Total percent
99
100
99
99
101
100
99
99
Wife's mean task
performance
3.06
3.61
1.24
1.13
3.85
1.02
435
3.00

:=1,7
TABLE 55. SOURCE DATA FROM WHICH Z VALUES WERE COMPUTEDON 18 INDEXES (Pre-R1 to R-1)
Reference Scoringnumber of systemmeasure (+ or -)
Exp. (n-70) Cont. (n-70)Mean Standard
difference deviationMean
differenceStandard
deviation
1 .686 .860 .386 .959 -1.302 .443 1.630 .914 1.567 -1.743 - .586 1.014 -.371 .765 -1.414 - .029 .589 .043 .600 - .717 -1.429 4.386 -.143 5.054 -1.618 - .100 .486 -.186 .621 .919 .000 .341 -.014 .318 .26
10 .657 1.006 .286 .995 2.2013 - .143 1.011 .014 1.234 - .8215 .314 .578 .100 .515 2.3220 - .200 .773 -.029 .722 -1.3632 -1.543 4.169 -.029 3.439 -2.3433 - .400 2.081 .114 2.011 -1.4934 - .300 1.376 -.243 1.209 - .2635 - .257 1.359 .000 1.239 -1.1736 - .329 2.187 .129 2.035 -2.6837 . .386 1.653 .343 1.623 -2.6338 . .671 2.723 -.043 2.281 -1.48
TABLE 56, SOURCE DATA FROM WHICH Z VALUES WERE COMPUTEDON 18 INDEXES (Pre-R1 to R-2)
aeference Scoring Exp. (n-63) Cont. (n-59)number of system Mean Standard Mean Standardmeasure (+ or -) difference deviation difference deviation
1 .730 .723 .711 1.018 ,112 .460 1.389 .898 1.668 -1,573 - .730 1.050 -.576 .855 - .894 - .064 .669 -.034 .524 - ,277 .794 4.978 -.034 4.279 - ,918 - .159 .447 -.170 .592 .119 .032 .177 -.051 .344 38
WOO10 .921 1.036 .492 1.073 2.2413 .143 1.134 .186 1.408 - .1915 .333 .508 .237 .429 1,1320 - .286 .851 .034 .694 -2,2832 -1.968 3.797 -.576 2.93133 - .794 1.902 -.170 1.354 -2.1034 - .349 1.259 -.390 1.232 .1835 - .714 1.156 -.237 1.023 -2,4236 - .905 2.234 .000 2.181 -2,2637 - .476 1.615 .237 1.705 -2.3738 -1.063 2.177 -.458 1.851 -1.66
102

TABLE 57. SOURCE DATA FROM 'MICH Z VALUES UERE CONPUTED OnTHI1TY-SIX SCALES AND INDEXES WHICH WEREADMINISTERED ONE YEAR AND TWO YEARS
AFTER RETIREMENT
Referencenumber ofmeasure
Scoringsystem(+ or -)
Exp. (n-63) Cont. (n-59Mean
differenceStandard
deviationMean
differenceStandard
deviation
1 + .000 .622 - .170 .723 1.382 + .016 1.301 .017 1.408 .003
4+
+
.127- .032
.684
.595
- .152- .034
.690
.524.20
.025 + .397 1.185 .407 1.219 - .056 + .373 1.508 1.288 1.672 -1.447 + .540 4.721 .203 3.453 .458 + - .048 .280 .017 .347 -1.139 + - .032 .252 - .017 .347 . .27
10 - .270 .723 .152 .784 .8611 - .111 .599 .085 .677 .2312 - .698 2.588 .237 2.144 1.0713 + .254 .967 .102 .959 .8914 + .730 1.208 .610 1.260 .5415 - .016 .458 .136 .434 .1.4816 - .222 1.419 .356 1.471 . .5117 + .175 .583 .034 .524 1.4018 + - .111 1.018 - .186 1.238 .3719 + .032 1.332 - .152 1.297 .7720 + - .127 .604 .051 .705 -1.4121 + 1.000 .916 .864 .955 .8024 + .397 1.622 .831 1.566 -1.5025 + - .175 1.129 .017 1.058 - .9726 + .397 1.144 .559 1.207 - .7627 + .349 1.065 .288 1.260 .2928 + .206 803 .085 .857 .7729 - .508 1.615 .356 1.471 .5430 - .476 1.293 .288 1.218 .8331
32
+
+
.794- .698
.970
2.394 - ,LLI:952
1.0723.131
1.72- .38
33 + - .540 1.882 - .203 1.730 -1.033435
36
+
+
+
- .159- .571
- .111
.)87
1.3641.695
- .170- .203- .102
1.3021.2291.900
.05
-1.57- .03
37 + - .143 1.281 - .119 1.439 - .1038 + _- .635 2.058 - .390 2.158 - .64
103

TABLE 58. A COMPARISON OF THE EFFECTS OF THE
PRERETIREMENT EDUCATION PROGRAM ON11HITE AND NEGRO SUBJECTS AS
"MEASURED BY MEAD SCORES
Reference Number andName of Index
Z ValuesPre-R1 R-1 R-2
1 Satisfaction with Life2 Morale3 Adjustment to Retirement4 Self-Concept of Age5 Self-Other Comparisons -- A9 Attitude Toward Retirement
1.5263.636a.326
.654
.960
.0941.064.548
1.120.737
.909
.040
.4631.0651.360.140
2.000b10 Dissatisfaction with Retirement 1.060 .067 .43811 Negative Aspects of Retirement 1.091 .16712 Physical Health Index .378 .44813 Self-Appraisal of Health .324 1.366 .14814 Attitude Toward Health 1.267 1.40916 Mental Health Index 1.359 .14318 Disposition to Use Health Resources . . . .829 3138a20 Attitude Toward Income .375 .822 .24621 Money Management 1.591 1.81124 Mhrital Relations .983 1.00025 Companionship in Marriage 2632a .46227 Satisfaction with Relations 1.027 .94328 Satisfaction with Friends .357 .22030 Social Deprivation -- B .467 .07131 Satisfaction with Home and Community . . .146 .50032 Total Activities .425 .447 .39036 Social Activity .438 .423 .718
-a Significant at the .01 level
b Significant at the .05 level
104
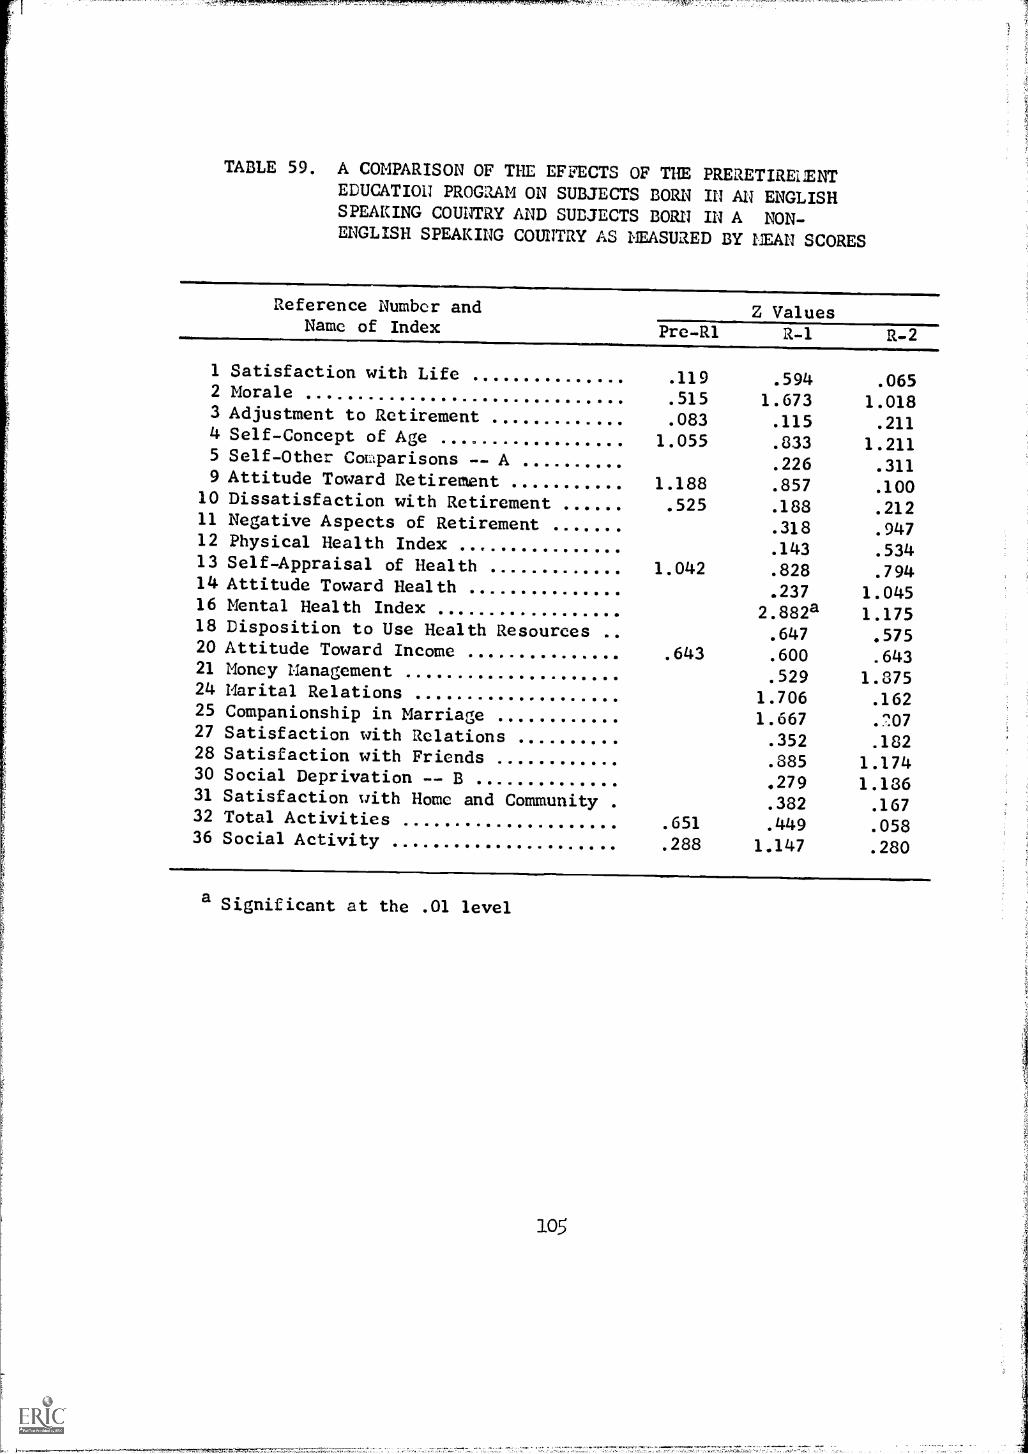
TABLE 59. A COMPARISON OF THE EFFECTS OF THE PRERETIRELENTEDUCATION PROGaAM ON SUBJECTS BORN IN AN ENGLISHSPEAKING COUNTRY AND SUBJECTS BORN IN A NON-ENGLISH SPEAKING COUNTRY AS MEASURED BY MEAN SCORES
Reference Number andName of Index
Z ValuesPre-R1 R-1 R-2
1 Satisfaction with Life .119 .594 .0652 Morale .515 1.673 1.0183 Adjustment to Retirement .083 .115 .2114 Self-Concept of Age 1.055 .833 1.2115 Self-Other Couparisons -- A .226 .3119 Attitude Toward Retirement 1.188 .857 .100
10 Dissatisfaction with Retirement .525 .188 .21211 Negative Aspects of Retirement .318 .94712 Physical Health Index .143 .53413 Self-Appraisal of Health 1.042 .828 .79414 Attitude Toward Health .237 1.04516 Mental Health Index 2.882a 1.17518 Disposition to Use Health Resources .647 .57520 Attitude Toward Income .643 .600 .64321 Money Management .529 1.87524 Marital Relations 1.706 .16225 Companionship in Marriage 1.66727 Satisfaction with Relations .352 .18228 Satisfaction with Friends .885 1.17430 Social Deprivation -- B .279 1.13631 Satisfaction with Home and Community . .382 .16732 Total Activities .651 .449 .05836 Social Activity .288 1.147 .280
a Significant at the .01 level
105

TABLE 60. A COMPARISON OF THE EFFECTS OF THE PRERETIREUENT EDUCATIONPROGRAM ON SUBJECTS WHO WERE MARRIED AND SUBJECTS WHO WERENOT MARRIED AS MEASURED BY MEAN SCORES
Reference Number andName of Index
Z ValuesPre-R1 R-1 R-2
1 Satisfaction with Life2 Morale3 Adjustment to Retirement
.170
.174
.660
.286
1.0142000a
1.300.225
1.0854 Self-Concept of Age .650 .680 .231
5 Self-Other Comparisons -- A 1.435 1.7929 Attitude Toward Retirement 1.050 1.250 .308
10 Dissatisfaction with Retirement 1.024 .467 .286
11 Negative Aspects of Retirement .265 .313
12 Physical Health Index .146 .366
13 Self-Appraisal of Health .034 1.686 .675
14 Attitude Toward Health .521 .660
16 Mental Health Index .473 .592
18 Disposition to Use Health Resources . .158 .846
20 Attitude Toward Income 1.188 1.815 1.36121 Money Mhnagement .541 .120
24 Marital Relations25 Companionship in Marriage27 Satisfaction with Relations .916 2.500a28 Satisfaction with Friends 1.000 .359
30 Social Deprivation -- B 1.617 .123
31 Satisfaction with Home and Community .041 .19432 Total Activities .171 .648 .267
36 Social Activity .701 1.361 .182
a Significant at the .05 level
106
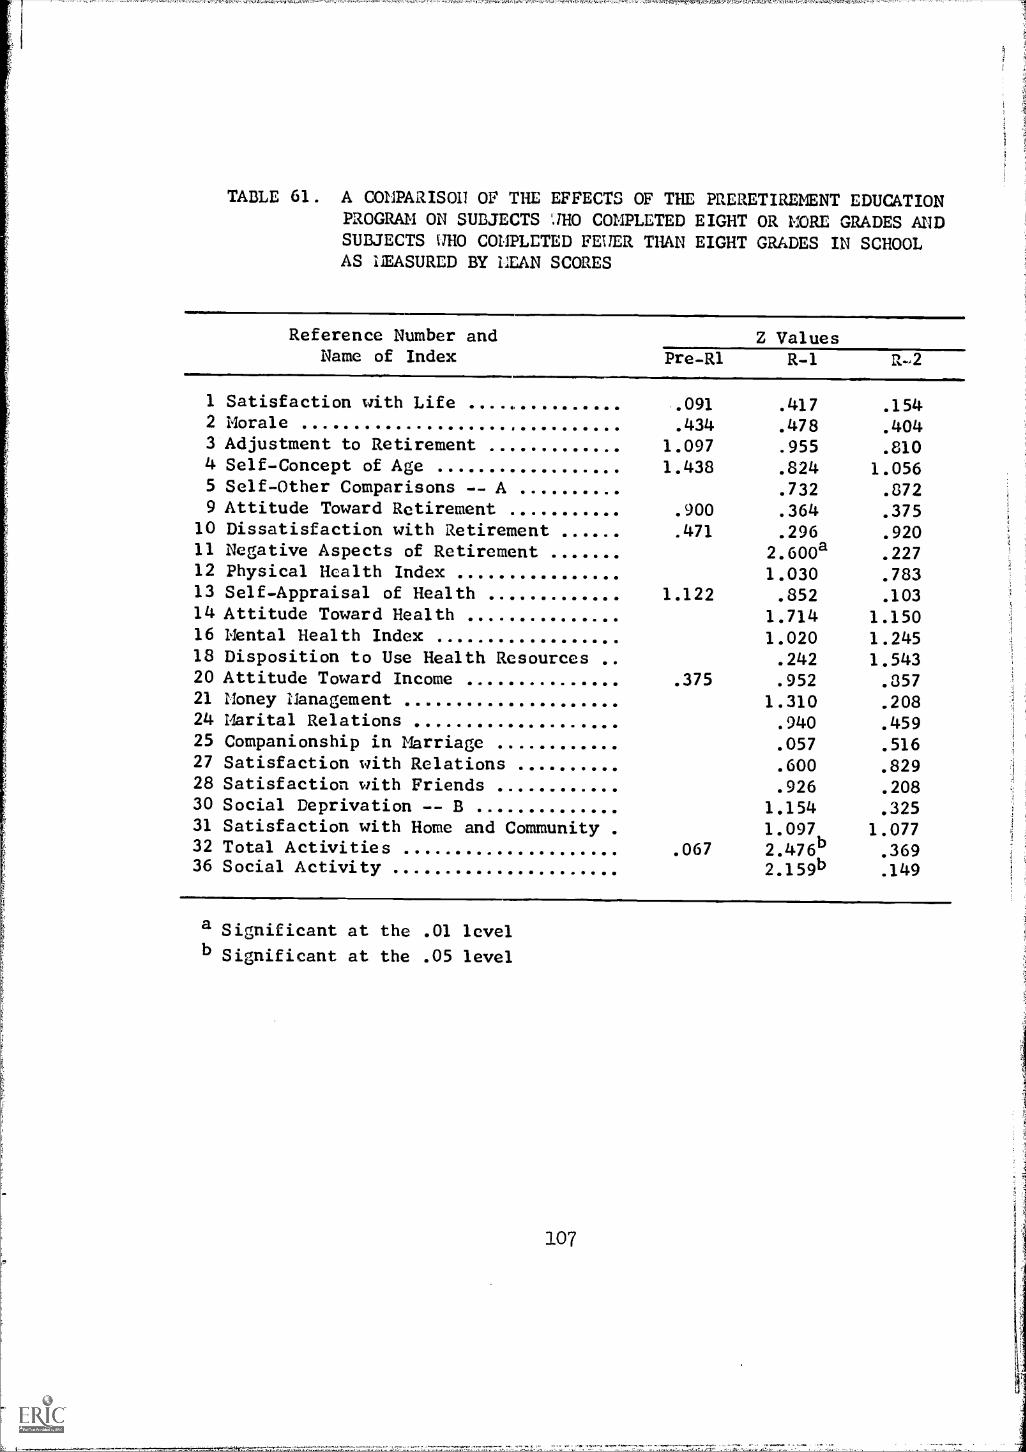
TABLE 61. A COMPARISON OF THE EFFECTS OF THE PRERETIREMENT EDUCATIONPROGRAM ON SUBJECTS 1.7H0 COMPLETED EIGHT OR MORE GRADES ANDSUBJECTS UHO COMPLETED FEUER THAN EIGHT GRADES IN SCHOOLAS LEASURED BY MEAN SCORES
Reference Number andName of Index
Z ValuesPre-R1 R-1 R-2
1 Satisfaction with Life .091 .417 .1542 Morale .434 .478 .4043 Adjustment to Retirement 1.097 .955 .8104 Self-Concept of Age 1.438 .824 1.0565 Self-Other Comparisons -- A .732 .8729 Attitude Toward Retirement .900 .364 .375
10 Dissatisfaction with Retirement .471 .296 .92011 Negative Aspects of Retirement 2.600a .22712 Physical Hcalth Index 1.030 .78313 Self-Appraisal of Health 1.122 .852 .10314 Attitude Toward Health 1.714 1.15016 Mental Health Index 1.020 1.24518 Disposition to Use Health Resources .242 1.54320 Attitude Toward Income .375 .952 .35721 Money Management 1.310 .20824 Mhrital Relations .940 .45925 Companionship in Mhrriage .057 .51627 Satisfaction with Relations .600 .82928 Satisfaction with Friends .926 .20830 Social Deprivation -- B 1.154 .32531 Satisfaction with Home and Community . 1.097 1.07732 Total Activities .067 2.476b .36936 Social Activity 2.159b .149
a Significant at the .01 level
b Significant at the .05 level
107

TABLE 62. A COMPARISON OF TIM EFFECTS OF THE PRERETIREMENT EDUCATIONPROGRAM ON SUBJECTS WITH $6,000 OR MORE INCOME AND SUBJECTSWITH LESS THAN $6,000 INCOM AS MEASURED BY MEAN SCORES
Reference Number andName of Index
Z ValuesPre-R1 R-1 R-2
1 Satisfaction with Life .097 1.778 .4582 Morale .660 .659 .442
3 Adjustment to Retirement 1.188 .125 .857
4 Self-Concept of Age .611 1.706 1.1585 Self-Other Comparisons -- A .681 2.250a9 Attitude Toward Retirement 1.462 .400 .500
10 Dissatisfaction with Retirement 1.605 .892 1.75911 Negative Aspects of Retirement 1.240 1.30412 Physical Health Index 1.500 .84213 Self-Appraisal of Health 1.261 .063 .581
14 Attitude Toward Health 1.302 1.63016 Mental Health Index 1.117 1.60718 Disposition to Use Health Resources .032 .32420 Attitude Toward Income .033 .929 .93921 Money Management .121 .11524 Marital Relations .204 .897
25 Companionship in Marriage .387 .94427 Satisfaction with Relations .702 .20028 Satisfaction with Friends .679 .44430 Social Deprivation -- B .477 .52531 Satisfaction with Home and Community . .371 .40732 Total Activities .650 .891 .92436 Social Activity 1.159 1.030 1.263
a Significant at the .05 level
L
108

TABLE 63. A COMPAaISON OF THE EFFECTS OF TUE PRERETIREMENT EDUCATIONPROGRAM ON SUBJECTS WHO JERE ENGAGED IN SKILLED JOBS ANDSUBJECTS WHO WERE ENGAGED IN UNSKILLED JOBS AS MEASUREDBY MEAN SCORES
Reference Number andName of Index
Z ValuesPre-R1 R-1 R-2
1 Satisfaction with Life 1.786 .800 .769
2 Morale .333 .638 .478
3 Adjustment to Retirement 1.233 2.474 .273
4 Self-Concept of Age 1.563 .765 .765
5 Self-Other Comparisons -- A .227 .632
9 Attitude Toward Retirement ,333 ,000 1.100
10 Dissatisfaction with Retirement 2.629 .741 1.538
11 Negative Aspects of Retirement .450 1.208
12 Physical Health Index .269 .357
13 Self-Appraisal of Health .026 .615 1.148
14 Attitude Toward Health 1.333 .098
16 Mental Health Index .708 .962
18 Disposition to Use Health Resources 1.594 1.378
20 Attitude Toward Income 1.038 .286 1.087
21 Money Management .212 .348
24 Marital Relations 1.314 .235
25 Companionship in Marriage 1.000 .257
27 Satisfaction with Relations .147
28 Satisfaction with Friends 1.241 .792
30 Social Deprivation -- B 1.077 1.163
31 Satisfaction with Home and Community . .903 .077
32 Total Activities .907 .441 1.301
36 Social Activity .986 .153 .777

TABLE 64. A COMPARISOU OF THE EFFECTS oF THE PRERETIREMENT EDUCATIONPROGRAM ON qHITE AND NEGRO SUBJECTS AS MEASURED BY MEANCHANGE SCORES
Reference Number andName of Index
Z ValuesPre-R1to R-1
Pre-R1to R-2
R-1 toR-2
1 Satisfaction with Life 1.244 1.143 0.000
2 Morale 1.471 0.000 .458
3 Adjustment to Retirement .049 .308 0.0004 Self-Concept of Age .098 .057 2179a5 Self-Other Comparisons -- A .8149 Attitude Toward Retirement .),),1
.44A. 1.761 .606
10 Dissatisfaction with Retirement 1.304 1.786 1.791
11 Negative Aspects of Retirement 1.60012 Physical Health Index .122
13 Self Appraisal of Health 2124a 1.498 0.00014 Attitude Toward Health .191
16 Mental Health Index 1.213
18 Disposition to Use Health Resources .623
20 Attitude Toward Income .019 0.000 .534
21 Money Management 3.317b24 Marital Relations 1.78325 Companionship in Marriage 1.021
27 Satisfaction with Relatives .330
28 Satisfaction with Friends .183
30 Social Deprivation -- B (not married). .431
31 Satisfaction with Home and Community . .188
32 Total Activities 1.067
36 Social Activities -- A .086
a Significant at .05 level
b Significant at .001 level
110

TABLE 65. A COMPARISON 02 THE EFFECTS OF THE PRERETIREMENT EDUCATIONPROGRAM ON SUBJECTS BORN IN ENGLISH SPEAKING COUNTRIESAND SUBJECTS BORN IN NON-ENGLISH SPEAKING COUNTRIES ASMEASURED BY MEAN CHANGE SCORES
Reference Number andName of Index
Z Values
Pre-R1to R-1
Pre-R1to R-2
R-1 toR-2
1 Satisfaction with Life .253 .314 0.0002 Morale .741 0.000 .413
3 Adjustment to Retirement .134 .236 0.0004 Self-Concept of Age .577 .342 .1265 Self-Other Comparisons -- A .175
9 Attitude Toward Retirement 1.987a .996 1.53810 Dissatisfaction with Retirement 3.432b .479 .933
11 Negative Aspects of Retirement 1.06312 Physical Health Index 2.847c
13 Self Appraisal of Health . .566 1.123 0.000
14 Attitude Toward Health .739
16 Mental Health Index 1.84418 Disposition to Use Health Resources 2.651c20 Attitude Toward Income .225 0.000 .346
21 Mbney Management 1.092
24 Marital Relations .263
25 Companionship in Marriage .438
27 Satisfaction with Relatives .208
28 Satisfaction with Friends 1.372
30 Social Deprivation -- B (not married). 1.113
31 Satisfaction with Home and Community . .195
32 Total Activities .976 .572 .870
36 Social Activities -- A 1.381 .211 1.210
Significant at the .05 level
b Significant at the .001 level
Significant at the .01 level

,
TABLE 66. A COMPARISON OF TUE EFFECTS OF THE PRERETIREMENT EDUCATION
PROGRAM ON SUBJECTS WITH $6,000 AND MORE INCOME AND
SUBJECTS aITH LESS THAN $6,000 INCOME AS MEASURED BY
MEAN CHANGE SCORES
Reference Number andName of Index
Z Values
Pre-R1to R-1
Pre-R1to R-2
R-1 toR-2
1 Satisfaction with Life 1.610 1.291 0.000
2 Uorale 1.121 0.000 .510
3 Adjustment to Retirement 1.224 .625 0.000
4 Self-Concept of Age .584 .663 .514
5 Self-Other Comparisons -- A .191
9 Attitude Toward Retirement 1.742 .229 .930
10 Dissatisfaction with Retirement .686 .958 .074
11 Negative Aspects of Retirement.379
12 Physical Health Index.341
13 Self Appraisal of Health 1.057 .875 0.000
14 Attitude Toward Health.310
16 Mental Health Index.101
18 Disposition to Use Health Resources.172
20 Attitude Toward Income.730 0.000 1.515
21 Money Management.312
24 Marital Relations.784
25 Companionship in Marriage.504
27 Satisfaction with Relatives.522
28 Satisfaction with Friends.205
30 Social Deprivation -- B (not married)..392
31 Satisfaction with Home and Community . .319
32 Total Activities2.316a .333 .304
36 Social Activities -- A .170 .011 .459
a Significant at the .05 level
112
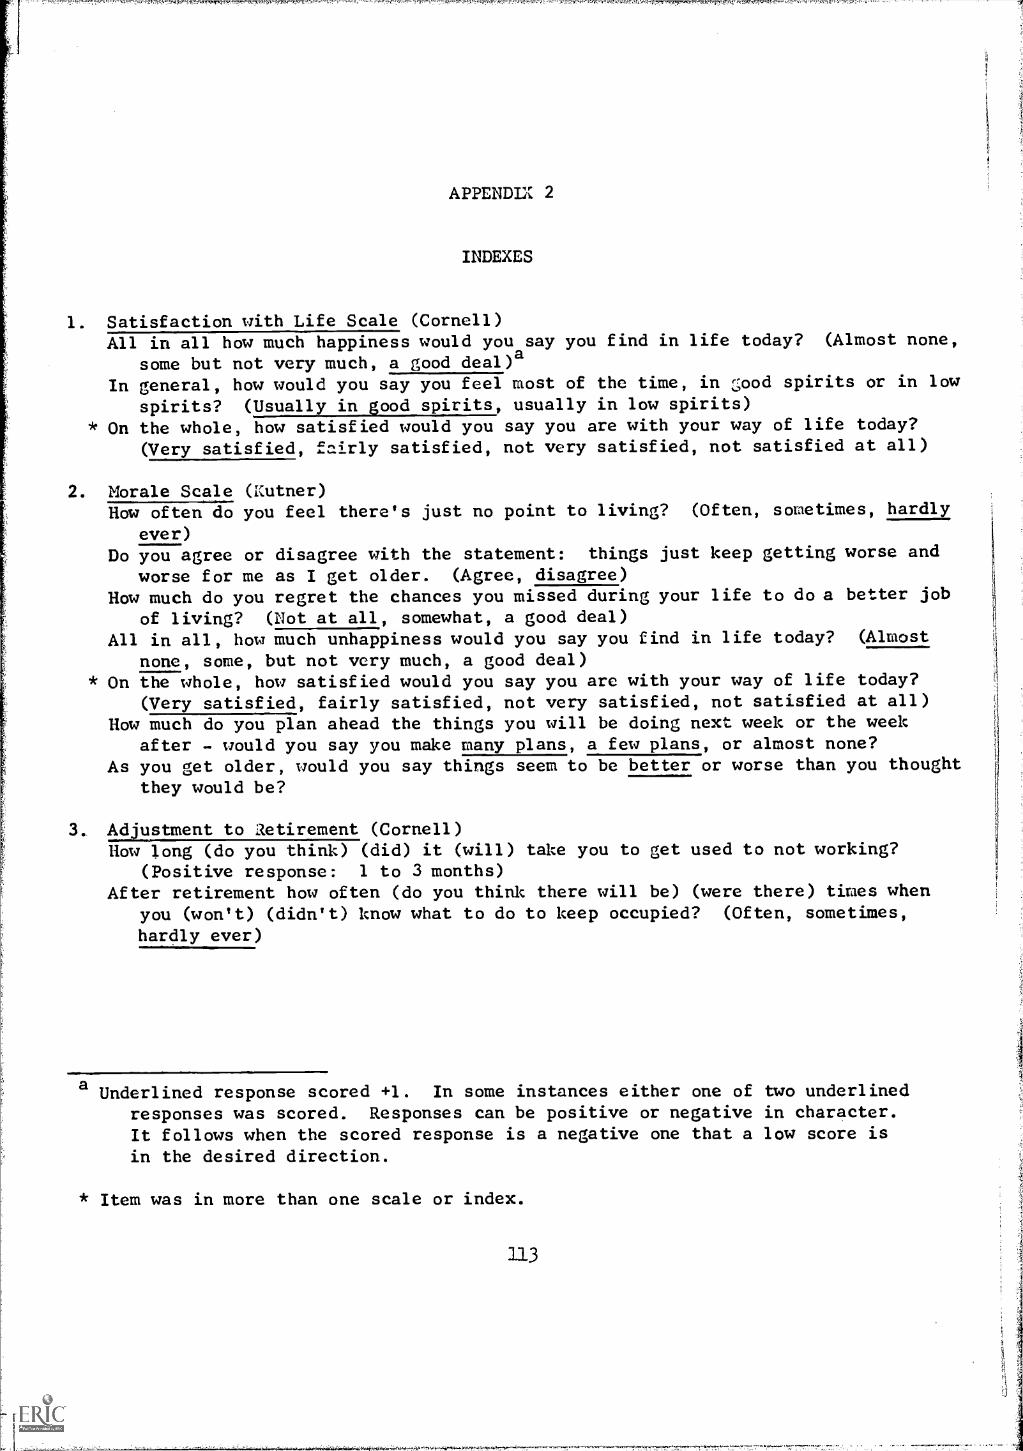
APPENDIX 2
INDEXES
1. Satisfaction with Life Scale (Cornell)All in all how much happiness would you say you find in life today? (hlmost none,
some but not very much, a good deal)aIn general, how would you say you feel most of the time, in ,sood spirits or in low
spirits? (Usually in good spirits, usually in low spirits)* On the whole, how satisfied would you say you are with your way of life today?
(Very satisfied, fairly satisfied, not very satisfied, not satisfied at all)
2. Morale Scale (Kutner)How often do you feel there's just no point to living? (Often, sometimes, hardly
ever)Do you agree or disagree with the statement: things just keep getting worse and
worse for me as I get older. (Agree, disagree)How much do you regret the chances you missed during your life to do a better job
of living? (Not at all, somewhat, a good deal)All in all, how much unhappiness would you say you find in life today? (Almost
none, some, but not very much, a good deal)* On the whole, how satisfied would you say you are with your way of life today?
(Very satisfied, fairly satisfied, not very satisfied, not satisfied at all)How much do you plan ahead the things you will be doing next week or the week
after - would you say you make many plans, a few plans, or almost none?As you get older, would you say things seem to be better or worse than you thought
they would be?
3. Adjustment to Retirement (Cornell)How long (do you think) (did) it (will) take you to get used to not working?
(Positive response: 1 to 3 months)After retirement how often (do you think there will be) (were there) times when
you (won't) (didn't) know what to do to keep occupied? (Often, sometimes,
hardly ever)
a Underlined response scored +1. In some instances either one of two underlinedresponses was scored. Responses can be positive or negative in character.It follows when the scored response is a negative one that a low score isin the desired direction.
* Item was in more than one scale or index.
113
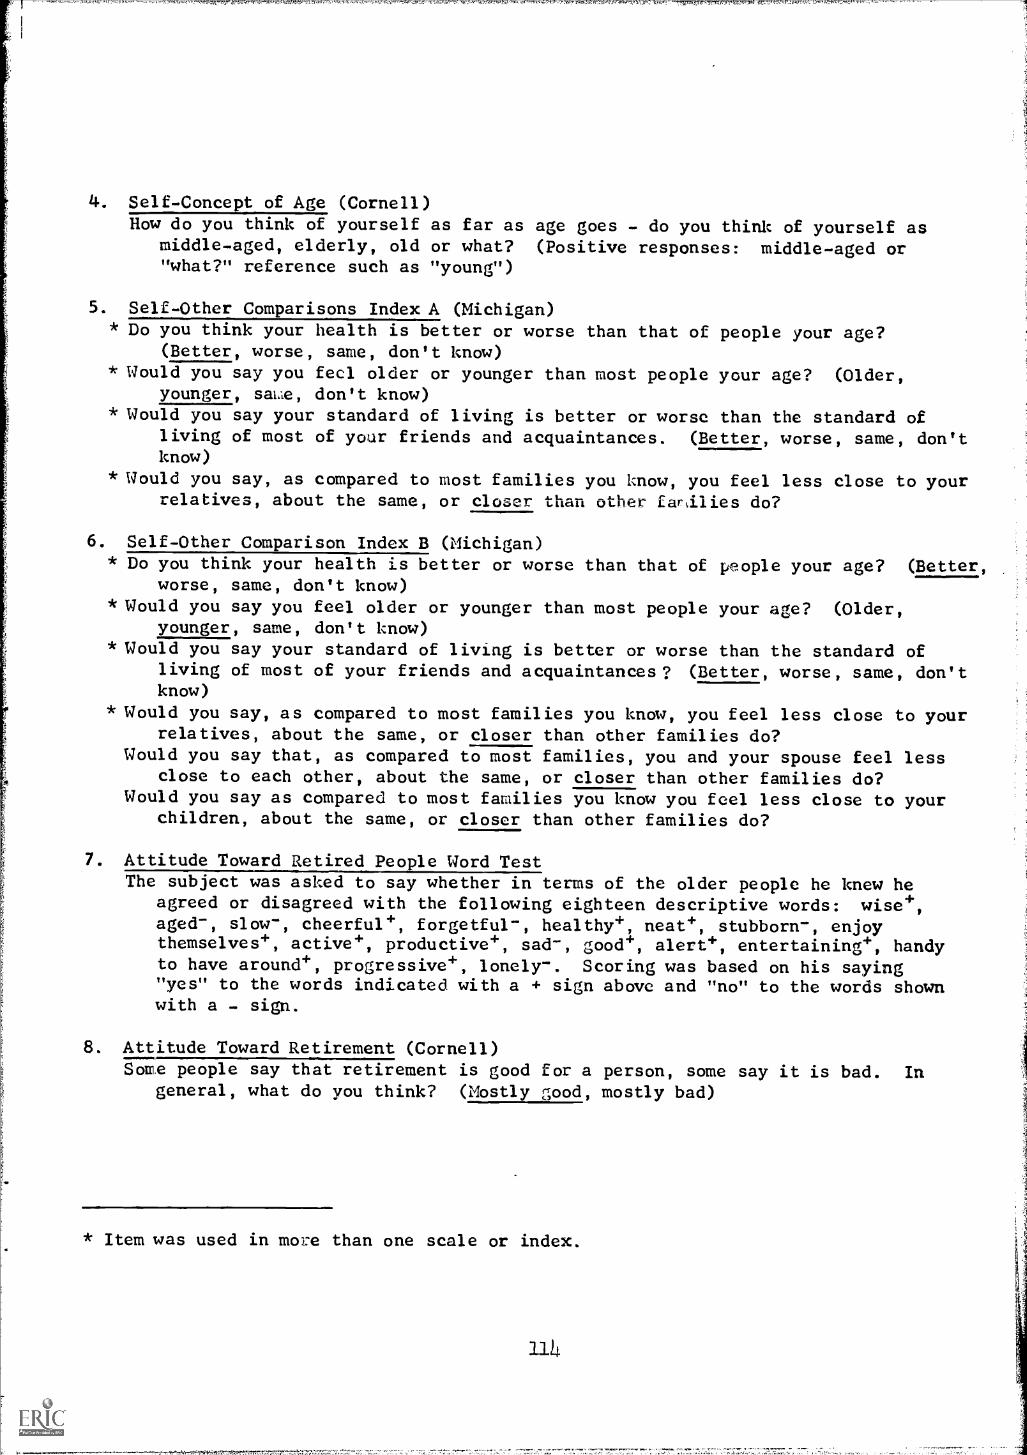
4. Self-Concept of Age (Cornell)How do you think of yourself as far as age goes - do you think of yourself as
middle-aged, elderly, old or what? (Positive responses: middle-aged or"what?" reference such as "young")
5. Self-Other Comparisons Index A (Michigan)* Do you think your health is better or worse than that of people your age?
(Better, worse, same, don't know)* Would you say you fecl older or younger than most people your age? (Older,
younger, saide, don't know)* Would you say your standard of living is better or worse than the standard of
living of most of your friends and acquaintances. (Better, worse, same, don'tknow)
* Would you say, as compared to most families you know, you feel less close to yourrelatives, about the same, or closer than other fardlies do?
6. Self-Other Comparison Index B (Michigan)* Do you think your health is better or worse than that of people your age? (Better,
worse, same, don't know)* Would you say you feel older or younger than most people your age? (Older,
younger, same, don't know)* Would you say your standard of living is better or worse than the standard of
living of most of your friends and acquaintances? (Better, worse, same, don'tknow)
* Would you say, as compared to most families you know, you feel less close to yourrelatives, about the same, or closer than other families do?
Would you say that, as compared to most families, you and your spouse feel lessclose to each other, about the same, or closer than other families do?
Would you say as compared to most families you know you feel less close to yourchildren, about the same, or closer than other families do?
Attitude Toward Retired Peo le Word TestThe subject was asked to say whether in terms of the older people he knew he
agreed or disagreed with the following eighteen descriptive words: wise+,aged-, slow-, cheerful+, forgetful-, healthy+, neat+, stubborn-, enjoythemselves+, active+, productive+, sad-, good+, alert+, entertaining+, handyto have around+, progressive+, lonely-. Scoring was based on his saying"yes" to the words indicated with a + sign above and "no" to the words shownwith a - sign.
8. Attitude Toward Retirement (Cornell)Some people say that retirement is good for a person, some say it is bad. In
general, what do you think? (Mostly good mostly bad)
* Item was used in more than one scale or index.

9. Dissatisfaction with Retirement (Cornell)How often will (do) you miss the feeling of doing a good job? (Often, sometimes,
hardly ever or never)How often will (do) you want to go back to work? (Often, sometimes, hardly ever
or never)
How often will (do) you worry about not having a job to do? (Often, sometimes,hardly ever or never)
How often will (do) you miss being with the other people at work? (Often,sometimes, hardly ever or never)
10. Negative Aspects of Retirement (Cornell)Do you think that stopping work has given you the feeling that your life is not
very useful? (Yes, no, don't know)Do you think that stopping work has made you less satisfied with your way of life
today? (Yes, no, don't know)Do you think that stopping work has made you think of yourself as older or
younger? (Older, no difference, younger, don't know)
11. Preparation for Retirement (Michigan)How well prepared are (were) you for retirement? (Very well, fairly well not
very well, not prepared at all)
12. Physical Health Index (Kutner) A weighted score was assigned for each ofseveral aspects of health:
Confinement to bed because of illness during past year ScoreLess than one week 1
Occasionally 1
One to three weeks 2
Three weeks to one month 3One month and over 4
Deprivations due to illnessIllness keeps subject in home 1
Illness keeps subject from doing things 1
Illness keeps subject from seeing people 1
Illness keeps subject from working around the place 1
Illness keeps subject from all of the above 4
Number of illnessesOne = 1; two = 2; three = 3; four or more = 4
Serious illness, if reported (angina, ulcers, etc., a total of elevenserious illnesses were used as scorable items)One = 1; two = 2; three = 3; four or more = 4
115

13. Health Self-Appraisal (Cornell)Has your health changed during the past year? (No, yes, for better, yes, for
worse)
* How would you rate your health at the present time? (Very poor, poor, fair,good, excellent)
Do you have any particular physical or health problems at present? (Yes, no)Have you been seen by a doctor during the past year? (Yes, no)
14. Attitude Toward Health (Michigan)* How do you rate your health at the present time? Would you say it was very poor
poor, fair, good, or excellent?Do you think your health is better or worse than that of people your age?
(Better, worse, same, don't know)Would you say you feel older or younger than most people your age? (Older,
younger, same, don't know)How would you compare your health now with what it has been during your. life?
Would you say it is now better, worse, or about the same?* When people get older do you think they should be expected to be sick and have
problems with their health? (Yes, no)
15. Worry About Health (Michigan)How often do you worry about your health? Would you say often, sometimes, hard13
ever, or never?
16. Mental Health Index (Michigan)* Haw often do you worry about your health? Would you say often, sometimes, hardly
ever, or never?
How often are you troubled by nervousness? Would you say often, sometimes,hardly ever, or never?
How often are you troubled by not being able to sleep? Would you say, oftensometimes, hardly ever or never?
Was there ever any period in your life in which you were so worried, nervous,or emotionally upset that you could not carry on your usual activities?(Yes, no)
How often do you get up tired and exhausted? Would you say ofte:, sometimes,hardly ever or never?
* When people get older do you think they should expect to be sick and haveproblems with their health? (Yes, no)
Do you have periods of deep sadness that last a long time? (Yes, no)
17. Knowledge About Health Resources (Kutner)Have you ever heard of any of the health services in the Detroit area? (Yes -
must have named one or more services, no)
* Items used in more than one scale or index.
116

18. Disposition to Use Health Resources (Kutner)
If you were suddenly taken very sick where would you turn to for help? Would
you turn to a private doctor, friend, relative, neighbor, druggist, clerama
clinic or hospital, none of these?
If this neighborhood had a medical center just for older people, would you gp
there for advice on your health problems? (Yes, no, don't know)
If there were a medical center especially for older people in this neighborhgod'
would you go there for treatment or would you go to a center where they 0
treated people of all ages? (Center for older people, center for all ages,
don't know)Do you think its a good idea to have a regular, thorough checkup by a doctor
even if there is nothing wrong? (Yes, no, don't know)
19. Use of Health Resources (Michigan)
Where do you usually turn to for advice on health matters? Do you get advice
from physician, spouse, friend, relative, neighbor, druggist, clergyman,
clinic, hospital, none of these?How often do you get a physical check up? (Once or twice a year was scored as
+1)Do you have a regular physician who takes care of you when you get sick? (lu,
no)Do you have any health insurance or do you belong to a medical plan such as
Blue Cross, Blue Shield, Community Health Association? (a2, no)
At the present time are you doing anything specific to keep your health or to
improve it? (Y.422, no - scored +1 if he is using a health resource)
20. Attitude Toward Income (Cornell)Do you consider your present income enough to meet your living expenses?
(aE, no, don't know)How often do you worry about money matters? Would you say often, sometimes,
hardly ever, paver?Is your standard of living better today, that is, are you living better today
- or is it worse than during most of your lifetime? (Better, worse, same,
don't know)
21. Money Management (Michigan)How often do you worry about money matters? Would you say
hardly ever, never?Do you figure it is a waste of time trying to do something
situation? (Yes, no)
often, sometimes,
about your financial
Do you budget your living expenses at the present time, that is, do you set
aside a certain amount of money each week for such things as good, clothing,
medicine and recreation and then try to stick to it? (Yes, no)
Have you figured out how much interest you are paying on the things you are
buying on time? (yss, no)What kinds of changes do you plan on making in the way you spend your income?
(Scored +1 for use c-rKore planful actions)
How often do you and your wife disagree about money matters? Would you say
often, sometimes, hardly ever, never?
117

22. Family Decision Making (Blood and Wolfe)The ten decisions listed below were used as a basis for estimating the relative
balance of power in family decision making between husbands and wives.
1. What car to buy?2. How much money the family can afford to spend weekly on food?3. What to have for meals?4. What repairs to make on the home?5. Where to go on a trip?6. Whether or not to have children or relatives come for a visit?7. Whether or not to go to a doctor when someone is sick?8. What to do for children or relatives?9. What to do when going out for the evening?
10. Whether or not the husband should find work to do?
Subject were given a choice of five responses, scored as follows for each of thedecisions.
Response Scorehusband always 5
husband more than the wife 4husband and wife exactly the same 3wife more than the husband 2wife always 1
23, Family.Division of Labor (Blood and Wolfe)Respondents were asked to give one of five responses to a list of ten tasks.
The tasks and the five possible responses are listed below:
Tasks
Who repairs things aroundthe house?
Who maws the lawn?Who shovels the sidewalk?Who keeps track of the
money and bills?Who does the grocery
shopping?Who gets breakfast?Who straightens up the
living room whencompany is coming?
Who does the evening dishes?
Responses
Wife always
Wife more than husband
Wife and husband exactlythe same
Husband more than wife
Husband always
118
Score
5
4
3
2
1

41-
24. Marital Relations (Michigan)Would you say that disagreements come up in your household more often, about the
same, or less often than other families you know?
Would you say that, as compared to most families you know, you and your spouse
feel less close to each other, about the same or closer than other families do?
* When you have had a bad day how often do you tell your spouse about your troubles?
Would you say often, sometimes, hardly ever, never?How do you feel about the understanding you get fran your spouse of your problems
and feeling? (Very satisfied, fairly satisfied, not very satisfied, not
satisfied at all)How do you feel about the love and affectioitsyou receive? (Very satisfied,
fairly satisfied, not very satisfied, not satisfied at all)
* How do you feel about the companionship in doing things together? (Very satisfied
fairly satisfied, not very satisfied, not satisfied at all)Some people say that their spouse has helped them get used to retirement? Has
your spouse helped you in this way? (Yes, no)
25. ILEL21_2222-222.1.1i12 (Blood and Wolfe)* When you've had a bad day how often do you tell your spouse about your troubles?
Would you say often, sometimes, hardly ever, never?Thinking of marriage in general, which one of the five things on this card would
you say is the most valuable part of marriage? ("Companionship with spouse"
was scored +1)* How do you feel about the companionship in doing things together? (Very satisfied
fairly satisfied, not very satisfied, not satisfied at all)
Abour how many of jour close friends are also close friends of your spouse?
Would you say all of them, most of them, about half, some of them, or none?
26. Satisfaction with Children (Michigan)
Do you see your children as often as you would like to? (Yes, no)
What kindsof things do you do to help out your children? (Scored +1 for one or
more kinds of help)What kind of things do your children do to help you out? (Scored +1 for one or
more kinds of help)How well do you get along with your children? Would you say very well, fairly
well, poorly, very poorly)How often do you worry about your children? Would you say often, sometimes,
hardly ever, never?Would you say, as compared to most families you know, you feel less close to
your children, about the same, or closer than other families do?
27. Satisfaction with Relatives (Michigan)
Do you see your relatives as often as you would like to? (Yes, no)
What kinds of things do you do to help out your relatives? (Scored +1 for one
or more kinds of help)What do your relatives do to help you out? (Scored +1 for one or more kinds
of help)How well do you get along with your relatives? Would you say very well, fairly
well, poorly, very poorly?Would you say, as compared to most families you know, you feel less close to your
relatives, about the same, or closer than other families do?
* Items used in more than one index.
119

28. Satisfaction with Friends (Michigan)
Are your contacts with your friends more frequent than they were before you
retired, less, or about the same as before?Do you see your friends as often as you would like to? (Yes, no)
Have you made any new friends since you retired? (Yes, no)
29. Social Deprivations - A (Michigan)
* (a) How do you feel about the companionship in doing things together with your
spouse? ("not very satisfied" or "not satisfied at all" scored +1)
* (b) Do you see your children as often as you like to? (Yes, no)
* (c) Would you say, as campared to most families you know, you feel less close t
your children, about the same, or closer than other families do?
* (d) Do you see your relatives as often as you would like to? (Yes, no)
* (e) Would you say, as compared to most families you know, you feel less close t
your relatives, about the same, or closer than other families do?
* (f) Do you see your friends as often as you would like to? (Yes, no)
(g) How often do you find yourself wishing you could meet more new friends -
would you say often, sometimes, hardly ever, never?(h) How often do you miss being with the other people at work - often, sometim
hardly ever or never?
30. Social Deprivations - B (gichigan)
This is a five item index made up of items 29d, e, f, g, and h. It applies on
to singlc persons.
31. Satisfactions with Home and Community (Michigan)
What are the things you like about living in this home? (Scored +1 for one or
more thingsWhat would you say are the good things about living in this neighborhood?
(Scored +1 for one or more good things)Do you expect to stay in this area for most of your lifetime? (Yes, no)
32. Total Activities (Michigan)Subjects were asked to look at a list of 19 activities of all kinds and state
whether they participated in each one often, sometimes, hardly ever or neve
("Often" was scored +1)
33. Sedentary Activities (Michigan)
Subjects wure asked to look at the following list of eight sedentary activitie
and to state whether they participated in each one often, sometimes, hardly
ever or never. ("Often" = +1)
Write lettersReadListen to radioWatch television
* Items used in more than one index.
Go to moviesTalk with friendsPlay cardsTake auto rides
120

34 /112isicaLAELiyity. (Michigan)
ActivityTake walksWork around houseWork in garden or yard
Go hunting, fishing orother outdoor sports
35. Mass Media (Michigan)Activity
ReadListen to radioWatch televisionGo to the movies
36. Social Activity (Hichigan)Activity
See children, grandchildren,relatives
Write letters to family orfriends
Go visit friends or relativesEntertain relatives or friends
in homeAttend churchAttend union, club, or lodgeTalk with friendsPlay cardsGo to tavern or bar
`.,
ScoreScored "often" +1
ScoreScored "often" +1
ScoreScored "often" +1
37. Social Activity with Family and Friends (Michigan)Activity Score
See children, grandchildren, Scored "often" +1relatives
Write letters to family orfriends
Go visit friends or relativesEntertain relatives or friends
in homeTalk with friends
38. Individual Activity (MichiganActivity
Write lettersWatch sport eventReadListen to radioWatch televisionWatch moviesTake walksWork around houseWork in gardenTake auto ridesGo hunting or fishing
Score"often" was score., +1
121
ERIC Clo-atiighotlt
OCT141G68
on Adult EdticAM