
Imtech press release - Financial Results 3th Quarter 2014
17
1 press release 18 November 2014 Royal Imtech publishes third quarter 2014 results Significant debt reduction paves way for operational recovery x Financial solution implemented providing stability going forward o Pro forma net interest-bearing debt per 30 September down to 364 million euro o Pro forma equity per 30 September 482 million euro x Revenue in the third quarter 940 million euro, first nine months 2,892 million euro x Operational EBITDA loss improved and now limited to 5.6 million euro in Q3 x Order intake continues to develop favourably with book-to-bill ratio well over 90%, both in quarter and first nine months x Legacy items further reduced x Non-operating items such as restructuring, advisory and financing costs of 70 million euro in Q3 and 320 million euro for the first nine months drive negative result x Non-operating items nearing completion x Improved working capital target bandwidth set at -3% to 0% of revenue Key figures Quarters in € million, unless otherwise indicated First nine months Q3 2014 Q3 2013 * 2014 2013 * 940.2 1,064.4 Revenue and other income 2,892.2 3,226.5 -5.6 -8.4 Operational EBITDA -30.5 -67.1 -24.9 -28.0 Non-operational costs -94.8 -129.4 -30.5 -36.4 EBITDA -125.3 -196.5 -44.0 -56.8 Operating result (EBIT) -165.9 -254.0 -75.0 -89.2 Result from continuing operations -306.7 -317.8 - -6.9 Result from discontinued operations -69.8 -8.8 -75.0 -96.1 Net result -376.5 -326.6 862.4 936.1 Order intake 2,817.3 3,028.5 89.2 335.7 Working capital 89.2 335.7 1,135.3 835.7 Net interest-bearing debt (for the group) 1,135.3 835.7 1,157.4 835.7 Net interest-bearing debt (as reported) 1,157.4 835.7 Margins -0.6% -0.8% Operational EBITDA margin -1.1% -2.1% -3.2% -3.4% EBITDA margin -4.3% -6.1% 23,021 25,046 Number of employees (in FTE) 23,021 25,046 Unaudited figures * Restated, see notes 4 and 5 to the Interim Financial Statements H1 2014. Gerard van de Aast, CEO: “With the financial restructuring having been addressed we can now fully focus on further operational improvement. Whilst significant progress has been made, we still need decisive improvement in our performance specifically in Germany & Eastern Europe and the Benelux. We are executing plans to drive improvement in project execution as well as a reduction in and upgrade of our back office functions and related costs. We have derisked our project execution profile by enhanced tendering procedures and are running our business with working capital well within our defined target range. On the back of these measures we confirm the achievability of our mid-term financial targets.”
Transcript of Imtech press release - Financial Results 3th Quarter 2014

1
press release 18 November 2014
Royal Imtech publishes third quarter 2014 results
Significant debt reduction paves way for operational recovery
x Financial solution implemented providing stability going forward o Pro forma net interest-bearing debt per 30 September down to 364 million euro o Pro forma equity per 30 September 482 million euro
x Revenue in the third quarter 940 million euro, first nine months 2,892 million euro x Operational EBITDA loss improved and now limited to 5.6 million euro in Q3 x Order intake continues to develop favourably with book-to-bill ratio well over 90%, both in quarter
and first nine months x Legacy items further reduced x Non-operating items such as restructuring, advisory and financing costs of 70 million euro in Q3
and 320 million euro for the first nine months drive negative result x Non-operating items nearing completion x Improved working capital target bandwidth set at -3% to 0% of revenue
Key figures
Quarters
in € million, unless otherwise indicated
First nine months
Q3 2014 Q3 2013* 2014 2013*
940.2 1,064.4 Revenue and other income 2,892.2 3,226.5 -5.6 -8.4 Operational EBITDA -30.5 -67.1
-24.9 -28.0 Non-operational costs -94.8 -129.4 -30.5 -36.4 EBITDA -125.3 -196.5 -44.0 -56.8 Operating result (EBIT) -165.9 -254.0 -75.0 -89.2 Result from continuing operations -306.7 -317.8
- -6.9 Result from discontinued operations -69.8 -8.8 -75.0 -96.1 Net result -376.5 -326.6 862.4 936.1 Order intake 2,817.3 3,028.5
89.2 335.7 Working capital 89.2 335.7 1,135.3 835.7 Net interest-bearing debt (for the group) 1,135.3 835.7 1,157.4 835.7 Net interest-bearing debt (as reported) 1,157.4 835.7
Margins -0.6% -0.8% Operational EBITDA margin -1.1% -2.1% -3.2% -3.4% EBITDA margin -4.3% -6.1%
23,021 25,046 Number of employees (in FTE) 23,021 25,046
Unaudited figures * Restated, see notes 4 and 5 to the Interim Financial Statements H1 2014. Gerard van de Aast, CEO: “With the financial restructuring having been addressed we can now fully focus on further operational improvement. Whilst significant progress has been made, we still need decisive improvement in our performance specifically in Germany & Eastern Europe and the Benelux. We are executing plans to drive improvement in project execution as well as a reduction in and upgrade of our back office functions and related costs. We have derisked our project execution profile by enhanced tendering procedures and are running our business with working capital well within our defined target range. On the back of these measures we confirm the achievability of our mid-term financial targets.”
Jean Muls
Jean Muls
Note : Imtech Belgium results not reported separately.See relevant indications page 7.

2
Financial solution implemented In October 2014, we implemented the previously announced financial solution (rights issue and sale of ICT division). The pro forma net interest-bearing debt per 30 September reduced significantly to 364 million euro and pro forma equity position returned to a positive amount of 482 million euro.
Pro forma balance sheet after implementation of financial solution:
in € million Actual as of
30 Sep 2014
Pro forma after implementation
financial solution 30 Sep 2014
Property plant and equipment 131.9 131.9 Goodwill 809.9 809.9 Other intangible assets 94.5 94.5 Other non-current assets 51.9 77.8 Non-current assets 1,088.2 1,114.1 Working capital 89.2 90.3 Assets held for sale 427.2 - Capital employed 1,604.6 1,204.4
Equity -101.2 481.9 Net interest-bearing debt* 1,157.4 364.4 Other non-current liabilities 40.7 32.0 Restructuring provisions 9.4 9.4 Other liabilities 316.6 316.7 Liabilities held for sale 181.7 - Funding 1,604.6 1,204.4
Unaudited figures * See Appendix 7 for a further breakdown of net interest-bearing debt
Pro forma capital employed is 400 million euro lower than reported, mainly due to the decrease of assets held for sale in relation to our ICT division (427 million euro).
Pro forma equity increases with 583 million euro to 482 million euro mainly due to the net proceeds of the rights issue of 567 million euro and a capital gain of 31 million euro on the debt buyback programme.
One-off and financing costs drive negative result of 75 million euro in Q3 The net loss for the third quarter of 75 million euro includes an operational EBITDA loss of 5.6 million euro and significant and financing costs:
in € million Q3 2014 First nine months 2014
Operational EBITDA -5.6 -30.5 Non-operational costs -24.9 -94.8 EBITDA -30.5 -125.3 Depreciation -7.8 -22.2 Amortisation & impairment -5.7 -18.4 Operating result (EBIT) -44.0 -165.9 Net finance result -44.6 -165.5 Share of results of associates, joint ventures and other investments 11.9 12.5 Income tax benefit 1.7 12.2 Result from continuing operations -75.0 -306.7 Result from discontinued operations - -69.8 Net result -75.0 -376.5
Unaudited figures
Jean Muls
Text

3
Specification of non-operational costs and net finance result:
in € million Q3 2014 First nine months 2014
Non-operational costs 24.9 94.8 Restructuring costs 13.7 30.3 Advisory cost 8.9 33.7 Other non-operational items 2.3 30.8 Net finance result 44.6 165.5 Net interest expense 30.1 127.6 Cost of guarantees 3.4 8.8 Other finance expenses 11.1 29.1 Non-cash part of Net finance result 15.0 85.0 One-off items within Net finance result Cash amendment fee - 13.6 Paid-in-Kind amendment fee (non-cash) - 9.5 Make whole amount (non-cash) - 31.9 Amortization capitalised cost (non-cash) - 18.3 73.3
Unaudited figures
For the third quarter 2014 The restructuring costs of 13.7 million euro relate mainly to Germany & Eastern Europe, Nordic, UK & Ireland and Marine. The cost for the additional restructuring measures as announced on 26 August 2014 relating to headcount reduction and real estate rationalisation have not yet been included in the Q3 2014 results.
Other finance expenses amounted to 11.1 million euro and include amongst others employee benefits and net currency exchange loss. The capital gain from the debt buy back of 31 million euro will be recorded in the net finance result in Q4 2014, net of other one-off financing costs.
In Q3 2014 the share of results of associates, joint ventures and other investments is 11.9 million euro positive and includes a book profit on the sale of the investment in associate IHC Systems.
For the first nine months 2014 The advisory costs of 33.7 million euro include an amount of 25 million euro which is related to the implementation of the Medium Term Solution as announced on 18 March 2014, while the remainder of the advisory costs is related to the implementation of the financial solution in October 2014. The other non-operational items of 30.8 million euro mainly relate to the closure of the Russian business, the termination of a German sponsorship agreement, the settlement on the NKS project in Nordic and closure of legacy items (sale of a commercial building in Germany and the settlement of a 2010 project dispute in Spain).
The one-off items for the first nine months within net finance result amounted to 73.3 million euro. All one-off items relate to the implementation of the Medium Term Solution as announced on 18 March 2014.
On 27 October 2014, the revised interest agreements became effective. The revolving credit facility has a margin on euribor of 3.75% and the senior notes have an interest of around 7%. Guarantee fees range from 1.9%-2.25%. Going forward, all interest and guarantee cost will be cash.

4
Financial performance
Profit and loss account
Quarters
in € million
First nine months
Q3 2014 Q3 2013* 2014 2013*
940.2 1,064.4 Revenue and other income 2,892.2 3,226.5 -5.6 -8.4 Operational EBITDA -30.5 -67.1
-24.9 -28.0 Non-operational costs -94.8 -129.4 -30.5 -36.4 EBITDA -125.3 -196.5
-7.8 -8.7 Depreciation -22.2 -25.5 -5.7 -11.7 Amortisation & impairment -18.4 -32.0
-44.0 -56.8 Operating result (EBIT) -165.9 -254.0 -44.6 -25.5 Net finance result -165.5 -79.9
11.9 -4.4 Share of results of associates, joint ventures
and other investments 12.5 -5.1
1.7 -2.5 Income tax benefit 12.2 21.2
-75.0 -89.2 Result from continuing operations -306.7 -317.8 - -6.9 Result from discontinued operations -69.8 -8.8
-75.0 -96.1 Net result -376.5 -326.6
Unaudited figures * Restated, see notes 4 and 5 to the Interim Financial Statements H1 2014.
Third quarter 2014 Market conditions during Q3 2014 remained challenging in the Netherlands, UK, Finland and Spain. Elsewhere market conditions remained unchanged. Since Q2 2014, a number of divisions noticed that the uncertainty and turmoil around the company had a negative impact on the new order pipeline. The publication of the financial measures on 26 August 2014 had a positive impact on customer and other stakeholder sentiment which will facilitate a return to normalised trading conditions. However, the residual effect of the past uncertainty and turmoil could have an impact on order intake in the next few months to come.
In Q3 2014, revenue came in 12% lower at 940 million euro compared with Q3 2013, mainly due to weak market conditions in the Netherlands, UK and Finland, and the continued impact of our decision to prioritise margin over volume in Germany & Eastern Europe. Exceptions are Marine and Spain with increases of revenue.
The operational EBITDA in Q3 2014 resulted in a loss of 5.6 million euro. This is a slight improvement compared to Q3 2013, when operational EBITDA amounted to a loss of 8.4 million euro. Germany & Eastern Europe and Benelux are the main contributors to the operational EBITDA loss, which is further specified on page 8.
Depreciation in Q3 2014 was 7.8 million euro (Q3 2013: 8.7 million euro). Amortisation and impairment was 5.7 million euro. In Q3 2013, amortisation and impairment amounted to 11.7 million euro which included the one-off accelerated amortisation of the brand name NVS in Nordic.
The effective tax rate for Q3 2014 amounted to -2.2% (Q2 2013: 2.9%). The effective tax rate is impacted by losses made in 2014 and the specific guidance from IFRS with regard to recognition of deferred tax assets.
5
Result for the period, result per share
Quarters
in € million, per share in euro
First nine months
Q3 2014 Q3 2013 2014 2013
-75.0 -96.1 Net result -376.5 -326.6 0.5 0.8 Non-controlling interests 1.0 3.5
-75.5 -96.9 Net result for shareholders -377.5 -330.1 5.7 11.7 Amortisation & impairment 18.4 32.0
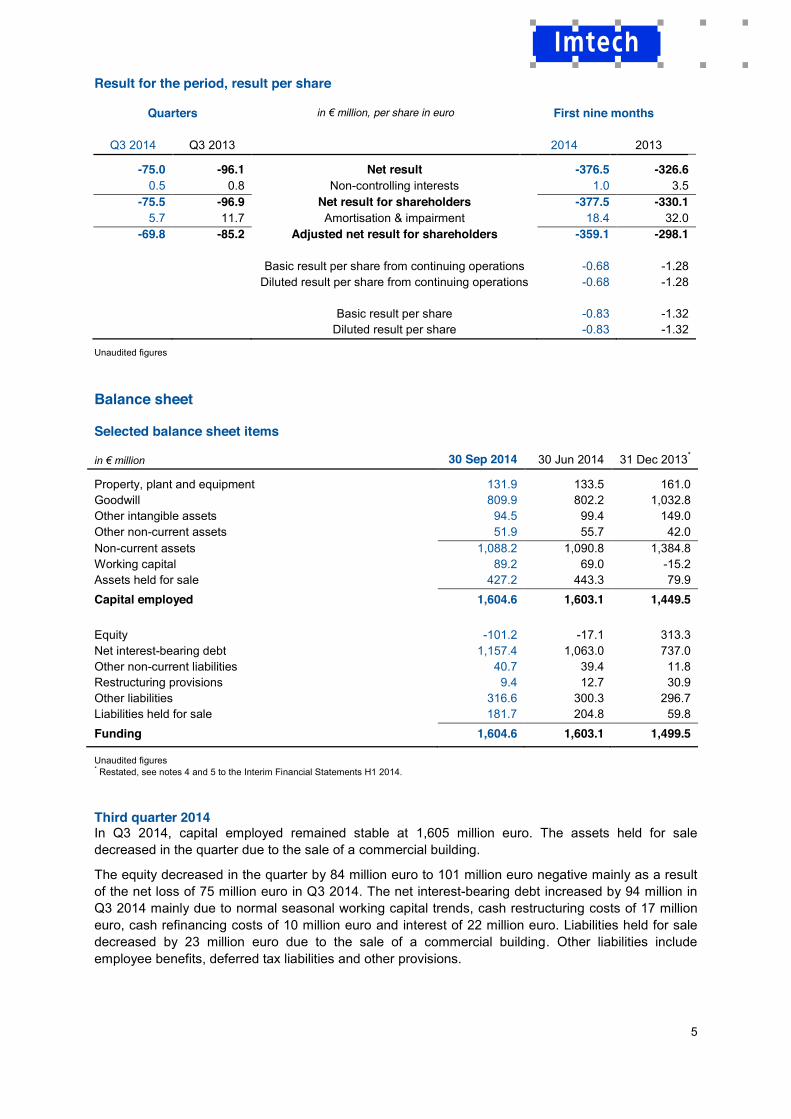
-69.8 -85.2 Adjusted net result for shareholders -359.1 -298.1 Basic result per share from continuing operations -0.68 -1.28 Diluted result per share from continuing operations -0.68 -1.28 Basic result per share -0.83 -1.32 Diluted result per share -0.83 -1.32
Unaudited figures
Balance sheet
Selected balance sheet items in € million 30 Sep 2014 30 Jun 2014 31 Dec 2013*
Property, plant and equipment 131.9 133.5 161.0 Goodwill 809.9 802.2 1,032.8 Other intangible assets 94.5 99.4 149.0 Other non-current assets 51.9 55.7 42.0 Non-current assets 1,088.2 1,090.8 1,384.8 Working capital 89.2 69.0 -15.2 Assets held for sale 427.2 443.3 79.9 Capital employed 1,604.6 1,603.1 1,449.5 Equity -101.2 -17.1 313.3 Net interest-bearing debt 1,157.4 1,063.0 737.0 Other non-current liabilities 40.7 39.4 11.8 Restructuring provisions 9.4 12.7 30.9 Other liabilities 316.6 300.3 296.7 Liabilities held for sale 181.7 204.8 59.8 Funding 1,604.6 1,603.1 1,499.5
Unaudited figures * Restated, see notes 4 and 5 to the Interim Financial Statements H1 2014.
Third quarter 2014 In Q3 2014, capital employed remained stable at 1,605 million euro. The assets held for sale decreased in the quarter due to the sale of a commercial building.
The equity decreased in the quarter by 84 million euro to 101 million euro negative mainly as a result of the net loss of 75 million euro in Q3 2014. The net interest-bearing debt increased by 94 million in Q3 2014 mainly due to normal seasonal working capital trends, cash restructuring costs of 17 million euro, cash refinancing costs of 10 million euro and interest of 22 million euro. Liabilities held for sale decreased by 23 million euro due to the sale of a commercial building. Other liabilities include employee benefits, deferred tax liabilities and other provisions.

6
Working capital in € million, unless otherwise indicated 30 Sep 2014 30 Jun 2014 31 Dec 2013*
Work in progress (net) 149.6 176.2 178.8 Trade receivables 616.4 604.6 868.1 Other current assets 207.4 187.3 221.2 973.4 968.1 1,268.1 Trade payables 502.5 515.2 773.8 Other current liabilities 381.7 383.9 509.5 884.2 899.1 1,283.3 Working capital 89.2 69.0 -15.2 As % of LTM revenue 2.3% 1.7% -0.3% Working capital excluding remaining legacy items 45.6 9.8 -90.9 As % of LTM revenue 1.2% 0.2% -1.8%
Unaudited figures * Restated, see notes 4 and 5 to the Interim Financial Statements H1 2014.
Working capital development in the quarter is in line with the normal seasonal pattern and well within the target bandwidth of 0-3% of revenue. From next year, the new target bandwidth for working capital is -3% to 0% of revenue.
Other current assets include inventories, prepaid operating expenses, purchase bonuses and rebated from suppliers, VAT receivable, income tax receivables and various other receivables.
Other current liabilities include accrued project expenses (69 million euro), accrued personnel expenses (160 million euro), VAT payable (36 million euro), income tax payables (8 million euro) and various other accrued liabilities.
Remaining legacy items As announced on 3 February 2014, there are remaining legacy items on the balance sheet. At the end of Q3 2014 the total amount of remaining legacy items in working capital amounts to 43.6 million euro, a decrease of 15.6 million euro compared to Q2 2014. This decrease is related to closure respectively progress of some legacy items in Germany and Spain.
Cash flow statement
Third quarter 2014 The net cash flow from operating activities in Q3 2014 amounts to 93 million euro negative. The cash flow was mainly impacted by a negative EBITDA of 31 million euro, 26 million euro increase of working capital in the quarter and paid interest of 22 million euro
The net cash flow from investing activities in Q3 2014 was 33 million euro positive, mainly due to sale of a commercial building. Net capital income in Q3 2014 for property, plant & equipment and intangible assets amounted to 20 million euro, including the proceeds of the sale of a commercial building.

7
Performance by division
Revenue Operational EBITDA Order intake in € million Q3 2014 Q3 2013 Q3 2014 Q3 2013 Q3 2014
Benelux 149.6 168.1 -4.3 -1.2 169.3 Germany & Eastern Europe 201.6 269.3 -8.3 -19.7 117.6 UK & Ireland 170.8 201.1 2.9 9.7 181.9 Nordic 183.8 202.2 8.9 6.6 172.4 Spain 32.8 28.3 -0.2 -0.8 22.4 Traffic & Infra 88.5 88.9 0.3 4.0 89.2 Marine 115.9 112.2 0.4 -1.6 109.6 Group management -2.8 -5.7 -5.3 -5.4 - Total 940.2 1,064.4 -5.6 -8.4 862.4 Discontinued operations** 148.3 251.9 5.4 5.9 152.3 For the total group 1,088.5 1,316.3 -0.2 -2.5 1,014.7
Unaudited figures * Restated, see notes 4 and 5 to the Interim Financial Statements H1 2014. ** Discontinued operations in 2013 consist of ICT and Arma-Elektropanç.
In Benelux, performance in Q3 2014 was weak, also impacted by the difficult market conditions in the Netherlands. Revenue Q3 2014 amounted to 150 million euro. Operational EBITDA was a loss of 4.3 million euro which is higher than Q3 2013 loss due to project losses as well as lower production levels in the Dutch industrial business. These items are partly compensated by positive results in Belgium and Luxembourg. Order intake amounted to 169 million euro, in excess of quarterly revenue. An interesting contract awarded is the engineering and installation of climate systems and a hot-and-cold storage system for the Hospital Maas en Kempen in Belgium.
Germany & Eastern Europe made progress with its recovery programme ‘Neue Imtech’. Revenue in the quarter amounted to 202 million euro. Operational EBITDA was a loss of 8.3 million euro, which is an improvement compared to Q3 2013. Order intake in Q3 2014 was significantly lower than revenue and amounted to 118 million euro, mainly as a result of our focus in prioritising margin over volume. Good contract awarded in Q3 2014 is the creation of efficient and economic energy supply for the new build SLK hospital in Germany.
In UK & Ireland, performance in the quarter was at a reasonable level given closure of our business in Kazakhstan and challenging market conditions in the UK. Revenue decreased by 30 million euro to 171 million euro. Operational EBITDA was 6.8 million euro down to 2.9 million euro. Revenue is recovering from start-up delays in previous quarters. Operational EBITDA was lower due to low production levels as a result of weak conditions in UK engineering services markets. Order intake amounted to 182 million euro, well in excess of quarterly revenue. This includes a significant order awarded by a customer in the UK infrastructure market for providing a refurbishment and upgrade of technical facilities.
Nordic performance in Q3 2014was strong. Revenue was 9% down and amounted to 184 million euro. Operational EBITDA increased by 2.3 million euro to 8.9 million euro due to improved project execution and results in Sweden and Norway, offset by a loss in Finland. Order intake amounts to a satisfactory 172.4 million euro. Interesting new order awarded is for the installation of climate and sanitation systems in the new to be built headquarter for Telia Sonera in Stockholm.
Revenue in Spain was 4.5 million euro up to 32.8 million euro due to higher production levels. Operational EBITDA improved though still a loss of 0.2 million euro due to low project results and contract margins as a result of challenging market conditions. Order intake was at 22.4 million euro.
Traffic & Infra performance in Q3 2014 was unsatisfactory. Revenue remained stable at 88.5 million euro. Operational EBITDA decreased by 3.7 million euro to 0.3 million euro due to poor execution and project losses in the Dutch operations. Order intake amounted to 89.2 million euro, in line with revenue. An interesting new contract awarded is the optimisation of the railway bridge over the Van Harinxma canal in the Netherlands by enabling operation via remote control.
Jean Muls
Jean Muls
Jean Muls
Jean Muls

8
In Marine, good progress was made on performance. Revenue was up 3% up to 116 million euro and operational EBITDA increased by 2 million euro to 0.4 million euro positive, despite project losses at Dutch and Germany operations. In Q2 2014, a defence sector customer of a large multi-year project started an audit on the project records. Such an audit is customary in this industry given the nature of the contract. The audit is on-going and could result in modifications of contractual agreements and/or a non-operational write-off. Order intake amounted to 110 million euro. Interesting new contract awarded is installation of climate systems for two Star Cruises vessels at Meyer Werft.
Group management operational EBITDA amounted to -5.3 million euro, in line with Q3 2013.
In Q3 2014, Discontinued operations relate to the ICT division.
Outlook 2014 is a transition year in which we are implementing the next phase of our operational and financial recovery programme. Given the size of this transition and the challenging market circumstances, no specific forecasts are given regarding 2014.
Board of Management Royal Imtech N.V. Gouda, 18 November 2014
Financial calendar 2014 and 2015 x 18 March 2015: full year figures 2014 x 12 May 2015: Annual General Meeting of shareholders x 12 May 2015: first quarter results 2015 x 25 August 2015: second quarter and half year results 2015 x 17 November 2015: third quarter results 2015
Media call Today at 9.00 hours (CET) Imtech will organise a conference call for media.
Analyst call Today at 11.00 hours (CET) Imtech will organise a conference call for analysts. Dial-in details are +31 (0)20 717 68 68, pin code 89868213#. This call will be transmitted live via the internet (www.imtech.com) and will afterwards also be available on the website as a replay.
.
More information Media: Analysts & investors: Dorien Wietsma Director Corporate Communication & CSR T: +31 182 54 35 53 E: [email protected] www.imtech.com
Jeroen Leenaers Director Investor Relations T: +31 182 543 504 E: [email protected] www.imtech.com
Imtech profile Royal Imtech N.V. is a European technical services provider in the fields of electrical solutions, automation and mechanical solutions. With approximately 23,000 employees, Imtech holds attractive positions in the buildings and industry markets in the Netherlands, Belgium, Luxembourg, Germany, Austria, Eastern Europe, Sweden, Norway, Finland, the UK, Ireland and Spain, the European market of Traffic as well as in the global marine market. Imtech offers integrated and multidisciplinary total solutions that lead to better business processes and more efficiency for customers and the customers they, in their turn, serve. Imtech also offers solutions that contribute towards a sustainable society - for example, in the areas of energy, the environment, water and traffic. Imtech shares are listed on the Euronext Amsterdam.

9
Appendix
1. Condensed consolidated profit and loss account............................................................................. 10 2. Condensed consolidated balance sheet .......................................................................................... 11 3. Condensed consolidated statement of changes in equity ................................................................ 12 4. Condensed consolidated statement of cash flows ........................................................................... 13 5. Operating segments ......................................................................................................................... 14 6. Net finance result ............................................................................................................................. 15 7. Gross debt, net interest-bearing debt and outstanding guarantees ................................................. 16 8. Operational cash flow statement ...................................................................................................... 17

10
1. Condensed consolidated profit and loss account Third quarter First nine months in € million, unless otherwise indicated 2014 2013* 2014 2013*
Continuing operations Revenue 936.2 1,062.0 2,868.8 3,220.8 Other income 4.0 2.4 23.4 5.7
Total revenue and other income 940.2 1,064.4 2,892.2 3,226.5
Raw and auxiliary materials and trade goods 286.5 338.0 869.5 1,029.8 Work by third parties and other external expenses 251.3 301.1 774.7 888.2 Personnel expenses 339.2 366.3 1,065.9 1,174.1 Depreciation of property, plant and equipment 7.8 8.7 22.2 25.5 Amortisation and impairments 5.7 11.7 18.4 32.0 Other expenses 93.7 95.4 307.4 330.9
Total operating expenses 984.2 1,121.2 3,058.1 3,480.5
Result from operating activities (44.0) (56.8) (165.9) (254.0)
Net finance result (44.6) (25.5) (165.5) (79.9) Share in results of associates, joint ventures and other investments (net of tax) 11.9 (4.4) 12.5 (5.1)
Result before income tax (76.7) (86.7) (318.9) (339.0)
Income tax 1.7 (2.5) 12.2 21.2
Result from continuing operations (75.0) (89.2) (306.7) (317.8)
Discontinued operations Result from discontinued operations (net of tax) - (6.9) (69.8) (8.8)
Result for the period (net result) (75.0) (96.1) (376.5) (326.6)
Attributable to: Shareholders of Royal Imtech N.V. (75.5) (96.9) (377.5) (330.1) Non-controlling interests 0.5 0.8 1.0 3.5
Result for the period (net result) (75.0) (96.1) (376.5) (326.6)
Basic earnings per share from continuing and discontinued operations From continuing operations (euro) (0.68) (1.28) From discontinued operations (euro) (0.15) (0.04)
From result attributable to shareholders of Royal Imtech N.V. (euro) (0.83) (1.32)
Diluted earnings per share from continuing and discontinued operations From continuing operations (euro) (0.68) (1.28) From discontinued operations (euro) (0.15) (0.04)
From result attributable to shareholders of Royal Imtech N.V. (euro) (0.83) (1.32)
Operational EBITDA** (5.6) (8.4) (30.5) (67.1)
* Restated, see notes 4 and 5 to the Interim Financial Statements H1 2014. ** Non IFRS measure (reference is made to Financial glossary for definition at www.imtech.com/investors).

11
2. Condensed consolidated balance sheet in € million 30 Sep 2014 31 Dec 2013* Property, plant and equipment 131.9 161.0 Goodwill 809.9 1,032.8 Other intangible assets 94.5 149.0 Investments in associated companies and joint ventures 1.6 0.2 Non-current receivables and other investments 16.9 21.9 Deferred tax assets 33.4 19.9
Total non-current assets 1,088.2 1,384.8
Inventories 55.1 72.8 Due from customers 431.4 459.7 Trade receivables 616.4 868.1 Other receivables 140.9 139.5 Income tax receivables 11.4 8.9 Cash and cash equivalents 187.8 304.4
1,443.0 1,853.4
Assets held for sale 427.2 79.9
Total current assets 1,870.2 1,933.3
Total assets 2,958.4 3,318.1
Equity attributable to shareholders of Royal Imtech N.V. (107.6) 304.6 Non-controlling interests 6.4 8.7
Total equity (101.2) 313.3
Loans and borrowings 1,107.9 907.3 Employee benefits 252.1 207.1 Provisions 23.0 35.8 Deferred tax liabilities 33.1 45.9
Total non-current liabilities 1,416.1 1,196.1
Bank overdrafts 175.2 106.2 Loans and borrowings 102.8 39.7 Due to customers 281.8 280.9 Trade payables 502.5 773.8 Other payables 374.1 489.2 Income tax payables 7.6 20.3 Provisions 17.8 38.8
1,461.8 1,748.9
Liabilities held for sale 181.7 59.8
Total current liabilities 1,643.5 1,808.7
Total liabilities 3,059.6 3,004.8
Total equity and liabilities 2,958.4 3,318.1
Net interest-bearing debt** 1,157.4 737.0
Unaudited figures * Restated, see notes 4 and 5 to the Interim Financial Statements H1 2014. ** Non IFRS measure (reference is made to Financial glossary for definition at www.imtech.com/investors).

12
3. Condensed consolidated statement of changes in equity
Equity attributable to shareholders of Royal Imtech N.V.
in € million Share capital
Share premium
reserve
Trans-lation
reserve Hedging reserve
Reserve for own shares
Retained earnings
Unap-propria-
ted result Total
Non-control-
ling interests
Total equity
As at 1 January 2013 75.2 208.6 7.3 (10.4) (101.1) 582.4 (247.2) 514.8 9.7 524.5
Total comprehensive income for the first nine months
- - (5.9) 0.3 - - (329.9) (335.5) 3.3 (332.2)
Issue of shares 298.6 189.0 - - - - - 487.6 - 487.6 Dividends to shareholders - - - - - - - - (4.4) (4.4) Repurchase of own shares - - - - 0.4 - - 0.4 - 0.4 Share based payments - - - - - 2.5 - 2.5 - 2.5
As at 30 September 2013 373.8 397.6 1.4 (10.1) (100.7) 584.9 (577.1) 669.8 8.6 678.4
As at 1 October 2013 373.8 397.6 1.4 (10.1) (100.7) 584.9 (577.1) 669.8 8.6 678.4 Total comprehensive income for the fourth quarter - - (3.9) 5.9 - (242.5) (124.1) (364.6) 0.9 (363.7)
Issue of shares - (0.5) - - - - - (0.5) - (0.5) Dividends to shareholders - - - - - - - - (0.8) (0.8) Share-based payments - - - - - (0.1) - (0.1) - (0.1)
As at 31 December 2013 373.8 397.1 (2.5) (4.2) (100.7) 342.3 (701.2) 304.6 8.7 313.3
As at 1 January 2014 373.8 397.1 (2.5) (4.2) (100.7) 342.3 (701.2) 304.6 8.7 313.3 Total comprehensive income for the first nine months
- - 7.0 (9.7) - (734.2) 323.7 (413.2) 1.4 (411.8)
Conversion of cumulative financing preference shares into ordinary shares
0.3 (0.3) - - - - - - - -
Dividends to shareholders - - - - - - - - (3.7) (3.7) Share based payments - - - - - 1.0 - 1.0 - 1.0
As at 30 September 2014 374.1 396.8 4.5 (13.9) (100.7) (390.9) (377.5) (107.6) 6.4 (101.2)
Unaudited figures

13
4. Condensed consolidated statement of cash flows Third quarter First nine months
in € million 2014 2013* 2014 2013* Cash flow from operating activities Result for the period (net result) (75.0) (96.1) (376.5) (326.6) Adjustments for:
Depreciation of property, plant and equipment 9.2 10.0 27.3 29.6 Amortisation and impairment of property, plant and equipment and intangible assets 8.3 15.6 30.9 45.4
Impairment result on trade receivables 0.5 (1.0) (0.7) 12.0 Net finance result 45.4 30.3 166.9 87.0 Share in results of associates, joint ventures and other investments (11.9) 3.9 (12.5) 3.6 Result on disposal of non-current assets (21.0) (1.1) (21.1) (1.4) Remeasurement of assets held for sale 18.1 - - - Fair value adjustment of discontinued operations - - 60.0 - Share-based payments 0.3 0.9 1.0 2.5 Income tax benefit (1.5) 2.4 (10.8) (21.2)
Operating cash flow before changes in working capital and provisions (27.6) (35.1) (135.5) (169.1)
Change in inventories (4.1) 3.1 (0.3) 2.3 Change in amounts due from/to customers 25.6 (34.5) 21.1 (111.3) Change in trade and other receivables (38.5) 50.1 115.8 211.1 Change in trade and other payables (9.2) (54.3) (247.2) (325.5) Change in provisions and employee benefits (12.7) (23.4) (37.1) (10.9)
Cash flow from operating activities (66.5) (94.1) (283.2) (403.4)
Interest paid (22.3) (23.8) (57.4) (71.7) Income tax paid (3.7) - (8.7) (2.0)
Net cash flow from operating activities (92.5) (117.9) (349.3) (477.1) Cash flow from investing activities Proceeds from the sale of property, plant and equipment and other non-current assets 29.2 4.3 34.2 14.6
Interest received 0.8 0.6 3.4 0.3 Disposal of discontinued operations (net of cash disposed of) (2.5) - 6.5 - Acquisition of subsidiaries (net of cash acquired) - (6.6) (0.6) (25.2) Acquisition of property, plant and equipment (7.7) (7.1) (18.3) (23.4) Acquisition of intangible assets (1.6) (2.9) (6.0) (13.0) Sale (purchase) of associates, joint ventures and other investments 12.5 (1.9) 11.1 (1.9) Issue less repayment of non-current receivables 2.6 (6.0) 4.1 (10.1)
Net cash flow from investing activities 33.3 (19.6) 34.4 (58.7) Cash flow from financing activities Proceeds from issue of share capital (net of expenses) - 502.3 - 487.6 Proceeds from loans and borrowings 19.7 120.0 212.2 526.5 Repayment of loans and borrowings (31.6) (469.5) (34.5) (477.8) Transaction costs related to loans and borrowings (2.8) - (14.7) - Sale of own shares - - - 0.4 Payments of finance lease liabilities (0.4) (0.6) (5.2) (2.1) Dividend paid in relation to non-controlling interests (0.7) (3.8) (3.7) (4.4)
Net cash flow from financing activities (15.8) 148.4 154.1 530.2
Net change in cash, cash equivalents and bank overdrafts (75.0) 10.9 (160.8) (5.6) Cash, cash equivalents and bank overdrafts beginning of period 80.7 56.3 198.2 70.8 Effect of exchange rate fluctuations on cash, cash equivalents and bank overdrafts 3.6 (2.4) 5.0 (0.4)
Cash, cash equivalents and bank overdrafts of discontinued operations 3.3 - (29.8) -
Cash, cash equivalents and bank overdrafts on 30 September 12.6 64.8 12.6 64.8
Unaudited figures * Restated, see notes 4 and 5 to the Interim Financial Statements H1 2014.

14
5. Operating segments Third quarter First nine months in € million, unless otherwise indicated 2014 2013* 2014 2013* Revenue and other income Benelux 149.6 168.1 464.8 508.4 Germany & Eastern Europe 201.6 269.3 662.8 782.8 UK & Ireland 170.8 201.1 474.3 601.2 Nordic 183.8 202.2 589.9 654.0 Spain 32.8 28.3 75.2 94.1 Traffic & Infra 88.5 88.9 280.1 286.8 Marine 115.9 112.2 351.8 305.4 Inter-segment revenue (2.8) (5.7) (6.7) (6.2) Total revenue and other income (continuing operations) 940.2 1,064.4 2,892.2 3,226.5 Discontinued operations 148.3 251.9 429.3 574.7 Total revenue and other income (for the total group) 1,088.5 1,316.3 3,321.5 3,801.2 Operational EBITDA Benelux (4.3) (1.2) (19.4) (18.9) Germany & Eastern Europe (8.3) (19.7) (23.6) (74.9) UK & Ireland 2.9 9.7 7.8 25.3 Nordic 8.9 6.6 21.6 22.3 Spain (0.2) (0.8) (3.5) (1.8) Traffic & Infra 0.3 4.0 4.3 6.3 Marine 0.4 (1.6) 0.9 (10.9) Group management (5.3) (5.4) (18.6) (14.5) Operational EBITDA (continuing operations) (5.6) (8.4) (30.5) (67.1) Discontinued operations 5.4 5.9 16.4 18.3 Operational EBITDA (for the total group) (0.2) (2.5) (14.1) (48.8) Operational EBITDA margin Benelux (2.9%) (0.7%) (4.2%) (3.7%) Germany & Eastern Europe (4.1%) (7.3%) (3.6%) (9.6%) UK & Ireland 1.7% 4.8% 1.6% 4.2% Nordic 4.8% 3.3% 3.7% 3.4% Spain (0.6%) (2.8%) (4.7%) (1.9%) Traffic & Infra 0.3% 4.5% 1.5% 2.2% Marine 0.3% (1.4%) 0.3% (3.6%) Operational EBITDA margin (continuing operations) (0.6%) (0.8%) (1.1%) (2.1%) Discontinued operations 3.6% 2.3% 3.8% 3.2% Operational EBITDA margin (for the total group) (0.0%) (0.2%) (0.4%) (1.3%) EBITDA Benelux (5.1) (5.0) (23.1) (54.6) Germany & Eastern Europe (16.3) (26.8) (49.9) (88.0) UK & Ireland 1.0 8.2 2.0 23.7 Nordic 6.7 6.3 12.7 17.9 Spain (0.6) (0.8) (12.8) (2.1) Traffic & Infra 0.1 5.3 3.8 (13.2) Marine (0.6) (13.3) (1.8) (46.2) Group management (15.7) (10.3) (56.2) (34.0) EBITDA (continuing operations) (30.5) (36.4) (125.3) (196.5) Discontinued operations 5.0 4.0 10.6 15.8
EBITDA (for the total group) (25.5) (32.4) (114.7) (180.7)
Unaudited figures * Restated, see notes 4 and 5 to the Interim Financial Statements H1 2014.
15
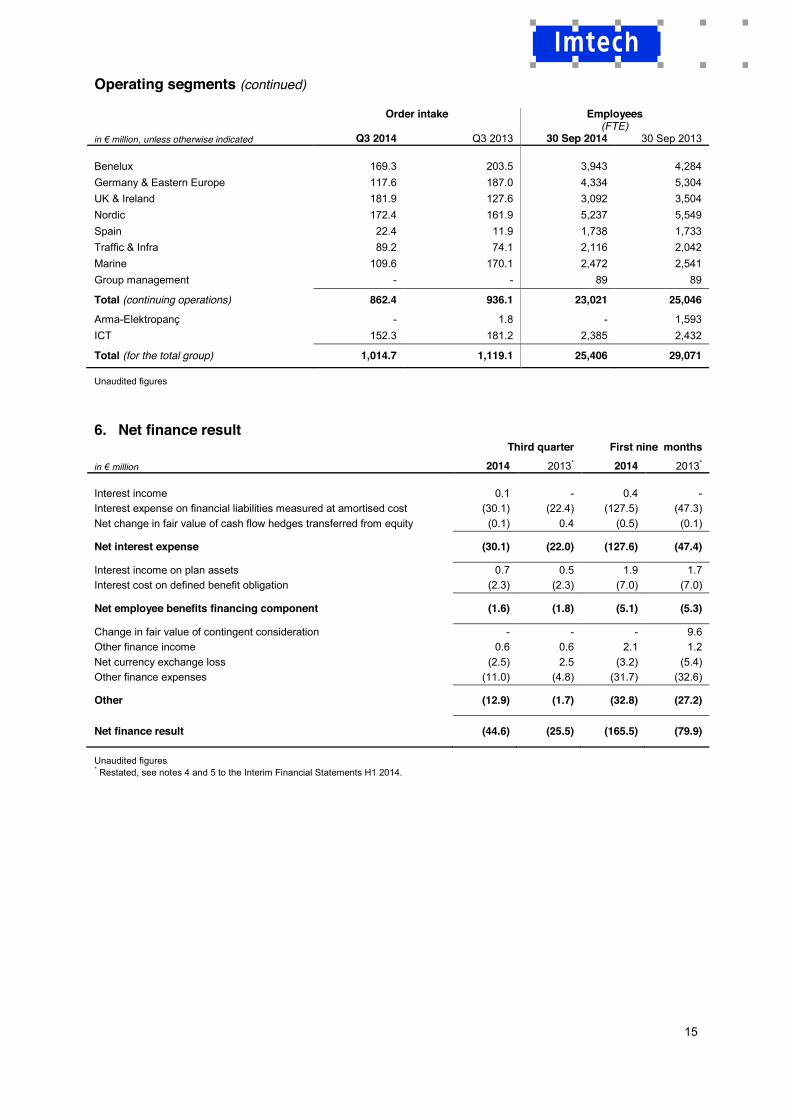
Operating segments (continued) Order intake Employees
(FTE) in € million, unless otherwise indicated Q3 2014 Q3 2013 30 Sep 2014 30 Sep 2013 Benelux 169.3 203.5 3,943 4,284 Germany & Eastern Europe 117.6 187.0 4,334 5,304 UK & Ireland 181.9 127.6 3,092 3,504 Nordic 172.4 161.9 5,237 5,549 Spain 22.4 11.9 1,738 1,733 Traffic & Infra 89.2 74.1 2,116 2,042 Marine 109.6 170.1 2,472 2,541 Group management - - 89 89
Total (continuing operations) 862.4 936.1 23,021 25,046
Arma-Elektropanç - 1.8 - 1,593 ICT 152.3 181.2 2,385 2,432
Total (for the total group) 1,014.7 1,119.1 25,406 29,071
Unaudited figures
6. Net finance result Third quarter First nine months
in € million 2014 2013* 2014 2013* Interest income 0.1 - 0.4 - Interest expense on financial liabilities measured at amortised cost (30.1) (22.4) (127.5) (47.3) Net change in fair value of cash flow hedges transferred from equity (0.1) 0.4 (0.5) (0.1)
Net interest expense (30.1) (22.0) (127.6) (47.4)
Interest income on plan assets 0.7 0.5 1.9 1.7 Interest cost on defined benefit obligation (2.3) (2.3) (7.0) (7.0)
Net employee benefits financing component (1.6) (1.8) (5.1) (5.3)
Change in fair value of contingent consideration - - - 9.6 Other finance income 0.6 0.6 2.1 1.2 Net currency exchange loss (2.5) 2.5 (3.2) (5.4) Other finance expenses (11.0) (4.8) (31.7) (32.6)
Other (12.9) (1.7) (32.8) (27.2)
Net finance result (44.6) (25.5) (165.5) (79.9)
Unaudited figures * Restated, see notes 4 and 5 to the Interim Financial Statements H1 2014.
16
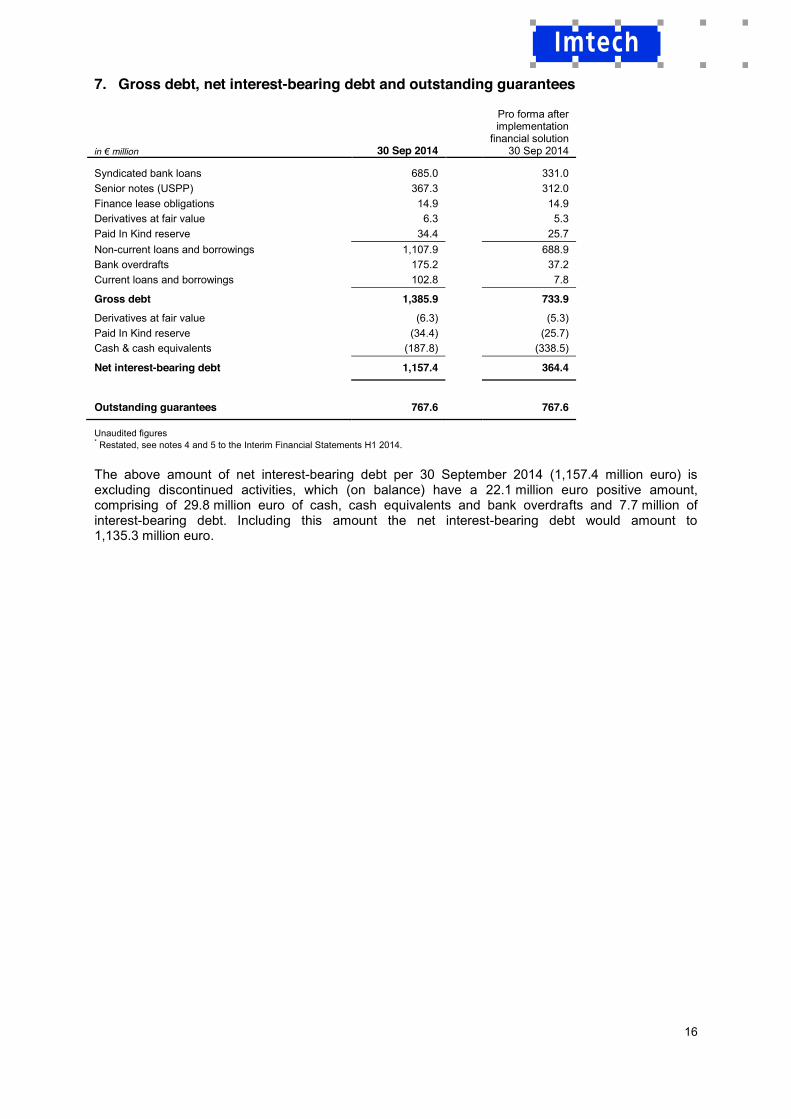
7. Gross debt, net interest-bearing debt and outstanding guarantees
in € million 30 Sep 2014
Pro forma after implementation
financial solution 30 Sep 2014
Syndicated bank loans 685.0 331.0 Senior notes (USPP) 367.3 312.0 Finance lease obligations 14.9 14.9 Derivatives at fair value 6.3 5.3 Paid In Kind reserve 34.4 25.7 Non-current loans and borrowings 1,107.9 688.9 Bank overdrafts 175.2 37.2 Current loans and borrowings 102.8 7.8
Gross debt 1,385.9 733.9 Derivatives at fair value (6.3) (5.3) Paid In Kind reserve (34.4) (25.7) Cash & cash equivalents (187.8) (338.5)
Net interest-bearing debt 1,157.4 364.4
Outstanding guarantees 767.6 767.6
Unaudited figures * Restated, see notes 4 and 5 to the Interim Financial Statements H1 2014.
The above amount of net interest-bearing debt per 30 September 2014 (1,157.4 million euro) is excluding discontinued activities, which (on balance) have a 22.1 million euro positive amount, comprising of 29.8 million euro of cash, cash equivalents and bank overdrafts and 7.7 million of interest-bearing debt. Including this amount the net interest-bearing debt would amount to 1,135.3 million euro.

17
8. Operational cash flow statement (for continuing operations) in € million Q3 2014 Q2 2014 Q1 2014 Operational EBITDA* (5.6) (13.5) (11.4) Change in working capital excluding legacy items (37.9) (14.4) (51.9) Net capex outflow 1.1 (4.6) (3.1) Adjustments for non-cash items (5.5) (17.3) (3.7)
Operating cash flow* (47.9) (49.8) (70.1)
Refinancing costs (9.9) (9.3) (14.5) Cash out restructuring (16.8) (13.1) (20.1) Other 5.3 (6.2) 3.2 Non-operation items (cash effect) (21.4) (28.6) (31.4) Cash tax (3.7) 0.2 (5.2)
Free cash flow (73.0) (78.2) (106.7)
Interest paid/received (21.5) (20.9) (11.6)
Free cash flow after interest (94.5) (99.1) (118.3)
Net interest-bearing debt at beginning of the period 1,063.0 963.2 737.0 Net interest-bearing debt at beginning of quarter of discontinued operations - - 61.0 Restated, see notes 4 and 5 to the Interim Financial Statements H1 2014 - - 8.0 Non-cash movement of net interest-bearing debt (0.1) 0.7 38.9 Net interest-bearing debt at the end of the period (1,157.4) (1,063.0) (963.2) Movement net interest-bearing debt (94.5) (99.1) (118.3)
Unaudited figures * Non IFRS measure (reference is made to Financial glossary for definition at www.imtech.com/investors).