Improving West Side Transit Access analysis report improving west side transit access san francisco...
15
SAN FRANCISCO COUNTY TRANSPORTATION AUTHORITY Improving West Side Transit Access INITIATED BY COMMISSIONER KATY TANG STRATEGIC ANALYSIS REPORT SAR 15/16-1
Transcript of Improving West Side Transit Access analysis report improving west side transit access san francisco...

S A N F R A N C I S C O C O U N T Y T R A N S P O R T A T I O N A U T H O R I T Y
Improving West Side Transit Access
INITIATED BY COMMISSIONER KATY TANG
STRATEGIC ANALYSIS REPORT
SAR 15/16-1

REPORT CREDITS
Rachel Hiatt and Chester Fung (Interim Co-Deputy Directors for Planning) oversaw the study and guided the preparation of the report. Ryan Greene-Roesel (Senior Transportation Planner) managed the project and led all research and interviews, with assistance from Camille Guiriba (Transportation Planner) and interns Sara Barz, David Weinzimmer, Evelyne St-Louis, and Emily Kettell.
TILLY CHANG is the Executive Director of the San Francisco County Transportation Authority.
S A N F R A N C I S C O C O U N T Y T R A N S P O R T A T I O N A U T H O R I T Y
1455 Market Street, 22nd Floor, San Francisco, CA 94103tel 415.522.4800 fax 415.522.4829email [email protected] web www.sfcta.org
–
PHOTO CREDITS
Uncredited photos are from the Transportation Authority photo library or project sponsors. Unless otherwise noted, the photographers cited below, identified by their screen names, have made their work available for use on flickr Commons: https://www.flickr.com/, with the license agreements as noted.
Cover, top left: Daniel Hoherd 2
Cover, top right: Jason Henderson for SFBCCover, bottom: James A. Castañeda 3
p. 1: Charles Haynes 4
p. 6: Tim Adams 1
p. 8: Daniel Hoherd 2
Licensing information:1 https://creativecommons.org/licenses/by/2.0/legalcode2 https://creativecommons.org/licenses/by-nc/2.0/legalcode3 https://creativecommons.org/licenses/by-nc-nd/2.0/legalcode4 https://creativecommons.org/licenses/by-sa/2.0/legalcode
REPORT DESIGN: Bridget Smith
STRATEGIC ANALYSIS REPORT • IMPROVING WEST SIDE TRANSIT ACCESS
SAN FRANCISCO COUNTY TRANSPORTATION AUTHORITY • FEBRUARY 2016
PAGE 1
Contents1. Executive Summary 1
2. Introduction 1
3. Existing Conditions 2
4. Prioritization of Access Issues 8
5. Recommendations 9
6. Next Steps 10
7. Sources 11
Appendices 12
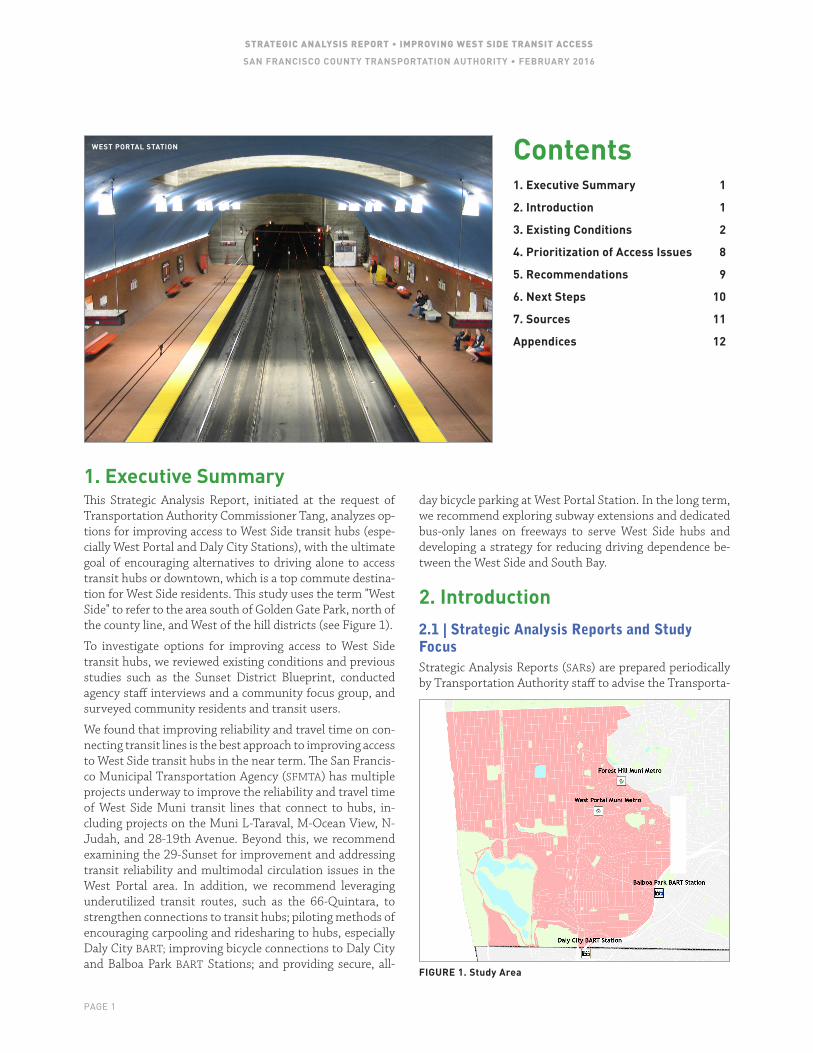
1. Executive Summary This Strategic Analysis Report, initiated at the request of Transportation Authority Commissioner Tang, analyzes op-tions for improving access to West Side transit hubs (espe-cially West Portal and Daly City Stations), with the ultimate goal of encouraging alternatives to driving alone to access transit hubs or downtown, which is a top commute destina-tion for West Side residents. This study uses the term "West Side" to refer to the area south of Golden Gate Park, north of the county line, and West of the hill districts (see Figure 1).
To investigate options for improving access to West Side transit hubs, we reviewed existing conditions and previous studies such as the Sunset District Blueprint, conducted agency staff interviews and a community focus group, and surveyed community residents and transit users.
We found that improving reliability and travel time on con-necting transit lines is the best approach to improving access to West Side transit hubs in the near term. The San Francis-co Municipal Transportation Agency (SFMTA) has multiple projects underway to improve the reliability and travel time of West Side Muni transit lines that connect to hubs, in-cluding projects on the Muni L-Taraval, M-Ocean View, N-Judah, and 28-19th Avenue. Beyond this, we recommend examining the 29-Sunset for improvement and addressing transit reliability and multimodal circulation issues in the West Portal area. In addition, we recommend leveraging underutilized transit routes, such as the 66-Quintara, to strengthen connections to transit hubs; piloting methods of encouraging carpooling and ridesharing to hubs, especially Daly City BART; improving bicycle connections to Daly City and Balboa Park BART Stations; and providing secure, all-
day bicycle parking at West Portal Station. In the long term, we recommend exploring subway extensions and dedicated bus-only lanes on freeways to serve West Side hubs and developing a strategy for reducing driving dependence be-tween the West Side and South Bay.
2. Introduction
2.1 | Strategic Analysis Reports and Study Focus Strategic Analysis Reports (SARs) are prepared periodically by Transportation Authority staff to advise the Transporta-
–
FIGURE 1. Study Area
WEST PORTAL STATION

PAGE 2
STRATEGIC ANALYSIS REPORT • IMPROVING WEST SIDE TRANSIT ACCESS
SAN FRANCISCO COUNTY TRANSPORTATION AUTHORITY • FEBRUARY 2016
tion Authority (TA) on policy issues or topics of interest to Board members. This SAR, initiated at the request of Trans-portation Authority Commissioner Tang, analyzes options for improving access to West Side transit hubs, particularly Daly City BART, Balboa Park BART, and West Portal Muni stations, primarily via bicycling, public transit or carpooling to hubs. This study uses the term “West Side” to refer to the area south of Golden Gate Park and West of the hill dis-tricts, which includes the Sunset, Parkside, West Portal, and Golden Gate Heights neighborhoods as well as the areas around Stonestown Mall, Lake Merced, and San Francisco State University.
Supporting alternatives to driving is particularly critical for West Side residents, who drive more for their daily trips than residents of most other San Francisco neighborhoods, with about 62 percent of daily person-trips made by driving, high-er than all neighborhoods except the Hill Districts, Outer Mission, and Bayshore areas.1 Generally, the areas with the highest car dependence cluster West of Sunset Boulevard and in hilly areas.
Multiple factors contribute to West Side residents’ relatively higher car use. One likely factor is the lack of grade-separated rail transit access to major job centers, which exists only at the periphery of the area, at the Muni rail Forest Hill and West Portal Stations, and at the BART Daly City and Balboa Bark Stations. In the 1950s, a major BART extension to this area was envisioned, but was never implemented. West side residents must therefore rely primarily on surface-running transit, which can be slower and subject to delays from cross
1 Source: SFCTA 2012 SF CHAMP
traffic at intersections. As an example, Figure 2 illustrates the fact that travel times on transit from the West Side to downtown (using the TransAmerica Pyramid as an example destination) can be over an hour for most West Side residents living West of Sunset Boulevard, though the geographic dis-tance is only about seven miles. Extending subways into to the West Side, or providing other forms of transit grade-sepa-ration (e.g. a dedicated bus lane on I-280 connecting the West Side with downtown), would help address the problem. How-ever, since these kinds of improvements would take years to plan and deliver, this study focuses primarily on providing near-term recommendations to improve connections to ex-isting hubs. Long-term recommendations for exploring more direct rail and dedicated bus extensions to the West Side are included in Section 5.
2.2 | Methodology We approached the study questions in three steps, which are summarized in the three sections below:
• SECTION 3: EXISTING CONDITIONS REVIEW. We developed an inventory of known transportation challenges that may be inhibiting access to West Side transit hubs, based on reviewing previous studies and planned projects, in-terviewing relevant agency staff, analyzing the quality of available access modes (focusing on bicycling, pickup/drop-off, and transit), and holding a community focus group. Section 3 summarizes the results of the review.
• SECTION 4: PRIORITIZATION OF ACCESS IMPROVEMENT CON-
CEPTS. To help prioritize access improvement concepts, we surveyed West Side households and intercepted tran-
sit riders at West Portal, Daly City, and Bal-boa Park stations to ask them about which types of investments would be would most likely to encourage them to take transit or bike to West Side transit hubs rather than driving alone to the hubs or their final des-tination. Section 4 summarizes the results.
• SECTION 5: RECOMMENDATIONS. Using the survey results, we prioritized improvement concepts according to which would appeal to the largest number of West Side drivers. We then prepared recommendations link-ing the general access challenges identified in the survey with the more specific access challenges identified as part of the existing conditions review.
FIGURE 2. Morning Peak Period Transit Travel Times to the TransAmerica Pyramid.Source: Interactive Transit Map by Dan Howard: https://www.ocf.berkeley.edu/~djhoward/transitmap/tran-sit. html. Data do not reflect any service improvements made after May, 2015. Includes walk and wait time.
15 min30 min45 min60 min75 min100 minLocation ofPointer
Average Travel Times (7AM–9AM)

STRATEGIC ANALYSIS REPORT • IMPROVING WEST SIDE TRANSIT ACCESS
SAN FRANCISCO COUNTY TRANSPORTATION AUTHORITY • FEBRUARY 2016
PAGE 3
3. Existing Conditions This section summarizes the results of Task 1 which in-volved investigating current transportation patterns and access conditions on the West Side, including overall travel patterns of West Side residents and the quality of access modes of travel to West Side hubs (including for transit, bi-cycle, and pickup/drop-off).
3.1 | West Side Resident’s Travel Patterns West Side residents’ overall commute patterns provide con-text for how they may be using hubs. Figure 3 illustrates the top commute destinations for West Side workers, and indicates that the top destinations include the South Bay, San Francisco’s downtown and the East Bay.
Those using West Side transit hubs are dominantly destined for downtown San Francisco. Intercept surveys collected at West Portal, Balboa Park, and Daly City BART during morn-ing peak periods revealed that about 70 percent of respon-dents were destined for the San Francisco downtown or Civic Center area, compared to 5 percent to the South Bay and 7 percent to the East Bay.
3.2 | Quality of Access to Transit Hubs
TRANSIT SERVICE COVERAGE
The study area has an extensive transit network, including several surface running light rail transit lines, rapid, ex-press, and local buses. Table A1 (Appendix A, page 12) lists all routes in the study area and indicates which serve major rail hubs.
We conducted spatial analysis to examine the degree to which West Side residents have access to transit connec-tions to hubs within a convenient walking distance, which we defined as one quarter mile. The analysis found that sig-
nificant portions of the study area are not within a quarter mile of a Muni connection to a BART station; most residents, by con-trast, live within a quarter mile of a route that will connect them either to West Portal station or directly to downtown (Figure 4, next page).
Additionally, during focus groups, several community members mentioned a desire for additional transit coverage and were interested in whether shuttles could be used to augment existing transit services and provide more connections to West Side hubs. The sidebar box on page 6 describes possible business models for shuttle ser-vices. Any new shuttle service would need to be designed to complement rather than duplicate Muni services.
TRANSIT PERFORMANCE
The previous section discussed transit routing issues that may be affecting the quality of access to West Side transit hubs. We also examined transit performance, including travel times, reliability, and productivity. Table A1, page 12, lists key statistics by line.
Travel Times
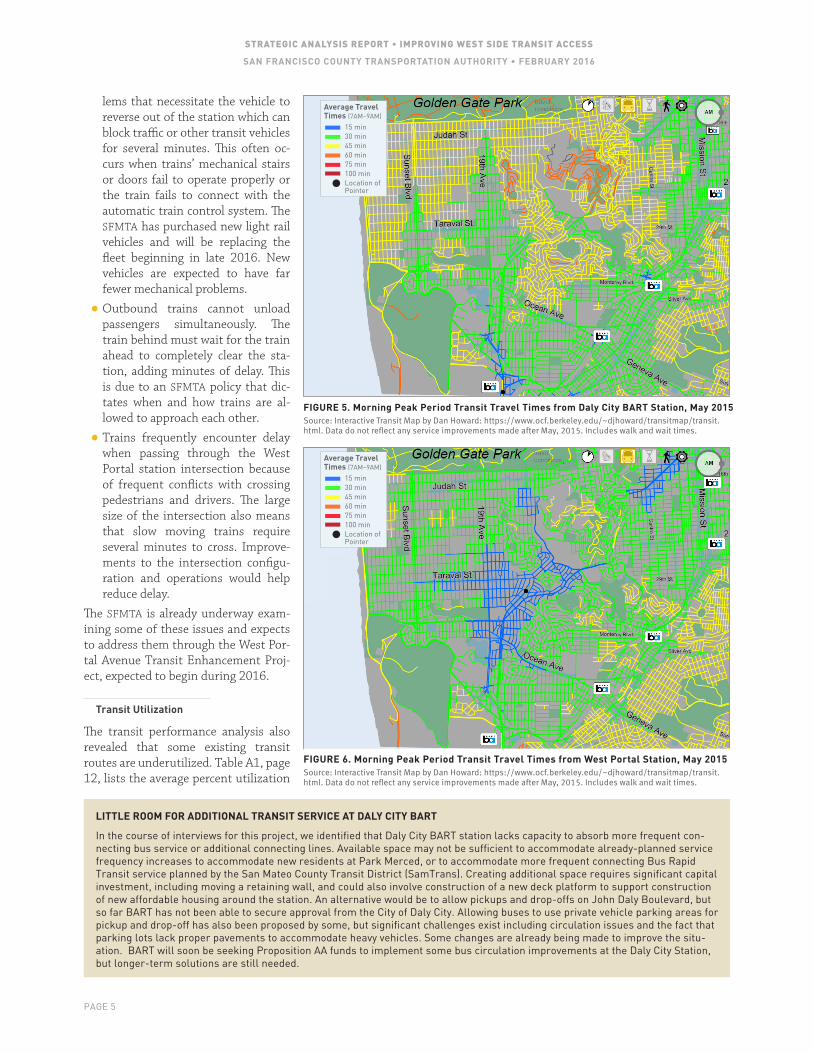
We examined transit travel times using a publicly available visualization tool. Figures 5 and 6 (see page 5) illustrate travel times to Daly City BART and West Portal Stations, respectively, and illustrate that only about 1 percent of the study area can access the Daly City BART station within a fifteen minute transit ride (area shown in blue). The result is especially pronounced for those who live outside of a conve-nient walking distance to transit routes along Sunset Boule-vard and 19th Avenue. By contrast, about 15 percent of the study area can access West Portal station within a fifteen minute transit ride.
The SFMTA has recently taken steps to improve travel times to BART through major upgrades to the 28-19th Avenue corridor. The 29-Sunset has not received as much atten-tion, with the exception of some recent service increases and route adjustments. Ridership on this route has grown more than 40 percent since 2007, suggesting that further improvements to the corridor may be justified.
Reliability
Reliability is another potential barrier to using transit to access West Side hubs. Reliability problems on routes serv-ing West Side hubs, as measured by the average percentage of “very late” arrivals in 2015, were worst for the M-Ocean View, N-Judah, and KT, which all arrived very late an aver-age of about 10 percent of the time between October and December of 2015 (see Table A1, page 12), as well as the
25%
20%
15%
10%
5%
0%
FIGURE 3. Work Destinations for West Side Residents (Percent Of Total) SOURCE: SFCTA, SF CHAMP 5.0, 2012.

PAGE 4
STRATEGIC ANALYSIS REPORT • IMPROVING WEST SIDE TRANSIT ACCESS
SAN FRANCISCO COUNTY TRANSPORTATION AUTHORITY • FEBRUARY 2016
THE WEST SIDE TO DOWNTOWN MARKET IS A PROMISING OPPORTUNITY FOR TRANSIT
West Side residents travel all over the Bay Area to get to work. Only some of these trips can be cost effectively served by transit. Several pieces of evidence suggest that improving transit connections between the West Side and downtown should be a top prior-ity among West side transportation needs. In particular:
• Downtown is the second most common commute destination among West Side workers. West Side workers’ top two commute destinations include the South Bay (21 percent of workers), and downtown San Francisco (18 percent of workers).
• Downtown has the highest employment density of any place in the Bay Area. Places with very concentrated employment are more easily served by transit. Although the South Bay attracts the largest number of workers, it is a challenging trip to serve on transit from the West Side. South Bay employment destinations are very spread out compared to downtown San Francisco employment, which is highly concentrated around transit. Improved Caltrain access and electrification (planned) would help address this need.
• The market for transit service between the West Side and downtown is strong. We used a tool called the Transit Competitive Index (TCI) to examine the degree to which land use and transportation demand patterns support public transit in the West-Side to South Bay trip compared to the West Side to downtown trip. The TCI tool holds transit service quality constant to focus on whether underlying market conditions (e.g. primarily land use density and demographics) would generate sufficient transit ridership if service were provided. A TCI Score of 100 is considered the threshold for basic transit competitiveness. Our analysis found a TCI score of about 13,000 for work-related trips between the West Side and downtown, compared to about 500 for trips between the West Side and the South Bay city of Palo Alto/Menlo Park market.*1 This suggests that further investment in transit service quality between the West Side and downtown is very likely to generate additional transit ridership, especially when compared with the West Side to South Bay market.
• Comparison to the East Bay market suggests San Francisco could do better at attracting West Side residents to transit. Today, about 80 percent of morning peak period trips from the East Bay (including Alameda and Contra Costa Counties) to downtown are made by transit, compared to about 65 percent of trips from the West Side to downtown,** likely owing to the high degree of dedicated right of way that BART and AC transit enjoy.2The West Side, is of course, much more geographically proximate to downtown than the entire East Bay. This further supports the notion that the number of West side workers taking transit downtown could be increased if transit could be made more competitive with the automobile.
* Note that these estimates are based on older land use patterns (2005); scores would be expected to change somewhat given increasing employment in the south bay, but order of magnitude differ-ences in scores would likely remain the same.
** Figure based on San Francisco baseline 2012 SF CHAMP trip tables.
7X (15 percent very late).2 This is further supported by re-sults from the SFMTA’s on-board ridership survey, which asked riders to score the performance of each line on a 1 to 5 scale. On-time performance scores were lowest for the M-Ocean View, N-Judah, and KT among lines serving West Side hubs. The SFMTA has initiated or is planning sev-eral efforts to improve performance on the M-Ocean View
2 Source: SFMTA: Percentage of On-Time Performance Interactive Report, Jan–Oct 2015.
and N-Judah (for detail, see Table A2, page 13), and these should continue to be prioritized.
During interviews for this project, several SFMTA staff men-tioned West Portal Station itself as a key source of unreli-ability affecting several West Side transit routes. Challenges noted include:
• Inbound trains entering the station can encounter prob-
FIGURE 4. Areas Within Walking Distance (0.25 miles) of Muni Routes Connecting to BART (left) and West Portal or Downtown (right).
Walksheds Shown in White
Muni MetroMuni Rapid Bus RoutesMuni Standard Bus Routes
Transit NetworkMuni MetroMuni Rapid Bus RoutesMuni Standard Bus Routes
Transit Network28/28R
29
57M
KT
28R28
29
N
L
K
M
57
48
7/7X
STRATEGIC ANALYSIS REPORT • IMPROVING WEST SIDE TRANSIT ACCESS
SAN FRANCISCO COUNTY TRANSPORTATION AUTHORITY • FEBRUARY 2016
PAGE 5
lems that necessitate the vehicle to reverse out of the station which can block traffic or other transit vehicles for several minutes. This often oc-curs when trains’ mechanical stairs or doors fail to operate properly or the train fails to connect with the automatic train control system. The SFMTA has purchased new light rail vehicles and will be replacing the fleet beginning in late 2016. New vehicles are expected to have far fewer mechanical problems.
• Outbound trains cannot unload passengers simultaneously. The train behind must wait for the train ahead to completely clear the sta-tion, adding minutes of delay. This is due to an SFMTA policy that dic-tates when and how trains are al-lowed to approach each other.
• Trains frequently encounter delay when passing through the West Portal station intersection because of frequent conflicts with crossing pedestrians and drivers. The large size of the intersection also means that slow moving trains require several minutes to cross. Improve-ments to the intersection configu-ration and operations would help reduce delay.
The SFMTA is already underway exam-ining some of these issues and expects to address them through the West Por-tal Avenue Transit Enhancement Proj-ect, expected to begin during 2016.
Transit Utilization
The transit performance analysis also revealed that some existing transit routes are underutilized. Table A1, page 12, lists the average percent utilization
LITTLE ROOM FOR ADDITIONAL TRANSIT SERVICE AT DALY CITY BART
In the course of interviews for this project, we identified that Daly City BART station lacks capacity to absorb more frequent con-necting bus service or additional connecting lines. Available space may not be sufficient to accommodate already-planned service frequency increases to accommodate new residents at Park Merced, or to accommodate more frequent connecting Bus Rapid Transit service planned by the San Mateo County Transit District (SamTrans). Creating additional space requires significant capital investment, including moving a retaining wall, and could also involve construction of a new deck platform to support construction of new affordable housing around the station. An alternative would be to allow pickups and drop-offs on John Daly Boulevard, but so far BART has not been able to secure approval from the City of Daly City. Allowing buses to use private vehicle parking areas for pickup and drop-off has also been proposed by some, but significant challenges exist including circulation issues and the fact that parking lots lack proper pavements to accommodate heavy vehicles. Some changes are already being made to improve the situ-ation. BART will soon be seeking Proposition AA funds to implement some bus circulation improvements at the Daly City Station, but longer-term solutions are still needed.
FIGURE 5. Morning Peak Period Transit Travel Times from Daly City BART Station, May 2015Source: Interactive Transit Map by Dan Howard: https://www.ocf.berkeley.edu/~djhoward/transitmap/transit.html. Data do not reflect any service improvements made after May, 2015. Includes walk and wait times.
FIGURE 6. Morning Peak Period Transit Travel Times from West Portal Station, May 2015Source: Interactive Transit Map by Dan Howard: https://www.ocf.berkeley.edu/~djhoward/transitmap/transit.html. Data do not reflect any service improvements made after May, 2015. Includes walk and wait times.
15 min30 min45 min60 min75 min100 minLocation ofPointer
Average Travel Times (7AM–9AM)
15 min30 min45 min60 min75 min100 minLocation ofPointer
Average Travel Times (7AM–9AM)

PAGE 6
STRATEGIC ANALYSIS REPORT • IMPROVING WEST SIDE TRANSIT ACCESS
SAN FRANCISCO COUNTY TRANSPORTATION AUTHORITY • FEBRUARY 2016
during peak periods for all transit routes serving the West Side, and indicates that the 66-Quintara is the least produc-tive of all West Side transit routes, operating at about 20 percent full on average and 40 percent full at the maximum load point during the morning peak period. During focus groups, some residents mentioned interest in rerouting the 66 to improve performance, potentially by connecting it to West Portal Station.
BICYCLING
To investigate bicycling access barriers to West Side transit hubs, we reviewed prior studies, conducted agency inter-views and focus groups, examined the existing bicycle net-work and bicycle collision data, and reviewed the SFMTA’s recent Bicycle Survey. Key issues we identified from these sources include the following:
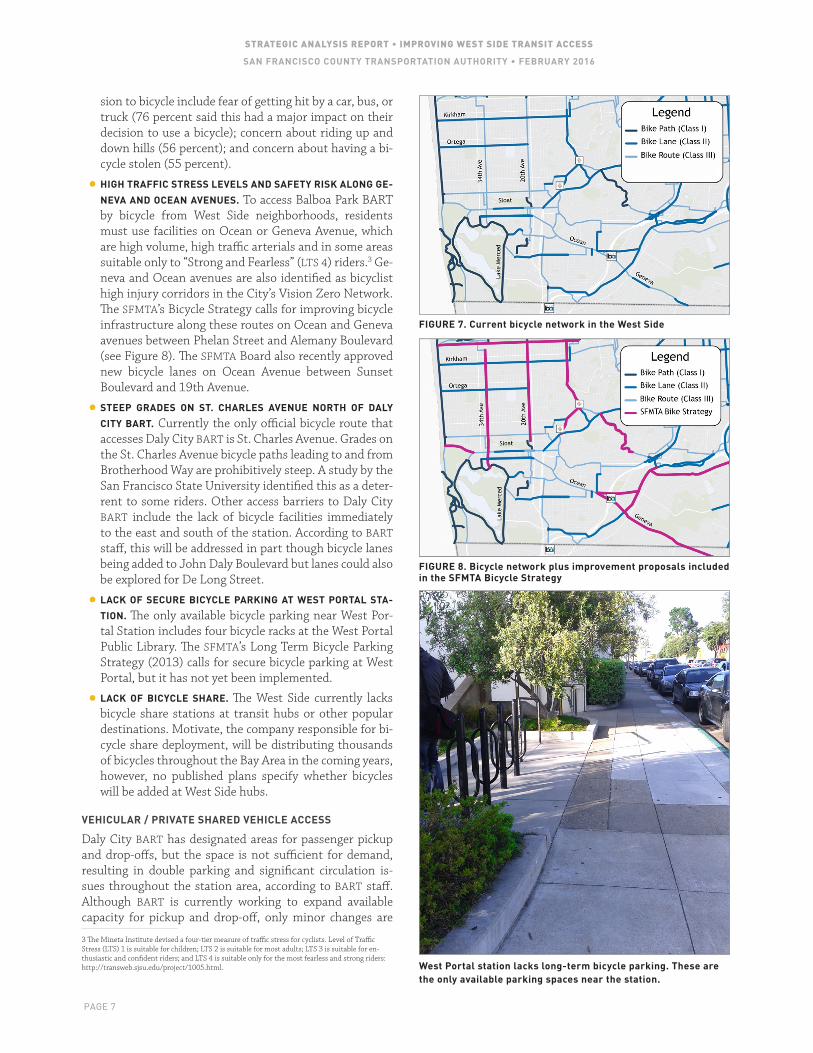
• LACK OF COMPLETE CONNECTIONS TO WEST SIDE HUBS. No continuous Class I or II (e.g. off-road paths or bicycle lanes) bicycle facilities connect through the West Side study area to West Portal, Daly City, or Balboa Park sta-tions. Figure 7 (next page) illustrates the current bicycle network, showing many routes fragmented by Class III connections, which do not provide any protective infra-structure to bicyclists.
• CONCERNS ABOUT SAFETY AND STEEP GRADES ARE TOP
BARRIERS TO BICYCLING. Unpublished bicycle survey re-sults from the SFMTA indicate that for residents of the Southwest part of the city, top factors affecting the deci-
COMMUNITY SHUTTLE SERVICES: BUSINESS MODELS
Shuttle services can be implemented through a variety of different arrangements. Options are described below.
• Business-Improvement-District funded service. Business Improvement Districts (BIDs) are areas within which businesses are required to pay an additional tax to fund projects within the district’s boundaries. The free Emery-Go-Round shuttle in Emeryville, CA is a well-known example. The service is primarily funded by commercial property owners in the BID. No BID currently exists on the West Side, however, major institutions / property owners could be approached to determine their interest in creating a BID.
• Private, self-funding service. Some shuttle services are self-sustaining. One example is the FreeRide Shuttle operating in San Diego, Santa Monica, and other cities. The FreeRide shuttle is an eight-seater electric vehicle that can cover operating costs in busy downtown contexts by decorating the shuttle in promotional advertising. Another example is the Chariot shuttle service already operating in San Francisco. Chariot routes are crowd-sourced, meaning that new routes can be launched if enough people sign up for the proposed service and commit to paying for a given period. Chariot is supported by fare revenues and ex-ternal investment, and is currently running service to the Richmond district among other destinations. A final example are the Uber and Lyft services—these are not strictly shuttles, but have the potential to operate in a similar fashion.
• Transit agency operated. Public agencies will sometimes run new transit routes if they can be justified against other priorities. SFMTA typically prioritizes resources for additional service on crowded and high-performing routes over initiating new lower-frequency routes. Some transit agencies are exploring new service models for low-ridership areas. For example, the Santa Clara Valley Transit Authority recently launched a new on-demand, app-based transit service called FLEX to serve areas within three miles of Tasman Light Rail Station.
• Public agency sponsor and public funding source, private contractor. Another option is to identify another public agency to spon-sor the service. For example, the Department of Public Health has served as the lead agency for shuttle services run by private hospitals and contracted by private shuttle vendors, using funding obtained from the Transportation Fund for Clean Air (TFCA) pro-gram. TFCA funds can be used for shuttle services that connect an employment center with a mass transit hub during peak hours; are not within 1/3 mile of comparable transit services; and meet a high standard for cost-effectively reducing vehicle emissions.
• Developer-committed service. Many shuttle services in San Francisco are funded as a result of developer agreements put in place at the time of development approval. On the West Side, the Park Merced development has committed to providing two free shuttle services to Daly City BART and nearby shopping centers for Park Merced residents and employees. Opportunities may exist to work with Park Merced to open usage to a broader set of West side residents by leveraging additional funding sources. Similar conversations could be broached with San Francisco State University (SFSU), which also operates a shuttle to BART.
SUMMARY OF TRANSIT ACCESS FINDINGS
• Most West Side residents live within walking distance of a transit route that will take them to West Portal Station or directly downtown, and approximately 15 percent of the West Side study area can access West Portal within a 15-minute transit ride. Many fewer residents live within walking distance of a route that will connect them to a BART station, and only about 1 percent of the study area lies within a 15 minute transit ride of Daly City BART station which serves downtown, east bay and south bay markets, the latter via Caltrain and SamTrans buses.
• Some existing routes are underutilized, and community interest exists to examine how these routes might be repurposed to strengthen connections to transit hubs.
• Among routes serving West Side transit hubs, the M-line appears to have the most reliability issues. Several proj-ects are underway to improve M-line reliability.
• West Portal Station itself is a key source of unreliability on many of the routes serving the West side.
• Numerous projects are underway to improve transit service quality on many of the lines serving West Side transit hubs and key destinations. The 29-Sunset, which serves Balboa Park BART, is one route that has not been extensively studied.
STRATEGIC ANALYSIS REPORT • IMPROVING WEST SIDE TRANSIT ACCESS
SAN FRANCISCO COUNTY TRANSPORTATION AUTHORITY • FEBRUARY 2016
PAGE 7
sion to bicycle include fear of getting hit by a car, bus, or truck (76 percent said this had a major impact on their decision to use a bicycle); concern about riding up and down hills (56 percent); and concern about having a bi-cycle stolen (55 percent).
• HIGH TRAFFIC STRESS LEVELS AND SAFETY RISK ALONG GE-
NEVA AND OCEAN AVENUES. To access Balboa Park BART by bicycle from West Side neighborhoods, residents must use facilities on Ocean or Geneva Avenue, which are high volume, high traffic arterials and in some areas suitable only to “Strong and Fearless” (LTS 4) riders.3 Ge-neva and Ocean avenues are also identified as bicyclist high injury corridors in the City’s Vision Zero Network. The SFMTA’s Bicycle Strategy calls for improving bicycle infrastructure along these routes on Ocean and Geneva avenues between Phelan Street and Alemany Boulevard (see Figure 8). The SFMTA Board also recently approved new bicycle lanes on Ocean Avenue between Sunset Boulevard and 19th Avenue.
• STEEP GRADES ON ST. CHARLES AVENUE NORTH OF DALY
CITY BART. Currently the only official bicycle route that accesses Daly City BART is St. Charles Avenue. Grades on the St. Charles Avenue bicycle paths leading to and from Brotherhood Way are prohibitively steep. A study by the San Francisco State University identified this as a deter-rent to some riders. Other access barriers to Daly City BART include the lack of bicycle facilities immediately to the east and south of the station. According to BART staff, this will be addressed in part though bicycle lanes being added to John Daly Boulevard but lanes could also be explored for De Long Street.
• LACK OF SECURE BICYCLE PARKING AT WEST PORTAL STA-
TION. The only available bicycle parking near West Por-tal Station includes four bicycle racks at the West Portal Public Library. The SFMTA’s Long Term Bicycle Parking Strategy (2013) calls for secure bicycle parking at West Portal, but it has not yet been implemented.
• LACK OF BICYCLE SHARE. The West Side currently lacks bicycle share stations at transit hubs or other popular destinations. Motivate, the company responsible for bi-cycle share deployment, will be distributing thousands of bicycles throughout the Bay Area in the coming years, however, no published plans specify whether bicycles will be added at West Side hubs.
VEHICULAR / PRIVATE SHARED VEHICLE ACCESS
Daly City BART has designated areas for passenger pickup and drop-offs, but the space is not sufficient for demand, resulting in double parking and significant circulation is-sues throughout the station area, according to BART staff. Although BART is currently working to expand available capacity for pickup and drop-off, only minor changes are
3 The Mineta Institute devised a four-tier measure of traffic stress for cyclists. Level of Traffic Stress (LTS) 1 is suitable for children; LTS 2 is suitable for most adults; LTS 3 is suitable for en-thusiastic and confident riders; and LTS 4 is suitable only for the most fearless and strong riders: http://transweb.sjsu.edu/project/1005.html. West Portal station lacks long-term bicycle parking. These are
the only available parking spaces near the station.
FIGURE 7. Current bicycle network in the West Side
FIGURE 8. Bicycle network plus improvement proposals included in the SFMTA Bicycle Strategy

PAGE 8
STRATEGIC ANALYSIS REPORT • IMPROVING WEST SIDE TRANSIT ACCESS
SAN FRANCISCO COUNTY TRANSPORTATION AUTHORITY • FEBRUARY 2016
possible without a high-cost capital project to restructure the station. BART is interested in supporting greater use of carpooling among those who are currently driving alone to the station, since space available for carpool vehicles can be expanded more easily than space for pickup and drop-off. Fare products to encourage transit use have been studied before but have not yielded actionable plans, though SFSU is in potentially fruitful talks with BART about a modified class/eco pass.
West Portal, on the other hand, lacks any designated pick-up/drop-off facility or taxi stand. There are no known plans to modify or add pickup/drop-off facilities at West Portal.
Limited data is available on the degree to which new pri-vate mobility services including Lyft/Uber are using West Side hubs for pickup/drop-off. About 20 percent of survey respondents indicated that they use Uber/Lyft at least once a month for any purpose, however very few (<2 percent) reported typically using Uber or Lyft to access a transit hub.
According to Lyft, pick-ups for its ride hail service occur at low to moderate rates (relative to the rest of San Francisco) throughout West Side neighborhoods in the morning week-
day peak (7–10 AM). In the evening weekday peak (4–6 PM), West Side transit hubs generally have low pickup rates relative to the rest of San Francisco. Usage appears to be greater on the weekends, but are still low relative to other parts of the city.
Chariot, a private transit operator, does not currently serve the study area but is serving the Richmond neighborhood. The company reports that requests have been made for di-rect services from the Sunset to downtown, but not for con-necting services within the west side (e.g. from residences to transit hubs). Chariot uses crowdsourcing to site new routes, and indicated that it can provide new services when-ever residents indicate sufficient interest and agree to sign up for the service in advance.
4. Prioritization of Access Issues The previous analysis revealed a large number of opportuni-ties to improve access to West Side transit hubs and encour-age alternatives to driving alone to hubs or directly to work. To prioritize these opportunities, we conducted a survey of West Side residents to identify the types of improvements that would be most likely to encourage them to take transit or bicycle instead of drive. The survey was distributed via doorhangers on residences throughout the study area, and via intercepts at West Portal, Balboa Park, and Daly City sta-tions.
We also asked respondents to indicate overall how likely they would be to choose bicycling, taking transit, or taking a shared-ride service to reach a transit hub. We found that more than half current drivers said that they were “very” or “somewhat likely” to consider taking transit, compared to about a third who would consider shared ride services (e.g. shared van, shared taxi, Lyft, Uber), and almost 20 percent who said they would consider bicycling.
Table 1 (next page) summarizes the survey results. It shows that drivers placed the greatest value on transit travel time and reliability improvements—results were similar for cur-rent transit riders as well. This finding is consistent with several previous surveys, including the 2007 Transit Effec-tiveness Program Rider Survey, which indicated that Muni riders value reliability improvements more highly than any other type of transit improvement.
Based on these results, the top access improvements that appear to be most likely to attract drivers to choose transit include, in priority order:
1. Improve transit travel times to hubs and downtown.
2. Improve the reliability of transit connections to west side transit hubs and downtown while addressing fre-quency and crowding.
3. Improve transit routing to fill gaps in service and make more effective use of underutilized routes.
4. Pilot programs to support use of shared ride services (e.g. vanpools, shared Uber/Lyft, etc) to access transit hubs.
SUMMARY OF BICYCLE AND VEHICULAR ACCESS FINDINGS
• Few complete, continuous Class I or II bicycle facili-ties connect to West Side transit hubs. Accessing BART stations by bicycle is particularly challenging given the high traffic stress levels and safety risk along Geneva and Ocean avenues (for Balboa Park BART), and because of access gaps around the Daly City BART station, espe-cially steep grades on St. Charles Avenue north of Daly City. SFMTA recently found that concerns about safety and steep grades are top barriers to bicycling among residents of the southwest part of the city.
• West Portal station lacks secure, all-day bicycle parking.
• No bicycle share stations are currently available on the West Side.
• Daly City BART has space designated for pickups and drop-offs, but it is over-subscribed, creating circulation issues inside the station. Significantly expanding the space would require a major capital investment. West Portal lacks designated space for pickups and drop-offs.
• Limited data is available regarding the degree to which shared-use services (Uber, Lyft) are dropping off passen-gers at West Side hubs, but available data indicates that activity is low relative to other parts of the city.
WEST PORTAL STATION

STRATEGIC ANALYSIS REPORT • IMPROVING WEST SIDE TRANSIT ACCESS
SAN FRANCISCO COUNTY TRANSPORTATION AUTHORITY • FEBRUARY 2016
PAGE 9
5. Provide more secure bicycle lanes and bicycle parking.
Each of these recommendations is dis-cussed in more detail below. Specific improvement ideas for each recommen-dation are drawn from the existing condi-tions review, focus groups, and comments provided on the survey. A full summary of the focus groups and survey results are available upon request.
5. Recommendations
5.1 | Near-Term Recommendations
RECOMMENDATION 1: IMPROVE THE TRAVEL TIME AND RELIABILITY OF WEST SIDE TRANSIT ROUTES.
Surveys of West Side residents and tran-sit users collected for this study indicated that faster transit service (e.g. shorter travel times) and improved reliability are most likely to encourage drivers to take transit to access West Side hubs. Multiple projects are underway to improve travel time and on many of the routes serving West Side transit hubs (see Table A2, page 13), such as the ongoing project to speed service on the L-Taraval, which connects to West Portal and directly downtown. Implementing these projects is critical to improving access to transit hubs.
Beyond these efforts, the 29-Sunset stands out as a prom-ising opportunity for additional improvement. This route serves a major West Side transit hub (Balboa Park BART), but travel times are long for most West Side residents. Ridership has grown by about 40 percent since 2007, and vehicles are experiencing crowding in some locations. All these factors suggest that additional investment is justified. San Francis-co Public Works is planning to repave Sunset Boulevard in the next year, creating a window of opportunity for imple-mentation of improvements if they could be defined quickly.
Additional work is also needed to address reliability prob-lems affecting access to transit hubs. We recommend con-tinuing and augmenting ongoing efforts to address reli-ability at the West Portal Station by addressing circulation issues affecting all modes of travel and identifying strategies to reduce transit delay. These issues should be addressed in conjunction with other West Portal access issues highlighted in this document, such as the lack of secure, all-day bicycle parking, lack of designated pickup/drop-off areas and lack of clear bicycle wayfinding into the station. The effort could consider not just the West Portal station entry but the sur-rounding area, such as options for directing traffic to Forest Hill for pickup/drop-off, and should include outreach to lo-cal residents, merchants, and neighborhood groups affected by West Portal congestion.
A final recommendation is to develop a plan for accomodat-ing more frequent bus service at Daly City BART. As men-tioned before, Daly City lacks space to absorb more frequent connecting bus service.
RECOMMENDATION 2: LEVERAGE UNDERUTILIZED ROUTES TO STRENGTHEN CONNECTIONS TO HUBS
Survey responses suggest that lack of closeby transit routes is not a top barrier to taking transit. However, opportuni-ties exist to reconfigure existing, lower-performing routes to improve performance and strengthen connections to transit hubs. Several routes on the West Side are underutilized but the 66-Quintara stands out as the least utilized route in the study area and one that lacks connections to major destina-tions or transit hubs. We recommend studying options to improve the 66 or other lower performing routes.
RECOMMENDATION 3: PILOT METHODS OF ENCOURAGING CARPOOLING AND RIDESHARING TO TRANSIT HUBS
Our survey found that about a third of drivers said that they would consider taking a shared ride service to access West Side transit hubs; drivers appeared to be more interested in these services than non-drivers. Shared ride services have the potential to expand the options available to drivers interested in taking transit from a major hub, especially for those who live outside walking distance of their preferred transit route. If vehicles are shared by multiple people, this could also help reduce demand for pickups and drop-offs at BART stations or West Portal and could reduce parking demand at BART. BART is particularly interested in supporting greater use of carpooling among those who are currently driving alone to the station, since space available for carpool vehicles can be expanded relatively easily.
TABLE 1. Access Improvement Opportunities Prioritized by West Side Driver* Interest
PRIORITY
Transit Improvements—High Priority
Transit speed/travel time High
Transit reliability High
Transit frequency Medium
Transit crowding Medium
Transit proximity to home or work Medium
Transit affordability, hours of service Low
Shared Van or Carpool Service—Medium Priority
Bicycling Improvements—Lower Priority **
More bicycle lanes High
Better knowledge of how to bicycle on city streets Med
Electric bicycle access/discount Med
Bicycle parking Med
Support from friends to bicycle with me Low
Access to Bay Area Bicycle share Low
* Individuals who indicated that they are currently either driving to transit or driving all the way to their work destination.** Shortly after completion of this survey, SFMTA completed a statistically-significant survey of barriers to bicycling in San Francisco. We relied on those results to formulate recommendations for bicycling.

PAGE 10
STRATEGIC ANALYSIS REPORT • IMPROVING WEST SIDE TRANSIT ACCESS
SAN FRANCISCO COUNTY TRANSPORTATION AUTHORITY • FEBRUARY 2016
Several options exist for encouraging greater use of high oc-cupancy shared-use modes for pickup/drop-off at West Side transit hubs, especially Daly City. These could include:
• Co-marketing shared use services with mobility provid-ers to individuals who currently park at BART or Muni.
• Working with carpooling applications to incentivize car-pooling to transit stations. This could include providing direct cash incentives to carpoolers or providing other incentives like reserved parking.
RECOMMENDATION 4: INCREASE BICYCLIST’ SAFETY AND COMFORT TO ENCOURAGE BICYCLING TO HUBS
Survey results suggest that improving bicycle safety, ad-dressing challenges associated with hilly terrain, and reduc-ing the incidence of bicycle theft should be top priorities for encouraging more bicycling by residents in the Southwest part of the city. Based on this, top recommendations include:
• Implement planned projects to improve bicycle safety in the Geneva Corridor and on Ocean Avenue (or on paral-lel routes), which are bicyclist high injury corridors, cre-ate high levels of stress for bicyclists, and are key access routes to Balboa Park BART station.
• Identify locations for implementing secure, all day bicy-cle parking in the West Portal area to allow commuters to leave bikes securely during the day while they travel downtown.
• Identify funding for a study that would develop a propos-al for improving bicycle connections to Daly City BART and address challenges associated with steep grades, such as by creating a bridge crossing at Brotherhood Way.
5.2 | Long-Term Recommendations
RECOMMENDATION 5: EXPLORE SUBWAY EXTENSIONS AND CREATING FREEWAY HIGH OCCUPANCY VEHICLE LANES FOR EXPRESS BUSES
Our analysis found that only about 30 percent of the West Side study area is within a fifteen minute transit ride of a rail hub (West Portal: 15 percent, Forest Hill: 7 percent, Daly City: 1 percent, and Balboa Park: 6 percent). Significantly expanding this figure will require not just improving access to hubs, but expanding the reach of underground subways into the West Side. Expanding direct access to underground rail or other grade-separated transit has the potential to sig-nificantly improve travel times to downtown for West Side residents, especially those not currently living near a hub.
Plans are already underway to underground portions of the M-Line through the M-Ocean View/19th Avenue Project, and the potential for additional subway expansions could be considered as part of the Transit Modal Concept Study in the next Long Range Transportation Planning Process. Sub-way extensions to the West Side are also being considered as part of Muni's Rail Capacity Study and the Metropolitan Transportation Commission’s Core Capacity Study.
Subway extensions are very costly, and must compete for limited local, state, and federal funding with other unfunded transportation projects such as the extension of Caltrain to the Transbay Transit Center, provision of a rail link along Geneva Avenue, and others. Any proposals for expanding subway access to the West Side will be more competitive if designed in conjunction with land use development around the planned extension.
Another strategy for reducing travel times between the West Side and downtown would be to dedicate a lane to transit buses on I-280, which would allow buses from the West Side to express downtown within 20 minutes or less once on the freeway. The viability of this idea could be explored as part of developing the Freeway and Street Traffic Management Strategy in the upcoming Long Range Transportation Plan-ning Process (LRTPP).
RECOMMENDATION 6: DEVELOP A STRATEGY FOR REDUCING RELIANCE ON SINGLE OCCUPANT DRIVING FOR TRAVEL BETWEEN THE WEST SIDE AND THE SOUTH BAY
This study focused on improving access to transit hubs pri-marily as a means to reduce driving dependence for West Side workers headed downtown, which is the second most common commute destination. Future studies should also examine how best to reduce driving dependence for West Side workers destined for the South Bay, which is the top commute destination but more difficult to serve by tran-sit given low employment densities and available parking relative to downtown San Francisco. Approximately 90 percent of morning peak period trips between the Sunset and South Bay are currently made by driving, compared to about 28 percent of trips between the Sunset and down-town.4 Future studies could examine options such as pro-viding direct express bus services between the West Side and top South Bay commute destinations; providing more continuous dedicated high occupancy vehicle / transit lanes on US 101 or I-280; providing direct incentives for carpool-ing/ridesharing; or strengthening connections to Caltrain. These ideas could be considered as part of developing the Freeway and Street Traffic Management Strategy in the up-coming LRTPP.
6. Next StepsCarrying forward the recommendations in this study will require identifying a lead agency, integration of new proj-ects into annual agency work programs, and identification of funding sources. Table 2 (next page) lists possible lead agencies and next steps.
Possible funding sources for recommendations 1a and 1b include Prop K,Prop B, and regional Transit Performance
4 SF CHAMP, 2012 Baseline Year; reflects share of AM peak period trips. Possible funding sources for recommendations 1a and 1b include Prop K,Prop B, and regional Transit Performance Initiative funds. Sources for recommendation 3 include Prop K, Transportation Fund for Clean Air (TFCA), or regional Bay Area Climate Initiatives funds. Sources for recommendations 4a-4c include Prop AA, TFCA, Prop K, Active Transportation Program funds, and the One Bay Area Grant Program.

STRATEGIC ANALYSIS REPORT • IMPROVING WEST SIDE TRANSIT ACCESS
SAN FRANCISCO COUNTY TRANSPORTATION AUTHORITY • FEBRUARY 2016
PAGE 11
Initiative funds. Sources for recommendation 3 include Prop K, Transportation Fund for Clean Air (TFCA), or re-gional Bay Area Climate Initiatives funds. Sources for rec-
ommendations 4a-4c include Prop AA, TFCA, Prop K, Ac-tive Transportation Program funds, and the One Bay Area Grant Program.
TABLE 2. Possible Lead Agencies and Funding Sources for Study Recommendations
RECOMMENDATION POSSIBLE LEAD AGENCIES
NEXT STEPS
1a. Improve transit travel time and reliability on the 29-Sunset
SFMTA Estimate staff resources needed and determine when they can be made available.
1b. Improve transit travel time, reliability, and multimodal access at West Portal station
SFMTA Integrate multimodal access considerations into the upcoming West Portal Avenue Transit Enhancement Project.
2. Improve transit routing and maximize performance of poorly-performing routes
SFMTA Estimate staff resources needed and determine when they can be made available; consider applying for Neighborhood Transportation Improvement Program funds.
3. Pilot methods of encouraging greater use of carpooling and ridesharing to transit hubs.
SFMTA, SFCTA, BART Estimate staff resources needed and determine when they can be made available.
4a. Implement projects to address bicyclist safety on Geneva / Ocean avenues or parallel routes
SFMTA Develop project concepts within the context of SFMTA Bicycle Strategy Implementation.
4b. Implement secure bicycle parking in the West Portal area SFMTA Consider in the context of ongoing study of West Portal area operations and multimodal access.
4c. Develop bicycling improvements around Daly City BART Station
SFMTA, SFCTA, BART Estimate staff resources needed and determine when they can be made available.
5.Explore subway extensions and express buses on freeway high occupancy vehicle lanes
SFCTA, SFMTA Study options as part of the Transit Modal Concept Study in the upcoming Long Range Transportation Planning Process (LRTPP).
6. Develop a strategy for reducing single occupant vehicle travel between the West Side and South Bay
SFCTA, SFMTA Study options as part of the Freeway and Street Traffic Management Strategy in the upcoming LRTPP.
7. Sources The existing conditions review drew on the following plans, policies, and studies:
San Francisco State University Bicycle Geographies Study 20 percent by 2020: Promoting cycling to SFSU (2015)
SFMTA’s Bicycle Strategy Update to the SFCTA Citizens Advisory Committee (2015)
19th Avenue Transit Study (2014)
Sunset District Blueprint (2014)
Sunset District Blueprint (2015)
Muni Forward (2013)
SFMTA’s Bicycle Strategy (2013)
SFMTA’s Long-Term Bicycle Parking Strategy (2013)
SFMTA's Bicycle Survey (2015, unpublished)
WalkFirst (2013)
Daly City BART Station Access Improvement Plan (2012)
Parkmerced Vision Plan (2010)
Transportation Authority staff members interviewed the following public agency staff:
Tim Chan, Manager of Planning, BART
Mariana Perrieras, Access Coordinator, BART
Aaron Weinstein, Marketing Manager, BART
Sean Kennedy, Muni Forward Program Manager, SFMTA
Michael Rhodes, Muni Forward, SFMTA
Greg Riessen, Associate Engineer, SFMTA
Julie Kirschbaum, Manager of Service Planning, SFMTA
Mike Sallaberry, Senior Engineer for Livable Streets, SFMTA
Grahm Satterwhite, Transit Planner, SFMTA
Andy Thornley, Senior Project Analyst, SFMTA
Stephanie Shook, Civic San Diego
Transportation Authority staff interviewed the following representatives of private mobility providers:
Emily Castor, Director of Transportation Policy, Lyft
Forrest Hanson, Senior Sales Manager, RidePal
Ali Vahabzadeh, Founder, Chariot
James Mirras, Alexander Esposito, founders, the FreeRide Shuttle

PAGE 12
STRATEGIC ANALYSIS REPORT • IMPROVING WEST SIDE TRANSIT ACCESS
SAN FRANCISCO COUNTY TRANSPORTATION AUTHORITY • FEBRUARY 2016
APPENDIX ATABLE A1. West Side Transit Service Hours, Frequencies, Reliability and Passenger Loads
LINE RELATIONSHIP TO TRANSIT HUBS
AM PEAK, WEST SIDE RIDERSHIP1
WEEKDAY SERVICE HOURS
AM PEAK HEADWAYS2 (MINS)
ON TIME PERFORMANCE3 (% VERY LATE, ENTIRE ROUTE)
AM AVERAGE PEAK WEST SIDE LOAD4
N-Judah — 2,220 5 AM–1:30 AM 7 11% 54%
M-Ocean View Serves West Portal and Balboa Park BART
2,296 5 AM–1:30 AM 9 10% 27%
L-Taraval Serves West Portal 1,986 4:30 AM–1 AM 8 6% 48%
KT-Ingleside Serves West Portal 1,469 4 AM–1:30 AM 9 11% 43%
28-19th Ave Serves Daly City BART and will serve Balboa Park in the future
595 5 AM–1 AM 10.5 5% 49%
28R-19th Ave Serves Daly City BART and will serve Balboa Park in the future
382 6:45 AM–5:20 PM 10.5 3% 47%
29-Sunset Serves Balboa Park BART 803 5:15 AM–1 AM 10 4% 60%
7R-Haight/Noriega Rapid
— 313 6:45 AM–9:30 AM 10 6% 23%
7X (16X)-Noriega Express
— 332 6:25 AM–9:30 AM 9 15% 43%
48-Quintara/24th St Serves West Portal 297 6:00 AM–12:00 AM 11.5 6% 31%
18-46th Ave — 173 5:40 AM–12:45 AM 22 4% 33%
54-Felton Serves Daly City BART 147 5:40 AM–1 AM 20 4% 38%
23-Monterey — 113 5:20 AM–12 AM 20 8% 31%
57-Parkmerced Serves West Portal and Daly City BART
78 6 AM–12 AM 30.5 2% 24%
66-Quintara — 78 6 AM–11:30 PM 20.5 9% 19%
NOTES:
1. AM Peak, Westside Ridership is calculated by summing the number of passengers boarding the bus at west side stops (both inbound and outbound) from 7:00 AM–8:59 AM, and dividing this number by 2, unless the route only runs in one direction (e.g. 7X). Bus ridership and load data is from October to December 2012. Rail ridership and load data for the West Side is from 2007–2009 (the most recent time period available). Line level peak load as measured at Van Ness Station in 2013 increased between 1 and 21 percent, depending on the line. It is likely that ridership on the West Side has grown more slowly than ridership as measured at Van Ness Station, particularly on the KT, M and N.
2. AM Peak Headway reported is the average of the scheduled inbound headways from 7am–9am. (Schedules from 511.org.)
3. On-time Performance (Percent Very Late) for the entire route is calculated by averaging October, November and December 2015 percent of very late on time status from the San Francisco Municipal Transportation Agency “Percentage of On-Time Performance” found here: https://www.sfmta.com/about-sfmta/reports/performance-metrics/percentage-time-performance
4. AM Average Peak Load (Percent of Planning Capacity).This is the average of the loads observed at all stops on the West Side during the AM peak period (7am–9am). This is calculated by dividing the average West Side load (the sum of all average loads during the peak period on the West Side) by the planning capacity of each vehicle. The Planning capacity is 85 percent of the maximum seating and standing capacity of the vehicle.

STRATEGIC ANALYSIS REPORT • IMPROVING WEST SIDE TRANSIT ACCESS
SAN FRANCISCO COUNTY TRANSPORTATION AUTHORITY • FEBRUARY 2016
PAGE 13
ATABLE A2. West Side Transit Lines: Recent Improvements and Ongoing or Planned Projects
TRANSIT ROUTE RELATIONSHIP TO WEST SIDE HUBS
RECENT SERVICE CHANGES / IMPROVEMENTS ONGOING OR PLANNED PROJECTS
N-Judah — Extra two car morning train added September 2015
The N-Judah Rapid Project will implement several treatments (new traffic signals with transit signal priority, optimized stop locations, increased stop spacing, transit boarding areas) to speed trains and reduce travel times.
M-Ocean View Serves West Portal and Balboa Park BART
— Three stages of improvements are planned for this line—near-term signal timing changes and segments of red transit lanes; mid-term travel time improvements; and long-term plans for undergrounding portions of the line along 19th Avenue (M/19th Avenue Project).
L-Taraval Serves West Portal — The L-Taraval Rapid Project involves developing pedestrian safety and transit priority improvements to improve reliability and reduce travel times.
KT-Ingleside Serves West Portal As part of the Green Light Rail Center Track Replacement Project, SFMTA recently constructed an ADA accessible boarding ramp and platform at the Balboa Park Station for the K-Ingleside (and J-Church) line.
—
28 / 28R-19th Ave Serves Daly City BART and will serve Balboa Park BART as well in the future
— 28-19th Avenue Rapid Project will implement transit priority and pedestrian safety treatments to increase the frequency and reliability of service, and improve travel times.
29 Sunset Serves Balboa Park BART April 2015 increase in service frequency, September 2015 route change to speed travel time
—
7R-Haight/ Noriega Rapid
— — 7R-Haight/Noriega Rapid Project will implement transit priority and pedestrian safety treatments to increase the frequency and reliability of service, and improve travel times.
7X (16X)-Noriega Express
— September 2015, new route extension to the Financial District.
—
48- Quintara/24th St Serves West Portal — Planned extension of service west of West Portal Station during non-peak hours (currently only serves this segment during the peak period).
18-46th Avenue — September 2015 increase in frequency of service and more direct route
—
54-Felton Serves Daly City BART — —
23-Monterey — — —
57-Parkmerced Serves West Portal and Daly City BART
September 2015 increase in frequency of service; re-routed to include a stop at Daly City BART and serve Lakeshore Plaza Shopping Center
—
66-Quintara — — —