Improving WAsP predictions in (too) complex terrain Niels G. Mortensen and Ioannis Antoniou Risø...
21
Improving WAsP predictions in (too) complex terrain Niels G. Mortensen and Ioannis Antoniou Risø National Laboratory Anthony J. Bowen University of Canterbury 2006 EWEC 2 March 2006
-
Upload
dinah-patrick -
Category
Documents
-
view
246 -
download
6
Transcript of Improving WAsP predictions in (too) complex terrain Niels G. Mortensen and Ioannis Antoniou Risø...

Improving WAsP predictions in(too) complex terrain
Niels G. Mortensen and Ioannis Antoniou
Risø National Laboratory
Anthony J. Bowen
University of Canterbury
2006 EWEC
2 March 2006
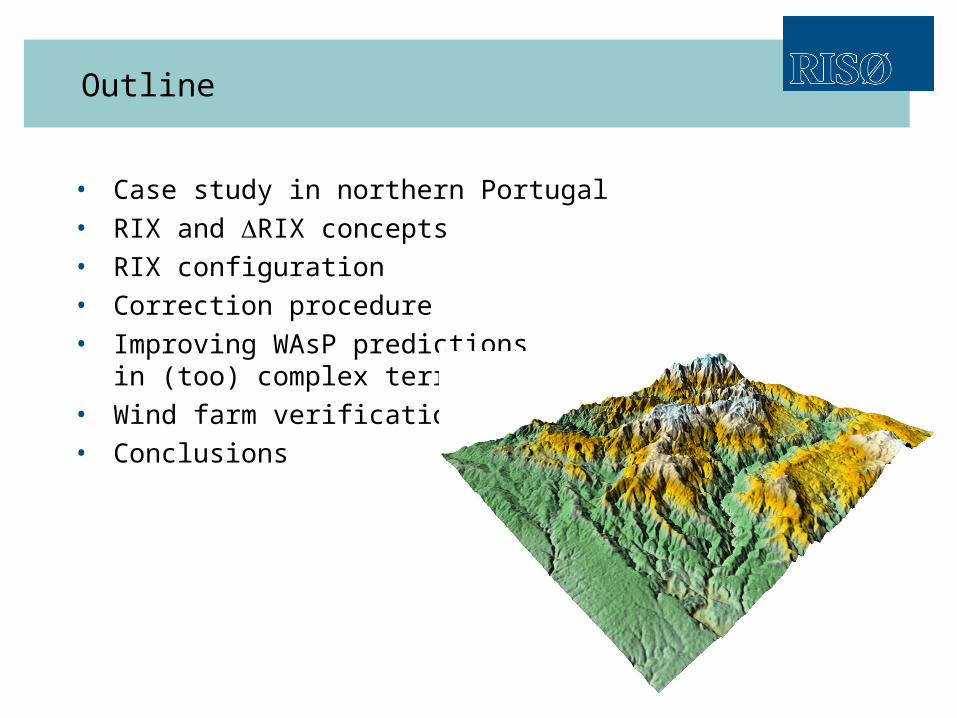
Outline
• Case study in northern Portugal• RIX and RIX concepts• RIX configuration• Correction procedure• Improving WAsP predictions
in (too) complex terrain?• Wind farm verification• Conclusions
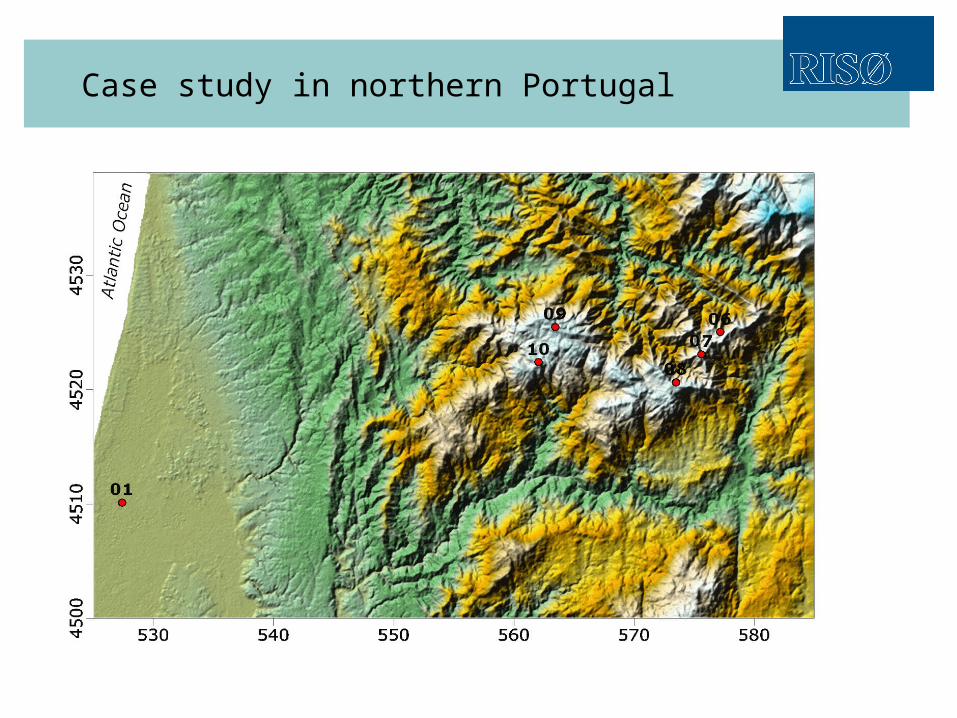
Case study in northern Portugal

Cross-correlation of wind speeds
-40
-30
-20
-10
0
10
20
30
40
50
0 10 20 30 40 50 60 70 80 90 100
Cross-correlation of wind speed, %
Err
or in
pre
dict
ed w
ind
spee
d, %
Hill / hill site pairs
Coastal-plain / hill site pairs
(From Bowen and Mortensen, 1996 EWEC conference)

The flow behaves – to some extent – as if moving over a virtual hill with less steep slopes than the actual hill =>
actual speed-up is smaller than calculated by WAsP
N. Wood (1995). “The onset of flow separation in neutral, turbulent flow over hills”, Boundary-Layer Meteorology 76, 137-164.
-100 0 100
0
40
80
120 Virtual HillSteepness ~ 30%
Steepness ~ 40%
Effect of a steep hill – flow separation

Complex terrain analysis
Terrain steeper than c is indicated by the thick red (radial) lines
• Ruggedness index, RIX
• fraction of terrain surface which is steeper than a critical slope c
• Calculation radius ~ 3.5 km
• Critical slope c ~ 0.3
• Onset of flow separation
• Performance envelope for WAsP is when RIX = 0
• Performance indicator, RIX
• ΔRIX = RIXWTG – RIXMET
• ΔRIX < 0 under-prediction
• ΔRIX > 0 over-prediction

Prediction error vs. RIX difference
“This performance indicator provides encouraging results…”(Bowen and Mortensen, 1996 EWEC conference)

The Ruggedness Index revisited
• Reanalyses of Portuguese data sets• Larger and more detailed maps (SRTM 3)• Improved RIX calculation
• Calculation implemented in WAsP and ME• More calculation radii: 72 rather than 12• RIX configuration corresponds to BZ-model grid
• Improved predicted wind climate and power production• Emergent wind speed distribution

Maps for RIX calculation and modelling
Hand-digitised map• 8 by 8 km2
• 50- and 10-m cont.
SRTM-derived map • 20 km diameter• 50-, 10- and 5-m
height contours+ spot heights
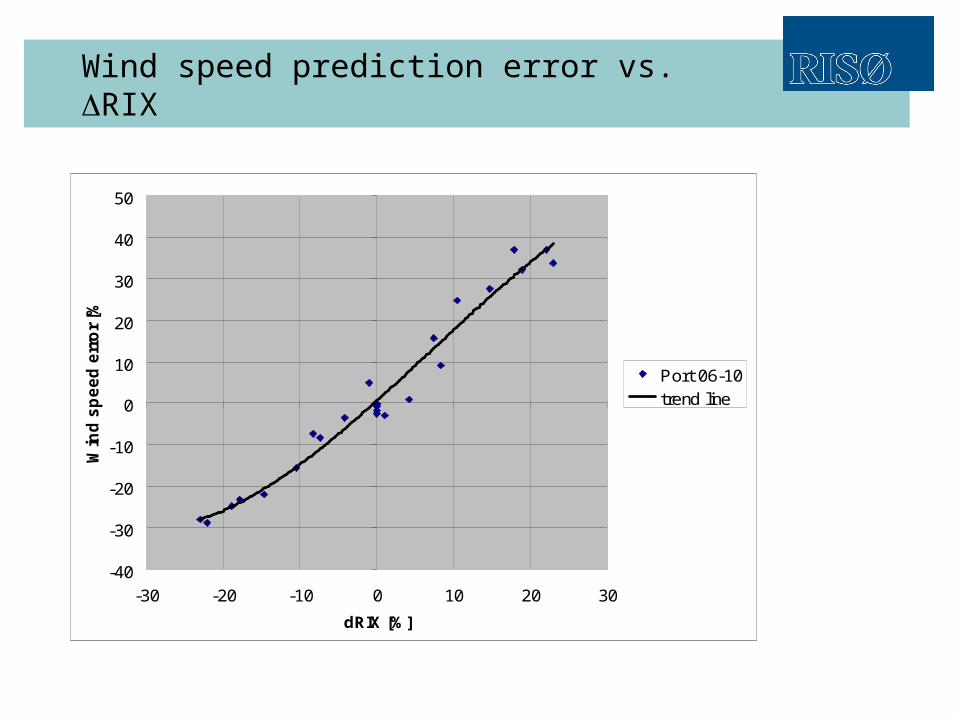
Wind speed prediction error vs. RIX
-40
-30
-20
-10
0
10
20
30
40
50
-30 -20 -10 0 10 20 30
dRIX [%]
Win
d s
pe
ed
err
or
[%]
Port 06-10
trend line

ln(Up/Um) vs. RIX
y = 1.508x
R2 = 0.975
-0.4
-0.3
-0.2
-0.1
0.0
0.1
0.2
0.3
0.4
-0.3 -0.2 -0.1 0.0 0.1 0.2 0.3
dRIX
ln(U
p/U
m)
Port 06-10
trend line
Up = Um exp( RIX)
where = 1.5
R = 3500 m and c = 0.3
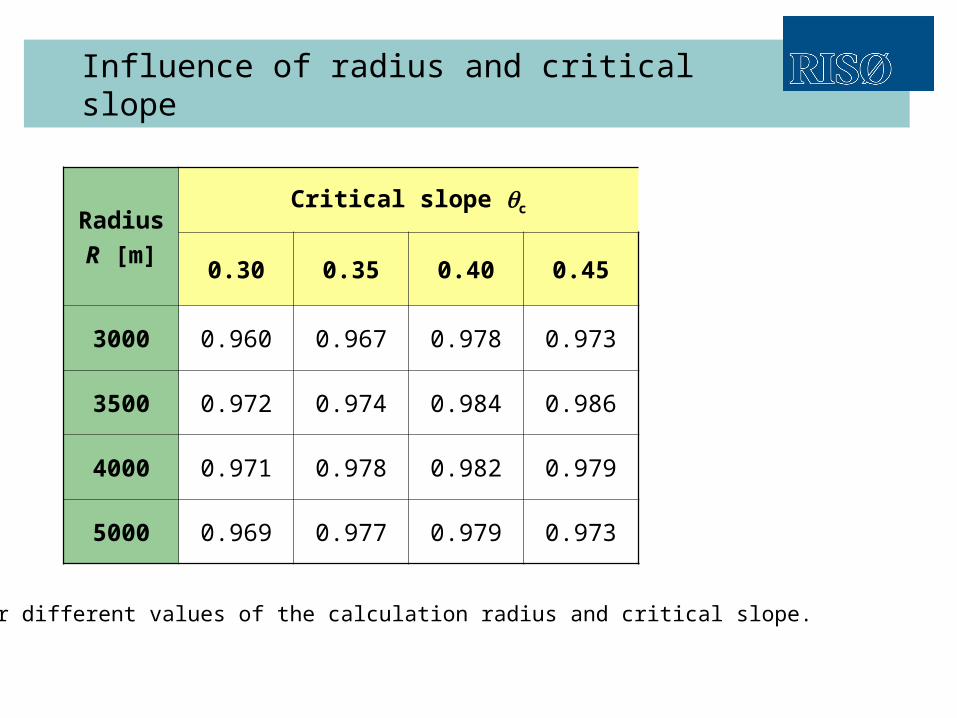
Influence of radius and critical slope
Radius
R [m]
Critical slope c
0.30 0.35 0.40 0.45
3000 0.960 0.967 0.978 0.973
3500 0.972 0.974 0.984 0.986
4000 0.971 0.978 0.982 0.979
5000 0.969 0.977 0.979 0.973
R2 for different values of the calculation radius and critical slope.

Influence of calculation height
• Vertical wind profile in complex terrain with RIX = 16%
• 40-m anemometer used as predictor
• Vertical profile is predicted well because of similarity in ruggedness index:ΔRIX = 0
0 1 2 3 4 5 6 7 8 9 10 11 12
Mean wind speed [m s - 1]
0
5
10
15
20
25
30
35
40
45
He
igh
t a
.g.l
. [m
]
M easurem ents
W AsP predictions

Improving WAsP predictions in complex terrain
1. Analysis procedure:
Observed Wind Climate
+ sheltering obstacles
+ roughness map
+ elevation map Regional Wind Climate
2. Application procedure:Regional Wind Climate
+ sheltering obstacles
+ roughness map
+ elevation map Predicted Wind Climates
+ power and thrust curves Predicted wind farm AEP
3. Post-processing:• Insert WTG at met. stations
• Make cross-predictions @ hhub
• Plot ln(Pp/Pm) vs. RIX
• Linear fit Pp = Pm exp( RIX)
Slope of trend line
4. Correct production estimates:• Apply correction factor
Pm = Pp/exp( RIX)
Corrected gross AEP• Apply wake model results Corrected net AEP
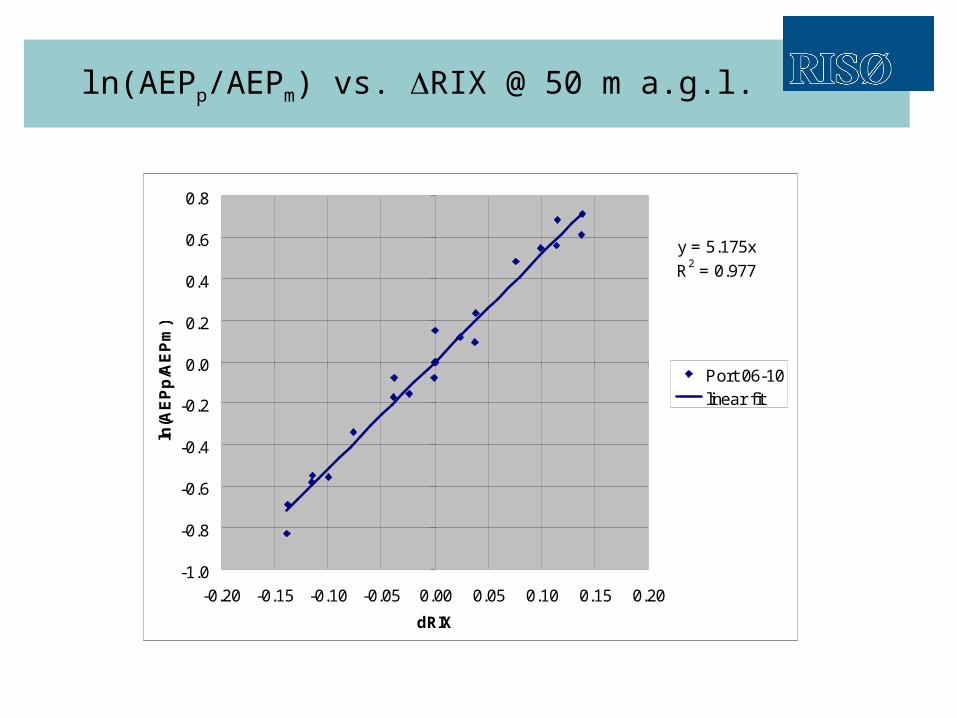
ln(AEPp/AEPm) vs. RIX @ 50 m a.g.l.
y = 5.175x
R2 = 0.977
-1.0
-0.8
-0.6
-0.4
-0.2
0.0
0.2
0.4
0.6
0.8
-0.20 -0.15 -0.10 -0.05 0.00 0.05 0.10 0.15 0.20
dRIX
ln(A
EP
p/A
EP
m)
Port 06-10
linear fit
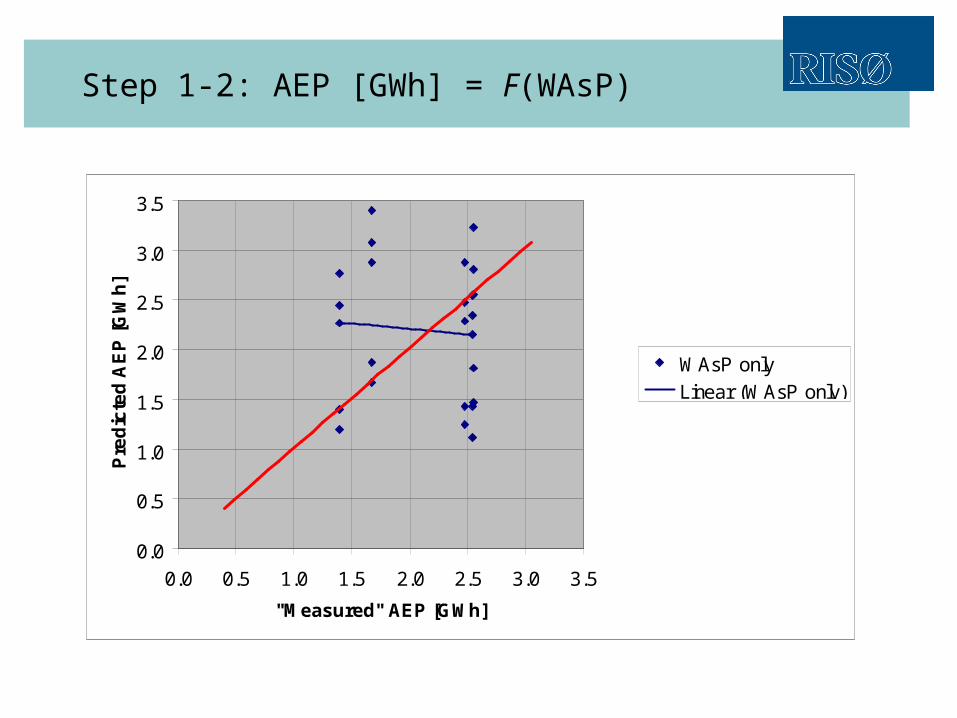
Step 1-2: AEP [GWh] = F(WAsP)
0.0
0.5
1.0
1.5
2.0
2.5
3.0
3.5
0.0 0.5 1.0 1.5 2.0 2.5 3.0 3.5
"Measured" AEP [GWh]
Pre
dic
ted
AE
P [
GW
h]
WAsP only
Linear (WAsP only)
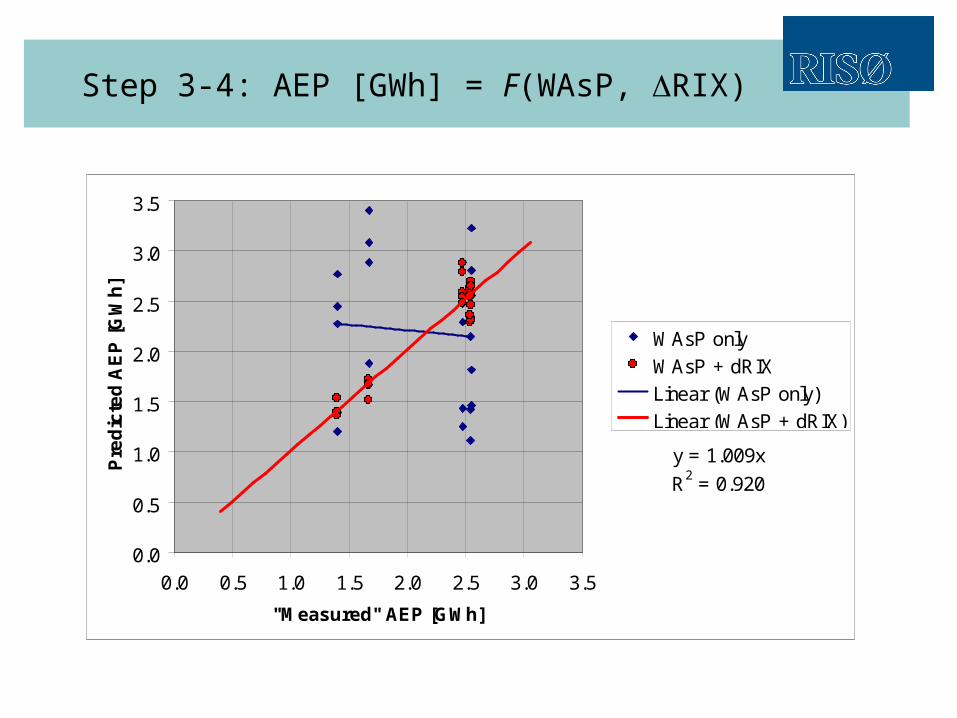
Step 3-4: AEP [GWh] = F(WAsP, RIX)
y = 1.009x
R2 = 0.920
0.0
0.5
1.0
1.5
2.0
2.5
3.0
3.5
0.0 0.5 1.0 1.5 2.0 2.5 3.0 3.5
"Measured" AEP [GWh]
Pre
dic
ted
AE
P [
GW
h]
WAsP only
WAsP + dRIX
Linear (WAsP only)
Linear (WAsP + dRIX)
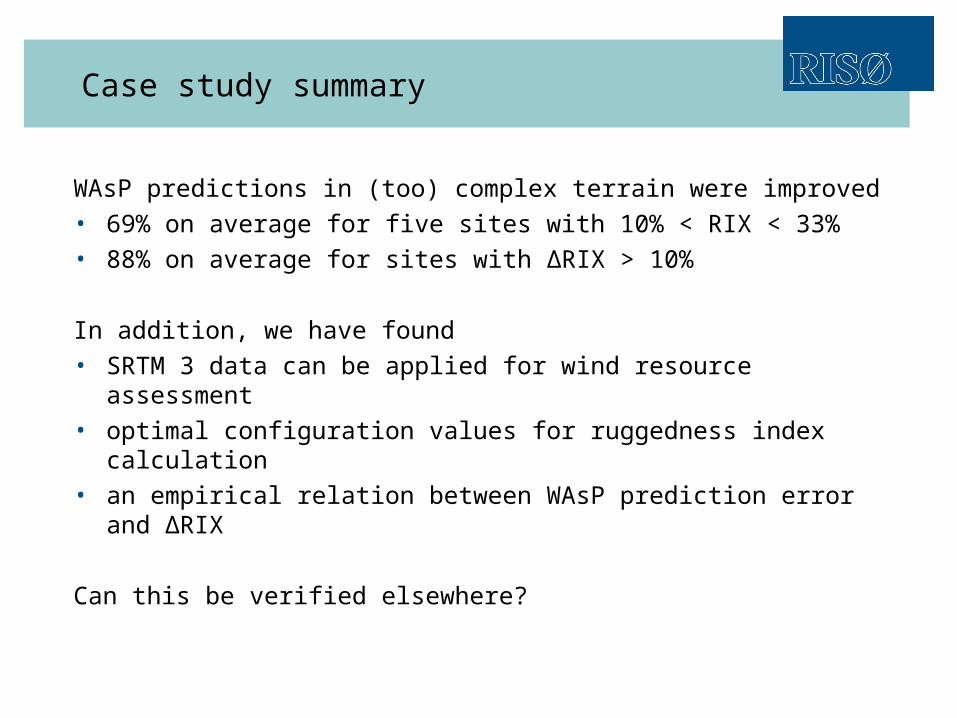
Case study summary
WAsP predictions in (too) complex terrain were improved• 69% on average for five sites with 10% < RIX < 33%• 88% on average for sites with ∆RIX > 10%
In addition, we have found• SRTM 3 data can be applied for wind resource assessment• optimal configuration values for ruggedness index calculation• an empirical relation between WAsP prediction error and ∆RIX
Can this be verified elsewhere?
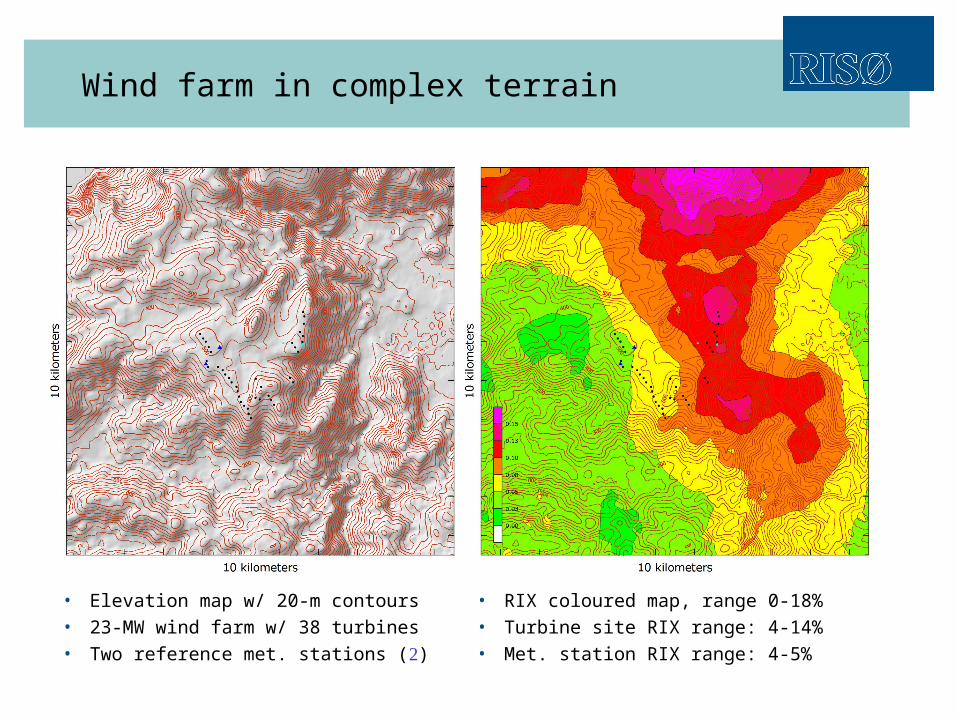
Wind farm in complex terrain
• Elevation map w/ 20-m contours
• 23-MW wind farm w/ 38 turbines
• Two reference met. stations ()
• RIX coloured map, range 0-18%
• Turbine site RIX range: 4-14%
• Met. station RIX range: 4-5%
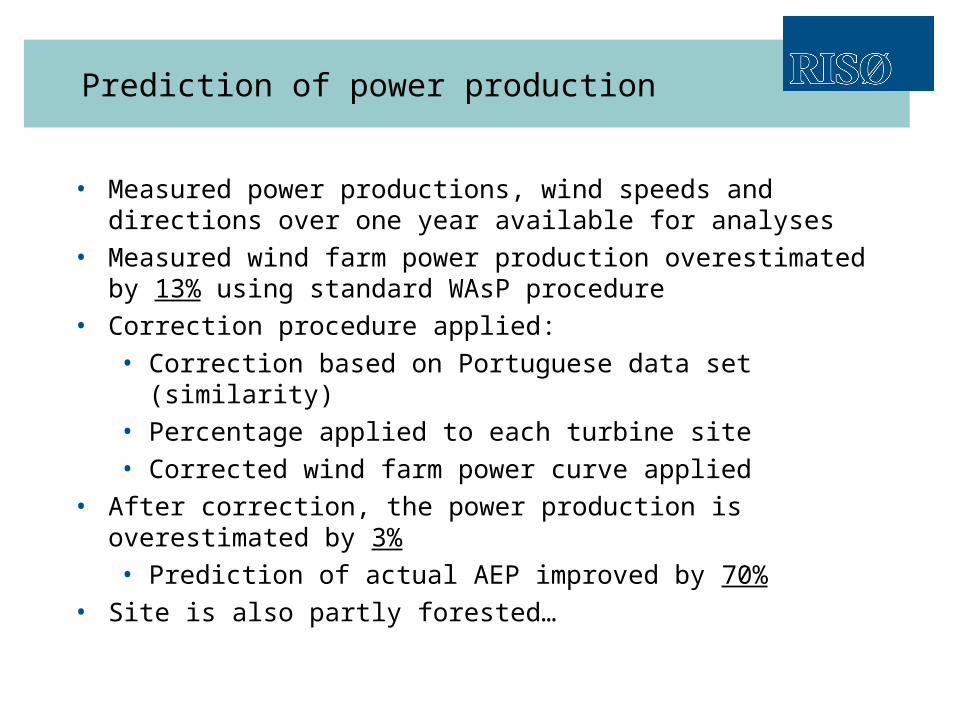
Prediction of power production
• Measured power productions, wind speeds and directions over one year available for analyses
• Measured wind farm power production overestimated by 13% using standard WAsP procedure
• Correction procedure applied:• Correction based on Portuguese data set (similarity)• Percentage applied to each turbine site• Corrected wind farm power curve applied
• After correction, the power production is overestimated by 3%• Prediction of actual AEP improved by 70%
• Site is also partly forested…

Conclusions
• Ruggedness index RIX and performance indicator RIX
• Concepts supported by new data and procedures
• Optimum radius and slope for RIX determined
• (RIX, U) relation not very sensitive to calculation radius R, critical slope c, or prediction height h
• Relation between WAsP prediction errors and RIX
• Linear relation between ln(Up/Um) or ln(Pp/Pm) and RIX
RIX weighted with the wind rose does not improve the relation between ln(Up/Um) and RIX
• Correction procedure outside WAsP operational envelope
• Percentage can be applied to each turbine site
• Note, that all this is purely empirical…
• Similarity of sites: ridges, escarpments and mountain tops
• constant should be determined for site and height