Improving Success for Diverse Students in STEM
21
Improving Success for Diverse Students in STEM Prof. Michael A. McKibben Divisional Dean of Student Academic Affairs College of Natural and Agricultural Sciences (CNAS) U. C. Riverside
Transcript of Improving Success for Diverse Students in STEM
Improving Success for
Diverse Students in STEM
Prof. Michael A. McKibben Divisional Dean of Student Academic Affairs
College of Natural and Agricultural Sciences
(CNAS)
U. C. Riverside
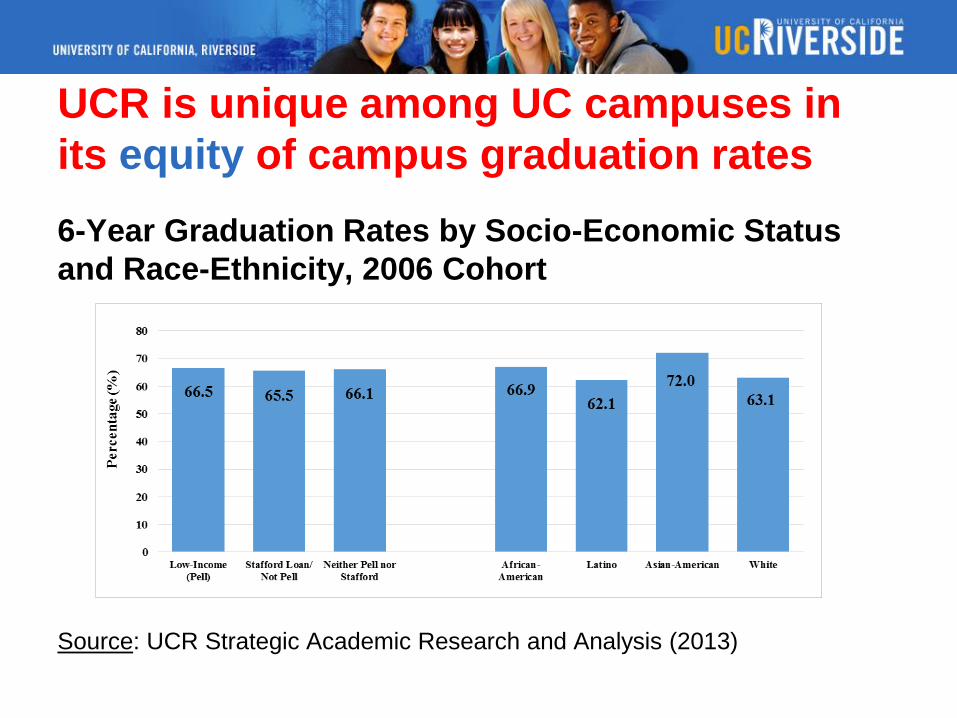
UCR is unique among UC campuses in
its equity of campus graduation rates
6-Year Graduation Rates by Socio-Economic Status
and Race-Ethnicity, 2006 Cohort
Source: UCR Strategic Academic Research and Analysis (2013)
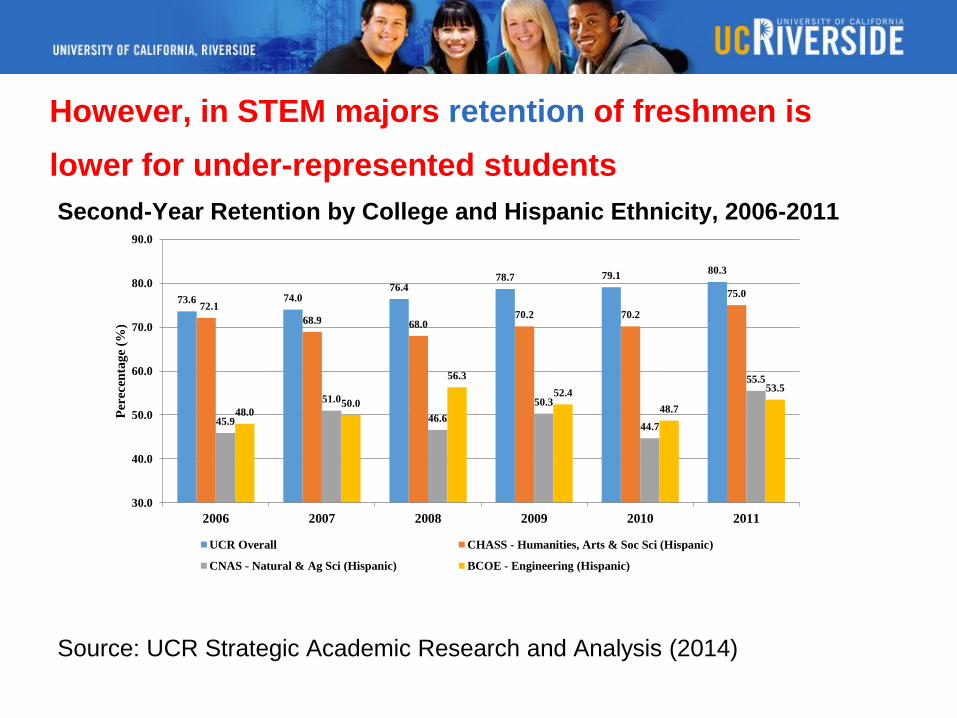
However, in STEM majors retention of freshmen is
lower for under-represented students Second-Year Retention by College and Hispanic Ethnicity, 2006-2011
Source: UCR Strategic Academic Research and Analysis (2014)
73.6 74.0 76.4
78.7 79.1 80.3
72.1
68.9 68.0 70.2 70.2
75.0
45.9
51.0
46.6
50.3
44.7
55.5
48.0 50.0
56.3
52.4
48.7
53.5
30.0
40.0
50.0
60.0
70.0
80.0
90.0
2006 2007 2008 2009 2010 2011
Per
ecen
tag
e (%
)
UCR Overall CHASS - Humanities, Arts & Soc Sci (Hispanic)
CNAS - Natural & Ag Sci (Hispanic) BCOE - Engineering (Hispanic)
Student Success Initiatives
For this reason, the Science college (CNAS)
has focused many of its academic interventions
at the lower division (freshmen, sophomores).
To create effective interventions, we must
understand the demographics of our freshmen
and the challenges that they face in finishing
STEM majors.
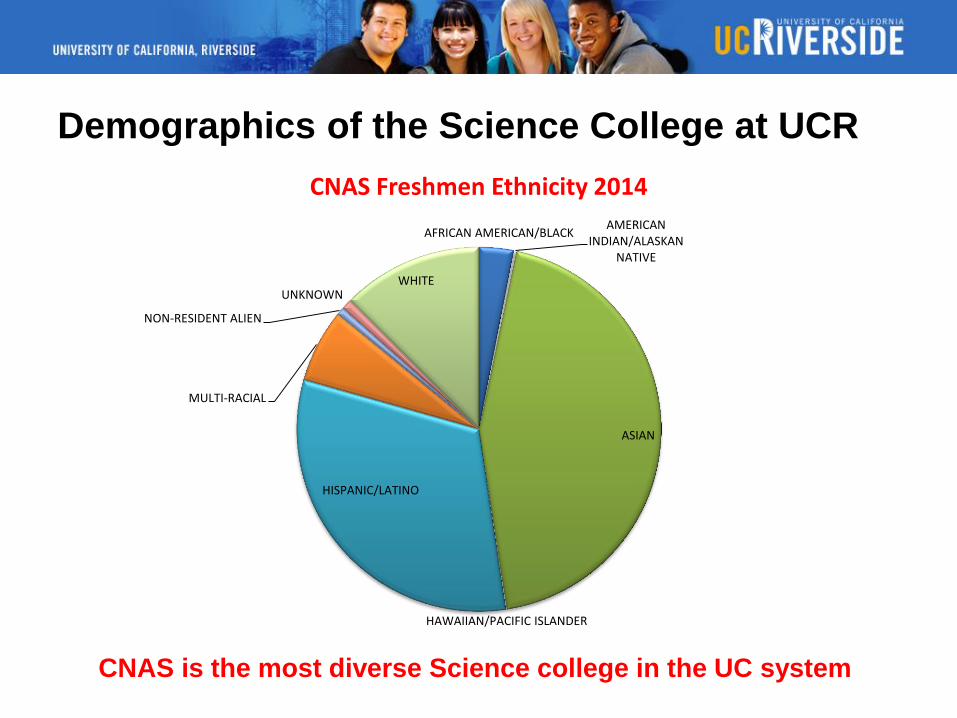
Demographics of the Science College at UCR
AFRICAN AMERICAN/BLACK AMERICAN
INDIAN/ALASKAN NATIVE
ASIAN
HAWAIIAN/PACIFIC ISLANDER
HISPANIC/LATINO
MULTI-RACIAL
NON-RESIDENT ALIEN
UNKNOWN WHITE
CNAS Freshmen Ethnicity 2014
CNAS is the most diverse Science college in the UC system
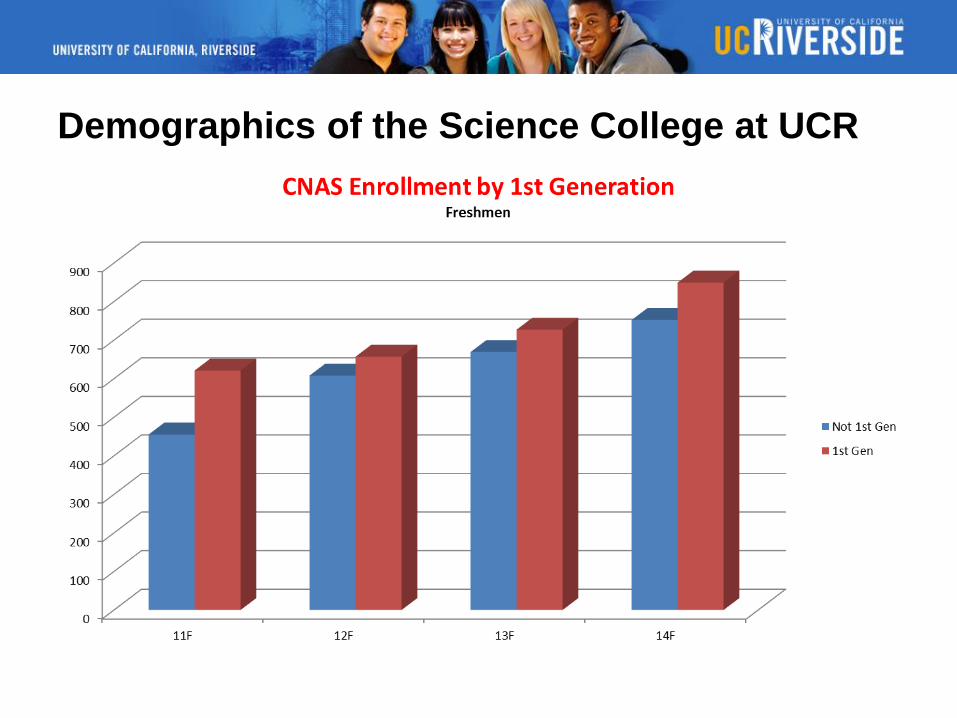
Demographics of the Science College at UCR
Socio-Economic Challenges
Low-income – many need to work part-time,
summer session is too expensive
First-generation – have no role models at
home for guidance on being a science
student and STEM professional
Under-represented – see few in the STEM
faculty and professions who look like them,
making it harder to visualize their career
opportunities
Academic Challenges
They are away from home for the first time,
with many new distractions.
Their new peer group at UC is much more
competitive than their High School peers.
The quantitative skills needed to master
STEM subjects require intense study time
(2 hours outside of class for every hour in
class): 16 units + 32 hours = 48 hours/week!
Intervention Strategies in CNAS
Summer Bridge Math Preparation before UC
matriculation - but not everyone can afford it.
Learning Communities – create a social
and academic support group to help new
Freshmen transition to college.
Early Research Engagement – expose them
to the excitement of scientific methods and
discovery as early as possible.
Early Career Exploration and Mentoring by
near-peers and alumni – role models.
First-year Learning Communities -
facilitating the critical transition
Place incoming Freshmen with similar math placements and majors into cohorts of 24 students.
Take the same math and core science courses all year long as a cohort.
Peer tutoring in math and science courses throughout their first year.
Faculty mentoring and academic advising seminars in Fall.
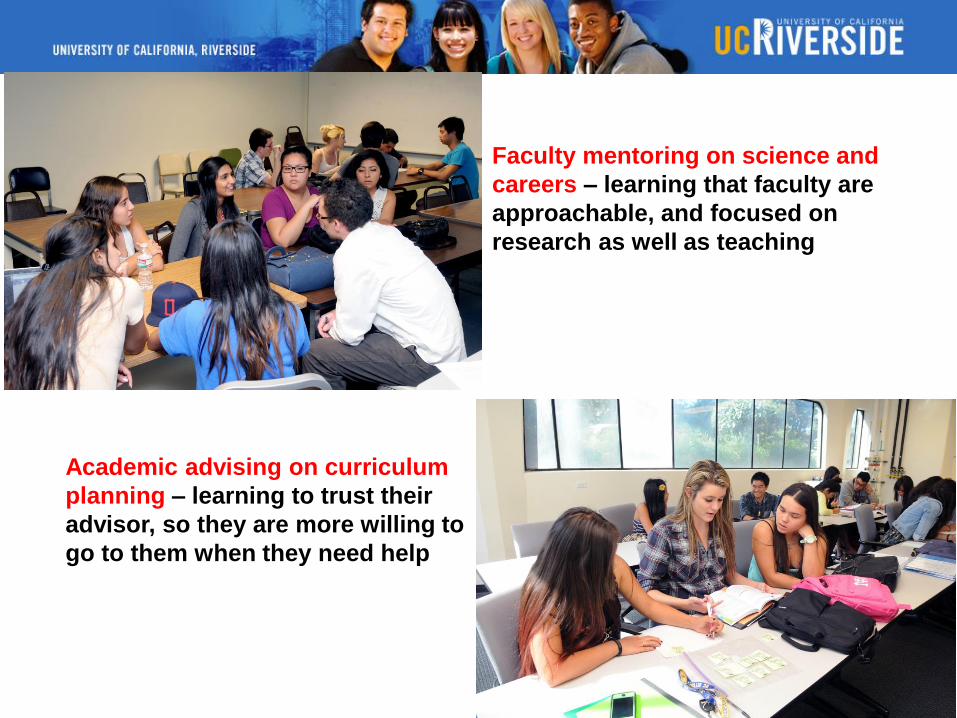
Faculty mentoring on science and
careers – learning that faculty are
approachable, and focused on
research as well as teaching
Academic advising on curriculum
planning – learning to trust their
advisor, so they are more willing to
go to them when they need help
First-year research engagement
Biology 20: The Dynamic Genome (dna extraction and gene sequencing) – for Life science majors
Chemistry 95: Explorations in Molecular Science (computer modeling and field sampling of atmospheric gases) – for Physical/Mathematical science majors
Hands-on, active learning laboratory research (24 students/class) conducted alongside their large introductory Biology and Chemistry courses (300-600 students/class).
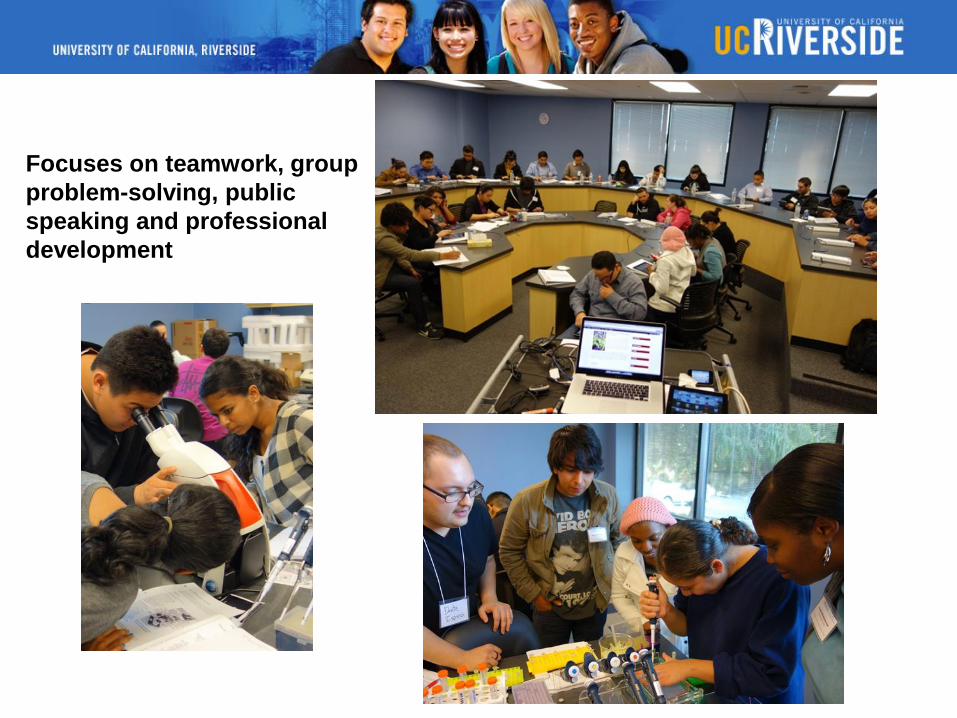
Focuses on teamwork, group
problem-solving, public
speaking and professional
development
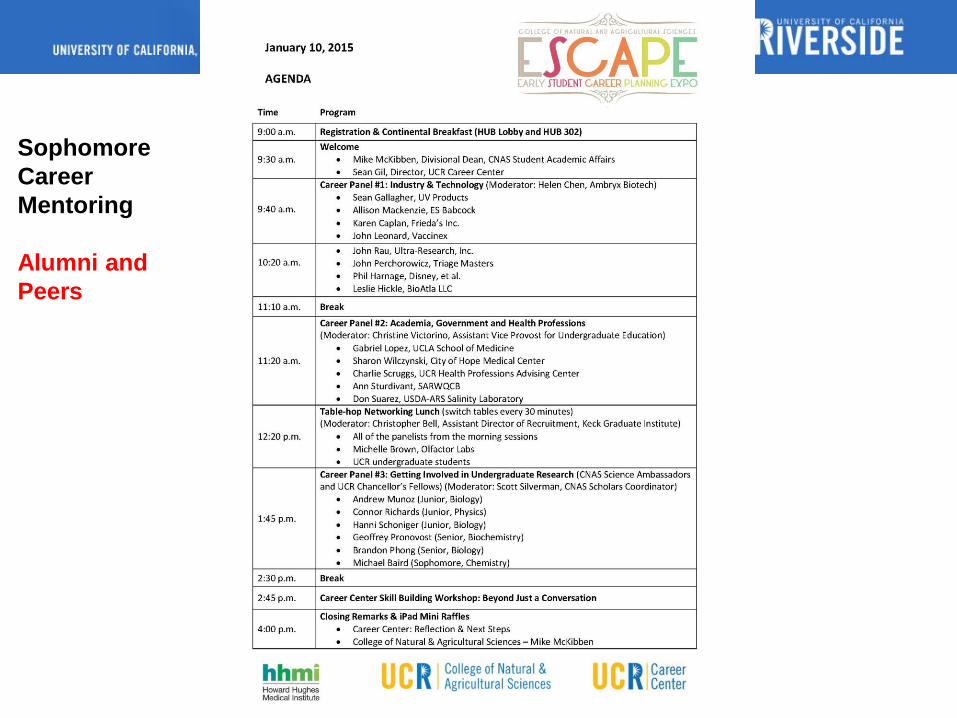
Sophomore
Career
Mentoring
Alumni and
Peers
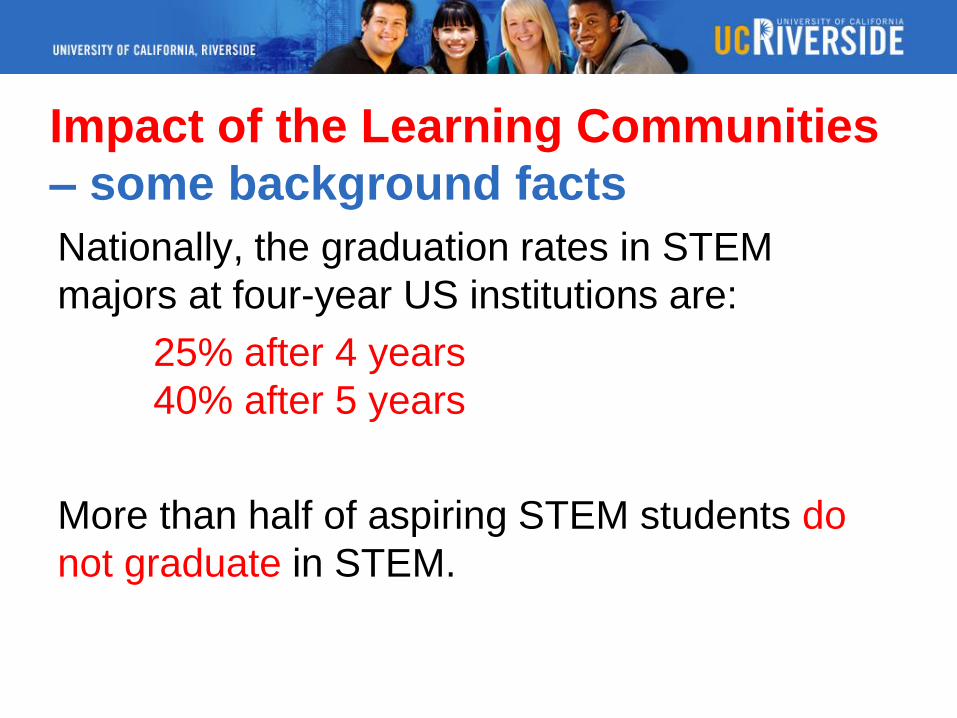
Impact of the Learning Communities
– some background facts
Nationally, the graduation rates in STEM
majors at four-year US institutions are:
25% after 4 years
40% after 5 years
More than half of aspiring STEM students do
not graduate in STEM.
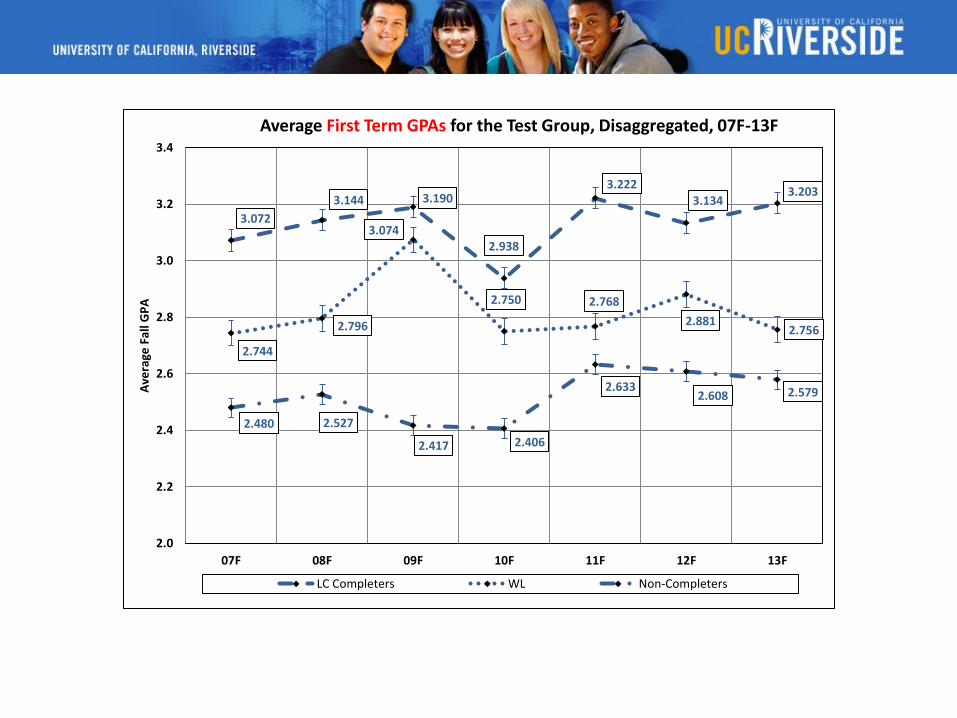
3.072
3.144 3.190
2.938
3.222 3.134
3.203
2.744
2.796
3.074
2.750 2.768
2.881 2.756
2.480 2.527
2.417 2.406
2.633 2.608 2.579
2.0
2.2
2.4
2.6
2.8
3.0
3.2
3.4
07F 08F 09F 10F 11F 12F 13F
Ave
rage
Fal
l GP
A
Average First Term GPAs for the Test Group, Disaggregated, 07F-13F
LC Completers WL Non-Completers
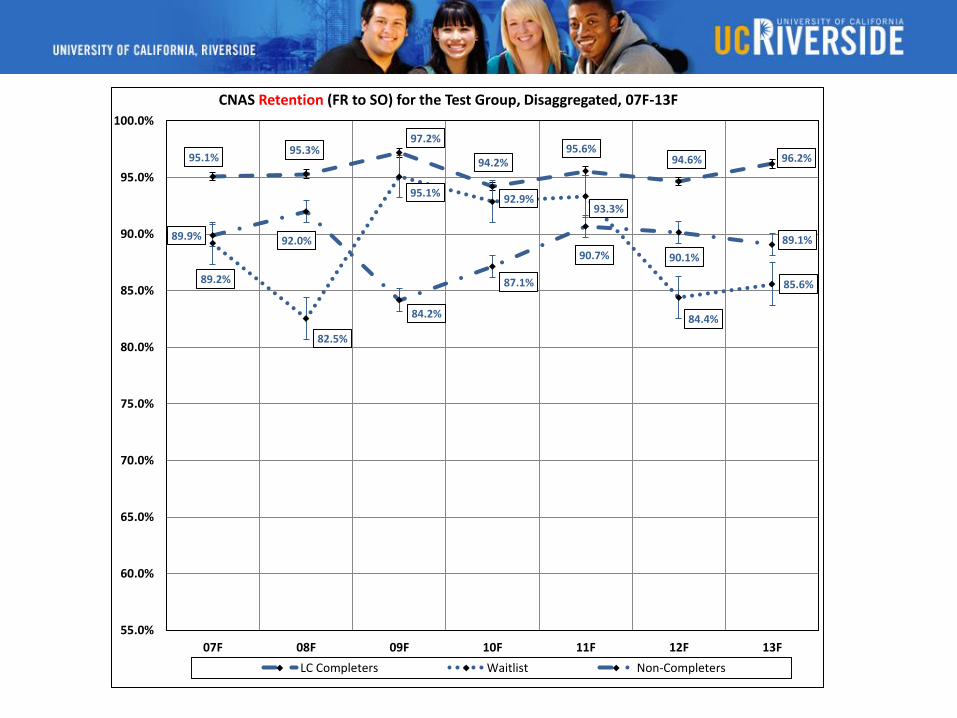
95.1% 95.3%
97.2%
94.2% 95.6%
94.6% 96.2%
89.2%
82.5%
95.1% 92.9%
93.3%
84.4%
85.6%
89.9% 92.0%
84.2%
87.1%
90.7% 90.1%
89.1%
55.0%
60.0%
65.0%
70.0%
75.0%
80.0%
85.0%
90.0%
95.0%
100.0%
07F 08F 09F 10F 11F 12F 13F
CNAS Retention (FR to SO) for the Test Group, Disaggregated, 07F-13F
LC Completers Waitlist Non-Completers
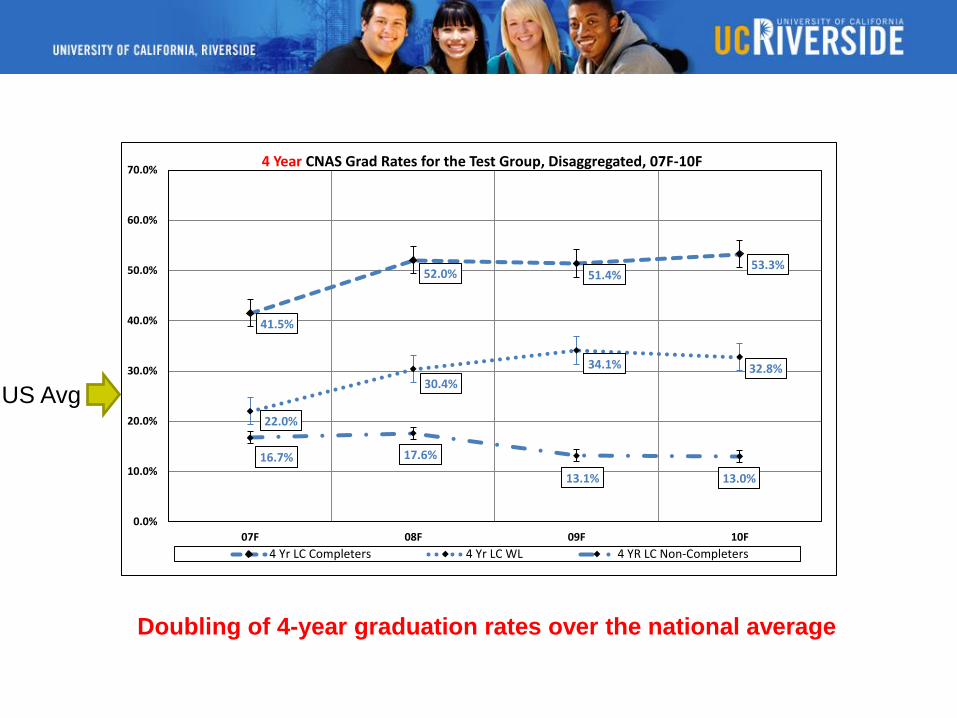
41.5%
52.0% 51.4% 53.3%
22.0%
30.4%
34.1% 32.8%
16.7% 17.6%
13.1% 13.0%
0.0%
10.0%
20.0%
30.0%
40.0%
50.0%
60.0%
70.0%
07F 08F 09F 10F
4 Year CNAS Grad Rates for the Test Group, Disaggregated, 07F-10F
4 Yr LC Completers 4 Yr LC WL 4 YR LC Non-Completers
US Avg
Doubling of 4-year graduation rates over the national average
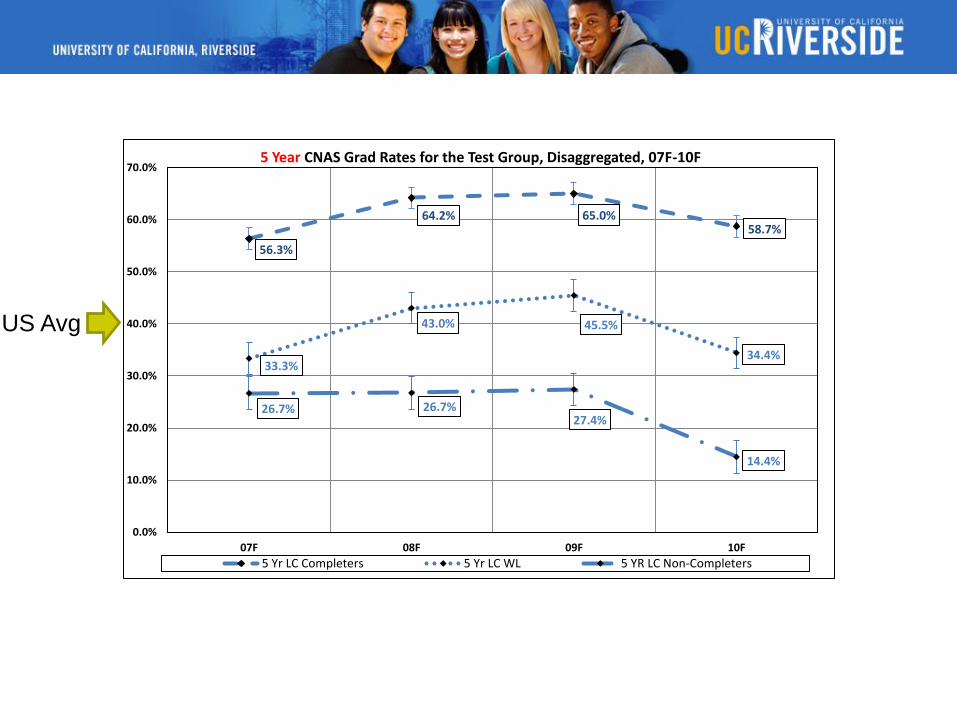
56.3%
64.2% 65.0% 58.7%
33.3%
43.0% 45.5%
34.4%
26.7% 26.7% 27.4%
14.4%
0.0%
10.0%
20.0%
30.0%
40.0%
50.0%
60.0%
70.0%
07F 08F 09F 10F
5 Year CNAS Grad Rates for the Test Group, Disaggregated, 07F-10F
5 Yr LC Completers 5 Yr LC WL 5 YR LC Non-Completers
US Avg
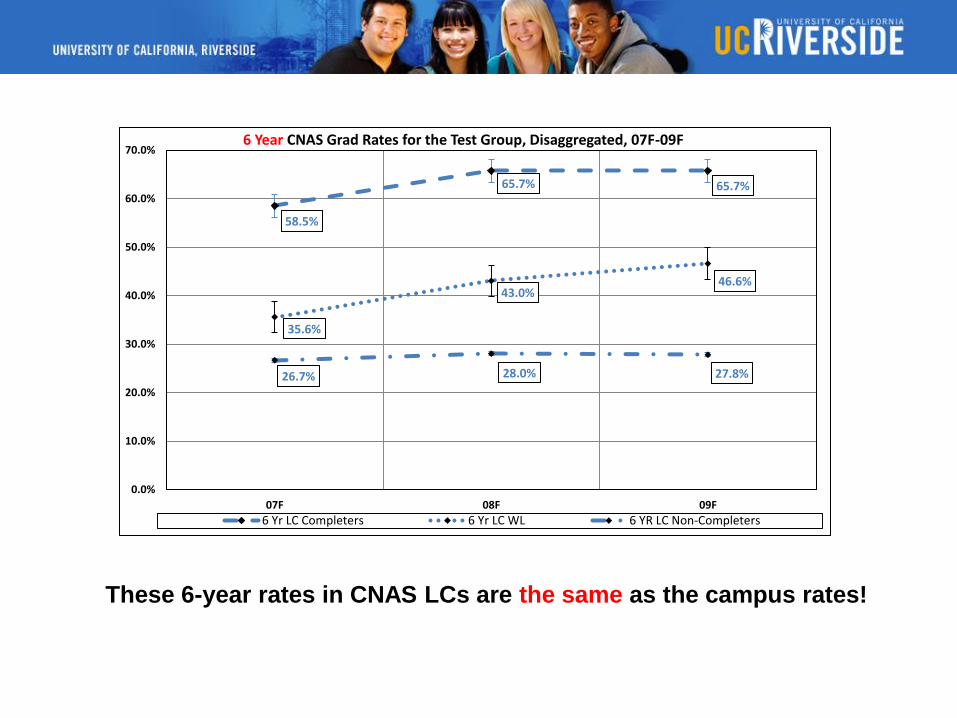
58.5%
65.7% 65.7%
35.6%
43.0% 46.6%
26.7% 28.0% 27.8%
0.0%
10.0%
20.0%
30.0%
40.0%
50.0%
60.0%
70.0%
07F 08F 09F
6 Year CNAS Grad Rates for the Test Group, Disaggregated, 07F-09F
6 Yr LC Completers 6 Yr LC WL 6 YR LC Non-Completers
These 6-year rates in CNAS LCs are the same as the campus rates!
Federal grant support of CNAS’ student success
programs:
2013: National Science Foundation awarded CNAS $2.0 M
for 5 years to expand its freshman learning community
program.
2014: Howard Hughes Medical Institute awarded CNAS
$2.4 M for 5 years to support early research and career
engagements for its freshmen and sophomores.