Improving STEM Education by Analyzing the Design of a Bottle
16
Paper ID #32019 Improving STEM Education by Analyzing the Design of a Bottle Alexander Henderson, San Jose State University Alexander Henderson is an undergraduate student attending San Jose State University to attain a bach- elor’s degree in mechanical engineering along with a minor in aviation. Since starting his college years as a freshman in 2015, he has participated in a wide variety of engineering courses that have helped him achieve multiple accomplishments. Two of these accomplishments include being recognized as a dean scholar by San Jose State University and collaborating in the development of an aeroshell for Spartan Hyperloop. After participating in the CSU system for five years, he knows the strengths and weaknesses that are present in the American education system today. Alexander Garcia, San Jose State University Alexander Garcia is a student attending San Jose State University to attain a bachelor’s degree in Me- chanical Engineering. In his third semester he and his group presented the functionality of LEDs to early elementary school groups from another school. Before that, from 2008 to 2017, he attended community college, at first not knowing what his final goal was before deciding to pursue mechanical engineering and earning an associates degree in physics at Mission College. c American Society for Engineering Education, 2020
Transcript of Improving STEM Education by Analyzing the Design of a Bottle
Paper ID #32019
Improving STEM Education by Analyzing the Design of a Bottle
Alexander Henderson, San Jose State University
Alexander Henderson is an undergraduate student attending San Jose State University to attain a bach-elor’s degree in mechanical engineering along with a minor in aviation. Since starting his college yearsas a freshman in 2015, he has participated in a wide variety of engineering courses that have helped himachieve multiple accomplishments. Two of these accomplishments include being recognized as a deanscholar by San Jose State University and collaborating in the development of an aeroshell for SpartanHyperloop. After participating in the CSU system for five years, he knows the strengths and weaknessesthat are present in the American education system today.
Alexander Garcia, San Jose State University
Alexander Garcia is a student attending San Jose State University to attain a bachelor’s degree in Me-chanical Engineering. In his third semester he and his group presented the functionality of LEDs to earlyelementary school groups from another school. Before that, from 2008 to 2017, he attended communitycollege, at first not knowing what his final goal was before deciding to pursue mechanical engineering andearning an associates degree in physics at Mission College.
c©American Society for Engineering Education, 2020
Improving STEM Education by Analyzing the Design of a Bottle
Abstract
STEM education for students is an essential aspect of today’s education since it leads to greater
development in the modern world and more technological achievements. Achieving this sort of
education can be done by performing an engineering analysis to determine the volume content of
a wine bottle. The project conducted here was to determine the volume of a wine bottle by
measuring it at various points and using mathematics to perform this real-world analysis. Its
objective is not only to reflect on what was done but to introduce it as a STEM-related project to
encourage new growth within the STEM fields. There was also extended reasoning as to why
STEM is important in today’s world through small examples of what already exists. This is done
as a step toward increasing the standing that the United States holds currently within the world’s
STEM community, which is low compared to other countries. This is partially due to a lack of
interest that many American students have in STEM-related fields. To fix this, the STEM-related
activities that students perform in schools today need to incorporate what they do in their
everyday lives.
1. Introduction: Math in Engineering and STEM
The first question to ask here is, "What is STEM?" STEM is an acronym for "Science,
Technology, Engineering, and Mathematics." It is an educational curriculum dedicated to the
subjects stated in the name. The term was first coined by Judith Ramaley in 2001, where she was
an Assistant Director of Education and Human Resources at the National Science Foundation
[1]. It was initially called "SMET," but she and others agreed that "STEM" was better because it
eliminated the implied level of importance of science and mathematics over-engineering and
technology [2]. After this event, the focus on STEM started to extend out to the curriculum used
in many other countries.
As more countries started to implement a STEM-based curriculum into their education system,
the United States (U.S.) began to lag further behind. This can first be seen in a survey done in
2015 by the Programme of International Student Assessment, which ranked the U.S. 38th among
71 other countries surveyed in mathematics, and 24th among the same countries in science [3].
These low scores triggered a National Academies of Sciences report, which argued that the U.S.
needed to strengthen K-12 education programs in areas relating to science and mathematics
under the America Competes Act [3]. These results show that many American students that are
within K-12 education programs are struggling with subjects that are STEM-related, whether
they are a first grader who is learning how to add or a sophomore in high school who is taking
algebra.
Unfortunately, this is not a new problem that the U.S. has faced. Even before the early 2000s, the
U.S. was suffering from a lack of education in both mathematics and science. In 1965, the
International Association for the Evaluation of Educational Achievement conducted a test on
math students in 12 different countries to solve 70 problems, one which the U.S. ranked last [4].
In 1989, a test of similar purpose ranked the U.S. last and then second-to-last in 1990 for
mathematics [4]. It was through the first implementations of STEM education in the U.S. that

helped ordinary U.S. children and teenagers to learn more material relating to science,
mathematics, technology, and engineering. It helped push more students to pursue a STEM
career when they grew up. Despite these improvements, U.S. students are still behind the rest of
the world in these areas.
The primary motive behind this lack of effort among K-12 students today is mainly due to their
lack of interest in STEM-related subjects. It must be remembered that the interest in STEM
education and careers varies from personal reasons to conditions outside the control of potential
and current students. The Pew Research Center did a survey in 2017 and found that 52% of the
surveyed adults agree that the STEM-based curriculum for today’s youth (around 21%-24%) was
too hard for them [5]. These courses normally became hard between the ages of thirteen to
seventeen [6]. Other reasons included that STEM education did not relate to their career goals or
it did not catch their interest. Due to the indifference in these subjects, these students flocked to
other subjects. In 2009, a report showed that two competing subjects against STEM were visual
and performing arts indicating people were more interested in entertainment over mathematic,
engineering, and other STEM-related topics [3]. This influx of people entering the entertainment
industry has had extensive effects on STEM education. The lack of interest among students in
STEM fields has caused the U.S. to currently rely on immigrants, who have STEM-qualifying
degrees and training of variable levels from other countries, to help keep our technology and
engineering industries at a standard level with the rest of the world [7]. It has also caused more
students to move towards degrees in the liberal arts while pushing more students away from
degrees and careers in STEM fields, which can have lasting effects in the U.S.
The curriculum categorized as STEM is essential to maintain the level of technology that the
U.S. currently has and to make further advances for the benefit of people worldwide. This STEM
education improvement is especially true since there has been an increase in STEM job demands
between 2000 and 2010, along with the increased benefits that pursuing a STEM educational
approach has on students [8]. Some of these benefits include a better understanding of the
environment that people live in today, better preparation for a college education, greater
creativity, and its vital importance for both STEM and non-STEM jobs alike [8]. Despite the
greater demands and the benefits that STEM education has on students, many schools and
students in the United States still lag in STEM fields.
So, what can be done to improve STEM education in the U.S.? One step that can be taken is to
introduce projects that have a more practical implication in a student's everyday life.
Mathematical courses alone are not elaborating on how relevant these subjects are to other future
curriculums, courses, and applications. The same can be said of lower-level science courses. By
introducing more group projects involving real-world problems to these students, the educational
system may catch the interest of students in how they can help in STEM-related projects run by
technological and engineering groups. This type of method can be seen when we took an
engineering approach to perform a volumetric analysis of a wine bottle.
2. The Volume Calculation on the Bottle
Performing this volumetric analysis on a wine bottle has allowed us to determine if the
mathematical functions derived from simple measurements done on the bottle were similar to the
volumetric calculations that the manufacturer provided. When deriving the volume of this glass
bottle, several assumptions had to be made since the process of glass blowing these bottles will
create some slight variances in the final shape of each bottle. The first assumption comes from
the wine bottle itself not being filled to maximum capacity. When wine bottles are distributed to
consumers, they are usually partially filled to the 750 ml volume mark. In reality, these bottles
can hold up to 800 ml of wine. The main reasons for this include obtaining a better wine and
allowing space for the wine bottle cork to be placed [9]. The second assumption made for our
computation is from the fact that the wine bottle has a punt on the bottom. It is placed here so
that the wine bottle is more natural to hold, has a more prominent resistance to higher pressure,
and to make the bottle larger than it appears [10]. By doing this, the likeliness of people buying
these bottles goes up. The last assumptions to be made when calculating the volume includes the
glass bottle having a constant thickness and a smooth surface all the way around. This
assumption helps make determining the individual equations for the wine bottle a lot easier to
derive with only a minimal amount of error.
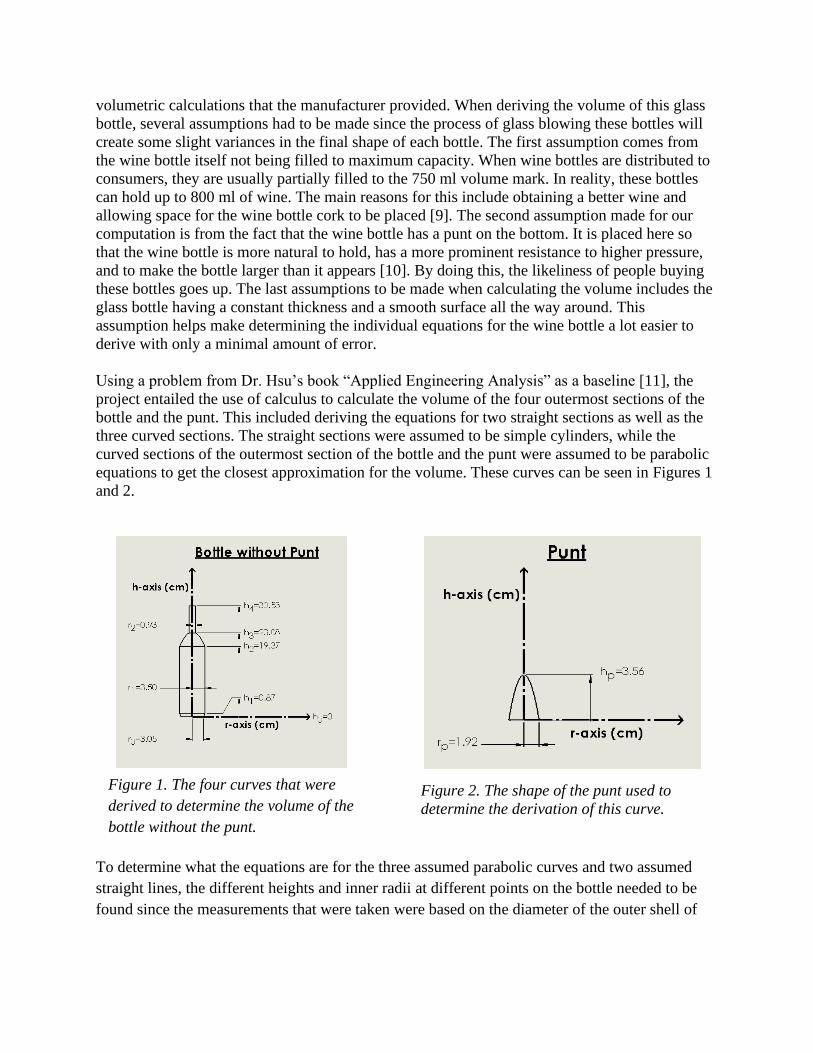
Using a problem from Dr. Hsu’s book “Applied Engineering Analysis” as a baseline [11], the
project entailed the use of calculus to calculate the volume of the four outermost sections of the
bottle and the punt. This included deriving the equations for two straight sections as well as the
three curved sections. The straight sections were assumed to be simple cylinders, while the
curved sections of the outermost section of the bottle and the punt were assumed to be parabolic
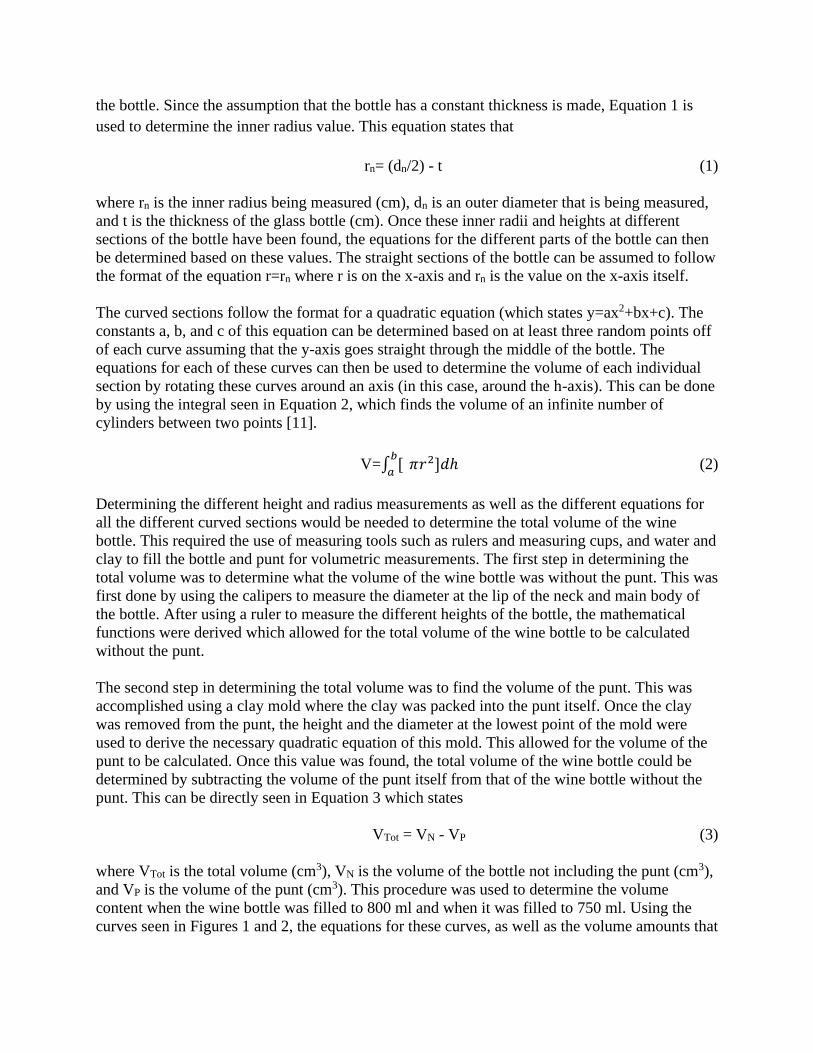
equations to get the closest approximation for the volume. These curves can be seen in Figures 1
and 2.
To determine what the equations are for the three assumed parabolic curves and two assumed
straight lines, the different heights and inner radii at different points on the bottle needed to be
found since the measurements that were taken were based on the diameter of the outer shell of
Figure 1. The four curves that were
derived to determine the volume of the
bottle without the punt.
Figure 2. The shape of the punt used to
determine the derivation of this curve.
the bottle. Since the assumption that the bottle has a constant thickness is made, Equation 1 is
used to determine the inner radius value. This equation states that
rn= (dn/2) - t (1)
where rn is the inner radius being measured (cm), dn is an outer diameter that is being measured,
and t is the thickness of the glass bottle (cm). Once these inner radii and heights at different
sections of the bottle have been found, the equations for the different parts of the bottle can then
be determined based on these values. The straight sections of the bottle can be assumed to follow
the format of the equation r=rn where r is on the x-axis and rn is the value on the x-axis itself.
The curved sections follow the format for a quadratic equation (which states y=ax2+bx+c). The
constants a, b, and c of this equation can be determined based on at least three random points off
of each curve assuming that the y-axis goes straight through the middle of the bottle. The
equations for each of these curves can then be used to determine the volume of each individual
section by rotating these curves around an axis (in this case, around the h-axis). This can be done
by using the integral seen in Equation 2, which finds the volume of an infinite number of
cylinders between two points [11].
V=∫ [𝑏
𝑎 𝜋𝑟2]𝑑ℎ (2)
Determining the different height and radius measurements as well as the different equations for
all the different curved sections would be needed to determine the total volume of the wine
bottle. This required the use of measuring tools such as rulers and measuring cups, and water and
clay to fill the bottle and punt for volumetric measurements. The first step in determining the
total volume was to determine what the volume of the wine bottle was without the punt. This was
first done by using the calipers to measure the diameter at the lip of the neck and main body of
the bottle. After using a ruler to measure the different heights of the bottle, the mathematical
functions were derived which allowed for the total volume of the wine bottle to be calculated
without the punt.
The second step in determining the total volume was to find the volume of the punt. This was
accomplished using a clay mold where the clay was packed into the punt itself. Once the clay
was removed from the punt, the height and the diameter at the lowest point of the mold were
used to derive the necessary quadratic equation of this mold. This allowed for the volume of the
punt to be calculated. Once this value was found, the total volume of the wine bottle could be
determined by subtracting the volume of the punt itself from that of the wine bottle without the
punt. This can be directly seen in Equation 3 which states
VTot = VN - VP (3)
where VTot is the total volume (cm3), VN is the volume of the bottle not including the punt (cm3),
and VP is the volume of the punt (cm3). This procedure was used to determine the volume
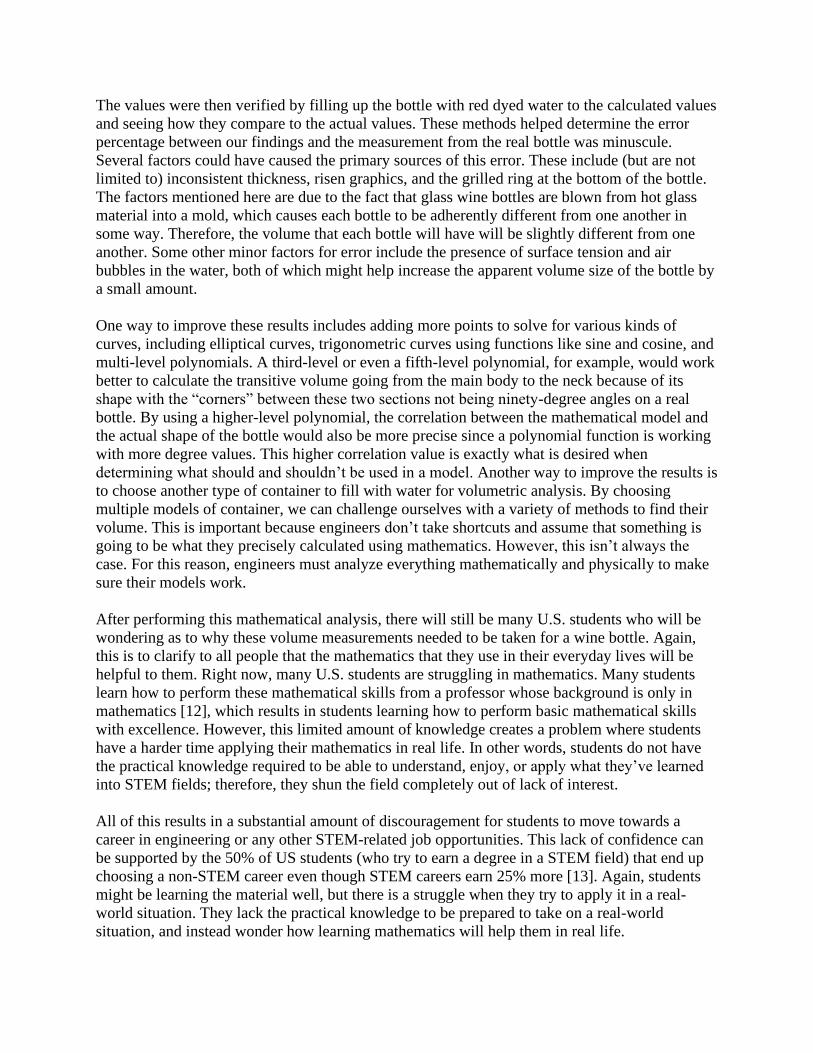
content when the wine bottle was filled to 800 ml and when it was filled to 750 ml. Using the
curves seen in Figures 1 and 2, the equations for these curves, as well as the volume amounts that
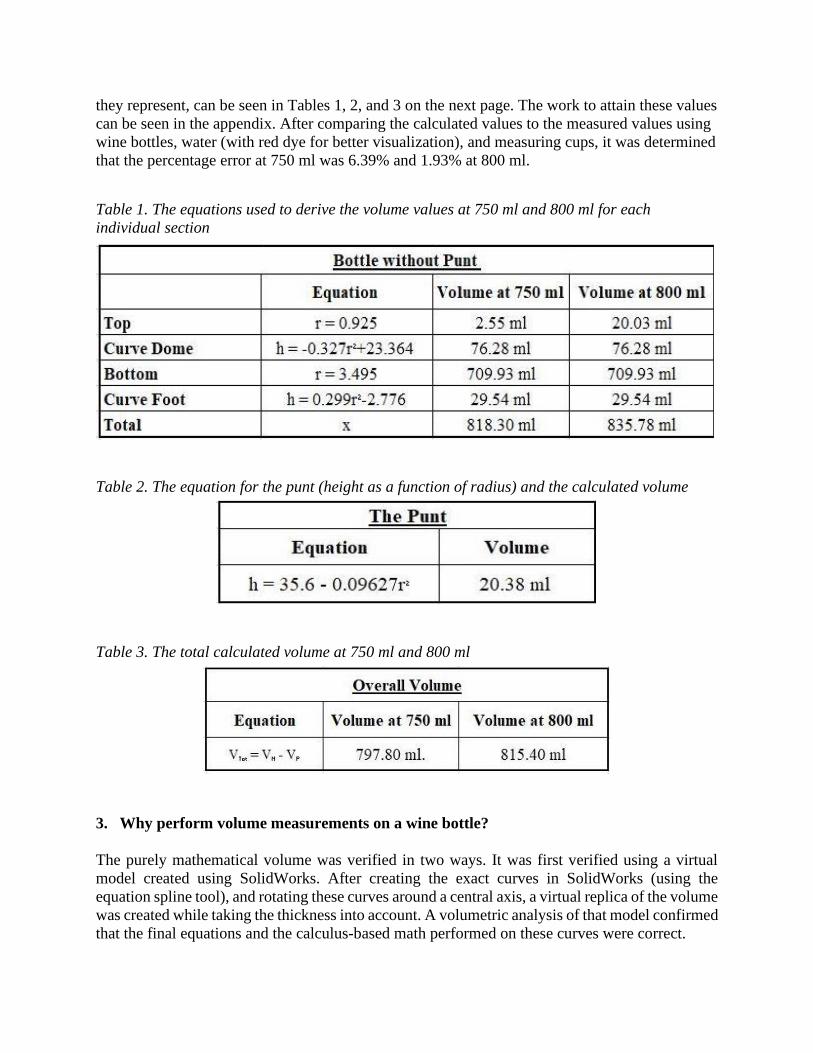
they represent, can be seen in Tables 1, 2, and 3 on the next page. The work to attain these values
can be seen in the appendix. After comparing the calculated values to the measured values using
wine bottles, water (with red dye for better visualization), and measuring cups, it was determined
that the percentage error at 750 ml was 6.39% and 1.93% at 800 ml.
Table 1. The equations used to derive the volume values at 750 ml and 800 ml for each
individual section
Table 2. The equation for the punt (height as a function of radius) and the calculated volume
Table 3. The total calculated volume at 750 ml and 800 ml
3. Why perform volume measurements on a wine bottle?
The purely mathematical volume was verified in two ways. It was first verified using a virtual
model created using SolidWorks. After creating the exact curves in SolidWorks (using the
equation spline tool), and rotating these curves around a central axis, a virtual replica of the volume
was created while taking the thickness into account. A volumetric analysis of that model confirmed
that the final equations and the calculus-based math performed on these curves were correct.
The values were then verified by filling up the bottle with red dyed water to the calculated values
and seeing how they compare to the actual values. These methods helped determine the error
percentage between our findings and the measurement from the real bottle was minuscule.
Several factors could have caused the primary sources of this error. These include (but are not
limited to) inconsistent thickness, risen graphics, and the grilled ring at the bottom of the bottle.
The factors mentioned here are due to the fact that glass wine bottles are blown from hot glass
material into a mold, which causes each bottle to be adherently different from one another in
some way. Therefore, the volume that each bottle will have will be slightly different from one
another. Some other minor factors for error include the presence of surface tension and air
bubbles in the water, both of which might help increase the apparent volume size of the bottle by
a small amount.
One way to improve these results includes adding more points to solve for various kinds of
curves, including elliptical curves, trigonometric curves using functions like sine and cosine, and
multi-level polynomials. A third-level or even a fifth-level polynomial, for example, would work
better to calculate the transitive volume going from the main body to the neck because of its
shape with the “corners” between these two sections not being ninety-degree angles on a real
bottle. By using a higher-level polynomial, the correlation between the mathematical model and
the actual shape of the bottle would also be more precise since a polynomial function is working
with more degree values. This higher correlation value is exactly what is desired when
determining what should and shouldn’t be used in a model. Another way to improve the results is
to choose another type of container to fill with water for volumetric analysis. By choosing
multiple models of container, we can challenge ourselves with a variety of methods to find their
volume. This is important because engineers don’t take shortcuts and assume that something is
going to be what they precisely calculated using mathematics. However, this isn’t always the
case. For this reason, engineers must analyze everything mathematically and physically to make
sure their models work.
After performing this mathematical analysis, there will still be many U.S. students who will be
wondering as to why these volume measurements needed to be taken for a wine bottle. Again,
this is to clarify to all people that the mathematics that they use in their everyday lives will be
helpful to them. Right now, many U.S. students are struggling in mathematics. Many students
learn how to perform these mathematical skills from a professor whose background is only in
mathematics [12], which results in students learning how to perform basic mathematical skills
with excellence. However, this limited amount of knowledge creates a problem where students
have a harder time applying their mathematics in real life. In other words, students do not have
the practical knowledge required to be able to understand, enjoy, or apply what they’ve learned
into STEM fields; therefore, they shun the field completely out of lack of interest.
All of this results in a substantial amount of discouragement for students to move towards a
career in engineering or any other STEM-related job opportunities. This lack of confidence can
be supported by the 50% of US students (who try to earn a degree in a STEM field) that end up
choosing a non-STEM career even though STEM careers earn 25% more [13]. Again, students
might be learning the material well, but there is a struggle when they try to apply it in a real-
world situation. They lack the practical knowledge to be prepared to take on a real-world
situation, and instead wonder how learning mathematics will help them in real life.

To solve this problem, schools across the U.S. need to start implementing STEM programs,
however, one of the difficulties in implementing STEM programs is making the material learned
in the classroom relatable to real-life situations. This can change if the classroom environment is
improved to implement the engineering and mathematical approach in STEM to help solve
global issues. Some of these issues include climate change, energy efficiency, and hazard
mitigation [14]. By taking this approach, it will allow more students to be more aware of what’s
happening around them and to push themselves to fix these problems. It will encourage students
to learn how to create different machines and mechanisms so that they can apply what they
learned in school. However, the reality is that schools have a hard time doing this and stick with
a more mathematical approach without applying it in the real world. This approach
psychologically discourages even more students to be pushed away from STEM-related fields,
especially when more are needed in modern society. It creates a lack of purpose and resolve that
many people today cannot afford to have.
This lack of purpose that students face is the reason why teachers need assistance in creating a
curriculum that both inspires STEM-related activities and the implementation of these activities.
Teachers need to show students that math can be used in a variety of disciplines and in multiple
ways to benefit society. This can be accomplished by assigning students to perform projects
using engineering and mathematical approaches. The projects do not have to be complicated; it
just has to be relatable. It can be something as simple as finding the volume of a wine bottle or
determining how long it will take to fill a bucket with water. If there is no relation between the
student and the project that the student completes, the students will not be motivated to move
toward a STEM-based career.
The project that a student chooses is also highly dependent on a student’s grade level. There are
already small lessons in Kindergarten classes that involve showing students the most basic
perspectives on science such as how gases are created by chemical reactions, which can be
demonstrated by a balloon inflating due to the expansion of said gases. What if that example
could be expanded to include mechanical applications such as how expanding gases move simple
machines like pistons on flywheels? For students in elementary school, they could do a poster
presentation that incorporates the basic mathematical concepts that they are learning and how
they are used. This might require a quick jump into algebra merely for the sake of timing how
fast something goes when pulled by gravity. Doing so would make the concepts easier to
understand as they advance in school, especially when they hit the middle school level. Here
they can create a situational analysis project that applies to both the basic mathematical concepts
that they learned in elementary school as well as the algebraic concepts that they continue to
learn. When they hit high school, they can start to perform more advanced analysis projects (and
maybe even some engineering-based projects) that incorporates what they learned in their
multiple mathematics courses. Some of these courses include geometry, statistics, and even
calculus. Examples of such projects might include a structural analysis problem in a geometry
class, weather analysis in statistics, and analysis of force in calculus. This will prepare more
students for what they will face both in college and in the real world. By taking a more project-
based approach towards math courses early on, students will know that the mathematics they
learn can and will be useful in a variety of STEM-related fields.

4. Other Applications for Mathematics in Engineering and Science
The information learned in a STEM education curriculum, such as determining the volume of a
curve, can be used in a variety of applications. Some examples of STEM applications include the
volume determination of a flask or for a medical IV bottle used in a hospital. However, just like
when the volume of a wine bottle was determined, specific assumptions for each case will have
to be made. Each case will have different assumptions that will need to be made depending on
the external conditions. Also, making more assumptions about a problem will most likely cause
the error value for the result to be higher than attended. Insufficient data will also do this.
Whenever using mathematics to solve a problem such as the volume determination of a wine
bottle, be sure that there are a reasonable number of assumptions, as well as enough data, to
make the solution accurate and easy to derive.
There are plenty of other applications that mathematics can be used for aside from finding the
volume of an object. One place they can be used for is aircraft manufacturing. Here, statistics can
be used to determine if a specific part is held up to standards using control charts. Calculus can
also be used to determine the magnitude and direction of velocity or acceleration that a jet might
face under certain conditions or to determine the amount of power that a jet might need to
produce. It can also be used to determine the natural frequencies in which a plane’s wing will
vibrate. These types of examples should be explained to students so that they understand how
engineers use the mathematics they learned from going to school and participating in STEM-
related activities.
First-order differential equations can be used in a variety of ways when performing heat
exchange and fluid analysis. When observing these types of analyses, the three fundamental laws
of physics need to be taken into consideration [11]. These include the laws of conservation of
mass, energy, and momentum [11]. Using these laws, along with the principles of first-order
differential calculus, allows for the first law of thermodynamics as well as many other
relationships to be derived. These relationships include Fourier’s Law of Heat Conduction,
Newton’s Law of Cooling, and Bernoulli’s Law. Though other factors play a role in the
development of these laws, all the laws used in heat exchange and fluid flow analysis are derived
from basic mathematical principles that can be learned in high school.
While weather conditions are observed through computer systems, people had to develop the
mathematical formulas that are used to show the weather and its everlasting effects. The use of
computers for weather forecasting did not start until the 1980s, and it was not until after the end
of WWII that numerical weather prediction was developed [15]. Today, meteorologists continue
to contribute to the analysis by using functions that calculate and include wind pressure, wind
velocity, temperature, and humidity [16].
Earthquakes can be either minor or major, and their effects can be destructive to our homes. This
is why analysts are needed to help predict their effects. In a given location, it would be essential
to find out where the epicenter of an earthquake is so that people could use it in a function of
intensity where it is most active [17]. This location would help to determine what kind of
damages could occur in areas where people live, assuming they live close enough to feel the
effects.
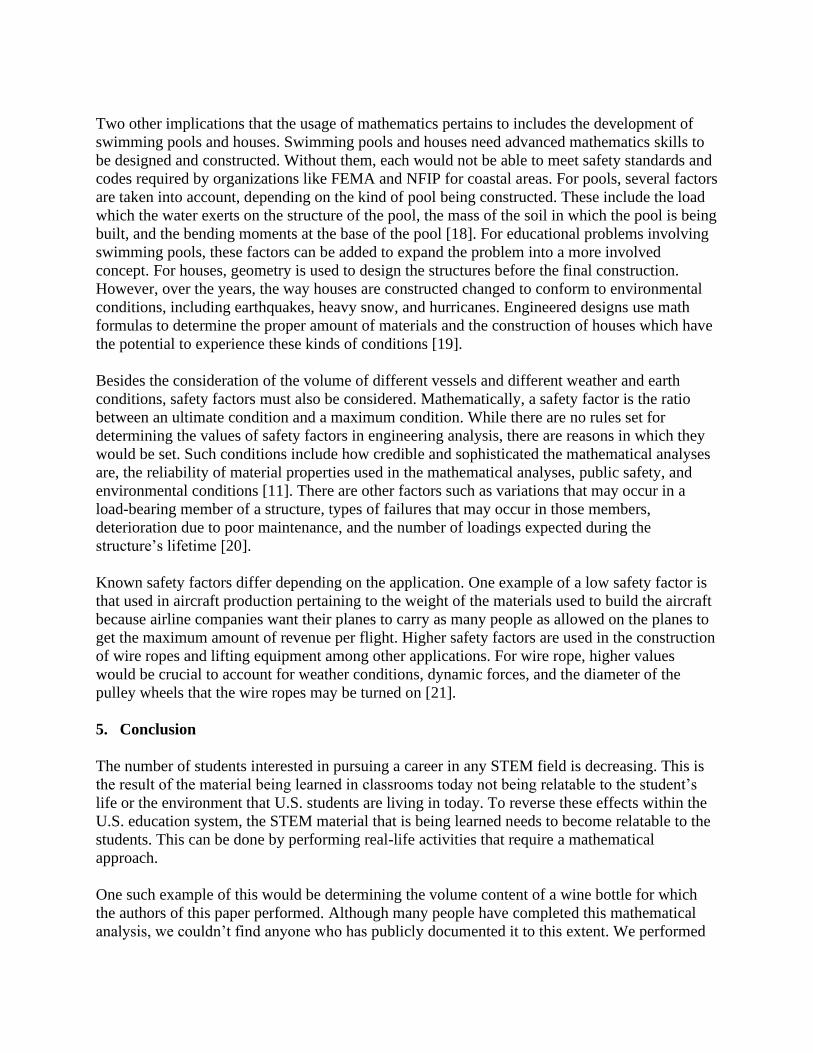
Two other implications that the usage of mathematics pertains to includes the development of
swimming pools and houses. Swimming pools and houses need advanced mathematics skills to
be designed and constructed. Without them, each would not be able to meet safety standards and
codes required by organizations like FEMA and NFIP for coastal areas. For pools, several factors
are taken into account, depending on the kind of pool being constructed. These include the load
which the water exerts on the structure of the pool, the mass of the soil in which the pool is being
built, and the bending moments at the base of the pool [18]. For educational problems involving
swimming pools, these factors can be added to expand the problem into a more involved
concept. For houses, geometry is used to design the structures before the final construction.
However, over the years, the way houses are constructed changed to conform to environmental
conditions, including earthquakes, heavy snow, and hurricanes. Engineered designs use math
formulas to determine the proper amount of materials and the construction of houses which have
the potential to experience these kinds of conditions [19].
Besides the consideration of the volume of different vessels and different weather and earth
conditions, safety factors must also be considered. Mathematically, a safety factor is the ratio
between an ultimate condition and a maximum condition. While there are no rules set for
determining the values of safety factors in engineering analysis, there are reasons in which they
would be set. Such conditions include how credible and sophisticated the mathematical analyses
are, the reliability of material properties used in the mathematical analyses, public safety, and
environmental conditions [11]. There are other factors such as variations that may occur in a
load-bearing member of a structure, types of failures that may occur in those members,
deterioration due to poor maintenance, and the number of loadings expected during the
structure’s lifetime [20].
Known safety factors differ depending on the application. One example of a low safety factor is
that used in aircraft production pertaining to the weight of the materials used to build the aircraft
because airline companies want their planes to carry as many people as allowed on the planes to
get the maximum amount of revenue per flight. Higher safety factors are used in the construction
of wire ropes and lifting equipment among other applications. For wire rope, higher values
would be crucial to account for weather conditions, dynamic forces, and the diameter of the
pulley wheels that the wire ropes may be turned on [21].
5. Conclusion
The number of students interested in pursuing a career in any STEM field is decreasing. This is
the result of the material being learned in classrooms today not being relatable to the student’s
life or the environment that U.S. students are living in today. To reverse these effects within the
U.S. education system, the STEM material that is being learned needs to become relatable to the
students. This can be done by performing real-life activities that require a mathematical
approach.
One such example of this would be determining the volume content of a wine bottle for which
the authors of this paper performed. Although many people have completed this mathematical
analysis, we couldn’t find anyone who has publicly documented it to this extent. We performed
two basic steps in this analysis. These steps include deriving the quadratic and linear equations,
and then using these equations to determine the volume of the wine bottle with calculus. This
alone has a variety of applications in the field. Some of these activities include the volume
determination of a flask or of an IV bottle used in a hospital. Other such activities where
mathematics can be used in the real world include aircraft manufacturing, heat exchange, and
fluid flow (where safety factor needs to be considered) as well as weather analysis, earthquake
analysis, and home construction.
If the U.S. is to maintain or improve its standing in STEM education and careers, it needs to
increase the general interest in its subjects. Students of all levels need to be introduced to the
many opportunities that STEM careers provide and how they benefit the world. This can only
happen if we can make the materials they learn in their mathematics and science classes more
relatable to their everyday lives. By doing so, the U.S. can greatly improve the level of
participation in STEM fields.
References
[1] J. Hallinen, “STEM Education Curriculum,” Encyclopædia Britannica, 28-Jun-2019.
[Online]. Available: https://www.britannica.com/topic/STEM-education.
[2] E. Chute, “STEM education is branching out,” Pittsburgh Post-Gazette, 09-Feb-2009.
[Online]. Available: https://www.post-gazette.com/news/education/2009/02/10/STEM-
education-is-branching-out/stories/200902100165.
[3] A. Herman, “America's STEM Crisis Threatens Our National Security,” American Affairs
Journal, 20-Feb-2019. [Online]. Available:
https://americanaffairsjournal.org/2019/02/americas-stem-crisis-threatens-our-national-
security/.
[4] V. Strauss, “Why U.S. can't get back to head of the class (because it was never there),”
The Washington Post, 02-Jul-2012. [Online]. Available:
https://www.washingtonpost.com/blogs/answer-sheet/post/why-us-cant-get-back-to-head-
of-the-class-because-it-was-never-there/2012/07/01/gJQAwpgAHW_blog.html.
[5] B. Kennedy, M. Hefferon, and C. Funk, “Students don't pursue STEM because it's too
hard, say 52% of Americans,” Pew Research Center, 17-Jan-2018. [Online]. Available:
https://www.pewresearch.org/fact-tank/2018/01/17/half-of-americans-think-young-
people-dont-pursue-stem-because-it-is-too-hard/.
[6] A. Marotti, “Teenagers may be losing interest in STEM careers, but they know they need
tech skills to land a job,” chicagotribune.com, 13-Dec-2018. [Online]. Available:
https://www.chicagotribune.com/business/ct-biz-teen-girls-stem-career-ambitions-
20180606-story.html.F
[7] G. H. Hanson and M. J. Slaughter, “High-Skilled Immigration and the Rise of STEM
Occupations in U.S. Employment,” National Bureau of Economic Research, pp. 1–33,
Sep. 2016.
[8] A. Zlatovic, “The Importance of STEM Education,” Nobel Explorers, 20-Dec-2018.
[Online]. Available: https://nobelexplorers.com/the-importance-of-stem-education/.
[9] “Types of Wine Glasses,” Winc, 07-Jun-2019. [Online]. Available:
https://www.winc.com/blog/types-of-wine-glasses.
[10] A. Kellerman, “10 Explanations Why Wine Bottles Have Punts In The Bottom,”
VinePair, 16-Apr-2016. [Online]. Available: https://vinepair.com/wine-blog/why-wine-
bottles-have-punts-bottom/.
[11] T.-R. Hsu, Applied engineering analysis, 1st ed. Hoboken, NJ: Wiley, 2018.
[12] T.-R. Hsu, “Mathematics for Engineering Education,” in IEEE Conference, San Jose.
[13] “STEM- the What, the Why, and the How,” Medium, 16-Jul-2019. [Online]. Available:
https://medium.com/@thestempedia/stem-the-what-the-why-and-the-how-7d03a853a364.
[14] R. W. Bybee, STEM Education Challenges and Opportunities. Arlington, VA: National
Science Teachers Association, 2013.
[15] NOAA Headquarters, “The mathematics of weather prediction,” Phys.org, 13-May-2016.
[Online]. Available: https://phys.org/news/2016-05-mathematics-weather.html.
[16] S. Taranovich, “The math of meteorology - Steve Taranovich,” EDN, 09-Feb-2013.
[Online]. Available: https://www.edn.com/the-math-of-meteorology/.
[17] J. D. Urrutia, L. A. Bautista, and E. B. Baccay, “Mathematical models for estimating
earthquake casualties and damage cost through regression analysis using matrices,”
Journal of Physics: Conference Series, pp. 1–13, Apr. 2014.
[18] S. Nnaji, N. Yazdani, and M. Rambo-Rodenberry, “Scour Impact of Coastal Swimming
Pools on Beach Systems,” Journal of Coastal Research, pp. 1–12, 1996.
[19] N. Gromicko and B. Gromicko, “Structural Design Basics of Residential Construction for
the Home Inspector,” InterNACHI. [Online]. Available: https://www.nachi.org/structural-
design-basics-residential-construction.htm.
[20] F. P. Beer, E. R. Johnston, J. T. DeWolf, and D. F. Mazurek, Mechanics of Materials, 8th
ed. New York, NY: McGraw-Hill Education, 2020.
[21] “Appendix D-Wire Rope,” Reclamation Safety and Health Standards, pp. 1–13, Oct.
2009.
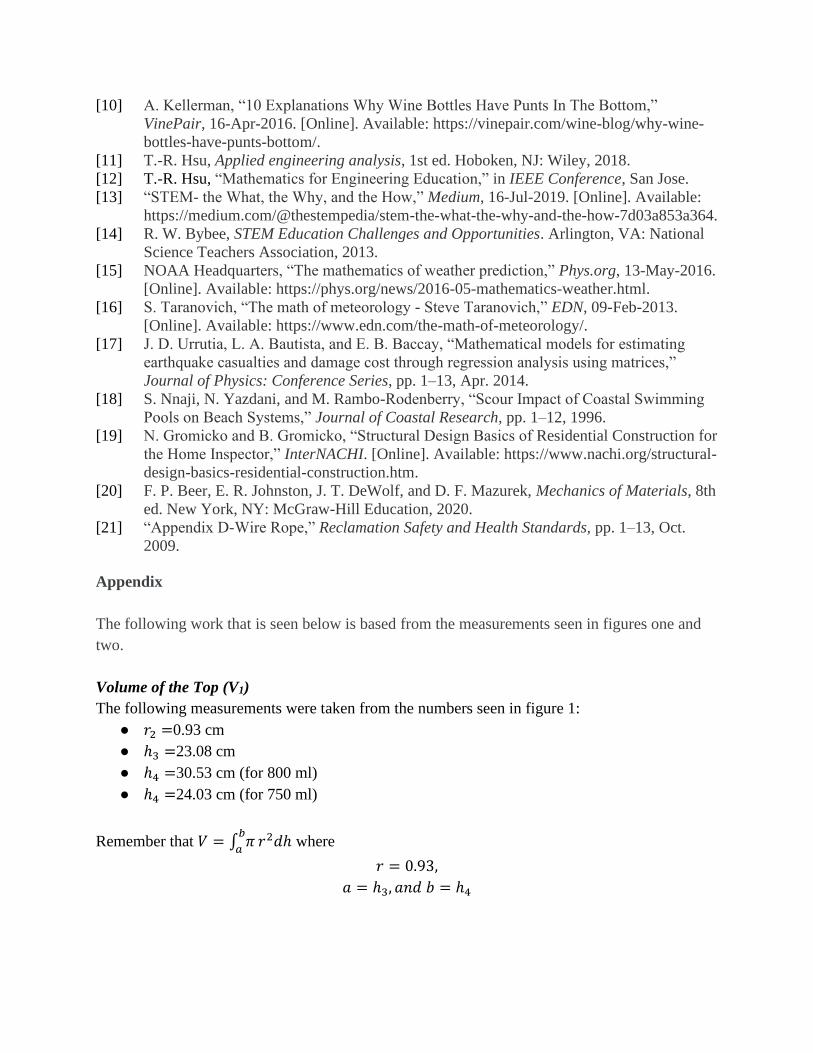
Appendix
The following work that is seen below is based from the measurements seen in figures one and
two.
Volume of the Top (V1)
The following measurements were taken from the numbers seen in figure 1:
● 𝑟2 =0.93 cm
● ℎ3 =23.08 cm
● ℎ4 =30.53 cm (for 800 ml)
● ℎ4 =24.03 cm (for 750 ml)
Remember that 𝑉 = ∫ 𝜋𝑏
𝑎𝑟2𝑑ℎ where
𝑟 = 0.93,
𝑎 = ℎ3, 𝑎𝑛𝑑 𝑏 = ℎ4

After deriving the equation for this curve, the volume was determined to be the following if the
bottle was completely filled to 800 ml:
𝑉1 = ∫ 𝜋30.53
23.08𝑟2𝑑ℎ = ∫ 𝜋
30.53
23.08(0.93)2𝑑ℎ →
𝑉1 = 𝜋[0.865ℎ]23.0830.53 = 9.403𝜋 = 0.865𝜋(30.53 − 23.08)
𝑉1 = 20.03 𝑐𝑚3 = 20.03 𝑚𝑙
The volume was determined to be the following if the bottle was filled to the 750 ml:
𝑉1 = ∫ 𝜋24.03
23.08𝑟2𝑑ℎ = ∫ 𝜋
24.03
23.08(0.93)2𝑑ℎ →
𝑉1 = 𝜋[0.865ℎ]23.0824.03 = 9.403𝜋 = 0.865𝜋(24.03 − 23.08)
𝑉1 = 2.55 𝑐𝑚3 = 2.55 𝑚𝑙
Volume of the Curve Dome (V2)
The following measurements were once again taken from the numbers seen in figure 1:
● 𝑟1 =3.50 cm
● 𝑟2 =0.93 cm
● ℎ2 =19.37 cm
● ℎ3 =23.08 cm
Remember that 𝑉 = ∫ 𝜋𝑏
𝑎𝑟2𝑑ℎ where
ℎ = −0.327𝑟2 + 23.364→ 𝑟2 = 71.45 − 3.058ℎ,
𝑎 = ℎ2, 𝑎𝑛𝑑 𝑏 = ℎ3
This equation was derived using three points, which included (-3.495, 19.37), (3.495, 19.37), and
(-0.925, 23.084), and the following mathematical operations based off of the basic relationship
for a quadratic equation (𝑦 = 𝑎𝑥2 + 𝑏𝑥 + 𝑐):
19.37 = 12.215𝑎 − 3.495𝑏 + 𝑐 (4)
19.37 = 12.215𝑎 + 3.048𝑏 + 𝑐 (5)
23.084 = 0.856𝑎 + 0.925𝑏 + 𝑐 (6)
Subtracting equation 3 from equation 1, we get
−11.36𝑎 = 3.71 → 𝑎 = −0.327
Subtracting equation 2 from equation 1, we get
6.996𝑏 = 0 → 𝑏 = 0

Knowing what the values for a and b are allows for the calculation of c to take place by plugging
a=0.299 and b=0 in either equation 1, equation 2, or equation 3. By plugging these values into
equation 3, c turns out to be the following:
23.084 = 0.856𝑎 + 0.925𝑏 + 𝑐 → 23.084 = 0.856(0.299) + 0.925(0) + 𝑐→
𝑐 = 23.364
After deriving the equation for this curve, the volume was determined to be the following:
𝑉2 = ∫ 𝜋23.08
19.37𝑟2𝑑ℎ = ∫ 𝜋
23.08
19.37(71.45 − 3.058ℎ)𝑑ℎ →
𝑉2 = 𝜋[71.45ℎ − 1.529ℎ2]19.3723.08 = 24.28𝜋→
𝑉2 = 76.28 𝑐𝑚3 = 76.28 𝑚𝑙
Volume of the Bottom (V3)
Again, the following measurements were taken from the numbers seen in figure 1:
● 𝑟1 =3.50 cm
● ℎ1 =0.874 cm
● ℎ2 =19.37 cm
Remember that 𝑉 = ∫ 𝜋𝑏
𝑎𝑟2𝑑ℎ where
𝑟 = 3.50,
𝑎 = ℎ1, 𝑎𝑛𝑑𝑏 = ℎ2
After deriving the equation for this curve, the volume was determined to be the following:
𝑉3 = ∫ 𝜋19.37
0.87𝑟2𝑑ℎ = ∫ 𝜋
19.37
0.87(3.50)2𝑑ℎ →
𝑉3 = 𝜋[12.22ℎ]0.8719.37 = 9.403𝜋 = 12.22𝜋(19.37 − 0.87)
𝑉3 = 709.49 𝑐𝑚3 = 709.49 𝑚𝑙
Volume of the Curve Foot (V4)
The following measurements were once again taken from the numbers seen in figure 1:
● 𝑟0 =3.05 cm
● 𝑟1 =3.50 cm
● ℎ0 =0 cm
● ℎ1 =0.87 cm
Remember that 𝑉 = ∫ 𝜋𝑏
𝑎𝑟2𝑑ℎ where
ℎ = 0.299𝑟2 − 2.766→ 𝑟2 = 3.34ℎ + 9.30,
𝑎 = ℎ0, 𝑎𝑛𝑑 𝑏 = ℎ1

This equation was derived using three points, which included (3.048, 0), (-3.048,0), and (3.495,
0.874), and the following mathematical operations based off of the basic relationship for a
quadratic equation (𝑦 = 𝑎𝑥2 + 𝑏𝑥 + 𝑐):
0 = 9.29𝑎 + 3.048𝑏 + 𝑐 (7)
0 = 9.29𝑎 − 3.048𝑏 + 𝑐 (8)
0.874 = 12.215𝑎 + 3.495𝑏 + 𝑐 (9)
Subtracting equation 3 from equation 1, we get
2.925𝑎 = 0.874 → 𝑎 = 0.299
Subtracting equation 2 from equation 1, we get
6.096𝑏 = 0 → 𝑏 = 0
Knowing what the values for a and b are allows for the calculation of c to take place by plugging
a=0.299 and b=0 in either equation 1, equation 2, or equation 3. By plugging these values into
equation 3, c turns out to be the following:
0.874 = 12.215𝑎 + 3.495𝑏 + 𝑐 → 0.874 = 12.215(0.299) + 3.495(0) + 𝑐→
𝑐 = −2.776
After deriving the equation for this curve, the volume was determined to be the following:
𝑉4 = ∫ 𝜋𝑟20.87
0𝑑ℎ = ∫ 𝜋
0.87
0(3.34ℎ + 9.30)𝑑ℎ →
𝑉4 = 𝜋[1.67ℎ2 + 9.30ℎ]00.87 = 9.403𝜋→
𝑉4 = 29.54 𝑐𝑚3 = 29.54 𝑚𝑙
Volume of the Punt (VP)
Basing the numbers seen in figure 2, the following measurements were taken:
● ℎ𝑝 = 3.56 𝑐𝑚 = 35.6 𝑚𝑚
● 𝑟𝑝 = 1.92 𝑐𝑚 = 19.23 𝑚𝑚
Remember that 𝑉 = ∫ 𝜋𝑏
𝑎𝑟2𝑑ℎ where
ℎ = 35.6 − .09627𝑟2 → 𝑟2 =35.6−ℎ
.09627,
a=0, and b=ℎ𝑝.
This equation was derived from three points to get
0 = 35.6𝑚𝑚 − 𝐴𝑟2→35.6𝑚𝑚 = 𝐴𝑟2→ 𝐴 =35.6𝑚𝑚
(19.23𝑚𝑚)2 = .09627/𝑚𝑚

Once the equation was derived for the curve, the volume was determined to be
𝑉𝑃 = 𝜋 ∫35.6 − ℎ
. 09627
35.6
0
𝑑ℎ = 20678.95𝑚𝑚3 = 20.67895𝑐𝑚3
𝑉𝑃 = 20.68 𝑐𝑚3 = 20.68 𝑚𝑙
Total Volume
This was the main equation that was used to determine the total volume of the wine bottle
including the punt:
𝑉𝑇𝑜𝑡 =(𝑉1 + 𝑉2 + 𝑉3 + 𝑉4) − 𝑉𝑃
When the wine bottle was filled completely at 800 ml, the volume came out to be
𝑉𝑇𝑜𝑡 =(20.03 𝑚𝑙 + 76.28 𝑚𝑙 + 709.49 𝑚𝑙 + 29.54 𝑚𝑙) − 20.68 𝑚𝑙
𝑉𝑇 =815.40 ml
When the wine bottle was filled completely at 800 ml, the volume came out to be
𝑉𝑇𝑜𝑡 =(2.55 𝑚𝑙 + 76.28 𝑚𝑙 + 709.49 𝑚𝑙 + 29.54 𝑚𝑙) − 20.68 𝑚𝑙
𝑉𝑇 =797.80 ml