Improving Security for SCADA Sensor Networks with Reputation Systems and Self-Organizing Maps
18
Sensors 2009, 9, 9380-9397; doi:10.3390/s91109380 OPEN ACCESS sensors ISSN 1424-8220 www.mdpi.com/journal/sensors Article Improving Security for SCADA Sensor Networks with Reputation Systems and Self-Organizing Maps Jos´ e M. Moya ? , ´ Alvaro Araujo, Zorana Bankovi´ c, Juan-Mariano de Goyeneche, Juan Carlos Vallejo, Pedro Malag´ on, Daniel Villanueva, David Fraga, Elena Romero and Javier Blesa Department Ingenier´ ıa Electr ´ onica, ETSI Telecomunicaci´ on, Universidad Polit´ ecnica de Madrid, Av. Complutense, 30, 28040 Madrid, Spain; E-Mails: [email protected] (A.A.); [email protected] (Z.B.); [email protected] (J.M.G.); [email protected] (J.C.V.); [email protected] (P.M.); [email protected] (D.V.); [email protected] (D.F.); [email protected] (E.R.); [email protected] (J.B.) ? Author to whom correspondence should be addressed; E-Mail: [email protected]; Tel.: +34-915-495-700, ext 4224; Fax: +34-913-367-323. Received: 9 October 2009; in revised form: 30 October / Accepted: 4 November 2009 / Published: 20 November 2009 Abstract: The reliable operation of modern infrastructures depends on computerized systems and Supervisory Control and Data Acquisition (SCADA) systems, which are also based on the data obtained from sensor networks. The inherent limitations of the sensor devices make them extremely vulnerable to cyberwarfare/cyberterrorism attacks. In this paper, we propose a reputation system enhanced with distributed agents, based on unsupervised learning algorithms (self-organizing maps), in order to achieve fault tolerance and enhanced resistance to previously unknown attacks. This approach has been extensively simulated and compared with previous proposals. Keywords: SCADA control system; cyber security; critical infrastructure; reputation system; countermeasure; security framework 1. Introduction Security concerns are key issues when developing applications based on sensor networks to monitor and control critical infrastructures, such as water treatment and distribution, oil and gas pipelines,
Transcript of Improving Security for SCADA Sensor Networks with Reputation Systems and Self-Organizing Maps
Sensors 2009, 9, 9380-9397; doi:10.3390/s91109380
OPEN ACCESS
sensorsISSN 1424-8220
www.mdpi.com/journal/sensors
Article
Improving Security for SCADA Sensor Networks withReputation Systems and Self-Organizing MapsJose M. Moya ?, Alvaro Araujo, Zorana Bankovic, Juan-Mariano de Goyeneche, Juan CarlosVallejo, Pedro Malagon, Daniel Villanueva, David Fraga, Elena Romero and Javier Blesa
Department Ingenierıa Electronica, ETSI Telecomunicacion, Universidad Politecnica de Madrid,Av. Complutense, 30, 28040 Madrid, Spain; E-Mails: [email protected] (A.A.); [email protected](Z.B.); [email protected] (J.M.G.); [email protected] (J.C.V.); [email protected] (P.M.);[email protected] (D.V.); [email protected] (D.F.); [email protected] (E.R.);[email protected] (J.B.)
? Author to whom correspondence should be addressed; E-Mail: [email protected];Tel.: +34-915-495-700, ext 4224; Fax: +34-913-367-323.
Received: 9 October 2009; in revised form: 30 October / Accepted: 4 November 2009 /Published: 20 November 2009
Abstract: The reliable operation of modern infrastructures depends on computerized systemsand Supervisory Control and Data Acquisition (SCADA) systems, which are also basedon the data obtained from sensor networks. The inherent limitations of the sensor devicesmake them extremely vulnerable to cyberwarfare/cyberterrorism attacks. In this paper, wepropose a reputation system enhanced with distributed agents, based on unsupervised learningalgorithms (self-organizing maps), in order to achieve fault tolerance and enhanced resistanceto previously unknown attacks. This approach has been extensively simulated and comparedwith previous proposals.
Keywords: SCADA control system; cyber security; critical infrastructure; reputation system;countermeasure; security framework
1. Introduction
Security concerns are key issues when developing applications based on sensor networks to monitorand control critical infrastructures, such as water treatment and distribution, oil and gas pipelines,

Sensors 2009, 9 9381
electrical power transmission and distribution, or large communication systems. The use of currentSCADA (Supervisory Control And Data Acquisition) systems has already come into question as theyare increasingly seen as extremely vulnerable to cyberwarfare/cyberterrorism attacks [1, 2].
In particular, security researchers are concerned about: (1) the lack of concern about security andauthentication in the design, deployment and operation of existing SCADA networks; (2) the mistakenbelief that SCADA systems have the benefit of security through obscurity through the use of specializedprotocols and proprietary interfaces; (3) the mistaken belief that SCADA networks are secure becausethey are purportedly physically secured; and (4) the mistaken belief that SCADA networks are securebecause they are supposedly disconnected from the Internet.
The security of these SCADA systems is important because compromise or destruction of thesesystems would impact multiple areas of society. For example, a blackout caused by a compromisedelectrical SCADA system would cause financial losses to all the customers that received electricity fromthat source.
There are two distinct threats to a modern SCADA system. The first is the threat of unauthorizedaccess to the control software, be it human access or changes induced intentionally or accidentally byvirus infections and other software threats residing on the control host machine. The second is the threatof packet access to the network segments hosting SCADA devices. In many cases, there is rudimentaryor no security on the actual packet control protocol, so anyone who can send packets to the SCADAdevice can control it. In many cases SCADA users assume that a VPN is of sufficient protection and areunaware that physical access to SCADA-related network jacks and switches provides the ability to totallybypass all security on the control software and fully control those SCADA networks. These kinds ofphysical access attacks bypass firewall and VPN security and are best addressed by endpoint-to-endpointauthentication and authorization commonly provided in the non-SCADA world by in-device SSL or othercryptographic techniques. But encryption is not enough for sensor devices because resource restrictionswould prevent strong encryption schemes, and low-cost side-channel attacks [3] would still easily revealthe private keys.
The increased interest in SCADA vulnerabilities has resulted in vulnerability researchers discoveringvulnerabilities in commercial SCADA software and more general offensive SCADA techniquespresented to the general security community [4, 5]. In electric and gas utility SCADA systems, thevulnerability of the large installed base of wired and wireless serial communications links is addressed insome cases by applying bump-in-the-wire devices that employ authentication and Advanced EncryptionStandard encryption rather than replacing all existing nodes.
But most of the risks come from the limitations of the sensor nodes: (1) many nodes in the networkhave very limited resources; (2) pervasiveness implies that some nodes will be in non-controlled areasand are accessible to potential intruders; (3) all these sensor nodes and controlling computers are globallyinterconnected, allowing attacks to be propagated step by step from the more resource-constraineddevices to the more secure servers with lots of private data.
Ciphers and countermeasures often imply a need for more resources (more computation requirements,more power consumption, specific integrated circuits with careful physical design, etc.), but usually thisis not affordable for this kind of applications. Even if we impose strong requirements for any individualnode to be connected to our network, it is virtually impossible to update hardware and software whenever
Sensors 2009, 9 9382
a security flaw is found. The need to consider security as a new dimension during the whole designprocess of embedded systems has already been stressed [3, 6], and there have been some initial effortstowards design methodologies to support security [7–9], but to the best of our knowledge no attempt hasbeen made to exploit the special characteristics of sensor networks.
Applications built on sensor networks—SCADA systems being no exception—have to live with thefact that privacy and integrity cannot be preserved in every node of the network. This poses restrictionson the information a single node can manage, and also in the way the applications are designed anddistributed in the network.
Of course, the inherent insecurity of embedded systems should not prevent us from striving to avoidcompromises. We should guarantee that a massive attack can not be fast enough to escape the detection,isolation, and recovery measures. Therefore we should design the nodes as secure as the availableresources would allow.
In spite of the disadvantages of sensor networks from the security point of view, they provide oneimportant advantage for fighting against attacks: redundancy. A sensor network usually has a highdegree of spatial redundancy (many sensors that should provide coherent data), and temporal redundancy(habits, periodic behaviors, causal dependencies), and both can be used to detect and isolate faulty orcompromised nodes in a very effective manner.
In previous work [10], we proposed the use of reputation systems and non-deterministic routing tosecure applications based on wireless sensor networks. In this article, focused on sensor networks forSCADA systems, we propose the use of reputation systems enhanced with distributed agents based onunsupervised learning algorithms (specifically, self-organizing maps) in order to achieve more resistanceto previously unknown attacks. Separate detectors are further organized in a distributed system using theidea of immune system organization.
In Section 2. we review some of the most relevant previous approaches. Section 3. describes ourapproach in detail. In Section 4., some experimental data and algorithms description is shown anddiscussed. Finally, in section 5., we draw some conclusions.
2. Related Work
The problem of security in sensor networks has been widely dealt with by researchers. The classicapproach to security in these networks consists in adding an authentication system and encrypting thecommunications. However, in our opinion this approach cannot be considered secure. Almost everynode in sensor networks has very limited resource, so the authentication or encryption algorithms that ituses cannot be complex. Another issue to consider is that updating these algorithms is very difficult incase security failures arise. Finally, nodes in these networks are usually within reach of the attacker, soa large number of side channel attacks can be carried out [3, 11] to obtain security keys.
Different techniques propose secure routing protocols [12, 13] or focus on the routing protocol.Buttyan and Hubaux [14, 15] proposed an architecture to stimulate a correct routing behavior. In theirsolution, nodes receive a per-hop payment in every packet they forward. Nodes store this paymentinformation in an internal counter. As elements get benefits from routing, they understand cooperationas a benefit not only for the entire network, but also for individual nodes. This approach, however,maintains this cooperation information locally, only shared by nodes that interact directly. In our

Sensors 2009, 9 9383
approach, on the contrary, reputation information is transmitted all over the network, so all nodes arewarned about misbehaving nodes. Marti et al. [16] proposed mitigating routing misbehavior by detectingnon-forwarding nodes and rating every path so those nodes are avoided when the routes are recalculated.The resulting behavior is that non-routing nodes are not included in routing paths (as they are not goingto cooperate) but they still can ask others to forward their messages. According to Dawkins [17], thisscheme detects the misbehavior but it does not isolate it. In our system, bad-behaving or attacker nodesare properly isolated by rating their reputation as low.
Recently various solutions for intrusion detection for sensor networks have been proposed. Theexisting IDSs for general computer or Ad Hoc networks could not have been deployed for sensornetworks’ security since these solutions do not assume limited resources of computational units. Thus,additional efforts have to be dedicated to designing special IDSs compatible with the sensor networklimitations. Some of the solutions that propose general IDS schemes are given in [18, 19]. However,to the best of our knowledge, all existing solutions are only capable of detecting known attacks or theirvariations. In order to detect new attacks, they need to be adjusted by human.
Various solutions that deploy machine learning techniques appeared recently [20, 21]. These solutionssupport the idea that machine learning techniques offer higher level of flexibility and adaptability.However, these techniques consume significant resources. To the best of our knowledge, nobody hasproposed any solution for this issue. Moreover, the feature sets they deploy mostly include those featureswhose values are known to change under the influence of an attacker, or are known to be weak spots.This is their major deficiency, as relying on these features only the known attacks or their variations canbe detected.
There are more complex approaches that provide solutions for the different levels of the problem. TheCONFIDANT approach, proposed by Buchegger and Le Boudec [22] is a good effort that solves mostof the problems mentioned in this section. CONFIDANT is a protocol that sits over the chosen routingprotocol and makes misbehavior less attractive for the nodes than proper routing: nodes watch theirneighbors for bad behavior, take into account this behavior in a local reputation system and eventuallyinform their trusted neighbors on misbehaving nodes. Our approach is in some aspects similar toCONFIDANT. For example, it has a reputation system too, but it is not local, but global.
Intuitively, a node i should give more weight to the direct observations made by itself than to theevidence obtained from other nodes. Furthermore, the evidence from different nodes should be weightedon the basis of their respective reputations. The beta reputation system [23] and recent implementationsfor Mica2 motes [24] are based on these observations to provide resistance against badmouthingattacks. A different scheme is proposed in [25], based on the separation between action trust andrecommendation trust.
Either because they hold encryption keys or for other reasons, many approaches demand that the nodesbe tamper-proof secure [26]. But this need is more difficult to fulfill with every passing day [27–29].CONFIDANT’s authors reason out that their protocol does not need tamper-proof hardware becauseother nodes’ reputation tables are not alterable by the attack. As far as we know, it is not very clear howthey maintain the local trusted nodes list or how trust information is updated. It could be difficult todetect a sybil attack [30, 31] or the impersonation of a trusted node by first reading the trusted node listfrom a tampered node.

Sensors 2009, 9 9384
In an early design stage we decided not to depend on the hardware being tamper-proof. In fact,it is our assumption that it isn’t and that the communications between nodes with limited resourcesare not secure. Our approach compensates those drawbacks by taking advantage of temporal andspatial redundancy.
In general, most of the studied architectures provide security (by just preventing attacks or bysimultaneously detecting attacks and providing countermeasures) in the routing protocol at networklevel. In [10] we proposed a security infrastructure designed for intelligent environments that takesadvantage of the environment and uses information from the application layer. The premises of thissolution were redundancy and continuous evolution. We maintain this system as a good solution but itcan be improved. In this work we have introduced SOM algorithms to make the system faster in termsof adaptation.
3. SOM and WSN
Self organizing maps (SOM), also known as Kohonen networks, are an unsupervised type of neuralnetworks [32]. As in neural networks, the basic idea of SOM has origins in certain brain operations,specifically in projection of multidimensional inputs to one-dimensional or two-dimensional neuronalstructures on cortex. For example, perception of color depends on three different light receptors (red,green and blue), plus the eyes capture information about the position, size or texture of objects. It hasbeen demonstrated that this multidimensional signal is processed by the planar cortex structure. Further,it has been demonstrated that the areas of the brain responsible for different signals from the bodypreserve topology, e.g., the area responsible for the signals that come from the arms is close to the arearesponsible for the signals that come from the hand. These are precisely the basic ideas of SOM thatconsist in the following:
1. Multidimensional data and their dependencies are presented and captured in a lower dimensionSOM network (usually 2D).
2. The proximity of the nodes in SOM reflects similarity of the data mapped to the nodes.
For these reasons, SOMs have been widely deployed for clustering and good visualization ofthe problem (Figure 1). They have been successfully deployed in different fields such as imageprocessing [33], robotics [34] (for both visual and motor functions), network security [35], detectionof outliers in data [36], etc.
In this work we rely on SOM’s ability for detecting outliers [36]. When compared with standarddensity estimation methods (as kernel density estimator), SOMs are relatively fast and inexpensive whenthe dimensionality of the data is large. Furthermore, SOMs do not significantly depend on the underlyingdata model and have no restrictions concerning data dimensionality. This is very important in our case,as we will see in the following text the dimensionality of our data model is variable and grow to bevery high.

Sensors 2009, 9 9385
Figure 1. Visualization Property of SOM Clustering.
3.1. Underlying Data Model
Bearing in mind that in the case of sensor networks the final objective of an adversary is tocompromise the system, and that the easiest way to do it is to send false sensor outputs to the basestation in order to give wrong impression of the phenomenon that is being observed, we establish ourmodel of a sensor on sequences of sensor measurements.
Our model is based on two important assumptions:
1. The adversary can capture only a limited number of nodes, which means that most of the outputdata produced by the sensor nodes is normal. If this is not the case, it means that the adversary cansubvert any protocol in the network, which would require for the network re-initialization.
2. Output data produced under the influence of an adversary are statistically different from the outputproduced during the normal operation of the network. For this reason, we establish the detection ofanomalies in data as outlier detection. The definition of outliers is rather fuzzy, but it is consideredthat an outlier is an observation that lies an “abnormal” distance from other values in a randomsample from a population, in other words extreme points in the data cloud.
If any of these assumptions is not fulfilled, our model is not able to work properly.Our model of sensor outputs relies on sequences of data. In other words, we establish sequential
features of data in order to capture the temporal coherence in sensor outputs. In this way, by detectinganomalies in sequences of sensor outputs, we detect the presence of an attacker, including previouslyunseen attacks, which is the main advantage of our approach. If we had decided to use numericalfeatures, e.g., number of connections between two sensors that occur within a certain period of time, itwould have been impossible to detect unknown attacks as we cannot define the numerical features ofunknown attacks.
The temporal model proposed here consists of sub-sequences of measurements of a certain size n(called n-grams) and either its frequency or its occurrence in the given sequence (φ(x) in the text). Forexample, the sequence:
1.00, 1.20, 1.23, 1.22, 1.10, 1.00, 1.20, 1.23
can be characterized with the following model (n = 3):

Sensors 2009, 9 9386
1.00 1.20 1.23 occurrence 2, frequency 0.33
1.20 1.23 1.22 occurrence 1, frequency 0.17
1.23 1.22 1.10 occurrence 1, frequency 0.17
1.22 1.10 1.00 occurrence 1, frequency 0.17
1.10 1.00 1.20 occurrence 1, frequency 0.17The proposed model offers many advantages. Above all, the time to calculate the similarity between
two sequences is linear, which guarantees high speed of the process. Furthermore, it permits the pairwisecalculation of similarity, which is essential for its application in anomaly detection based on clusteringtechniques.
3.2. Implemented SOM Algorithm
Our SOM algorithm is implemented in C++ and consists of the following steps [32]:
1. The size of the grid is established, by which the number of the cluster is also known; the centre ofeach cluster, i.e., grid node, is implemented as a collection whose size is not fixed, i.e., it can bechanged on the fly, and whose elements are the n-grams defined in the previous text with assignedoccurrence or frequency. Then, the number of iterations (N ) is established. Afterwards, eachcluster centre is initialized randomly.
2. A random instance from the training data is chosen, v(t).
3. The cluster centre closest to the chosen instance is established and named BMU – BestMatching Unit.
4. The BMU radius is calculated according to the Formula 1:
σ(t) = σ0 exp(− tλ
), t = 1, 2, 3... (1)
where σ0 stands for initial radius, λ is the time constant, and t is the current iteration. At thebeginning, σ0, is quite high, it almost covers the grid, but it decreases during the time (with thetime constant λ).
5. Every node, i.e., cluster centre that resides in ρ-neighborhood of BMU is adjusted in thefollowing way:
• If an n-gram of the instance v(t) exists in the node, its value (either occurrence of frequency)φ(x) is modified according to the Formula 2:
φ(t+ 1) = φ(t) + Θ(t)L(t)(φ(t)− v(t)) (2)
where L(t) stands for the learning rate that also decreases during the time according to theFormula 3:
L(t) = L0 exp(− tλ
), t = 1, 2, 3... (3)

Sensors 2009, 9 9387
while Θ(t) introduces influence of the distance between a particular node and the BMU andis calculated according to the Formula 4:
Θ(t) = exp(− dist2
2σ2(t)), t = 1, 2, 3... (4)
where dist stands for the distance between the node and the BMU and ρ(t) is the radiusfunction defined in step 4.
• If an n-gram of the instance v(t) does not exist in the cluster centre, the n-gram is added tothe centre.
6. Steps 2–5 are repeated until all the instances from the training set are chosen.
7. Steps 2–6 are repeated N times.
The principal idea of the algorithm consists in the following: the neighborhood area of the nodethat corresponds to the current input is adjusted so that all the nodes from the established neighborhoodbecome closer to the input. The change that is introduced in each iteration and the neighborhood thatis getting updated are reducing with time, as each node, which at the same time represents a classifier,becomes more stable.
3.3. Distance Function
The distance between instances of the presented model is based on kernel functions and is takenfrom [37]. This is the corresponding pseudo-code:
function COMPARE(X, Y : Array) : R
s← e, i← 1, j ← 1
while(i ≤ |X| or j ≤ |Y |) :
x← X[i], y ← Y [j]
if((y = NIL)||(word[x] = word[y])) :
s← s+ d(phi[x], 0)
i← (i+ 1)
elseif((x = NIL)or(word[x] > word[y])) :
s← (s+ d(0, φ[y]))
j ← (j + 1)
else :
s← (s+ d(φ[x], φ[y]))
i← (i+ 1), j ← (j + 1)
returns
3.4. Outlier Detection
As mentioned before, we treat attacks as data outliers. There are two possible approaches for detectingoutliers using SOM algorithm depending on the following two possibilities: detecting outlying nodes or

Sensors 2009, 9 9388
detecting outlying data that belong to non-outlying nodes. For the first case, we calculate the averagedistance of each node to the rest of the nodes (or its closest neighborhood) (MD). The nodes whoseMD values are significantly bigger than the rest are declared to be outlying nodes. In the later case, wecalculate quantization error (QE) of each input as the distance from its group centre.
Hence, a node whose average distance is greater than those of the rest of the nodes is considered tobe outlying node and all the inputs that belong to it are considered to be anomalies. On the other hand,even if the node to which the current input belongs is not outlying, e.g., outlying data is too sparse forthe formation of outlying node(s) to be possible, if its QE value is greater than the rest of the QE valuesfrom the same node, i.e., from the medium QE of the node established during the training it is consideredto be the proof of the anomaly of the current input.
There are many important advantages that this proposal offers. On one hand, we avoid timeconsuming and error prone process of collecting only normal data for SOM training if we want toestablish a normal behavior and detect attacks as deviations from the established normal behavior. Onthe other hand, we could train SOM with all the collected data and then label the resulting clusters ina certain way. For example, we can say that the cluster to which the most of the data belongs is the“normal” one, while the rest are intrusive, or measure its intrusiveness as the distance from the normalone. But, this approach has many flaws, as it can happen that a new intrusion be more similar to thenormal data than any of the intrusive ones, so it would falsely be labelled as normal, while our QEmeasurement is more probable to work in this case.
Every node is being examined by an agent that resides on a node in its vicinity and listens to itscommunication in a promiscuous manner, where the agent executes the SOM algorithm in order todetect traces of an attack. The system of SOM agents is coupled with a reputation system where eachnode has its reputation value that basically reflects the level of confidence that others have in it based onits previous behavior. In our proposal, the output of the SOM agent affects on the reputation system inthe way that it assigns lower reputation to the nodes where it detects adversarial activities and vice versa.We further advocate coupling the information provided by the reputation system with routing protocolin the way that the nodes with low reputation should not be considered as a routing hop and all theinformation coming from these nodes should be discarded. In this way, the compromised node remainsisolated from the network and has no role in its further functioning. Considering that the attacker thathas taken over a node can disable or compromise the SOM agent, we introduce agent redundancy: atleast two SOM agents will examine the behavior of each node and both will affect on its reputation.
This approach has many advantages. First of all, SOM algorithm does not use reputation values fromthe neighborhood, which makes it robust to badmouthing attack, the main problem of reputation systems.Further, it can make the model of data for training and testing on the fly, so it is not necessary to providethe storage for great amounts of data.
3.5. Reputation by SOM
Based on the previous definitions of anomaly index, we define the reputation of SOM in the followingway:
1. We limit the reputation values to the range [0, 1], where 0 is the lowest possible, meaning that
Sensors 2009, 9 9389
there is no confidence in the node, and 1 the highest possible, meaning the absolute confidence inthe node.
2. We define two reputation values, repQE and repMD based on previously defined QE andMD values:
repMD =(maxMDvalue − anoScMed)
maxMDvalue
where maxMDvalue is the maximum median distance for the current lattice and anoScMed isthe MD value for the best matching unit of the current input. In this way, repMD takes valuesbetween 0 and 1, where the nodes that are close to the rest (or its proximate vicinity, depending onthe definition) have higher reputation and vice versa.
Regarding QE value, during the training we calculate the median QE for all the nodes in thecorresponding SOM lattice. In the testing process, we calculate QE value for the corresponding inputand calculate repQE as the ratio of current QE and the median QE for its corresponding best matchingunit node (or vice versa in order to maintain repQE value between 0 and 1). Finally, according to theintuitive reasoning (based on the fact that if the data produced by the presence of an intruder form theirown node, it will be significantly distant from the rest; on the other hand, if these data are too sparse andthus not able to form their own group, they will end up belonging to the “normal” nodes, so we have tocalculate their QE value), we establish the following manner to calculate current reputation:
I f ( repMD < 0 . 5 ) :r e p = repMD ;
E l s e :r e p = repQE ;
where we take 0.5 as threshold because it is the median value between 0 and 1.Finally, we update the reputation of the node in the following way:
cumQE = rep(t−1)i + repti + log(0.99repti)
where cumQE stands for cumulative QE. If the final value is greater than 1, we truncate it to 1, andin a similar fashion if it is lower than 0, we truncate it to 0. The function x + log(0.99x) is presentedin Figure 2 and provides exactly what we want to achieve: falling of the cumulative reputation if wehave small current reputation values and vice versa, and also small changes in the reputation if we arearound 0.5. As it can be observed, for the values lower than the 0.3 the values the reputation will falldown quickly, while for the values higher than 0.65 the function rises significantly. Finally, for the valuesbetween 0.5 and 0.65 the reputation changes for small amounts.

Sensors 2009, 9 9390
Figure 2. Function for updating reputation values.
4. Experimental Results
The proposed architecture has been simulated extensively to evaluate its behavior in the presence ofattacks of very different nature. Several algorithms have been implemented and used in the reputationserver to calculate the reputation of the sensors to make a comparison of its performance: linearalgorithm, beta function algorithm and SOM.
In [10] a simple linear algorithm was used to analyse how a reputation system works when integratedin a wireless sensor network. Beta is the most frequent algorithm [23] used in reputation systems and itis also used for WSNs, as shown in [24]. So, we compare both algorithms with a reputation systemwith SOM algorithms in the context of a SCADA sensor network. We have defined the followingcharacteristics which let us measure the performance and the effectiveness of a concrete algorithm:
• Detection time. It is the elapsed time since the attack was started until it is detected, i.e., thereputation of ill-behaved nodes starts decreasing.
• Isolation time. It is the elapsed time since the attack is detected until the reputation of everyattacker node gets below a threshold. The nodes with reputations below this threshold are notconsidered for decision making.
• Isolation capacity. It is the portion of ill-behaved nodes that are detected as attackers.
• System degradation. It is the portion of well-behaved nodes detected as attackers.
Experiments
One of the most representative identity attacks is the sybil attack, due to its aggressiveness andelusiveness. Besides, it includes most of the identity attacks (thief, mole, clone, etc.) by changingthe behavior of the attack.
Sensors 2009, 9 9391
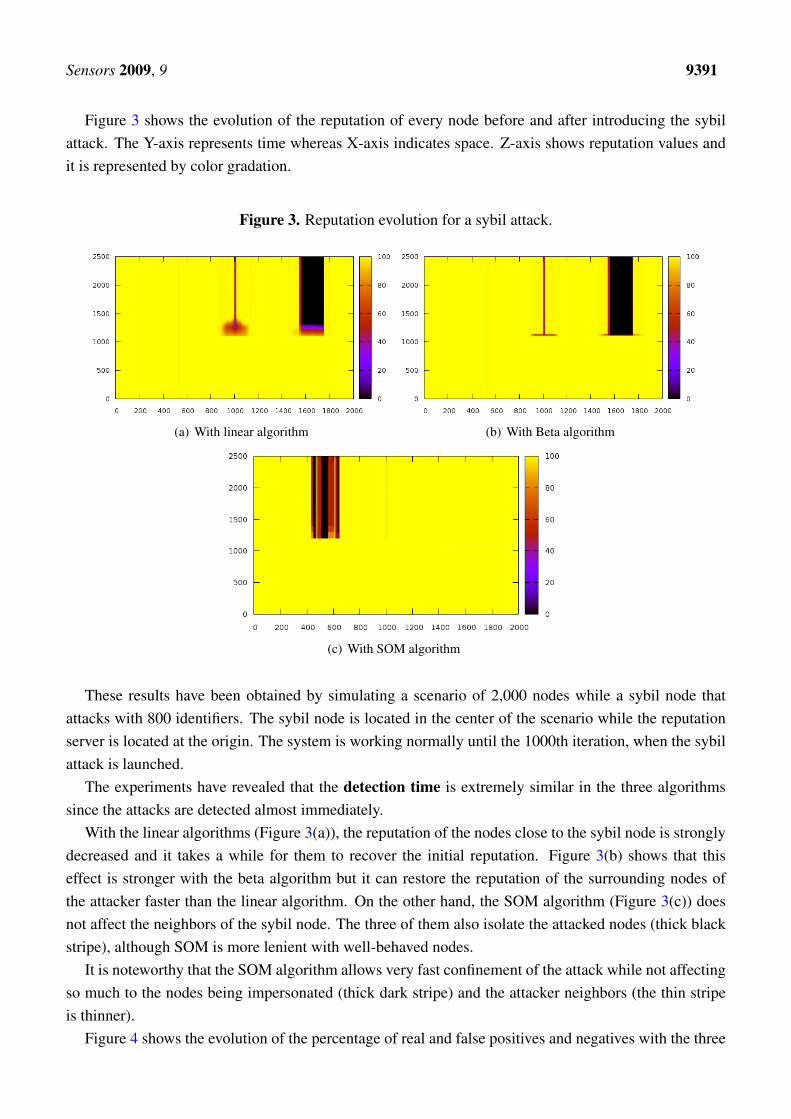
Figure 3 shows the evolution of the reputation of every node before and after introducing the sybilattack. The Y-axis represents time whereas X-axis indicates space. Z-axis shows reputation values andit is represented by color gradation.
Figure 3. Reputation evolution for a sybil attack.
(a) With linear algorithm (b) With Beta algorithm
(c) With SOM algorithm
These results have been obtained by simulating a scenario of 2,000 nodes while a sybil node thatattacks with 800 identifiers. The sybil node is located in the center of the scenario while the reputationserver is located at the origin. The system is working normally until the 1000th iteration, when the sybilattack is launched.
The experiments have revealed that the detection time is extremely similar in the three algorithmssince the attacks are detected almost immediately.
With the linear algorithms (Figure 3(a)), the reputation of the nodes close to the sybil node is stronglydecreased and it takes a while for them to recover the initial reputation. Figure 3(b) shows that thiseffect is stronger with the beta algorithm but it can restore the reputation of the surrounding nodes ofthe attacker faster than the linear algorithm. On the other hand, the SOM algorithm (Figure 3(c)) doesnot affect the neighbors of the sybil node. The three of them also isolate the attacked nodes (thick blackstripe), although SOM is more lenient with well-behaved nodes.
It is noteworthy that the SOM algorithm allows very fast confinement of the attack while not affectingso much to the nodes being impersonated (thick dark stripe) and the attacker neighbors (the thin stripeis thinner).
Figure 4 shows the evolution of the percentage of real and false positives and negatives with the three

Sensors 2009, 9 9392
algorithms. When the attack is introduced, the number of false negatives increases during a time. Thistime is the duration of the attack or isolation time and, after that period, it is confined. The height of thiscurve indicates the depth of the attack in the system.
Figure 4. Evolution of the true/false positives/negatives for a sybil attack.
(a) With the linear algorithm (b) With the Beta algorithm
(c) With the SOM algorithm
The capacity of confinement can be measured by the number of false positives at the stationaryperiod, that is zero in every case.
If the area under the curve number of false positives is calculated, we can determine the impact ofthe attack because this magnitude takes into account both aspects of the attack: its duration and itsdepth. Figure 5(a) shows how the impact of the attack changes depending on the redundancy of thesensor nodes. We have simulated the same attack in scenarios in which the number of sensor nodes isdecreased. The X-axis represents the number of sensor nodes per each one hundred attacker (n). TheY-axis indicates the impact (I), calculated as the sum of the false positives given by the Formula 5.
I(n) =Ts∑t=0
Pfpt(n) (5)
where Ts is the simulation time and Pfpt is the percentage of false positives at the instant t.

Sensors 2009, 9 9393
Figure 5. Evolution of the impact of the attack and the based on the sensor node redundancy.
800 400 267 200 160 133 114 100
Redudancy
100
1000
10000
100000
Impact
Linear
Beta
SOM
(a) Impact of the attack
800 400 267 200 160 133 114 100
Redudancy
0,50
0,60
0,70
0,80
0,90
1,00
System degradation
Linear
Beta
SOM
(b) Degradation of the system
Figure 5(b) shows how the system behaves as the redundancy of the sensor network decreases. Aswe did in the previous simulation, we have used the same attack but decreasing the total number ofnodes. The X-axis represents the number of sensor nodes per each one hundred attacker (n). The Y-axisindicates the value of the system degradation (D), given by the Formula 6.
D(n) =NattT s
NfpT s(n) +NattT s
(6)
whereNattT s is the number of ill-behaved nodes at the end of the simulation (Ts) andNfpT s is the numberof well-behaved nodes considered as ill-behaved ones. The system degradation is optimal when its valueis 1.
As we can see in Figure 5(a), the SOM algorithm needs much less redundancy to work comparedto the linear or beta algorithms, while obtaining values of system degradation similar to the otheralgorithms 5(b).
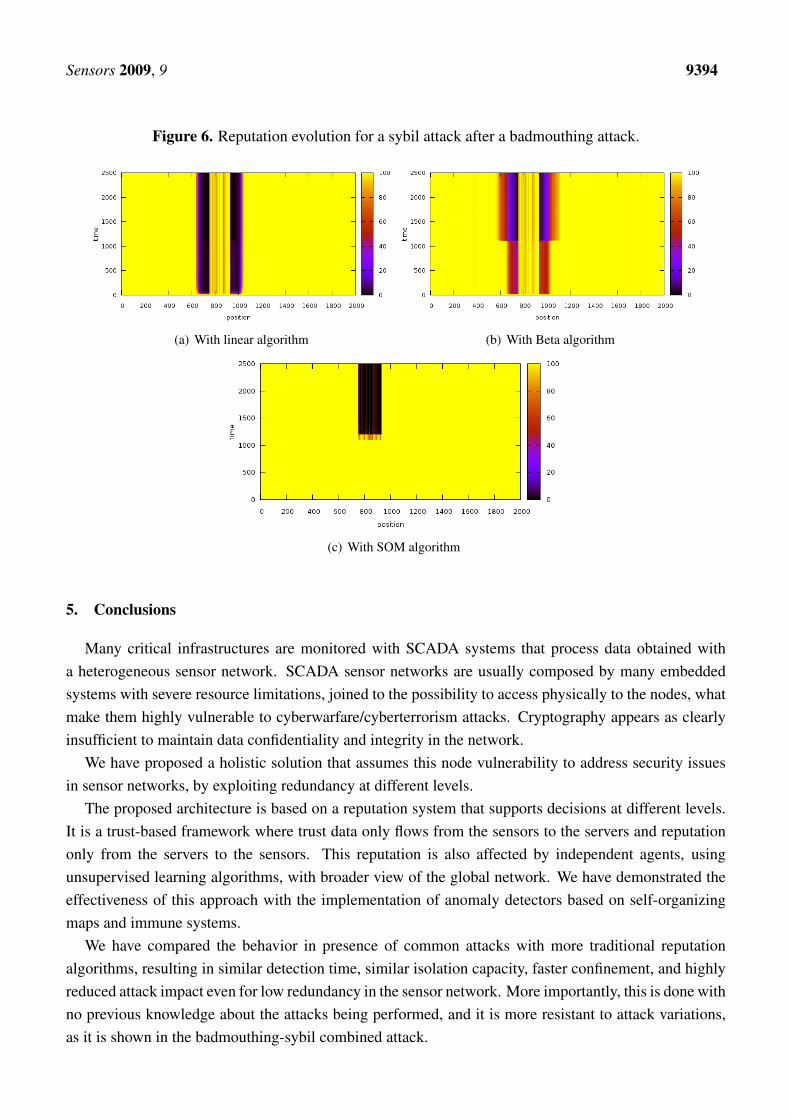
Since node trusts have no influence in the SOM algorithm, it should be more resistant to reputationattacks like badmouthing. This experiment proves that it is fulfilled. The experiment entails abadmouthing sybil node that attacks the system. The attack decreases the reputation of a group of nodessurrounding the attacker. When their reputation is low enough, the information from sybil identifiers willbe used for the decisions. The trust of the neighbors about the attackers will not be taken into accountdue to their low reputation and, hence, the sybil will not be confined (Figures 6(a) and 6(b)). However,in Figure 6(c) it is shown that the SOM algorithm imperturbably detects and banishes the sybil attack.
The scenario of the experiment has consisted of 180 badmouthing nodes in a small region and, aftera while, these nodes become into a sybil node that adopt the identities of the badmouthing nodes.
Sensors 2009, 9 9394
Figure 6. Reputation evolution for a sybil attack after a badmouthing attack.
(a) With linear algorithm (b) With Beta algorithm
(c) With SOM algorithm
5. Conclusions
Many critical infrastructures are monitored with SCADA systems that process data obtained witha heterogeneous sensor network. SCADA sensor networks are usually composed by many embeddedsystems with severe resource limitations, joined to the possibility to access physically to the nodes, whatmake them highly vulnerable to cyberwarfare/cyberterrorism attacks. Cryptography appears as clearlyinsufficient to maintain data confidentiality and integrity in the network.
We have proposed a holistic solution that assumes this node vulnerability to address security issuesin sensor networks, by exploiting redundancy at different levels.
The proposed architecture is based on a reputation system that supports decisions at different levels.It is a trust-based framework where trust data only flows from the sensors to the servers and reputationonly from the servers to the sensors. This reputation is also affected by independent agents, usingunsupervised learning algorithms, with broader view of the global network. We have demonstrated theeffectiveness of this approach with the implementation of anomaly detectors based on self-organizingmaps and immune systems.
We have compared the behavior in presence of common attacks with more traditional reputationalgorithms, resulting in similar detection time, similar isolation capacity, faster confinement, and highlyreduced attack impact even for low redundancy in the sensor network. More importantly, this is done withno previous knowledge about the attacks being performed, and it is more resistant to attack variations,as it is shown in the badmouthing-sybil combined attack.

Sensors 2009, 9 9395
The resulting approach takes into account practical issues, such as resource limitation, bandwidthoptimization and scalability, and it is also well-suited in scenarios with low redundancy. Based onthese results we claim that our approach provides a practical solution for developing more secureSCADA applications.
6. Acknowledgements
This work was funded by the Spanish Ministry of Industry, Tourism and Trade, under Research GrantTSI-020301-2009-18 (eCID), the Spanish Ministry of Science and Innovation, under Research GrantTEC2009-14595-C02-01, and the CENIT Project Segur@.
References
1. Maynor, D.; Graham, R. SCADA security and terrorism: we’re not crying wolf. In Black HatFederal 2006; Black Hat: Washington, DC, USA, 2006; pp. 1–36.
2. Lemos, R. SCADA system makers pushed toward security. SecurityFocus, July 26, 2006, pp. 1–2.3. Ravi, S.; Raghunathan, A.; Kocher, P.; Hattangady, S. Security in embedded systems: design
challenges. Trans. on Embed. Comput. Sys. 2004, 3, 461–491.4. Holcomb, J.; Perine, C.; Panadero, X.; Farinas, E. Threat Modeling of NetDDE Vulnerabilities as
used in Control Systems. In Proceedings of the SCADA Security Scientific Symposium (S4); DigitalBond: Miami Beach, FL, USA, 2008; pp. 2:1–2:36.
5. Udassin, E. Control system attack vectors and examples: field site and corporate network. InProceedings of the SCADA Security Scientific Symposium (S4); Digital Bond: Miami Beach, FL,USA, 2008; pp. 1–11.
6. Kocher, P.; Lee, R.; McGraw, G.; Raghunathan, A. Security as a new dimension in embeddedsystem design. In Proceedings of the 41st annual Conference on Design Automation; ACM: SanDiego, CA, USA, 2004; pp. 753–760.
7. Ravi, S.; Raghunathan, A.; Potlapally, N.; Sankaradass, M. System design methodologies fora wireless security processing platform. In Proceedings of the 39th Conference on DesignAutomation; ACM: New Orleans, LA, USA, 2002; pp. 777–782.
8. Arora, D.; Raghunathan, A.; Ravi, S.; Sankaradass, M.; Jha, N.K.; Chakradhar, S.T. Softwarearchitecture exploration for high-performance security processing on a multiprocessor mobile SoC.In Proceedings of the 43rd annual Conference on Design Automation; ACM: San Francisco, CA,USA, 2006; pp. 496–501.
9. Benini, L.; Macii, A.; Macii, E.; Omerbegovic, E.; Pro, F.; Poncino, M. Energy-aware designtechniques for differential power analysis protection. In Proceedings of the 40th Conference onDesign Automation; ACM: Anaheim, CA, USA, 2003; pp. 36–41.
10. Moya, J.M.; Vallejo, J.C.; Fraga, D.; Araujo, A.; Villanueva, D.; de Goyeneche, J.M. Usingreputation systems and non-deterministic routing to secure wireless sensor networks. Sensors 2009,9, 3958–3980.
11. Bar-El, H.; Choukri, H.; Naccache, D.; Tunstall, M.; Whelan, C. The Sorcerer’s apprentice guideto fault attacks. Proc. IEEE 2006, 94, 370–382.

Sensors 2009, 9 9396
12. Perrig, A.; Stankovic, J.; Wagner, D. Security in wireless sensor networks. Commun. ACM 2004,47, 53–57.
13. Mun, Y.; Shin, C. Secure Routing in Sensor Networks: Security Problem Analysis andCountermeasures. In Computational Science and Its Applications–ICCSA 2005; Springer: NewYork, NY, USA, 2005; pp. 459–467.
14. Buttyan, L.; Hubaux, J. Enforcing service availability in mobile ad-hoc WANs. In Proceedingsof the 1st ACM international symposium on Mobile ad hoc networking & computing; IEEE Press:Boston, MA, USA, 2000; pp. 87–96.
15. Buttyan, L.; Hubaux, J. Stimulating cooperation in self-organizing mobile ad hoc networks. Mob.Netw. Appl. 2003, 8, 579–592.
16. Marti, S.; Giuli, T.J.; Lai, K.; Baker, M. Mitigating routing misbehavior in mobile ad hoc networks.In Proceedings of the 6th annual international conference on Mobile computing and networking;ACM: Boston, MA, USA, 2000; pp. 255–265.
17. Dawkins, R. The Selfish Gene, 2nd ed.; Oxford University Press: New York, NY, USA, 1990.18. Roman, R.; Zhou, J.; Lopez, J. Applying intrusion detection systems to wireless sensor networks.
In Consumer Communications and Networking Conference, 2006. CCNC 2006. 3rd IEEE; IEEE:Las Vegas, NV, USA, 2006; pp. 640–644.
19. Krontiris, I.; Giannetsos, T.; Dimitriou, T. LIDeA: a distributed lightweight intrusion detectionarchitecture for sensor networks. In Proceedings of the 4th International Conference on Securityand Privacy in Communication Netowrks; ACM: Istanbul, Turkey, 2008; pp. 1–10.
20. Wallenta, C.; Kim, J.; Bentley, P.; Hailes, S. Detecting interest cache poisoning in sensor networksusing an artificial immune algorithm. Appl. Intell. 2008, doi: 10.1007/s10489-008-0132-0.
21. Yu, Z.; Tsai, J.J.P. A Framework of Machine Learning Based Intrusion Detection for WirelessSensor Networks. In Proceedings of the 2008 IEEE International Conference on Sensor Networks,Ubiquitous, and Trustworthy Computing (SUTC 2008)–Volume 00; IEEE Computer Society:Taichung, Taiwan, 2008; pp. 272–279.
22. Buchegger, S.; Boudec, J.L. Performance analysis of the CONFIDANT protocol. In Proceedingsof the 3rd ACM International Symposium on Mobile Ad hoc Networking & Computing; ACM:Lausanne, Switzerland, 2002; pp. 226–236.
23. Jøsang, A.; Ismail, R. The Beta Reputation System. In Proceedings of the 15th Bled ElectronicCommerce Conference (Bled EC); Bled eCommerce Conference: Slovenia, 2002; pp. 41:1–41:14.
24. Ganeriwal, S.; Balzano, L.K.; Srivastava, M.B. Reputation-based framework for high integritysensor networks. ACM Trans. Sen. Netw. 2008, 4, 1–37.
25. Sun, Y.L.; Han, Z.; Yu, W.; Liu, K.J.R. A Trust Evaluation Framework in Distributed Networks:Vulnerability Analysis and Defense Against Attacks. In INFOCOM 2006. 25th IEEE InternationalConference on Computer Communications. Proceedings; IEEE: Barcelona, Spain, 2006; pp. 1–13.
26. Yi, S.; Naldurg, P.; Kravets, R. Security-Aware Ad hoc Routing for Wireless Networks; Technicalreport, University of Illinois at Urbana-Champaign, Urbana, IL, USA, 2001.
27. Pfitzmann, A.; Pfitzmann, B.; Schunter, M.; Waidner, M. Trusting mobile user devices and securitymodules. Computer 1997, 30, 61–68.

Sensors 2009, 9 9397
28. Kocher, P.C.; Jaffe, J.; Jun, B. Differential Power Analysis. In Proceedings of the 19th AnnualInternational Cryptology Conference on Advances in Cryptology; Springer-Verlag: New York, NY,USA, 1999; pp. 388–397.
29. Kocher, P.; Jaffe, J.; Jun, B. Introduction to Differential Power Analysis and Related Attacks;Whitepaper, Cryptography Research: San Francisco, CA, USA, 1998.
30. Douceur, J.R. The Sybil Attack. In Revised Papers from the First International Workshop onPeer-to-Peer Systems; Springer-Verlag: Berlin, Germany, 2002; pp. 251–260.
31. Newsome, J.; Shi, E.; Song, D.; Perrig, A. The sybil attack in sensor networks: analysis & defenses.In Proceedings of the 3rd international symposium on Information processing in sensor networks;ACM: Berkeley, CA, USA, 2004; pp. 259–268.
32. Rojas, R. Neural Networks; Springer-Verlag: Berlin, Germany, 1996.33. Litmann, E.; Drees, A.; Ritter, H. Neural recognition of human pointing gestures in real images.
Neural Process. Lett. 1996, 3, 61–71.34. Comaniciu, D. Nonparametric information fusion for motion estimation. In Computer Vision
and Pattern Recognition, 2003. Proceedings. 2003 IEEE Computer Society Conference on; IEEEComputer Society: Madison, WI, USA, June 16–22, 2003; pp. I–59–I–66.
35. Thames, J.L.; Abler, R.; Saad, A. Hybrid intelligent systems for network security. In Proceedingsof the 44th annual Southeast regional conference; ACM: Melbourne, FL, USA, 2006; pp. 286–289.
36. Munoz, A.; Muruzabal, J. Self-organizing maps for outlier detection. Neurocomputing 1998,18, 33–60.
37. Rieck, K.; Laskov, P. Linear-Time Computation of similarity measures for sequential data. J. Mach.Learn. Res. 2008, 9, 23–48.
c© 2009 by the authors; licensee Molecular Diversity Preservation International, Basel, Switzerland.This article is an open-access article distributed under the terms and conditions of the Creative CommonsAttribution license http://creativecommons.org/licenses/by/3.0/.