absolute radiometric calibration using pseudo invariant calibration ...
Improving productivity in a temperature
calibration laboratory
Many calibration laboratories and instrument shops face the problem of delivering more accurate cali-brations in less time and at lower cost. Although improving quality and performance while reducing cost is a difficult problem, it is also an old problem that manufacturers have been facing for years. Lean manufacturing, a concept pioneered by Toyota, offers an approach that may also benefit service as much as it does manufacturing. This application note describes how one company used lean manufactur-ing principles to improve laboratory quality and pro-ductivity in its temperature calibration laboratory.
IntroductionFluke Calibration maintains a temperature calibration laboratory in American Fork Utah, providing NVLAP accredited calibration services (lab code 200348) from approximately –200 °C to 1000 °C. Lab asso-ciates take pride in the fact that their calibration uncertainties are among the best commercially avail-able in the world. In spite of the laboratory’s tech-nical successes, Platinum Resistance Thermometer (PRT) calibrations still took too long and occasionally had to be repeated.
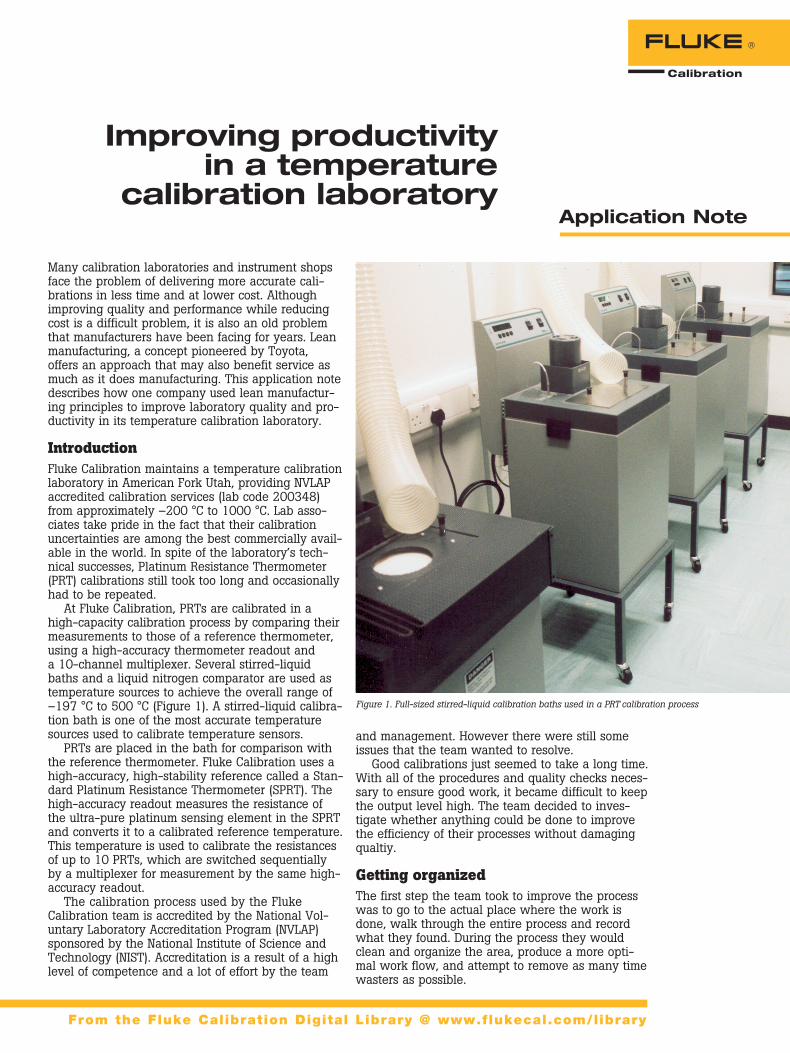
At Fluke Calibration, PRTs are calibrated in a high-capacity calibration process by comparing their measurements to those of a reference thermometer, using a high-accuracy thermometer readout and a 10-channel multiplexer. Several stirred-liquid baths and a liquid nitrogen comparator are used as temperature sources to achieve the overall range of –197 °C to 500 °C (Figure 1). A stirred-liquid calibra-tion bath is one of the most accurate temperature sources used to calibrate temperature sensors.
PRTs are placed in the bath for comparison with the reference thermometer. Fluke Calibration uses a high-accuracy, high-stability reference called a Stan-dard Platinum Resistance Thermometer (SPRT). The high-accuracy readout measures the resistance of the ultra-pure platinum sensing element in the SPRT and converts it to a calibrated reference temperature. This temperature is used to calibrate the resistances of up to 10 PRTs, which are switched sequentially by a multiplexer for measurement by the same high-accuracy readout.
The calibration process used by the Fluke Calibration team is accredited by the National Vol-untary Laboratory Accreditation Program (NVLAP) sponsored by the National Institute of Science and Technology (NIST). Accreditation is a result of a high level of competence and a lot of effort by the team
and management. However there were still some issues that the team wanted to resolve.
Good calibrations just seemed to take a long time. With all of the procedures and quality checks neces-sary to ensure good work, it became difficult to keep the output level high. The team decided to inves-tigate whether anything could be done to improve the efficiency of their processes without damaging qualtiy.
Getting organizedThe first step the team took to improve the process was to go to the actual place where the work is done, walk through the entire process and record what they found. During the process they would clean and organize the area, produce a more opti-mal work flow, and attempt to remove as many time wasters as possible.
Figure 1. Full-sized stirred-liquid calibration baths used in a PRT calibration process
Application Note
From the Fluke Calibration Digital Library @ www.flukecal.com/library
2 Fluke Calibration, Improving productivity in a temperature calibration laboratory
A team of four people took three days to map, clean and organize the process. Unnecessary items were removed and tools were placed in appropriate locations to help improve process flow. Lean manu-facturing tools, including process maps and spaghetti diagrams, helped them to identify problems and cre-ate a more optimal future state of the process.
Process maps Process maps show the steps in a process, how much work occurs at each step, and how much time each step requires. Process maps help make prob-lems easier to see. For example, a bottleneck occurs when one step in the process takes longer for a given level of output than the preceding step. Some bottlenecks are easy to spot, because a lot of work is piled up behind them. Others can be more subtle and may not become visible until the process map is developed.
It’s not reasonable to account for every possible variable during this part of the exercise, but being as accurate as possible is important. For example, the Fluke Calibration team recorded details such as removing probes from one bath, letting them cool and grabbing a paper towel to wipe the probes before placing them in the next bath.
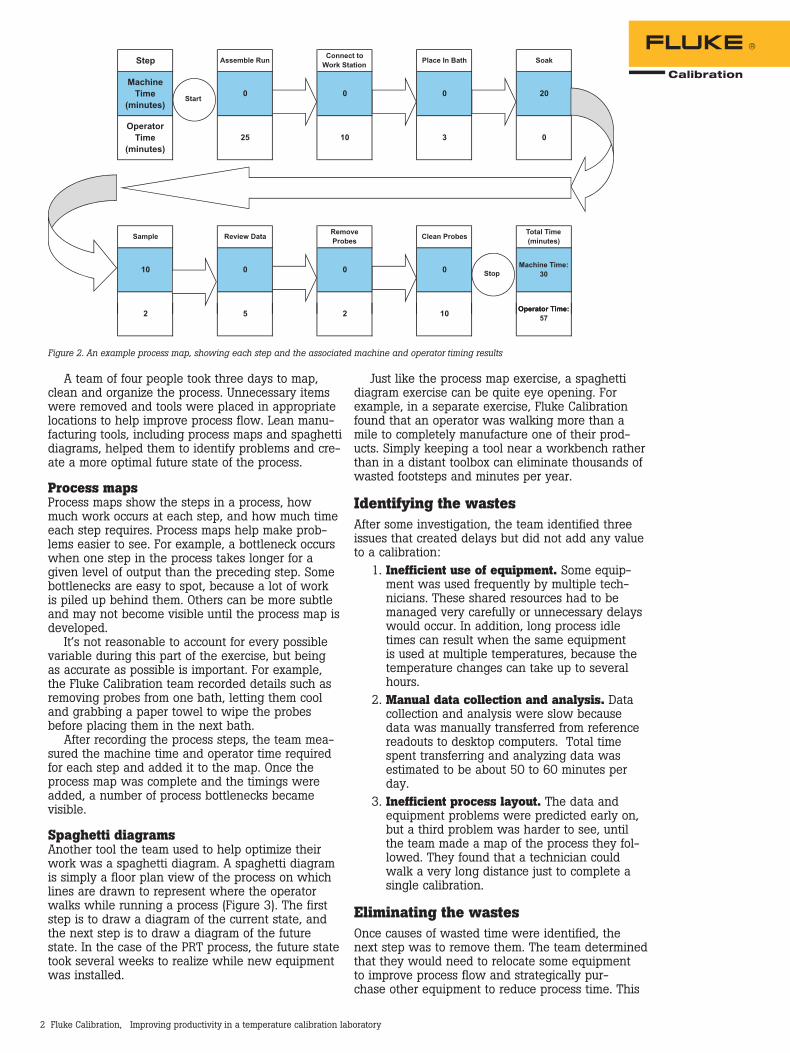
After recording the process steps, the team mea-sured the machine time and operator time required for each step and added it to the map. Once the process map was complete and the timings were added, a number of process bottlenecks became visible.
Spaghetti diagramsAnother tool the team used to help optimize their work was a spaghetti diagram. A spaghetti diagram is simply a floor plan view of the process on which lines are drawn to represent where the operator walks while running a process (Figure 3). The first step is to draw a diagram of the current state, and the next step is to draw a diagram of the future state. In the case of the PRT process, the future state took several weeks to realize while new equipment was installed.
Just like the process map exercise, a spaghetti diagram exercise can be quite eye opening. For example, in a separate exercise, Fluke Calibration found that an operator was walking more than a mile to completely manufacture one of their prod-ucts. Simply keeping a tool near a workbench rather than in a distant toolbox can eliminate thousands of wasted footsteps and minutes per year.
Identifying the wastesAfter some investigation, the team identified three issues that created delays but did not add any value to a calibration:
1. Inefficient use of equipment. Some equip-ment was used frequently by multiple tech-nicians. These shared resources had to be managed very carefully or unnecessary delays would occur. In addition, long process idle times can result when the same equipment is used at multiple temperatures, because the temperature changes can take up to several hours.
2. Manual data collection and analysis. Data collection and analysis were slow because data was manually transferred from reference readouts to desktop computers. Total time spent transferring and analyzing data was estimated to be about 50 to 60 minutes per day.
3. Inefficient process layout. The data and equipment problems were predicted early on, but a third problem was harder to see, until the team made a map of the process they fol-lowed. They found that a technician could walk a very long distance just to complete a single calibration.
Eliminating the wastesOnce causes of wasted time were identified, the next step was to remove them. The team determined that they would need to relocate some equipment to improve process flow and strategically pur-chase other equipment to reduce process time. This
Figure 2. An example process map, showing each step and the associated machine and operator timing results

3 Fluke Calibration, Improving productivity in a temperature calibration laboratory
reduced the number of steps required to complete a calibration and eliminated bottlenecks that previ-ously constrained output. Figures 3 and 4 demon-strate the changes made.
As an example, the team relocated some equip-ment to improve process flow and reduce the com-plexity uncovered by the spaghetti diagram (Figure 5). Tools like clamps and rulers were placed at the point of use rather than in one central location in the lab. Manual data collection from instruments to desktop computers was replaced with electronic data transfer by adding a wireless modem to each test station. All of these changes together signifi-
cantly reduced the amount of walking around a technician needed to do each day.
Even small improvements really add up. For example, a reduction of just ten wasted steps per day multiplies out to more than two thousand, six hundred steps per year.
In addition, the team found heating and cool-ing a single bath between 420 °C and 500 °C was causing a bottleneck that wasted several hours each instance. Due to more frequent customer requests for the temperature 500 °C, the lab was becoming less and less productive with their existing setup. The team determined that an investment in a new bath
Figure 3. Spaghetti diagram showing the movement that occurred during a typical PRT calibration before the process improvement event
Figure 4. The revised laboratory floor plan allows the calibration process to flow naturally and efficiently, with fewer wasted steps and unnecessary movements.

4 Fluke Calibration, Improving productivity in a temperature calibration laboratory
dedicated to 500 °C would pay off by a significant increase in productivity.
Automating for even more dramatic efficiency gainsWith improved process layout and the major bottle-necks removed, the time came for the implementa-tion of software to automate the gathering of data and data analysis.
Data is written into the software through wireless RS-232 adapters that connect each of the portable calibration stations to a computer work station. Vital measurement statistics, as well as analysis tools such as curve fit analysis and probe repeatability, are built in so the operator can easily determine if a probe passes calibration.
Overall, the software has improved process pro-ductivity by about 30%. Automatic data gathering and data analysis helped with this reduction, but the largest reduction in process time came from using decision rules to trigger data collection. Previously, technicians set timers for 20 minute soak times at each temperature point. Then it would take an aver-age of 10 minutes to record and analyze the data.
Automating this process helped reduce the aver-age time per temperature point from 30 minutes to about 12 (60% improvement). Most importantly, the software has helped improve calibration qual-ity, because each calibration was done right the first time and didn’t have to be repeated to correct issues identified late in the process by a quality check.
SummaryIn the end, the process capacity was increased using the same amount of floor space. By improv-ing process flow, improving process layout, remov-ing bottlenecks and adding automation, the process capacity increased by nearly 40% accommodating future growth and improving time to ship by 55%.
Figure 5. A wireless modem and frequently used tools like rulers and clamps were placed on test stations for significant time savings.
Fluke Calibration PO Box 9090, Everett, WA 98206 U.S.A.Fluke Europe B.V. PO Box 1186, 5602 BD Eindhoven, The Netherlands
Fluke Calibration. Precision, performance, confidence.™
For more information call: In the U.S.A. (877) 355-3225 or Fax (425) 446-5116 In Europe/M-East/Africa +31 (0) 40 2675 200 or Fax +31 (0) 40 2675 222 In Canada (800)-36-FLUKE or Fax (905) 890-6866 From other countries +1 (425) 446-5500 or Fax +1 (425) 446-5116 Web access: http://www.flukecal.com
©2009, 2013 Fluke Calibration. Specifications subject to change without notice. Printed in U.S.A. 1/2013 3478216B_EN
Modification of this document is not permitted without written permission from Fluke Calibration.