Improving Product Design Using Quality Function Deployment: The ...
12
Improving Product Design Using Quality Function Deployment: The School Furniture Case in Developing Countries Marvin E. Gonza ´lez, 1, * Gioconda Quesada, 2 and A. Terry Bahill 3 1 Operations and Technology, Instituto de Empresa, Madrid, Spain 2 Information Systems and Operations Management Department, The University of Toledo, Toledo, Ohio, USA 3 Systems and Industrial Engineering, University of Arizona, Tucson, Arizona, USA ABSTRACT This paper presents a quality function deployment (QFD) analysis of the design of school furniture in developing countries, using Costa Rica as the baseline. The dynamic hierarchy process model for QFD was used to help the product development team make effective decisions in satisfying the requirements of the customer constrained by limited resources. A number of total quality management (TQM) tools were employed during the development of the school furniture solution. A dynamic, cross-functional team organization was used. A simple form of quality function deployment was used to identify the desirable product design, safety, and service features. Key Words: Quality function deployment (QFD); Concurrent engineering; Sensitivity analysis; Total quality management. INTRODUCTION Educating children has long been regarded as an important element of economic improvement in devel- oping countries. Although well-designed school furniture has been shown to contribute to the learning process, school furniture used in these countries often hobbles rather than facilitates education. Moreover, the furniture is of low quality, has rough writing surfaces, falls apart quickly, and does not fit the children, yet it is relatively costly and consumes a disproportionate amount of limited educational budgets. A detailed description of the school furniture problem in Costa Rica is described later in this paper. The purpose of this project is to address the school furniture problem in the areas of functionality, material, structure, production, ergonomics, and aesthetics. The specific objective of the project is identifying the most 47 DOI: 10.1081/QEN-120020770 0898-2112 (Print); 1532-4222 (Online) Copyright q 2003 by Marcel Dekker, Inc. www.dekker.com * Correspondence: Marvin E. Gonza ´lez, Operations and Technology, Instituto de Empresa, Madrid, Spain 28006; Fax: 34-91-561- 0930; E-mail: [email protected]. 120020770_QEN_016_001_R1_X0.ald 22/3/2003—DHANAJAYAN—66115 QUALITY ENGINEERING w Vol. 16, No. 1, pp. 47–58, 2003 1 2 3 4 5 6 7 8 9 10 11 12 13 14 15 16 17 18 19 20 21 22 23 24 25 26 27 28 29 30 31 32 33 34 35 36 37 38 39 40 41 42 43 44 45 46 47 48 49 50 51 52
Transcript of Improving Product Design Using Quality Function Deployment: The ...
Improving Product Design Using Quality Function Deployment: The SchoolFurniture Case in Developing Countries
Marvin E. Gonzalez,1,* Gioconda Quesada,2 and A. Terry Bahill3
1Operations and Technology, Instituto de Empresa, Madrid, Spain2Information Systems and Operations Management Department,
The University of Toledo, Toledo, Ohio, USA3Systems and Industrial Engineering, University of Arizona,
Tucson, Arizona, USA
ABSTRACT
This paper presents a quality function deployment (QFD) analysis of the design of school
furniture in developing countries, using Costa Rica as the baseline. The dynamic hierarchy
process model for QFD was used to help the product development team make effective
decisions in satisfying the requirements of the customer constrained by limited resources.
A number of total quality management (TQM) tools were employed during the
development of the school furniture solution. A dynamic, cross-functional team organization
was used. A simple form of quality function deployment was used to identify the desirable
product design, safety, and service features.
Key Words: Quality function deployment (QFD); Concurrent engineering; Sensitivity
analysis; Total quality management.
INTRODUCTION
Educating children has long been regarded as an
important element of economic improvement in devel-
oping countries. Although well-designed school furniture
has been shown to contribute to the learning process,
school furniture used in these countries often hobbles
rather than facilitates education. Moreover, the furniture
is of low quality, has rough writing surfaces, falls apart
quickly, and does not fit the children, yet it is relatively
costly and consumes a disproportionate amount of
limited educational budgets. A detailed description of the
school furniture problem in Costa Rica is described later
in this paper.
The purpose of this project is to address the school
furniture problem in the areas of functionality, material,
structure, production, ergonomics, and aesthetics. The
specific objective of the project is identifying the most
47
DOI: 10.1081/QEN-120020770 0898-2112 (Print); 1532-4222 (Online)
Copyright q 2003 by Marcel Dekker, Inc. www.dekker.com
*Correspondence: Marvin E. Gonzalez, Operations and Technology, Instituto de Empresa, Madrid, Spain 28006; Fax: 34-91-561-
0930; E-mail: [email protected].
120020770_QEN_016_001_R1_X0.ald 22/3/2003—DHANAJAYAN—66115
QUALITY ENGINEERINGw
Vol. 16, No. 1, pp. 47–58, 2003
1
2
3
4
5
6
7
8
9
10
11
12
13
14
15
16
17
18
19
20
21
22
23
24
25
26
27
28
29
30
31
32
33
34
35
36
37
38
39
40
41
42
43
44
45
46
47
48
49
50
51
52

important variables in order to create designs that are
ergonomically correct, strong, durable, low maintenance,
low cost, and can be made by local industries from
locally available materials.
The organization of the paper is as follows. First, we
describe the general problem of the school furniture in
Costa Rica. After this, we explain the methodology used
in the present study along with general concepts of
quality function deployment (QFD), followed by a
literature review that will help theoretically support our
practical results. Then, we describe the QFD application
in the school furniture problem. It is important to
emphasize that we describe in detail the development of
the house of quality (first stage in a QFD project) since
the following houses or stages follow a similar
procedure. Therefore, for the last three stages or houses,
we briefly mention them and present them in the figures.
Finally, we present the conclusions reached by the
project.
BACKGROUND OF THE SCHOOL FURNITURE
PROBLEM IN COSTA RICA
A recent study of school furniture in Costa Rica by
Gonzalez et al. (1998) showed that only 0.005% of the
National Budget for Education is used for new furniture.
A shortage of 100,000 pieces of furniture was found.
Costa Rican children spend 7 hours per day (35 hours per
week) in classrooms. Therefore, the Costa Rican national
government is looking for better, faster, and cheaper
solutions for school furniture design and manufacturing,
in order to reduce stress on the children and optimize
school budgets.
The most important considerations of this study
were mismatches between the children’s anthropo-
metrics and the dimensions of the school furniture that
could cause pain and discomfort or chronic muscle–
skeletal disorders. School children are particularly at
risk, because of the wide range of body size, the
prolonged seated posture, and the possible adverse
developmental effects of prolonged exposure to postural
stresses. In this study, we have tried to determine whether
the reports of discomfort can be related to mismatches
between anthropometrics of the children and the
dimensions of the tables and chairs. Two hundred and
twenty-four students from four schools were studied.
These students were from three different grades (ages
approximately 12, 14, and 16 years, respectively). Seven
anthropometric measures were made on each student.
The students answered a questionnaire, which asked
about pain and discomfort experienced at school,
habitual study, sports and other activities, and whether
the pain had restricted any activities. The classroom
furniture used by each group of students was measured,
and these measurements were linked to the related
anthropometric measures (e.g., seat depth and thigh
length, seat height and lower-leg length). The data were
analyzed using chi-square and t-tests. There was a high
incidence of reported pain and discomfort, 55% at the 5%
level of confidence (Gonzalez et al., 1998).
The most important relationships were due to
mismatches between thigh length and seat depth, which
was significantly related to general seated discomfort,
and mismatches between the seated elbow height and the
desk height, which was significantly related to pain in the
shoulders and neck. The high level of reported pain and
discomfort is a matter for considerable concern and
warrants further investigation. The failure of anthropo-
metric mismatches to fully account for the expressed
pain suggests that other factors contributing to postural
discomfort need to be found.
LITERATURE REVIEW
Quality function deployment has been used to
translate customer needs and wants into technical
requirements in order to increase customer satisfaction
(Akao, 1990). Quality function deployment utilizes the
house of quality, which is a matrix providing a
conceptual map for the design process, as a construct
for understanding customer requirements (CRs) and
establishing priorities of technical requirements (TRs) to
satisfy them (Gonzalez, 2001).
According to Gonzalez (2001), QFD is a product
development process that stresses cross-functional
integration. Kim et al. (1998) stated that QFD brings
the following advantages to companies: fewer and earlier
design changes, reduced product development cycle
time, fewer startup problems, and, above all, customer
satisfaction. Armacost et al. (1992) describe an analytic
hierarchy process (AHP) framework that has been
established for prioritizing requirements. Franceschini
and Rupil (1999) illustrate how the priority rank of
design characteristics can change depending on the type
of scales used. According to Ghiya et al. (1999), most
Americans associate QFD with the “house of quality.”
As discussed here, QFD contains far more. Clausing and
Pugh (1991) and Kim et al. (1998) provide more
extensive and complete views. Dean (1993) views QFD
as a system engineering process, which transforms the
desires of the customer into the language required for
implementing a product. It also provides the glue
120020770_QEN_016_001_R1_X0.ald 22/3/2003—DHANAJAYAN—66115
Gonzalez48
53
54
55
56
57
58
59
60
61
62
63
64
65
66
67
68
69
70
71
72
73
74
75
76
77
78
79
80
81
82
83
84
85
86
87
88
89
90
91
92
93
94
95
96
97
98
99
100
101
102
103
104

necessary to tie it all together. Finally, it is an excellent
method for assuring that the customer obtains high value
from the product. Mizuno and Akao (1994), in their
book, indicate that QFD is far more than has previously
been disclosed. It is clearly the mechanism for deploying
quality, reliability, cost, and technology throughout the
product, the project to bring forth the product, and the
enterprise as a whole.
Using QFD, there are two issues in the analysis of
the customer requirements. First, customer requirements
are often described informally using vague terms
(remember that the source of information in our case is
children). However, lack of a formal method for
interpreting the semantics of these requirements makes
it difficult to determine if a realization of the system
meets its customer’s needs. Second, identifying relation-
ships between requirements is often time consuming.
Sometimes, it is difficult to arrive at a group consensus
on a particular relationship between requirements
(Mazur, 1991a,b).
Quality, as well as ergonomics, aims at meeting the
demands of the customer. A high-quality product
therefore may be regarded as an ergonomic product—a
product adapted to human abilities and limitations
(Gonzalez et al., 1998). According to Nakui (1991), a
number of methods have been developed aimed at
simplifying and making the product development more
efficient. These methods could be used in ergonomics.
Quality function deployment is a well-known and
systematic method based on the idea of adapting
technology to people, a method that determines the
voice of the customers and examines the company
response to this voice through and organized team
approach (Day, 1993).
Quality function deployment adopts a customer-
driven approach and provides a structured way to ensure
that the final product meets customer requirements
(Parasuraman et al., 1985). The first QFD chart links
customer attributes and technical requirements through a
two-dimensional diagram.
Akao (1990) introduced QFD in Japan in 1966. He
said QFD is a method for translating the consumer’s
demand into design targets and major quality assurance
points to be used throughout the production phase.
Quality function deployment is a way to assure the
design quality while the product is still in the design
stage (Armacost et al., 1992). As an important side
benefit, Akao (1990) states that QFD has produced
reductions in development time of one half to one third.
Sullivan (1986) says that the main objective of any
manufacturing company is to bring products to market
sooner than the competition with lower cost and
improved quality and that QFD can help do this. Quality
function deployment provides a means of translating
customer requirements into the appropriate technical
requirements for each stage of product development (i.e.,
marketing strategies, planning, product design and
engineering, prototype evaluation, production process
development and production, sales). In QFD, all
operations are driven from the voice of the customer;
QFD therefore represents a change from manufacturing-
process quality control to product-development quality
control. Quesada (1997) showed several examples of
using TQM tools in order to discover the customer needs
and designed a methodology for prioritization of these
expectations.
Sullivan (1986) notes that QFD has been used by
Toyota since 1977, following four years of training and
preparation. Results have been impressive. Between
1977 and 1984, Toyota Auto-body introduced four new
van-type vehicles. Using 1977 as a base, Toyota reported
a 20% reduction in startup costs on the launch of the new
van in 1979, a 38% reduction in 1982, and a cumulative
61% reduction at 1984. During this period, the product
development cycle (time to market) was reduced by one
third with a corresponding improvement in quality,
because of a reduction in the number of engineering
changes.
Most of the literature on QFD is too simplified to
learn what it is or how to use it. On the other extreme, it is
difficult for a novice to launch into the real thing [See
Mizuno and Akao (1994)]. The Japanese articles tell us
where they were some years ago and where we need to be
now in the development and improvement of QFD
applications. Addresses for a number of companies
providing QFD software can be found in Scheurell
(1992) and Sorli et al. (1993) provide guidelines for
implementing QFD.
Several researchers have been working on
approaches for quality function deployment (Anon,
1994; Day, 1991; Mazur, 1991; Parasuraman et al., 1988;
Quinlan, 1991) and developed a number of interesting
models and applications using QFD as solution tool.Q1
Also, several researchers have been publishing different
applications in QFD (Bahill and Chapman, 1993;
Berglund, 1993; Bergquist and Aberysekera, 1996).
RESEARCH METHODOLOGY
The methodology used in the project presented in
this paper is shown in Fig. 1. During the stages describedF1
in the methodology, we used people from several
disciplines so that we could gather important information
120020770_QEN_016_001_R1_X0.ald 22/3/2003—DHANAJAYAN—66115
Quality Function Deployment 49
105
106
107
108
109
110
111
112
113
114
115
116
117
118
119
120
121
122
123
124
125
126
127
128
129
130
131
132
133
134
135
136
137
138
139
140
141
142
143
144
145
146
147
148
149
150
151
152
153
154
155
156

from all perspectives, from engineering to design. In this
paper, we are focusing in stage 2 and stage 3, since it is in
these two stages that we implemented the QFD
methodology. The purpose of applying QFD was to
define the most important variables and characteristics
for the final product based on the customers’ voice. As it
is known worldwide, QFD is a tool for ensuring that the
voice of the customer is deployed throughout the product
planning and design stages (Franceschini and Rupil,
1999).
Quality function deployment uses four “houses”
(represented in Fig. 2 by stages) to integrate theF2
informational needs of marketing, engineering, research
and development, and manufacturing and management
(Gonzalez, 2001) and is most commonly known by its
first phase or house, usually called “the house of quality.”
We are specifically interested in describing the first stage
of QFD for the scope of this paper, since it translates
customer needs for a product into technical requirements
(i.e., product design specifications). The following
houses or stages are presented in the figures without
detailed description of the development process, since
they are built in a similar way as the first house. Further
explanation of the construction of all four stages of QFD
is found in Gonzalez (2001). The challenges presented by
the QFD team were combined with identified design for
assembly and design for manufacturing principles to
create the project schedule and a flow plan for concurrent
engineering. Statistical process control of critical
machined dimensions was introduced to avoid tolerance
stack-up and performance variability. In order to help the
product development team make effective decisions in
satisfying the requirements of the customer within the
constraints of limited resources, the dynamic hierarchy
process model for QFD was used (Gonzalez, 2001). This
model fully utilizes all the information of the house of
quality, including the planning matrix for customer
requirements, the relation matrix between customer
requirements and technical requirements, and the
correlation matrix of technical requirements (see Fig. 3).F3
The development of the house of quality can be
considered as a five-step process, as described in Fig. 3.
The first step, voice of the customers (VOC), is a direct
retrieval of the customer requirements. This could be
Figure 1. Methodology applied.
120020770_QEN_016_001_R1_X0.ald 22/3/2003—DHANAJAYAN—66115
Gonzalez50
157
158
159
160
161
162
163
164
165
166
167
168
169
170
171
172
173
174
175
176
177
178
179
180
181
182
183
184
185
186
187
188
189
190
191
192
193
194
195
196
197
198
199
200
201
202
203
204
205
206
207
208

done by opened or closed interviews or surveys. It is
important not to lead the customers to the desired
answers but to allow them to express to the company
what they really want. The second step, “classification
and quantification of the VOC,” is a concise and
applicable qualitative description and the corresponding
quantitative presentation of the customers’ requirements.
We propose both dynamic analysis and factor analysis
methods in order to obtain the final importance ratings of
the customer needs. As expressed by Hair et al. (1998), a
factor analysis can be utilized to examine the underlying
patterns or relationships for a large number of variables
(as the ones given by the customers) and to determine
whether the information can be condensed or summar-
ized in a smaller set of factors or components. Applied to
our case, we used factor analysis in order to classify the
different requirements of the customers so that we could
decrease the number of variables in the house of quality.
Regarding the dynamic analysis method, we can assign a
numerical value to the different relationships among
variables. Therefore, the use of factor analysis in
conjunction with dynamic analysis will allow us to
organize the customer requirements in groups of
variables that will be easy to identify and define and
that will have numerical meaning for further quantitative
analysis. There are other methods for technical
requirements prioritization, as shown by Franceschini
and Rossetto (1995) and Franceschini and Rupil (1999),
instead of dynamic analysis; however, the innovative
approach of our analysis is to merge two strong statistical
tools such as factor analysis and dynamic analysis.
The third step in the development of the house of
quality is building the horizontal part of the matrix, which is
related to the customer requirements. This step is based on
the information analyzed in the previous step and is to be
include in a structured way into the matrix. Other
information is required such as level of importance,
competitor evaluation on these requirements versus our
evaluation from the customers, and other ratios that are
explained in detail in Quesada (1997). The fourth step is to
build the vertical part of the matrix that concerns the
customer requirements and technical requirements. More
specifically, we translate the customer requirements into
technical requirements understandable by the engineering
and design experts. We also assign the degree of the
relationship between customer and technical requirements
(strong, moderate, and weak) in the middle of the matrix.
Finally, the fifth and last step is to analyze the house of
Figure 2. Roadmap of the QFD project.
120020770_QEN_016_001_R1_X0.ald 22/3/2003—DHANAJAYAN—66115
Quality Function Deployment 51
209
210
211
212
213
214
215
216
217
218
219
220
221
222
223
224
225
226
227
228
229
230
231
232
233
234
235
236
237
238
239
240
241
242
243
244
245
246
247
248
249
250
251
252
253
254
255
256
257
258
259
260

quality. This stage is very important since we will
determine which customer requirements will be
implemented into the process as technical requirements
due to their importance for the customers. There will be
some customer requirements that are really impossible or
very expensive to implement in the process; therefore, a
decision should be made in order to determine which
technical requirements will continue in the analysis of the
other matrixes of QFD. A more detailed explanation of the
process of building the house of quality is found in Quesada
(1997).
This paper suggests a knowledge-based approach to
building a QFD project and the identification and
presentation of the most important factors in the school
Figure 3. The house of quality methodology (Quesada, 1997).
120020770_QEN_016_001_R1_X0.ald 22/3/2003—DHANAJAYAN—66115
Gonzalez52
261
262
263
264
265
266
267
268
269
270
271
272
273
274
275
276
277
278
279
280
281
282
283
284
285
286
287
288
289
290
291
292
293
294
295
296
297
298
299
300
301
302
303
304
305
306
307
308
309
310
311
312

furniture process. The detailed scientific analysis was
accomplished with the aid of QFD (phase I, II, III, and
IV). The common requirements, characteristics, and
parameters of change management were entered into a
full QFD matrix as what’s and how’s (“what” needs to be
done and “how” it can be achieved). This led to a list of
factors ranked in order of importance and prioritized. The
importance number (weighting factor) entered into the
QFD matrix for the what’s was calculated based on a
survey gathered from 400 Costa Rican school students
responding from seven different states (provinces). This
research provided valuable information on the most
important parameters, identified methods that needed to
be changed, and secured the commitment of management
to quality.
THE QFD APPLICATION
One of the major difficulties of using QFD is the
large size of the charts, which increases as it increases the
number of variables involved in the process. Even for a
simple product design, the size can grow rapidly. This
requires a large amount of time to fill out the QFD charts.
The modeling approach presented in Fig. 3 provides a
formal structure and solution approach to QFD for the
school furniture problem. The model starts with the voice
of the customer, which is translated into the house of
quality as customer requirements. We used a survey
applied to users (elementary, middle, and high school
students). From the survey and personal interviews, we
reunited 480 customer requirements (step 1 in Fig. 3).
However, it is not possible nor understandable to include
all of them in the matrix. Therefore, we performed
different statistical analyses, such as dynamic analysis
and factor analysis, in order to classify and decrease
those customer requirements (step 2 in Fig. 3). In Table 1,T1
we can see a middle step of the classification process,
since we show how the 480 customer requirements were
put into 28 variables. However, further data reduction is
needed, as we will see in the final house of quality. For
this stage, we used dynamic analysis, factor analysis, and
the Delphi method (with the help of the manufacturer’s
design and production areas, the QFD team, and the
people involved in the educational system). We ended up
with two factors (chair-related requirements and table-
related requirements), as shown in Fig. 4 under customerF4
requirements, which are grouping 12 variables in total
that conceive the 28 variables we mentioned before.
Table 1 depicts the customer requirements that the QFD
team selected from the first screening and the number of
variables related to them from the original data.
Using dynamic analysis (Gonzalez, 2001), a level of
importance was assigned to each requirement. In this
section of the product planning stage (step 3 in Fig. 3), the
number of complaints, the different goals (targets), and
the evaluation of the different competitors were
considered. This matrix shows a comparison of our
company’s capabilities of satisfying the customer
requirements with the capabilities of other companies
that manufacture school furniture. Other information is
summarized in the house of quality such as the sales point
(the requirements in which the company has the ability to
Table 1. Process planning matrix.
Customer need
Variables
related
Customer
weighting
Unsatisfactory or unfit for
intended uses
17 15
Inconveniences for changing
room settings
19 16
Poor, wrong, or nonexistent
production methods
17 28
Cannot serve for multiple
purposes
16 14
Storing and transportation
problems
15 13
Expensive imported
materials
14 27
Split or delaminated boards 18 26
Rough working surfaces 18 12
Loose joints 16 23
Weak structures 14 24
Deformed shapes 14 25
Plain color 16 22
Plain shape 12 21
Flat seats 16 9
Inadequate back support 18 10
Seats, working surfaces only
one height
12 11
Availability 10 17
Handicap population 22 6
Technical features 24 4
Heavy 26 3
According to population
measurements
28 7
Standard design 20 18
Standardized materials 26 19
Quality control procedures 21 20
Easy to handle 25 1
Wide drawer 26 5
Wide support 24 8
Seat with foam 25 2
Total 480
120020770_QEN_016_001_R1_X0.ald 22/3/2003—DHANAJAYAN—66115
Quality Function Deployment 53
313
314
315
316
317
318
319
320
321
322
323
324
325
326
327
328
329
330
331
332
333
334
335
336
337
338
339
340
341
342
343
344
345
346
347
348
349
350
351
352
353
354
355
356
357
358
359
360
361
362
363
364
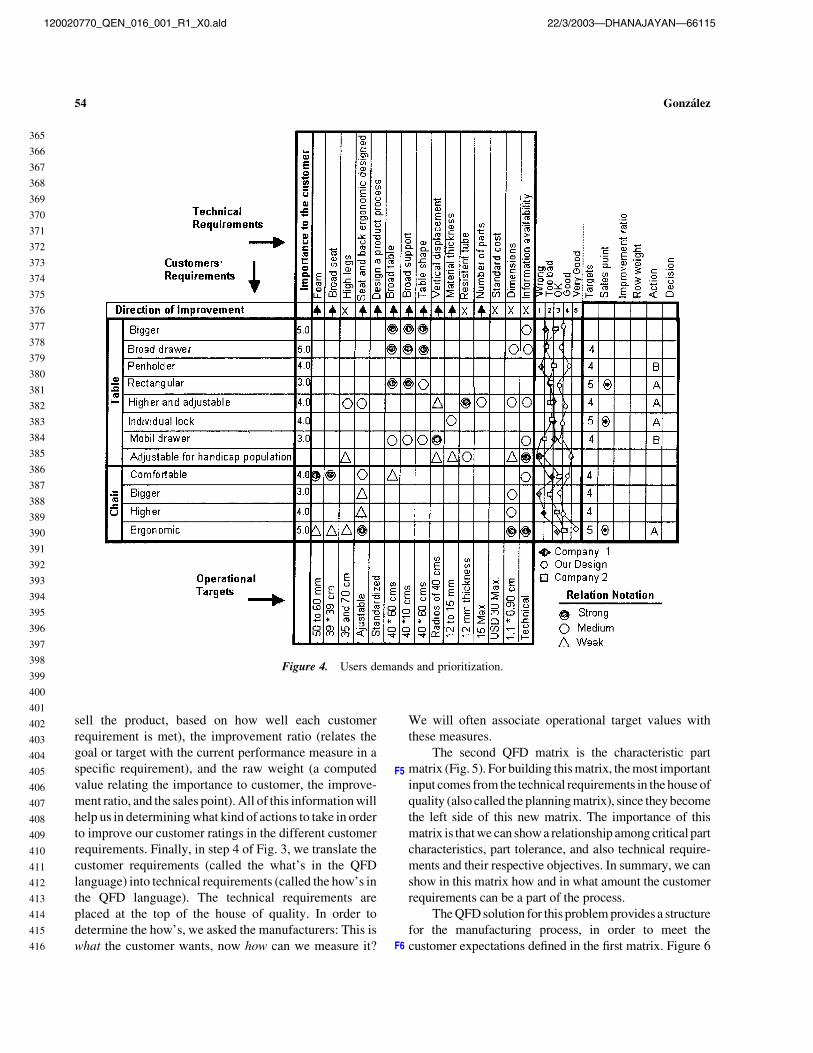
sell the product, based on how well each customer
requirement is met), the improvement ratio (relates the
goal or target with the current performance measure in a
specific requirement), and the raw weight (a computed
value relating the importance to customer, the improve-
ment ratio, and the sales point). All of this information will
help us in determining what kind of actions to take in order
to improve our customer ratings in the different customer
requirements. Finally, in step 4 of Fig. 3, we translate the
customer requirements (called the what’s in the QFD
language) into technical requirements (called the how’s in
the QFD language). The technical requirements are
placed at the top of the house of quality. In order to
determine the how’s, we asked the manufacturers: This is
what the customer wants, now how can we measure it?
We will often associate operational target values with
these measures.
The second QFD matrix is the characteristic part
matrix (Fig. 5). For building this matrix, the most importantF5
input comes from the technical requirements in the house of
quality (also called the planning matrix), since they become
the left side of this new matrix. The importance of this
matrix is that we can show a relationship among critical part
characteristics, part tolerance, and also technical require-
ments and their respective objectives. In summary, we can
show in this matrix how and in what amount the customer
requirements can be a part of the process.
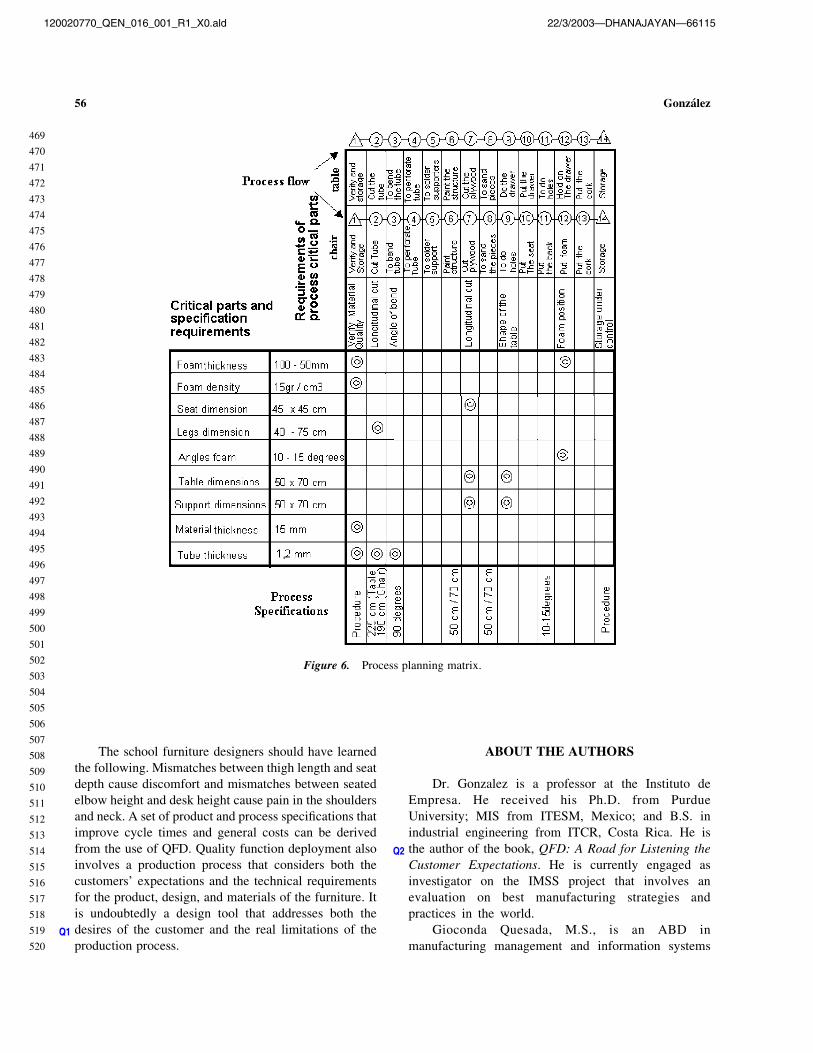
The QFD solution for this problem provides a structure
F6
for the manufacturing process, in order to meet the
customer expectations defined in the first matrix. Figure 6
Figure 4. Users demands and prioritization.
120020770_QEN_016_001_R1_X0.ald 22/3/2003—DHANAJAYAN—66115
Gonzalez54
365
366
367
368
369
370
371
372
373
374
375
376
377
378
379
380
381
382
383
384
385
386
387
388
389
390
391
392
393
394
395
396
397
398
399
400
401
402
403
404
405
406
407
408
409
410
411
412
413
414
415
416

depicts the process planning matrix for the school furniture
problem in which the technical requirements from the
previous matrix (characteristic part matrix) become the
new input for the left column. Here the QFD team defined
the process specifications for each critical requirement and
assessed the relationship between the critical requirements
and specifications. Another important part in this matrix is
the definition of the critical requirement process specifica-
tions. For now, a standardized design process can be used in
Costa Rican furniture industries in the development and
manufacture of the school furniture.
Finally, using the information that comes from
matrices 1, 2, and 3 (Figs. 4, 5, and 6, respectively), the
production requirement matrix can be created and a
detailed production plan for the elaboration of any amount
of school furniture can be done. This matrix shows the
different stages of the manufacturing process for both
chairs and tables (see Fig. 7). Figure 7 also provides a riskF7
analysis for each activity. Complete requirement planning
is provided on this matrix along with the production
organization of material and human resources needed on
the construction of any piece of school furniture.
CONCLUSIONS
The school furniture case revealed that QFD theory
could be a very inspiring source for improvements in
a manufacturing system, helping out not only in the cost
reduction but also the design of products, processes, and
procedures. This paper has presented a methodology that
includes nontraditional approaches in the QFD theory,
such as the joint use of factor analysis and dynamic
analysis. Several methods used for product development
depend on cooperation between the designer and the
user. In the present study, the customer requirements
were crucial to the final design of the furniture. By using
the QFD methodology, the customer requirements are
mapped out and integrated into the total product
development process.
The use of factor analysis allowed us to reduce the
amount of customer requirements in a structured form,
considering the previous analysis and the relationships
discovered in the dynamic analysis—another concept
introduced in our methodology that allowed a detailed
analysis of each customer expectation. Both concepts
were of great value in our analysis because they
permitted us to know in detail the process and the real
requirements of the customers and, in combination with
other tools, to select the right groups of requirements for
the house of quality analysis.
The analysis presented in this paper allowed us to
find details of the design and production of new school
furniture. Specifically, details related to technical parts
and production requirements. This will permit us to do
better strategic planning of the materials, stages, and
processes required for the production of the school
furniture, while minimizing the cost and improving the
quality and the productivity of both the product and the
process.
This paper was written for two classes of readers:
QFD practitioners and school furniture designers. The
QFD practitioners should have learned the use of
nontraditional tools in the challenging process of
finding homogeneity in the customer requirements.
These tools include the hierarchy dynamic process.
Quality function deployment never ends in the
product-planning matrix. It goes beyond to the
development of the four matrices that will make it
possible to design not only a product that satisfies and
exceeds customer expectations but a product that
considers the limitations of the production process.
The design of the four QFD matrices empowers the
generation of important product and process specifi-
cations, which will impact the final product cost. The
initial cost of traditional school furniture is between
$50 and $56. The new design, based on the results of
QFD, brings the cost down approximately 50% to
$29.87.
Figure 5. Characteristic part matrix.
120020770_QEN_016_001_R1_X0.ald 22/3/2003—DHANAJAYAN—66115
Quality Function Deployment 55
417
418
419
420
421
422
423
424
425
426
427
428
429
430
431
432
433
434
435
436
437
438
439
440
441
442
443
444
445
446
447
448
449
450
451
452
453
454
455
456
457
458
459
460
461
462
463
464
465
466
467
468
The school furniture designers should have learned
the following. Mismatches between thigh length and seat
depth cause discomfort and mismatches between seated
elbow height and desk height cause pain in the shoulders
and neck. A set of product and process specifications that
improve cycle times and general costs can be derived
from the use of QFD. Quality function deployment also
involves a production process that considers both the
customers’ expectations and the technical requirements
for the product, design, and materials of the furniture. It
is undoubtedly a design tool that addresses both the
desires of the customer and the real limitations of theQ1
production process.
ABOUT THE AUTHORS
Dr. Gonzalez is a professor at the Instituto de
Empresa. He received his Ph.D. from Purdue
University; MIS from ITESM, Mexico; and B.S. in
industrial engineering from ITCR, Costa Rica. He is
the author of the book, QFD: A Road for Listening theQ2
Customer Expectations. He is currently engaged as
investigator on the IMSS project that involves an
evaluation on best manufacturing strategies and
practices in the world.
Gioconda Quesada, M.S., is an ABD in
manufacturing management and information systems
Figure 6. Process planning matrix.
120020770_QEN_016_001_R1_X0.ald 22/3/2003—DHANAJAYAN—66115
Gonzalez56
469
470
471
472
473
474
475
476
477
478
479
480
481
482
483
484
485
486
487
488
489
490
491
492
493
494
495
496
497
498
499
500
501
502
503
504
505
506
507
508
509
510
511
512
513
514
515
516
517
518
519
520

at the University of Toledo. During the last two years,
she has worked as an adjunct professor at the graduate
business school in Instituto de Empresa, Spain. She
focuses her current research in information systems
and supply chain management.
Dr. Terry Bahill is a professor at the University of
Arizona. He received his Ph.D. from the University
of California, his M.S. from San Jose State
University, and his B.S. from the University of Arizona.
Bahill has over 200 publications. Over the past decade,
he has spent 36 months working on IPD and systems
engineering with several industrial companies in
Arizona, New Mexico, Minnesota, Washington, and
Idaho.
REFERENCES
Akao, Y. (1990). Quality Function Deployment: Integrating
Customer Requirements into Product Design. Translated by
Glenn Mazur Cambridge. MA: Productivity Press, pp. 1–15.
Anon. (1994). Designing for customer satisfaction. Manag.
Decision 32(5):27–36.
Armacost, R. L., Componation, P. J., Mullens, M. A., Swart,
W. W. (1992). Customer requirements in industrialized
housing. Proc. Am. Soc. Civil Eng. Orlando, FL 48–58.
Bahill, A. T., Chapman, W. L. (1993). A tutorial on quality
function deployment. Eng. Manag. J. 5(3):24–35.
Berglund, R. L. (1993). QFD a critical tool for environmental
decision making. ASQC Quality Congress Transactions.
Boston, MA: ASQC, pp. 126–132.
Figure 7. Production requirement matrix.
120020770_QEN_016_001_R1_X0.ald 22/3/2003—DHANAJAYAN—66115
Quality Function Deployment 57
521
522
523
524
525
526
527
528
529
530
531
532
533
534
535
536
537
538
539
540
541
542
543
544
545
546
547
548
549
550
551
552
553
554
555
556
557
558
559
560
561
562
563
564
565
566
567
568
569
570
571
572

Bergquist, K., Aberysekera, J. (1996). Quality function
deployment (QFD) a means for developing usable
products. Int. J. Ind. Ergon. 18:269–275.
Clausing, D., Pugh, S. (1991). Enhanced quality function
deployment. Design and productivity. In: Proceedings
of International Conference, Honolulu HI, Feb 6–8,
pp. 17–32.
Day, R.G. (1991). Using the QFD concept in non-product
related applications. Transactions from the Third
Symposium on Quality Function Deployment, MI,
pp. 231–242.
Day, R. G. (1993). Quality Function Deployment: Linking a
Company with Its Customers. Milwaukee, WI: ASQC
Quality Press, pp. 2–3.
Dean, E.B. (1993). Quality function deployment for large
systems. Transactions of the Fifth Symposium on Quality
Function Deployment, MI, pp. 35–40.
Franceschini, F., Rossetto, S. (1995). QFD the problem of
comparing technical-engineering requirements. Res. Eng.
Design 7:270–278.
Franceschini, F., Rupil, A. (1999). Rating scales and
prioritisation in QFD. Int. J. Qual. Reliab. Manag.
16(1):85–97.
Ghiya, K. K., Bahill, A. T., Chapman, W. L. (1999). QFD:
validating robustness. Qual. Eng. 11(4):593–611.
Gonzalez, M. (2001). QFD; A Road to Listening to CustomerQ3
Needs. 1st ed. Mexico: McGraw-Hill, pp. 42–50, 69–77,
107–126 .
Gonzalez, M., Rivas, S., Sanchez, O., Conejo, M. (1998). AQ3
Costa Rican National Problem; The School Furniture
Situation. Technical Report. Cartago, Costa Rica: Institute
of Technology of Costa Rica, pp. 12–17, 22–38.Q4
Hair, J., Anderson, R., Tatham, R., Black, W. (1998).
Multivariate Data Analysis. 5th ed. Englewood Cliffs,
NJ: Prentice Hall International, pp. 87–138.
Kim, J. K., Choi, S. H., Kim, S. H. (1998). A knowledge-based
approach the quality function deployment. Comput. Ind.
Eng. 233–236.
Mazur, G. (1991a). Getting the voice of the customer.
Transactions of the Third Symposium on Quality Function
Deployment, MI, 1991a; pp. 516–521.
Mazur, G. (1991b). Voice of the customer analysis and other
recent QFD technology. Transactions of the Third
Symposium on Quality Function Deployment, MI,
1991b; pp. 493–501.
Mizuno, S., Akao, Y. (1994). QFD: The Customer-Driven
Approach to Quality Planning and Development. Avail-
able from Quality Resources, One Water Street, White
Plains, NY. Tokyo, Japan: Asian Productivity Organiz-
ation.
Nakui, S. (1991). Gaining a Strategic Advantage: Implementing
Proactive Quality Function Deployment. Transactions
from the Third Symposium on Quality Function Deploy-
ment. Dearborn, MI: American Supplier Institute,
pp. 362–368.
Parasuraman, A., Zeithaml, V. A., Berry, L. L. (1985). A
conceptual model of service quality and its implications
for future research. J. Marketing 49(1):26–31.
Parasuraman, A., Zeithaml, V. A., Berry, L. L. (1988).
SERVQUAL: a multiple-item scale for measuring
consumer perceptions of service quality. J. Retailing
64(1):42–46.
Quesada, G. (1997). Design of Quality Strategies Focused on
Customer Service (ECSEC). Unpublished dissertation,
Cartago, Costa RicaInstitute of Technology of Costa Rica
50–57.
Quinlan, J. (1991). Filling in the blanks: QFD and technical
optimisation. Transactions from the Third Symposium
on Quality Function Deployment, MI. Dearborn, MI:
American Supplier Institute, pp. 200–216.
Scheurell, D. M. (1992). Taking QFD through to the production
planning matrix: putting the customer on the line.
Transactions from the Fourth Symposium on Quality
Function Deployment, MI. Dearborn, MI: American
Supplier Institute, pp. 532–543.
Sorli, M., Ruiz, J., Goiri, Z. (1993). QFD applied to R&D
activities. Transactions from the Fifth Symposium on
Quality Function Deployment, MI. Dearborn, MI:
American Supplier Institute, pp. 197–205.
Sullivan, L. P. (1986). Quality function deployment. Qual.
Prog. 39–50.
120020770_QEN_016_001_R1_X0.ald 22/3/2003—DHANAJAYAN—66115
Gonzalez58
573
574
575
576
577
578
579
580
581
582
583
584
585
586
587
588
589
590
591
592
593
594
595
596
597
598
599
600
601
602
603
604
605
606
607
608
609
610
611
612
613
614
615
616
617
618
619
620
621
622
623
624