Improving Patient Flow in Obstetrics Client: Los Barrios ...€¦ · Executive Summary Los Barrios...
56
Improving Patient Flow in Obstetrics Client: Los Barrios Unidos Community Clinic Senior Design: Spring 2017 By Harvey Hauw and Shorjoe Bhattacharya
Transcript of Improving Patient Flow in Obstetrics Client: Los Barrios ...€¦ · Executive Summary Los Barrios...

Improving Patient Flow in Obstetrics
Client: Los Barrios Unidos Community Clinic
Senior Design: Spring 2017
By Harvey Hauw and Shorjoe Bhattacharya


Table of Contents Executive Summary ...................................................................................................................... 2
Project Background: ..................................................................................................................... 3
Collecting Data .............................................................................................................................. 4
Sources of Data .............................................................................................................................. 7
Patient Types ................................................................................................................................. 7
Types of Employees....................................................................................................................... 8
The Statistical Analysis of the Data ............................................................................................. 9
MedModel Software .................................................................................................................... 11
Various Components of MedModel: ......................................................................................... 11
Patient Flow:................................................................................................................................ 13
Analysis and Recommendations ................................................................................................ 17 � Recommendation 1 ...................................................................................................................... 18 � Recommendation 2 ...................................................................................................................... 18
Ideal Arrival Distribution .......................................................................................................... 19
Next Phase in this project ........................................................................................................... 21
Appendix ...................................................................................................................................... 22
Med Model Code ......................................................................................................................... 23
Med Model Output ..................................................................................................................... 40

2
Executive Summary Los Barrios Unidos Community Clinic is clinic located in West Dallas. LBUCC offers services
in many different healthcare sectors including pediatric care, behavioral health, and obstetrics.
The focus of this project was in the obstetrics department. At this clinic, the obstetrics
department was having an issue where patient satisfaction was dropping due to long wait times
leading to long appointment durations.
Our senior design team was tasked with collecting time and motion data, mapping out current
workflows of the clinic, running a simulation model and then analyzing the results. We collected
data with a simple yet effective time and motion study where we asked the individual patients to
log their times as they went station to station in the clinic. We also learned the workflows and
layout of the clinic by talking to staff members at the location. All this information was taken
and inputted into “MedModel” (specialty healthcare facilities simulation software) which ran the
simulation of the Obstetrics Wing. With the simulation results we know there is a way to reduce
wait times to improve the patient experience at LBUCC. If these recommendations are
implemented properly it could significantly reduce wait times without large expenditures.

3
Project Background: Los Barrios Unidos Clinic’s Obstetrics Department provides fantastic care to its female patients
according to surveys, but these patients have been experiencing long wait times during the start
of the appointment and in between different stages of the appointment. Patients often have to
return to the waiting room, and during those periods there patients are unsure about when they
will be called be back into the obstetrics wing to continue their appointment. This long waiting
experience decreases patient satisfaction and this causes them to be reluctant to choose LBUCC
for their pediatric care, when they have their baby. This is a problem because more than three-
fourths of LBUCC’s patients live under the poverty line, so patient payment rates for obstetrics
visits are not very high. But, if a patient comes in for Pediatric Care, even if a patient can’t pay
the Medicare or Medicaid will cover the cost and the hospital will generate revenue. This means
that a great obstetrics experience is key for a hospital to generate revenue as LBUCC needs
patients to choose LBU for pediatric care after their OB care.
The primary purpose of this project was to work with LBUCC to create a simulation model of
their current Obstetrics Clinic using build simulation software called Med Model. Our group
used the LBUCC obstetrics floor plan as the base layout for the model. This simulation’s goal
was to identify the actual bottlenecks that were clogging the system, and test solutions that could
be used to reduce those bottlenecks and not create new ones. The goal of this simulation was to
provide LBUCC with possible recommendations that could reduce wait times.
The data used for this model was collected from patient process time logs where we had patients
documenting and logging their appointments.

4
Collecting Data We had many different ideas to collect data but we ended up choosing the simplest method to
collect data. Those methods are listed next:
• Camera Method: Initially our idea was to place camera just outside the waiting room
door and record the entering and exiting of the patients. Each patient would be given a
color-coded lanyard to match the patient type. For example in this method, the first time a
type blue patient entered through the door we would record the time on the clock which
would be in the background of the video camera view. Then when the same patient came
out, we would note the exit time. Thus, we would know they finished that stage of the
appointment process. This method had a flaw in it because we would be assuming the
patient never directly completed two stages in the appointment process (like from exam
room direct to sonogram room), but always came to the waiting room. We would also be
assuming there was no additional unexpected delay that happened in the OB wing that we
did not see.
• RFID Method: Another idea we had was placing an RFID tag in each station, then have
the physicians nudge the patient's get near enough to the tags so the time is automatically
documented for that station. This would have been the most accurate method because we
would know exactly how long the patient would be at each stage. Unfortunately, we did
not have the resources to design this system.
• Patient Self Record System: Eventually our team ended up using the simplest data
collection method with a prize incentive. We gave each patient a document indicating all
possible stations they may go through and asked them to record their start and end times
at each of those stations. People who filled in their documents were then entered in a
raffle to win a prize. This system was effective because we even got to identify the
patient’s wait times between stations so we could identify the average amount of time
each person was waiting and where this wait was occurring. The form on the next page is
the type of form we used to collect data.

5

6

7
Sources of Data
• Patient time logging: Patient's logged their hospital visits in a form that we designed
(above). We took this date and inputted it into an excel spread sheet and analyzed it.
• EHR Software: Carlos averaged data sets to get arrival rate data for us, so we know how
many patients are arriving are daily and at about what time they are arriving.
• Carlos Ruiz: Carlos is an LBUCC employee and he provided us with a significant
amount of information regarding patient processes, patient types, estimated procedure
times, and resource shift schedules per day.
• Student Observation: When data collection was going on with patients who were filling
the logs a team of global health students were stationed at LBUCC and they were
observing the procedure and ensuring the patients filled out the form correctly.
Patient Types
• New Patient: These patients come one day to do paperwork and then return scheduled on
another day to go through the obstetrics procedure. These patients go through all stations
for an OB appointment. There appointments are the longest type of appointments. New
patients make up the 2nd highest part of the patient flow, but it is still less then 15% of the
patient flow
• New Patient Without Sonogram: These patients also come one day to do paperwork
and then return scheduled on another day to go through the obstetrics procedure. These
patients are classified in the clinical records as new patients, but procedurally these
patients do not go through the sonogram station, but go through all other stations for an
OB appointment. This type of patient makes the lowest type of the patient flow at below
8%
• Follow Up: These patients are coming primarily to meet the provider and see if their
pregnancy period is coming along well. These appointments are relatively simple and
most of the time the baby is healthy so these are not very time consuming appointments.
This type of appointment makes up highest part of the patient flow at more than 70%.

8
• Only Sonogram Patient: These are patients that are only coming to meet the sonogram
doctor and run a sonogram test. This appointment is the most simple one. This type of
appointment makes up the 2nd smallest part of the patient flow at below 10%.
Types of Employees The employees who run operations in the obstetrics department consists of providers, nurse
practitioners, medical assistants, check-in desk attendants, and sonogram doctors. This
simulation records the operational activity that each staff member executes on a patient.
• Check-In Desk Attendant: This attendant takes proper documentation as the patient
arrives for their appointment. They verify information such as insurance information.
This attendant directs the patient to the main waiting room until their scheduled
appointment time
• Medical Assistant (MA): This type of assistant in involved in much of the patient
process. They do everything from taking vitals, walking the patient around, and
scheduling them for their next check-up appointment. These assistants are the ones who
send the patient back to the waiting area or send the patient directly to the next stage of
their appointment.
• Provider: This is the main doctor who spends time with the patient in the exam room.
They also chart the appointment for each patient. The provider’s job is to ask the patient
questions and analyze results from basic tests
• Sonogram Doctor: This doctor operates the sonogram machine. This doctor is an expert
in the sonogram machine and does nothing else except interpret results and run it..
• Nurse Practitioner: A nurse practitioner can handle about 80% of the patient cases that a
provider can. So, they can also meet patients and speak to them about their pregnancy.
Only when there is a complication in obstetrics will they defer to a full-time provider.
All the staff members listed above also do other jobs such as additional paperwork, entering of
data, and unexpected tasks which will arise if the problem has special problems. These special
case tasks have been omitted from the model as they do not always effect the patient.

9
The Statistical Analysis of the Data MedModel software can run simulation with fixed constant numbers and a wide variety of
different distributions to simulate and run events like patient arrival cycles, operational time to
complete a procedure, and even the number of kids or other family that come with a patient.
After our team collected and entered data for each procedure in excel we calculated the
distributions using MedModel’s statfit tool. After doing this the computer gave distributions and
then gave us the reliability score of the distributions. All distributions graphs are included at the
end.
• Arrivals: We were given arrival data but the data was not clear, and we were not able to
easily distinguish the numbers and calculate the arrival rates. Instead we fixed the number
of patient arrivals on a day on a certain value which was calculated from an average of
multiple days. For example, we said on Thursday, there would be 89 patients arriving.
We got 89 from an average of 5 different recent Thursday’s and set it at 89. Our arrival
cycles were also not extremely accurate. We were given the number of patients that
arrived in the first 5 hours of a day, and the number that arrived in the next 3 hours and
then finally the last 2 hours. This allowed us to input arrival cycles for the patients so we
knew when larger number of patients were arriving.
Time of Day Percent of Patients Arriving Between these hours
Average Morning (7:00-12:00)
59%
Average Afternoon (12:00-15:00)
21%
Average Evening (15:00-17:00)
19%
• Check-In Process: Carlos Ruiz gave us an estimated time on the registration process and
we confirmed the registration time from our data collection. There was not a selectable
distribution for this stage so we fixed the numbers based on the number of forms the
patient had to complete. On average, it takes patients about 1.5 minutes to register, with a

10
standard deviation of 0.5 minutes. The check-in process time did not fluctuate in most
cases.
• Urine Sample: This data was also collected from our data collection method. The
distribution for this step is normal. There was not much variation in this process, as the
mean was 3.5 minutes and standard deviation was 1.8 minutes.
• Vitals: The procedure of this consists of taking blood pressure, measuring heart rate, and
doing other vital tests. This data was collected from our data collection method we
executed. The selected distribution for this procedure is normal. There was a little more
variation in this process, as the mean was 2.8 minutes and standard deviation was 2
minutes.
• Meet with Provider: This data was taken from our data collection procedure. Simply
the patient discussed their current situation regarding their pregnancy with the provider. It
fit a normal distribution with a mean of 13.9 minutes and a standard deviation of 11.9
minutes.
• Sonogram: This data was collected by our data collection procedure. This procedure is
also standardized and followed a normal distribution with a mean of 17.5 minutes and
standard deviation of 9.8 minutes.
• Next Appointment Scheduling: This data was collected by our data collection
procedure. This procedure is fixed without a distribution with a mean of 3 minutes.
• Patient User Distribution: This data was given by Carlos Ruiz based on the EHR arrival
schedules. It told us the distribution of the various patient types. The distribution is in the
table below:
Patient Type Percent of Patients (Must Add Up to 100%) New Patient 12% New Patient Without Sonogram
7%
Follow Up 72% Only Sonogram Patient 9%

11
MedModel Software Our software of choice MedModel, made by ProModel. This software is custom designed
simulation software used to handle and simulate clinics, hospitals and other medical buildings so
they can be improved. LBUCC gave us the floor plan of the obstetrics wing and based on that
our team designed the locations, and subject path networks throughout the OB department. This
software allowed us to make the obstetrics wing have all the moving parts that move daily
through it. MedModel software is so detailed it even allows us to define custom walking speed of
staff when moving with a patient or moving without. In our simulation model the 4 patient types
move from their respective location to location based on workflow which was entered
individually into processing based on patient type. The resources of the model, are the doctors
and nurses can move with a patient or meet a patient at a certain location to execute their duty.
This software allows us to observe the movement of the patients and resources to see if they are
going to the right locations and then it tells us the results of the simulation.
Various Components of MedModel:
• Locations: In this place, each operation is done to an entity whether it be talking to the
doctor or taking vitals or even waiting.
• Entities: These are the main figures that flow through the model and have operations and
work done on them. Entities are the patients of the model. In the next section, more
detailed information is given regarding patient types and flows.
• Processing: This is the core portion of the model that inserts logic and maps out the
patient flow. There are 2 major parts of processing: movement and operation at a location
and routing to the next location after operation is complete. Most of the logic is inserted
here.
• Resources: These are the staff members in the obstetrics clinic. The people are providers,
MA’s, check-in desk attendants, and the sonogram doctor .
• Path Networks: Entities and resources move through the model on these paths. In some
models entities and resources move on the same path network and in others it is different.
• Arrivals: These dictate the frequency and occurrence of the arrivals and state how many
patients arrive over a certain period.

12
• Attributes: These are certain custom characteristics that can be applied on an entity. In
this model this included if patients have filled forms, met the provider, and whether they
are a type 1,2,3, or 4 patient.
• Variables: These are place holders that represent numeric values that change. In this
model the variables kept count of number of patients processed, and the number in the
waiting room.
Locations
• Patient Entrance: This is the place where all the patients enter the simulation flow.
After walking upstairs this is the place where the patients can enter the obstetrics wing
• Wait_Q: This is the place where patients will wait until the check-in desk is free
• CheckIn_Station_1: This is where the patients verify forms and fill out forms if needed.
The patients will then wait in the waiting room until called in.
• Waiting_Room_A: This is where the patients wait until they are called in for their
appointment.
• Bathroom_X: This is where patients create their urine sample.
• Exam_Room_X: In the exam room the MA takes patient vitals such as blood pressure,
temperature, heart rate, etc. The patient will also meet the provider in this room to discuss
their current situation.
• Check_Up_Q: After vitals if the patient is waiting for the provider to come and meet
with them, the patient will wait in this line.
• Sonogram_Room: This room is where the patient meets the sonogram doctor and uses
the machin.e
• Sono_Q: If after vitals the sonogram room is busy the patient will wait in this line to
meet the sonogram doctor.
• Follow_Up_Desk_1: After the patient finishes the appointment they go to this follow up
desk to meet an MA and schedule the next one.
• Exit: The patients leave the model from here

P E
m
Patient Flow
Each type of pat
movements of th
w:
tient has a few d
he 4 types of pa
different alterna
atients.
atives to take thr
13
rough the modell. The flow charrts below show aall the possible

14

15

16

17
Analysis and Recommendations Initially this model had several bugs in it, but over the course of the semester we were able to fix
those bugs, which made the model start running properly. The model was tested several times to
see if the output time data was matching or close to the actual collected time data. Meaning we
were checking to see if the estimated average time to complete an appointment was estimated to
be close to our simulated time.
When we first began running the simulation we ran it for each day of the week. The resource
deployment times varied but LBU ran 2 check-in desk attendants, 1 sonogram doctor, 5 to 9
medical assistants, and 2 to 4 providers per day. Each day at LBUCC ran 7AM to 5PM so we ran
our simulation for that period.
The first problem we found had to do with over utilization of providers which led to patients
finishing after the 5PM closing time. Sometimes LBU has 2 providers stationed during part of
the day. So, we based on the model we found out that if LBU stationed 2 providers throughout
the day for a week they would on average be utilized 82.58% per week. Even at such a high
utilization rate on average about 24 patients per day were not finishing their appointments by the
end of the day at 5pm and were finishing later, so patients and resources waited longer and left
later each day. With 3 providers placed at all times throughout the day for a week they were
being used at a utilization rate of 76.16%. With 3 providers on average about 6.4 patients were
finishing after 5PM. We next found that adding another additional provider (4 providers total) at
all times helped reduce patient wait times and brought the provider utilization levels of 56.60%
with only about 3.2 patients per day finishing after 5pm. This meant that adding a 3rd provider at
all times and sometimes bringing in a 4th provider during certain heavy shifts, it would be easier
to reduce the load and ensure few patients finish after 5PM.
Another issue was with the MA utilization. LBU has a ratio where they operate 2 MA’s for every
provider so when we added provider to the simulation but did not add 2 more MA’s, the waiting
times slightly fell but MA utilization rate skyrocketed. This could be a problem that could lead to
a reduction in MA productivity. Thus, it does not seem to be an efficient idea to increase number
of providers without also increasing the number of MA’s by at least one. See the following chart
to compare:

18
Resources MA Utilization 5 MA’s and 2 Providers 66.4% (Highest Wait
Times, see below)
5 MA’s and 3 Providers 83.5% (Wait times only slightly drop-run model to see results)
6 MA’s and 3 Providers 63.3% 7 MA’s and 3 Providers 59.9%
Based on this table it looks like adding a single MA instead of two could give an optimal balance
where the MA’s are being properly utilized and cost is being kept down. Thus, if 3 providers are
working 6 MA’s may be optimal
So, for resource allocation we believe there are 2 recommendations depending on clinic priorities:
• Recommendation 1 is to deploy at least 3 providers and 7 MA’s always throughout the
week. When this happens average time in system drops to only 56.03 minutes from 87.67
minutes when only 2 providers are working. LBU sometimes runs 2 providers and
sometimes 3 providers during the day, so the wait times will actually be in between
56.035 and 24.645. But, according to LBU shifts nearly half the week is operated with 2
providers and according to staff providers also arrive late. This means the wait times will
be closer to 56.035 minutes than 24.465. So, having a 3rd provider at all times will ensure
wait times are at 24.645 minutes or less. The 3rd provider will also ensure very few
patients finish their appointments after 5PM.
• Recommendation 2 is to have a 4th provider and 2 more MA’s on standby that can be
deployed on certain shifts when there is high volume of patients, particularly on certain
mornings. As described in the beginning of this section, provider utilization rates are very
high when only 3 are working, so a 4th one during certain shifts will further reduce wait
times.

19
The table below has the data used for the recommendations listed above.
Resources Time in System (min) Time in Operation (min)
Wait time (min)
5 MA’s and 2 Providers 87.67 31.635 56.035
7 MA’s and 3 Providers 56.033 31.388 24.645
9 MA’s and 4 Providers 51.106 32.3505 18.755
In regards to arrival distribution LBU was having a problem where too many patients were
arriving together in the morning hours and causing increased wait times for each other, since all
resources were being heavily utilized during those hours. Below we posted the results for what
would happen if LBU scheduled appointments so patients arrived more even throughout the day.
The following wait and operation times have been calculated based on the following patient
arrival distribution:
Ideal Arrival Distribution
Time Percent of Patients Arrived
7AM 10% 8AM 10% 9AM 10% 10AM 10% 11AM 10% 12AM 10% 1PM 10% 2PM 10% 3PM 10% 4PM 10% 5PM 10%

20
Time in System (min) Time in Operation (min)
Wait time (min)
Current Arrival Distribution (Based on tables in the appendix)
56.57 31.38 25.19
Optimal Arrival (Distribution using table above)
53.46 33.81 19.65
With 7 MA’s and 3 Providers
So, for arrival distribution we believe there is one recommendation
• There is no additional cost for the clinic to spread appointments more evenly throughout
the day. So, we recommend the clinic distributes appointment schedules as it reduces
wait times by nearly 6 minutes without the clinic having to spend anything on additional
resources.
While at LBU some staff members stated that a single sonogram room was causing a increased
wait times for patients. Running the model disproved that as only 19% of all patients needed to
use a sonogram room, and the room was being utilized at a rate of 63.94% on average per week.
At LBU some of the staff also thought that there was an exam room shortage. All 100% of the
types of patients at LBU use the exam room but there are 8 exam rooms. So, when the model
was run with current resources and current arrival rates, we found that exam rooms were being
utilized at a rate of 56.06% per week. Thus, both scenarios were proven to be untrue.

21
Next Phase in this project This whole model has limitations and can be made more accurate Here are the following ideas
that should be done in phase 2 of this project:
• This model provides results based on day of the week. Thus, resources can only be
removed or added for only a full day at a time. Currently it is not possible to add a
resource for only part of a day. Thus, shifts should be added to the model. So, if we find
out Wednesday from 8AM to 11AM is the busiest time of the week we can add additional
resources only for that time span. With shift scheduling we will also be able to add when
a resource is on break and is resting. This will allow us to allocate resources more
efficiently and it will help the clinic know if what kind of resource they need to hire (part
time or full time) and when to deploy it.
• From our discussion with LBUCC staff members we found out that providers often arrive
late. If this probability of the doctor arriving late can be incorporated into the model, we
will have a better understanding if it the lack of resources that is causing the backlog or is
it because the doctors are not showing up on time. This additional information will give
the LBUCC team better decision making ability.
• We also need to increase the accuracy of our arrival schedules in the model. Right now,
we only know what percentage of patients are arriving between 7AM and 12PM, 12PM
and 3PM and 3PM and 5PM. We don’t know what percent is arriving between 7AM and
8AM, 8AM and 9AM… 4PM and 5PM on each day of the week. If we can calculate the
data based on arrival data that will give us very accurate arrival results to further improve
the model and allow greater assigning of appointment times.

22
Appendix

23
Med Model Code ******************************************************************************** * * * Formatted Listing of Model: * * C:\Users\user\Desktop\MedModel_SD\ReDoBettere_FIXED.mod * * * ******************************************************************************** Time Units: Minutes Distance Units: Feet ******************************************************************************** * Locations * ******************************************************************************** Name Cap Units Stats Rules Cost --------------------- --- ----- ----------- -------------- ------------ Bathroom_1 1 1 Time Series Oldest, , Bathroom_2 1 1 Time Series Oldest, , Exam_Room_1 1 1 Time Series Oldest, , Exam_Room_2 1 1 Time Series Oldest, , Exam_Room_3 1 1 Time Series Oldest, , Exam_Room_4 1 1 Time Series Oldest, , Exam_Room_5 1 1 Time Series Oldest, , Exam_Room_6 1 1 Time Series Oldest, , Exam_Room_7 1 1 Time Series Oldest, , Sonogram_Room 1 1 Time Series Oldest, , Exam_Room_8_No_Vitals 1 1 Time Series Oldest, , Follow_Up_Desk_1 2 1 Time Series Oldest, , CheckIn_Station_1 2 1 Time Series Oldest, FIFO, Waiting_Room_A 25 1 Time Series Oldest, , Patient_Entrance inf 1 Time Series Oldest, , Wait_Q inf 1 Time Series Oldest, FIFO, Sono_Q inf 1 Time Series Oldest, FIFO, Check_Up_Q inf 1 Time Series Oldest, FIFO, Leave 25 1 Time Series Oldest, , Chair 1 1 Time Series Oldest, ,

24
******************************************************************************** * Entities * ******************************************************************************** Name Speed (fpm) Stats Cost ------------------------------ ------------ ----------- ------------ Female_Patient_New 200 Time Series Female_Patient_New_Without_Son 200 Time Series Female_Patient_FollowUp 200 Time Series Female_Patient_Only_Sono 200 Time Series PATIENT 200 Basic

25
******************************************************************************** * Path Networks * ******************************************************************************** Name Type T/S From To BI Dist/Time Speed Factor ---------- ----------- ---------------- -------- -------- ---- ---------- ------------ Clinic_Net Passing Speed & Distance N1 N2 Bi 6.08 1 N2 N3 Bi 33.13 1 N3 N4 Bi 9.63 1 N3 N5 Bi 5.85 1 N3 N6 Bi 40.29 1 N6 N7 Bi 54.86 1 N7 N8 Bi 9.00 1 N7 N9 Bi 23.00 1 N9 N10 Bi 13.00 1 N10 N11 Bi 11.85 1 N10 N12 Bi 18.85 1 N12 N13 Bi 11.85 1 N12 N14 Bi 17.00 1 N12 N15 Bi 18.16 1 N15 N16 Bi 4.85 1 N15 N17 Bi 15.14 1 N17 N18 Bi 10.85 1 N17 N19 Bi 34.14 1 N19 N20 Bi 9.85 1 N19 N21 Bi 19.14 1 N21 N22 Bi 8.85 1 N9 N23 Bi 21.00 1 N23 N24 Bi 11.85 1 N23 N25 Bi 14.14 1 N23 N26 Bi 13.14 1 N26 N27 Bi 14.85 1 N26 N28 Bi 17.59 1 N21 N29 Bi 13.14 1 N21 N30 Bi 22.67 1 N21 N31 Bi 21.60 1 N21 N32 Bi 20.80 1 N21 N33 Bi 20.56 1 N21 N34 Bi 20.14 1 N26 N35 Bi 6.00 1 N3 N36 Bi 5.85 1 N2 N37 Bi 7.29 1

26
******************************************************************************** * Interfaces * ******************************************************************************** Net Node Location ---------- ---------- --------------------- Clinic_Net N1 Patient_Entrance N2 CheckIn_Station_1 N3 Waiting_Room_A N8 Bathroom_1 N16 Bathroom_2 N20 Exam_Room_1 N18 Exam_Room_2 N14 Exam_Room_3 N13 Exam_Room_4 N11 Exam_Room_5 N9 Exam_Room_6 N24 Exam_Room_7 N27 Sonogram_Room N28 Exam_Room_8_No_Vitals N7 Follow_Up_Desk_1 N36 Check_Up_Q N37 Wait_Q N35 Sono_Q

27
******************************************************************************** * Mapping * ******************************************************************************** Net From To Dest ---------- ---------- ---------- ------------ Clinic_Net N2 N1 N3 N2 N6 N3 N7 N6 N9 N7 N10 N9 N12 N10 N15 N12 N17 N15 N19 N17 N21 N19 N23 N9 N26 N23 N2 N3 N3 N6 N6 N7 N7 N8 N7 N9 N9 N10 N10 N11 N10 N12 N12 N13 N12 N14 N12 N15 N15 N16 N15 N17 N17 N18 N17 N19 N19 N20 N9 N23 N23 N24 N23 N26 N26 N27 N26 N28 N19 N21 N21 N29 N21 N30 N21 N31 N21 N32 N21 N33 N21 N34 N26 N35

28
N3 N36 N2 N37 ******************************************************************************** * Resources * ******************************************************************************** Res Ent Name Units Stats Search Search Path Motion Cost ----------------------- ----- -------- ------- ------ ---------- -------------- ------------ MA 7 By Unit None Oldest Clinic_Net Empty: 200 fpm Home: N30 Full: 200 fpm (Return) Provider 3 By Unit Closest Oldest Clinic_Net Empty: 200 fpm Home: N31 Full: 150 fpm (Return) Sonogram_Doctor 1 By Unit Closest Oldest Clinic_Net Empty: 50 fpm Home: N32 Full: 50 fpm (Return) CheckIn_Desk_Attendent 2 By Unit Closest Oldest Clinic_Net Empty: 10 fpm Home: N33 Full: 10 fpm (Return) FollowUp_Desk_Attendent 2 By Unit Closest Oldest Clinic_Net Empty: 10 fpm Home: N34 Full: 10 fpm (Return)

29
******************************************************************************** * Processing * ******************************************************************************** Entity Location Operation Blk Output Destination Rule Move Logic ------------------------------ --------------------- ------------------ ---- ------------------------------ --------------------- ------- ------------ PATIENT Patient_Entrance aPatient_Type=patient_type() /*Route aPatient_Type*/ If aPatient_Type=1 Then { Route 1 } If aPatient_Type=2 Then { Route 2 } If aPatient_Type=3 Then { Route 3 } If aPatient_Type=4 Then { Route 4 } If aPatient_Type=5 Then { Route 5 } 1 Female_Patient_New Wait_Q FIRST 1 Move On Clinic_Net 2 Female_Patient_New_Without_Son Wait_Q FIRST 1 Move On Clinic_Net 3 Female_Patient_FollowUp Wait_Q FIRST 1 Move On Clinic_Net 4 Female_Patient_Only_Sono Wait_Q FIRST 1 Move On Clinic_Net ALL Wait_Q Move for .1 1 ALL CheckIn_Station_1 FIRST 1 Inc aForms_Done Female_Patient_New CheckIn_Station_1 GRAPHIC 1 If aForms_Done=1 Then { Wait N(1,.2) min }

30
Else { Wait N(2,.5) min } 1 Female_Patient_New Waiting_Room_A FIRST 1 Move On Clinic_Net Female_Patient_New Waiting_Room_A aTotal_time_waiting_room = Clock() Inc Waitroom_count,1 If Waitroom_count>Waitroom_Max Then Waitroom_count=Waitroom_Max Dec Waitroom_count 1 Female_Patient_New Bathroom_1 FIRST 1 Move With MA Female_Patient_New Bathroom_2 FIRST Move With MA Female_Patient_New Bathroom_1 Wait N(3.5,1.8) min 1 Female_Patient_New Exam_Room_1 FIRST 1 Move with MA Female_Patient_New Exam_Room_2 FIRST Move with MA Female_Patient_New Exam_Room_3 FIRST Move with MA Female_Patient_New Exam_Room_4 FIRST Move with MA Female_Patient_New Exam_Room_5 FIRST Move with MA Female_Patient_New Exam_Room_6 FIRST Move with MA Female_Patient_New Exam_Room_7 FIRST Move with MA Female_Patient_New Exam_Room_8_No_Vitals FIRST Move with MA Female_Patient_New Bathroom_2 Wait N(3.5,1.8) min 1 Female_Patient_New Exam_Room_1 FIRST 1 Move with MA Female_Patient_New Exam_Room_2 FIRST Move with MA Female_Patient_New Exam_Room_3 FIRST Move with MA Female_Patient_New Exam_Room_4 FIRST Move with MA Female_Patient_New Exam_Room_5 FIRST Move with MA Female_Patient_New Exam_Room_6 FIRST Move with MA

31
Female_Patient_New Exam_Room_7 FIRST Move with MA Female_Patient_New Exam_Room_8_No_Vitals FIRST Move with MA Female_Patient_New Exam_Room_1 Use MA For N(2.8,2) min 1 Female_Patient_New Sono_Q,1 FIRST 1 Move On Clinic_Net Female_Patient_New Exam_Room_2 Use MA For N(2.8,2) min 1 Female_Patient_New Sono_Q,1 FIRST 1 Move On Clinic_Net Female_Patient_New Exam_Room_3 Use MA For N(2.8,2) min 1 Female_Patient_New Sono_Q,1 FIRST 1 Move On Clinic_Net Female_Patient_New Exam_Room_4 Use MA For N(2.8,2) min 1 Female_Patient_New Sono_Q,1 FIRST 1 Move On Clinic_Net Female_Patient_New Exam_Room_5 Use MA For N(2.8,2) min 1 Female_Patient_New Sono_Q,1 FIRST 1 Move On Clinic_Net Female_Patient_New Exam_Room_6 Use MA For N(2.8,2) min 1 Female_Patient_New Sono_Q,1 FIRST 1 Move On Clinic_Net Female_Patient_New Exam_Room_7 Use MA For N(2.8,2) min 1 Female_Patient_New Sono_Q,1 FIRST 1 Move On Clinic_Net Female_Patient_New Exam_Room_8_No_Vitals Use MA For N(2.8,2) min 1 Female_Patient_New Sono_Q,1 FIRST 1 Move On Clinic_Net Female_Patient_New Sono_Q Graphic 1 1 Female_Patient_New Sonogram_Room FIRST 1 Move with MA Female_Patient_New Sonogram_Room Use Sonogram_Doctor For N(17.5,9.8) min If aProvider_CheckUp = 1 Then { Route 1 } Else { Route 2 } 1 Female_Patient_New Exam_Room_1 FIRST 1 Move with MA Then Free Female_Patient_New Exam_Room_2 FIRST Move with MA Then Free Female_Patient_New Exam_Room_3 FIRST Move with MA Then Free Female_Patient_New Exam_Room_4 FIRST Move with MA Then Free Female_Patient_New Exam_Room_5 FIRST Move with MA Then Free

32
Female_Patient_New Exam_Room_6 FIRST Move with MA Then Free Female_Patient_New Exam_Room_7 FIRST Move with MA Then Free Female_Patient_New Exam_Room_8_No_Vitals FIRST Move with MA Then Free 2 Female_Patient_New Check_Up_Q FIRST 1 Move on Clinic_Net Female_Patient_New Check_Up_Q Graphic 1 1 Female_Patient_New Exam_Room_1 FIRST 1 Move with MA Then Free Female_Patient_New Exam_Room_2 FIRST Move with MA Then Free Female_Patient_New Exam_Room_3 FIRST Move with MA Then Free Female_Patient_New Exam_Room_4 FIRST Move with MA Then Free Female_Patient_New Exam_Room_5 FIRST Move with MA Then Free Female_Patient_New Exam_Room_6 FIRST Move with MA Then Free Female_Patient_New Exam_Room_7 FIRST Move with MA Then Free Female_Patient_New Exam_Room_8_No_Vitals FIRST Move with MA Then Free Female_Patient_New Exam_Room_1 Use Provider For N(13.9,11.9) min 1 Female_Patient_New Follow_Up_Desk_1 FIRST 1 Move On Clinic_Net Female_Patient_New Exam_Room_2 Use Provider For N(13.9,11.9) min 1 Female_Patient_New Follow_Up_Desk_1 FIRST 1 Move On Clinic_Net Female_Patient_New Exam_Room_3 Use Provider For N(13.9,11.9) min 1 Female_Patient_New Follow_Up_Desk_1 FIRST 1 Move On Clinic_Net Female_Patient_New Exam_Room_4 Use Provider For N(13.9,11.9) min 1 Female_Patient_New Follow_Up_Desk_1 FIRST 1 Move On Clinic_Net Female_Patient_New Exam_Room_5 Use Provider For N(13.9,11.9) min 1 Female_Patient_New Follow_Up_Desk_1 FIRST 1 Move On Clinic_Net Female_Patient_New Exam_Room_6 Use Provider For N(13.9,11.9) min 1 Female_Patient_New Follow_Up_Desk_1 FIRST 1 Move On Clinic_Net Female_Patient_New Exam_Room_7 Use Provider For N(13.9,11.9) min 1 Female_Patient_New Follow_Up_Desk_1 FIRST 1 Move On Clinic_Net Female_Patient_New Exam_Room_8_No_Vitals Use Provider For N(13.9,11.9) min 1 Female_Patient_New Follow_Up_Desk_1 FIRST 1 Move On Clinic_Net Female_Patient_New Follow_Up_Desk_1 Use MA For 3 min Free MA 1 Female_Patient_New EXIT FIRST 1 INC vPatient_Count

33
Female_Patient_New_Without_Son CheckIn_Station_1 GRAPHIC 1 If aForms_Done=1 Then { Wait N(1,.2) min } Else { Wait N(2,.5) min } 1 Female_Patient_New_Without_Son Waiting_Room_A FIRST 1 Move On Clinic_Net Female_Patient_New_Without_Son Waiting_Room_A aTotal_time_waiting_room = Clock() 1 Female_Patient_New_Without_Son Bathroom_1 FIRST 1 Move with MA Female_Patient_New_Without_Son Bathroom_2 FIRST Move with MA Female_Patient_New_Without_Son Bathroom_1 Wait N(3.5,1.8) min 1 Female_Patient_New_Without_Son Exam_Room_1 FIRST 1 Move with MA Female_Patient_New_Without_Son Exam_Room_2 FIRST Move with MA Female_Patient_New_Without_Son Exam_Room_3 FIRST Move with MA Female_Patient_New_Without_Son Exam_Room_4 FIRST Move with MA Female_Patient_New_Without_Son Exam_Room_5 FIRST Move with MA Female_Patient_New_Without_Son Exam_Room_6 FIRST Move with MA Female_Patient_New_Without_Son Exam_Room_7 FIRST Move with MA Female_Patient_New_Without_Son Exam_Room_8_No_Vitals FIRST Move with MA Female_Patient_New_Without_Son Bathroom_2 Wait N(3.5,1.8) min 1 Female_Patient_New_Without_Son Exam_Room_1 FIRST 1 Move with MA Female_Patient_New_Without_Son Exam_Room_2 FIRST Move with MA Female_Patient_New_Without_Son Exam_Room_3 FIRST Move with MA Female_Patient_New_Without_Son Exam_Room_4 FIRST Move with MA Female_Patient_New_Without_Son Exam_Room_5 FIRST Move with MA Female_Patient_New_Without_Son Exam_Room_6 FIRST Move with MA Female_Patient_New_Without_Son Exam_Room_7 FIRST Move with MA Female_Patient_New_Without_Son Exam_Room_8_No_Vitals FIRST Move with MA

34
Female_Patient_New_Without_Son Exam_Room_1 Use MA For N(2.8,2) min Free MA Use Provider For N(13.9,11.9) min Free Provider 1 Female_Patient_New_Without_Son Follow_Up_Desk_1 FIRST 1 Move On Clinic_Net Female_Patient_New_Without_Son Exam_Room_2 Use MA For N(2.8,2) min Free MA Use Provider For N(13.9,11.9) min Free Provider 1 Female_Patient_New_Without_Son Follow_Up_Desk_1 FIRST 1 Move On Clinic_Net Female_Patient_New_Without_Son Exam_Room_3 Use MA For N(2.8,2) min Free MA Use Provider For N(13.9,11.9) min Free Provider 1 Female_Patient_New_Without_Son Follow_Up_Desk_1 FIRST 1 Move On Clinic_Net Female_Patient_New_Without_Son Exam_Room_4 Use MA For N(2.8,2) min Free MA Use Provider For N(13.9,11.9) min Free Provider 1 Female_Patient_New_Without_Son Follow_Up_Desk_1 FIRST 1 Move On Clinic_Net Female_Patient_New_Without_Son Exam_Room_5 Use MA For N(2.8,2) min Free MA Use Provider For N(13.9,11.9) min Free Provider 1 Female_Patient_New_Without_Son Follow_Up_Desk_1 FIRST 1 Move On Clinic_Net Female_Patient_New_Without_Son Exam_Room_6 Use MA For N(2.8,2) min Free MA Use Provider For N(13.9,11.9) min Free Provider 1 Female_Patient_New_Without_Son Follow_Up_Desk_1 FIRST 1 Move On Clinic_Net Female_Patient_New_Without_Son Exam_Room_7 Use MA For N(2.8,2) min Free MA Use Provider For N(13.9,11.9) min Free Provider 1 Female_Patient_New_Without_Son Follow_Up_Desk_1 FIRST 1 Move On Clinic_Net Female_Patient_New_Without_Son Exam_Room_8_No_Vitals Use MA For N(2.8,2) min Free MA Use Provider For N(13.9,11.9) min Free Provider 1 Female_Patient_New_Without_Son Follow_Up_Desk_1 FIRST 1 Move On Clinic_Net Female_Patient_New_Without_Son Follow_Up_Desk_1 Use MA For 3 min Free MA 1 Female_Patient_New_Without_Son EXIT FIRST 1 INC vPatient_Count Female_Patient_FollowUp CheckIn_Station_1 GRAPHIC 1 If aForms_Done=1 Then { Wait N(1,.2) min } Else

35
{ Wait N(2,.5) min } 1 Female_Patient_FollowUp Waiting_Room_A FIRST 1 Move On Clinic_Net Female_Patient_FollowUp Waiting_Room_A aTotal_time_waiting_room = Clock() Wait 13.45 min 1 Female_Patient_FollowUp Bathroom_1 FIRST 1 Move with MA Female_Patient_FollowUp Bathroom_2 FIRST Move with MA Female_Patient_FollowUp Bathroom_1 WAIT N(3.4,1.8) min 1 Female_Patient_FollowUp Exam_Room_1 FIRST 1 Move with MA Female_Patient_FollowUp Exam_Room_2 FIRST Move with MA Female_Patient_FollowUp Exam_Room_3 FIRST Move with MA Female_Patient_FollowUp Exam_Room_4 FIRST Move with MA Female_Patient_FollowUp Exam_Room_5 FIRST Move with MA Female_Patient_FollowUp Exam_Room_6 FIRST Move with MA Female_Patient_FollowUp Exam_Room_7 FIRST Move with MA Female_Patient_FollowUp Exam_Room_8_No_Vitals FIRST Move with MA Female_Patient_FollowUp Bathroom_2 WAIT N(3.4,1.8) min 1 Female_Patient_FollowUp Exam_Room_1 FIRST 1 Move with MA Female_Patient_FollowUp Exam_Room_2 FIRST Move with MA Female_Patient_FollowUp Exam_Room_3 FIRST Move with MA Female_Patient_FollowUp Exam_Room_4 FIRST Move with MA Female_Patient_FollowUp Exam_Room_5 FIRST Move with MA Female_Patient_FollowUp Exam_Room_6 FIRST Move with MA Female_Patient_FollowUp Exam_Room_7 FIRST Move with MA Female_Patient_FollowUp Exam_Room_8_No_Vitals FIRST Move with MA Female_Patient_FollowUp Exam_Room_1 Use MA For N(3.4,2.1) min Free MA Use Provider For N(18.9,15.2) min Free Provider 1 Female_Patient_FollowUp Follow_Up_Desk_1 FIRST 1 Move On Clinic_Net Female_Patient_FollowUp Exam_Room_2 Use MA For N(3.4,2.1) min Free MA

36
Use Provider For N(18.9,15.2) min Free Provider 1 Female_Patient_FollowUp Follow_Up_Desk_1 FIRST 1 Move On Clinic_Net Female_Patient_FollowUp Exam_Room_3 Use MA For N(3.4,2.1) min Free MA Use Provider For N(18.9,15.2) min Free Provider 1 Female_Patient_FollowUp Follow_Up_Desk_1 FIRST 1 Move On Clinic_Net Female_Patient_FollowUp Exam_Room_4 Use MA For N(3.4,2.1) min Free MA Use Provider For N(18.9,15.2) min Free Provider 1 Female_Patient_FollowUp Follow_Up_Desk_1 FIRST 1 Move On Clinic_Net Female_Patient_FollowUp Exam_Room_5 Use MA For N(3.4,2.1) min Free MA Use Provider For N(18.9,15.2) min Free Provider 1 Female_Patient_FollowUp Follow_Up_Desk_1 FIRST 1 Move On Clinic_Net Female_Patient_FollowUp Exam_Room_6 Use MA For N(3.4,2.1) min Free MA Use Provider For N(18.9,15.2) min Free Provider 1 Female_Patient_FollowUp Follow_Up_Desk_1 FIRST 1 Move On Clinic_Net Female_Patient_FollowUp Exam_Room_7 Use MA For N(3.4,2.1) min Free MA Use Provider For N(18.9,15.2) min Free Provider 1 Female_Patient_FollowUp Follow_Up_Desk_1 FIRST 1 Move On Clinic_Net Female_Patient_FollowUp Exam_Room_8_No_Vitals Use MA For N(3.4,2.1) min Free MA Use Provider For N(18.9,15.2) min Free Provider 1 Female_Patient_FollowUp Follow_Up_Desk_1 FIRST 1 Move On Clinic_Net Female_Patient_FollowUp Follow_Up_Desk_1 Use MA For 3 min Free MA 1 Female_Patient_FollowUp EXIT FIRST 1 INC vPatient_Count Female_Patient_Only_Sono CheckIn_Station_1 GRAPHIC 1 If aForms_Done=1 Then { Wait N(1,.2) min } Else { Wait N(2,.5) min } 1 Female_Patient_Only_Sono Waiting_Room_A FIRST 1 Move On Clinic_Net Female_Patient_Only_Sono Waiting_Room_A aTotal_time_waiting_room = Clock()

37
1 Female_Patient_Only_Sono Exam_Room_1 FIRST 1 Move with MA Female_Patient_Only_Sono Exam_Room_2 FIRST Move with MA Female_Patient_Only_Sono Exam_Room_3 FIRST Move with MA Female_Patient_Only_Sono Exam_Room_4 FIRST Move with MA Female_Patient_Only_Sono Exam_Room_5 FIRST Move with MA Female_Patient_Only_Sono Exam_Room_6 FIRST Move with MA Female_Patient_Only_Sono Exam_Room_7 FIRST Move with MA Female_Patient_Only_Sono Exam_Room_8_No_Vitals FIRST Move with MA Female_Patient_Only_Sono Exam_Room_1 Use MA For N(4.6,3.9) min 1 Female_Patient_Only_Sono Sono_Q FIRST 1 Move On Clinic_Net Female_Patient_Only_Sono Exam_Room_2 Use MA For N(4.6,3.9) min 1 Female_Patient_Only_Sono Sono_Q FIRST 1 Move On Clinic_Net Female_Patient_Only_Sono Exam_Room_3 Use MA For N(4.6,3.9) min 1 Female_Patient_Only_Sono Sono_Q FIRST 1 Move On Clinic_Net Female_Patient_Only_Sono Exam_Room_4 Use MA For N(4.6,3.9) min 1 Female_Patient_Only_Sono Sono_Q FIRST 1 Move On Clinic_Net Female_Patient_Only_Sono Exam_Room_5 Use MA For N(4.6,3.9) min 1 Female_Patient_Only_Sono Sono_Q FIRST 1 Move On Clinic_Net Female_Patient_Only_Sono Exam_Room_6 Use MA For N(4.6,3.9) min 1 Female_Patient_Only_Sono Sono_Q FIRST 1 Move On Clinic_Net Female_Patient_Only_Sono Exam_Room_7 Use MA For N(4.6,3.9) min 1 Female_Patient_Only_Sono Sono_Q FIRST 1 Move On Clinic_Net Female_Patient_Only_Sono Exam_Room_8_No_Vitals Use MA For N(4.6,3.9) min 1 Female_Patient_Only_Sono Sono_Q FIRST 1 Move On Clinic_Net Female_Patient_Only_Sono Sono_Q Graphic 1 1 Female_Patient_Only_Sono Sonogram_Room FIRST 1 Move with MA then free Female_Patient_Only_Sono Sonogram_Room Use Sonogram_Doctor For N(12.8,6.11) min 1 Female_Patient_Only_Sono Follow_Up_Desk_1 FIRST 1 Female_Patient_Only_Sono Follow_Up_Desk_1 Use MA For 3 min Free MA 1 Female_Patient_Only_Sono EXIT FIRST 1 INC vPatient_Count

38
******************************************************************************** * Arrivals * ******************************************************************************** Entity Location Qty Each First Time Occurrences Frequency Logic -------- ---------------- --------------------- ---------- ----------- ---------- ------------ PATIENT Patient_Entrance 76; Patient_Monday 0 1 24 PATIENT Patient_Entrance 78; Patient_Tuesday 0 1 24 PATIENT Patient_Entrance 84; Patient_Wednesday 0 1 24 PATIENT Patient_Entrance 89; Patient_Thursday 0 1 24 PATIENT Patient_Entrance 61; Patient_Friday 0 1 24 ******************************************************************************** * Attributes * ******************************************************************************** ID Type Classification ------------------------------ ------------ -------------- aForms_Done Integer Entity aProvider_CheckUp Integer Entity aTotal_time_waiting_room Real Entity aTotal_time_New_Only_Sono_Pati Real Entity aPatient_Type Integer Entity ******************************************************************************** * Variables (global) * ******************************************************************************** ID Type Initial value Stats ----------------- ------------ ------------- ----------- vPatient_Count Integer 0 Time Series Waitroom_count Integer 0 Time Series Waitroom_Max Integer 0 Time Series FollowUp_Count Integer 0 Time Series FollowUp_Max Integer 0 Time Series vPatient_Check_In Integer 0 Time Series

39
******************************************************************************** * Arrival Cycles * ******************************************************************************** ID Qty / % Cumulative Time (Hours) Value ----------------- ------------ ------------ ------------ ------------ Patient_Monday Percent Yes 5.0 66 8.0 88 10.0 100 Patient_Tuesday Percent Yes 5.0 33 8.0 83 10.0 100 Patient_Wednesday Percent Yes 5.0 60 8.0 85 10.0 100 Patient_Thursday Percent Yes 5.0 60 8.0 92 10.0 100 Patient_Friday Percent Yes 5.0 51 8.0 87 10.0 100 Distributed Percent Yes 1 10 2 20 3 30 4 40 5 50 6 60 7 70 8 80 9 90 10 100 ******************************************************************************** * User Distributions * ******************************************************************************** ID Type Cumulative Percentage Value ------------ ------------ ------------ ------------ ------------ Patient_type Discrete No 12.0 1 7.0 2 72.0 3 9.0 4 0 5

40
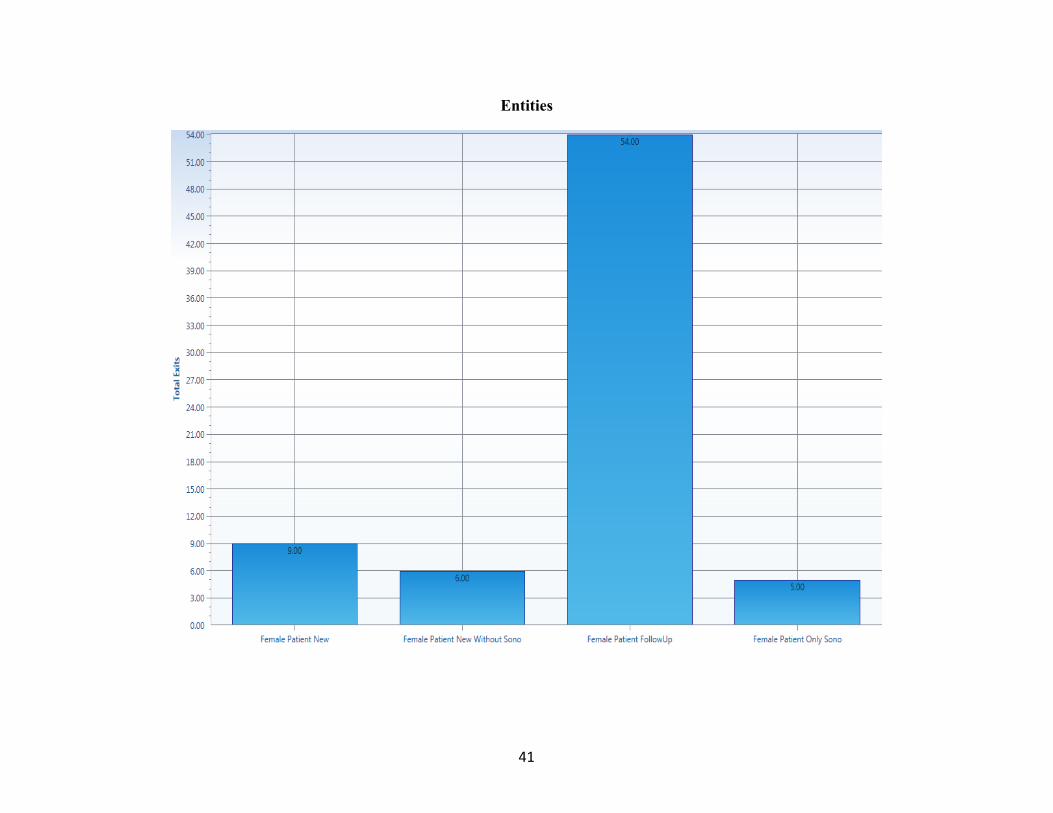
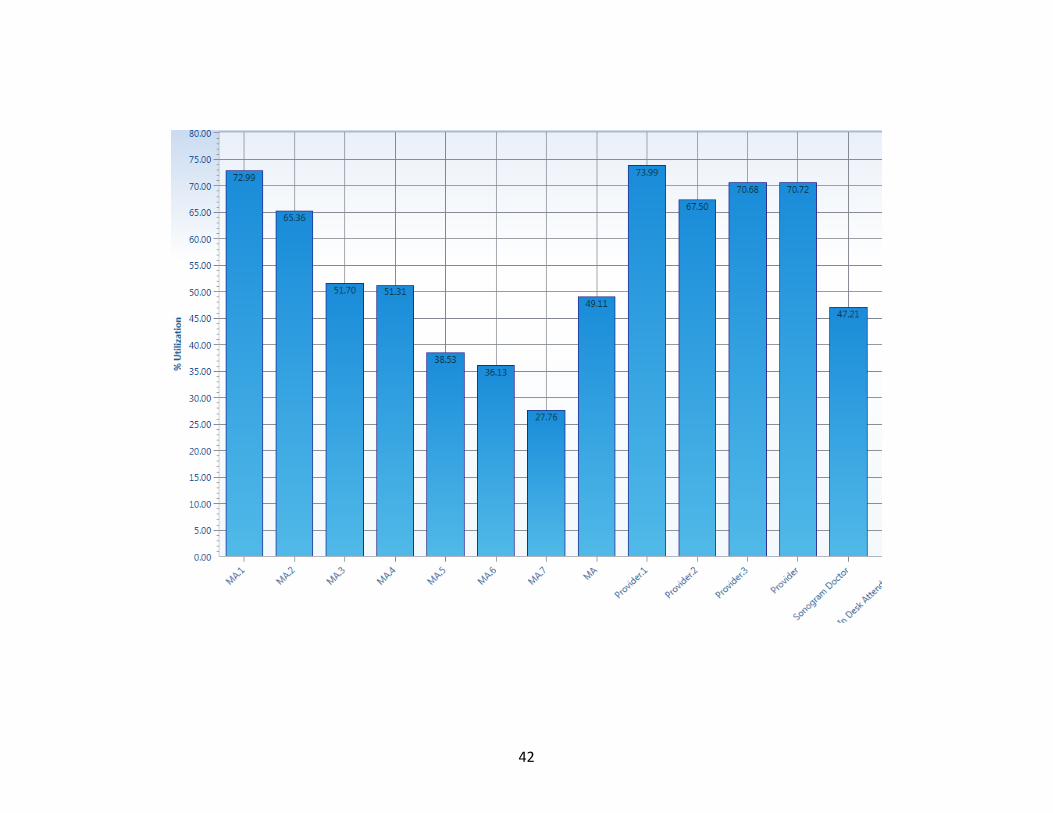
Med Model Output The simulation was run individually by the day of the week as the arrival cycles were built that way. This output contains runs with 3 providers and 7 MA’s. Monday:
Locations
41
Entities
42

43
Tuesday:
Locations

44
Entities

45
Resources

46
Wednesday:
Locations

47
Entities

48
Resources

49
Thursday:
Locations

50
Entities

51
Resources

52
Friday
Locations

53
Entities

54
Resources