IMPROVING HEALTH SYSTEM EFFICIENCY -...
35
IMPROVING HEALTH SYSTEM EFFICIENCY Health Systems Governance & Financing Reforms for improving the efficiency of health systems: lessons from 10 country cases Winnie Yip Reem Hafez
Transcript of IMPROVING HEALTH SYSTEM EFFICIENCY -...

IMPROVING HEALTH SYSTEM EFFICIENCY
Health Systems Governance & Financing
Reforms for improving the efficiency of healthsystems: lessons from 10 country cases
Winnie YipReem Hafez


Reforms for improving the efficiency of healthsystems: lessons from 10 country cases
Winnie YipReem Hafez
IMPROVING HEALTH SYSTEM EFFICIENCY
Health Systems Governance & Financing

2
HEAL
TH S
YSTE
MS
GOVE
RNAN
CE &
FIN
ANCI
NG
WHO/HIS/HGF/SR/15.1
© World Health Organization 2015
All rights reserved. Publications of the World Health Organization are available on the WHO website (www.who.int) or can be purchased from WHO Press, World Health Organization, 20 Avenue Appia, 1211 Geneva 27, Switzerland (tel.: +41 22 791 3264; fax: +41 22 791 4857; e-mail: [email protected]).
Requests for permission to reproduce or translate WHO publications –whether for sale or for non-commercial distribution– should be addressed to WHO Press through the WHO website(www.who.int/about/licensing/copyright_form/en/index.html).
The designations employed and the presentation of the material in this publication do not imply the expression of any opinion whatsoever on the part of the World Health Organization concerningthe legal status of any country, territory, city or area or of its authorities, or concerning thedelimitation of its frontiers or boundaries. Dotted and dashed lines on maps represent approximateborder lines for which there may not yet be full agreement.
The mention of specific companies or of certain manufacturers’ products does not imply that they are endorsed or recommended by the World Health Organization in preference to others of a similar nature that are not mentioned. Errors and omissions excepted, the names of proprietaryproducts are distinguished by initial capital letters.
All reasonable precautions have been taken by the World Health Organization to verify the information contained in this publication. However, the published material is being distributedwithout warranty of any kind, either expressed or implied. The responsibility for the interpretation and use of the material lies with the reader. In no event shall the World Health Organization be liable for damages arising from its use.
The named authors alone are responsible for the views expressed in this publication.
ACKNOWLEDGEMENTSWHO commissioned this synthesis of 10 country case studies on improving the efficiency of health systems,covering various types of health system and financing reforms. The lead author was Winnie Yip, and hercoauthor was Reem Hafez, both at the Blavatnik School of Government, Oxford University, United Kingdom.Technical guidance and input were provided by Joseph Kutzin, Coordinator for Health Financing Policy, andDorjsuren Bayarsaikhan, Health Economist, Department of Health Systems Governance and Financing atWHO headquarters, Geneva.WHO thanks Leo Devillé and Josef Decosas at Health Research for Action, and WHO staff Justine Hsu(WHO headquarters), Xu Ke (WHO Regional Office for the Western Pacific), Laurent Musango (WHORegional Office for Africa) and Cristian Morales (WHO Regional Office for the Americas) for organizing thecountry case studies. WHO also thanks Dan Kress and Hong Wang, Bill & Melinda Gates Foundation, fordiscussing the case studies and the synthesis report.Funding from the EU–WHO Partnership for Universal Health Coverage and the Bill & Melinda GatesFoundation towards preparation of this report is gratefully acknowledged.
Printed by the WHO Document Production Services, Geneva, SwitzerlandOriginal graph of the cover by Paprika, FranceDesign and layout by CommonSense / Fokion Kopanaris & Revekka Vital, Greece

3
REFO
RMS
FOR
IMPR
OVIN
G TH
EEF
FICI
ENCY
OF
HEAL
TH S
YSTE
MS:
LES
SON
S FR
OM 1
0 CO
UNTR
Y CA
SES
1. INTRODUCTION ............................................................................................................................ 4
2. DEFINITIONS, CONCEPTS AND FRAMEWORK ................................................................................ 5
3. COUNTRY CASES............................................................................................................................ 7
4. LESSONS LEARNT ........................................................................................................................ 23
5. FUTURE DIRECTIONS .................................................................................................................... 26
REFERENCES .................................................................................................................................... 27
ANNEX 1. Services subsibized under the performance-based financing system in Burundi ...................... 29
ANNEX 2. Diseases covered by Chile’s Universal Access with Explicit Guarantees (AUGE) reform .......... 30
FIGURES
Figure 1. A systems framework for analysing the efficiency of health care resource use .......................... 6
Figure 2. Increase in use of maternal and family planning services, Burundi, 2000-2012 .......................... 8
Figure 3. Increase in new cases under Universal Access with Explicit Guarantees, Chile, 2005-2011 .......... 9
Figure 4. Rapid growth in medicine expenditure, China, 1990-2008 ...................................................... 10
Figure 5. Number of health extension workers deployed, Ethiopia ........................................................ 15
Figure 6. Increased use of high-impact interventions, Ethiopia, 2004-2011 .......................................... 15
Figure 7. Results of an impact study by the South African Essential Drugs Programme .......................... 18
TABLES
Table 1. Prioritization of health problems and associated interventions, Chile ........................................ 9
Table 2. Reorganization of human resources in district hospitals in Kisangani and Bas-Congo, Democratic Republic of the Congo .................................................................................................... 12
Table 3. Evolution of monthly salaries of hospital staff by occupational category, Democratic Republic of the Congo ...................................................................................................................... 12
Table 4. Services included in the health extension worker programme, Ethiopia .................................... 14
Table 5. Decreases in health insurance administrative costs (KRW), Republic of Korea, 1996-2008 ........ 17
Table 6. Programmes included in the National Integrated Health System (Integrated Health Care Plan benefits), Uruguay ...................................................................................................................... 19
Table 7. Summary of case studies ...................................................................................................... 21
CONTENTS

1
4
HEAL
TH S
YSTE
MS
GOVE
RNAN
CE &
FIN
ANCI
NG
Universal health coverage ensures affordable access to high-quality health services for all; this will inevitablyrequire governments to find additional budgetary resources and therefore to increase the fiscal space forhealth. While there are a number of ways of increasing health sector resources, such as mobilizing additionaldomestic resources when the macroeconomic conditions are conducive, increasing the priority of health inthe public budget or relying on donor aid, recent attention has been directed to increasing the efficiency ofthe use of health resources. This is due partly to the fact that countries are increasingly obliged to containgrowth in health spending as a result of rapidly ageing populations, growing burdens of noncommunicabledisease and co-morbid conditions, technological progress and rising population expectations (1). In addition,fiscal crises in advanced economies and overextended governments in low- and middle-income economiesmake efficiency in health care delivery a pressing concern globally.
As highlighted in the 2010 World health report, efficiency is critical to sustainability: progress towardsuniversal health coverage will require not just more money for health but more value for money. It wasestimated in the 2010 Report that 20–40% of all resources spent on health are wasted. The Report identified10 main sources of inefficiency in health care systems. For example, huge inefficiency is seen in the use ofmedicines, with under-use of generic medicines in favour of higher-margin, profit-making drugs, inappropriateand ineffective prescriptions and substandard or counterfeit products. An inadequate, costly mix of healthworkers, infrastructure and health services that fail to meet population needs are other sources of inefficiency.The dearth of alternative long-term care facilities can result in long hospital stays and maintains expensivehospital-based delivery. Limited transparency, accountability and appropriate compensation schemes lead towaste, corruption and other health system leakages (2). These are, however, merely categories, with nostandard measures of causes, and the solutions are highly context-specific. Health systems are inefficient tovarying degrees, and countries can and do undertake reforms to address the issues. Their experiences havenot, however, been well documented.
As a follow-up to the 2010 World health report, WHO commissioned 11 country case studies in 2013, toreview national attempts to improve efficiency with the use of various health system and financing reforms.The WHO regional offices were consulted to identify relevant country reform experiences, and this report isbased on the resulting 10 country case studies, in Africa (Burundi, Democratic Republic of the Congo,Ethiopia and South Africa), Asia (China and the Republic of Korea) and Latin America (Chile, El Salvador,Mexico and Uruguay). The studies covered topics including reform of provider payment, organization ofsocial health insurance, selection of health benefits, drug regulation and pricing and the training and skill mixof health workers. The goal of this report was to describe the efforts made in these countries to addressvarious problems of efficiency in their health systems, synthesize the lessons learnt and provide promisingdirections for policy and future research.
Section 2 of the report describes the concept and definition of efficiency and outlines the framework used foranalysing efficiency in the context of a health system. Section 3 summarizes the forms of inefficiency and thepolicy interventions described in each of the 10 country cases. Section 4 is a synthesis of the lessons learnt,and section 5 lists areas for future research.
INTRODUCTION

2
The two concepts of efficiency commonly used in economics are: allocative efficiency and technicalefficiency. Allocative efficiency is allocating resources in such a way as to provide the optimal mix of goodsand services to maximize the benefits to society; technical efficiency is using the least amount of resourcesor the right combination of inputs to produce a given mix of goods and services. In other words, allocativeefficiency is motivated by “doing the right thing”, while technical efficiency focuses on “doing things the rightway”. It should be noted that allocative efficiency is different from equity; no other allocation of resourcescan make at least one individual better off without making another individual worse off; an allocativelyefficient situation may therefore be inequitable. Similarly, moving from an inequitable to an equitabledistribution of resources can be suboptimal from the perspective of allocative efficiency.
In this report, we adapt these concepts to a health systems framework. In this framework, inputs, includingfunding, human resources, physical infrastructure, drugs, medical equipment and information, are all used toproduce health goods and services. This ultimately leads to the outcomes, or benefits to society, whichinclude improved health status, financial risk protection and public satisfaction (Figure 1). In this context,allocative efficiency means that there is no alternative mix of health goods and services that could increasethe health system’s final outcomes over the status quo; technical efficiency means that there is no alternativeuse of inputs or input mix that could produce the same level of goods and services at a lower cost. Forinstance, if a nation could improve its health outcomes by reallocating resources from hospital care toprimary care, that nation has not yet maximized allocative efficiency. If a nation could shift tasks among theworkforce and matches skills with needs to produce the same level of outpatient visits and hospitaladmissions while spending less, that nation has not yet achieved technical efficiency.
On the left of Figure 1 is a set of policy instruments: financing, provider payment methods, organization andregulation. Together, they affect how resources are allocated to different goods and services and how inputsare used to produce a given set of goods and services. These are the tools that policy-makers can use toinfluence the allocative and technical efficiency of a health system. For the purposes of this paper, we definefinancing as encompassing decisions on how much resources to mobilize for health care, what risk poolingmechanisms to use, what benefit package to adopt, which populations to target, and what institutionalarrangements to use for managing resources. Financing is one of the most powerful policy instruments fordetermining whether a country ensures affordable access to care, especially through benefit package designsand targeting of funding. Provider payment methods are the ways in which funders or purchasers remunerateproviders. Each payment method has different incentives, motivating provider behaviour in their treatmentchoices to various degrees. This affects not only quality but also efficiency. Organization covers a broad setof policies for managing and coordinating the delivery system: for example, whether services are delivered bythe public sector only or by both the public and the private sectors, whether competition is encouraged orwhether the delivery of primary, secondary and tertiary care is integrated. Regulation involves setting therules, standards and operating guidelines within which the system is meant to operate. These include approvalof medicines, certification and accreditation of hospitals and licensing of the health workforce.
The scope and effectiveness of policy instruments are further influenced by macro factors, such as thesocioeconomic development of a country, political will, governance and leadership structures.
5
REFO
RMS
FOR
IMPR
OVIN
G TH
EEF
FICI
ENCY
OF
HEAL
TH S
YSTE
MS:
LES
SON
S FR
OM 1
0 CO
UNTR
Y CA
SES
DEFINITIONS, CONCEPTS AND FRAMEWORK

6
HEAL
TH S
YSTE
MS
GOVE
RNAN
CE &
FIN
ANCI
NG
Figure 1. A systems framework for analysing the efficiency of health care resource use
In practice, countries use a combination of policy instruments to effect change. The 10 country case studiessummarized in section 3 reflect this reality. Burundi, Chile, Ethiopia and Uruguay introduced various financingpolicies (e.g. free care, insurance and a re-designed benefits package) to improve access to care in priorityservices (e.g. maternal and child care, primary care). They also introduced policies to ensure that the serviceswere available to meet increased demand: Burundi and Uruguay by pay-for-performance incentives linked tothe delivery and quality of a set of priority services, Ethiopia by training additional community health careworkers and holding them accountable for delivering a well-defined service package, and Chile by regulationthat requires public and private providers to offer the same mandated benefits package. Chile, Mexico andUruguay proposed predominantly financing reforms, offering essential and standardized benefits packagesaccording to the population’s epidemiological profile and the cost of disease in order to maximize healthgains and financial risk protection. The Republic of Korea changed the organization of its national healthinsurance programme by merging multiple risk pools into a single national risk pool in order to reduceadministrative costs. The case studies of China, El Salvador and South Africa provide examples of howcountries have tackled problems in the drug supply chain as well as in physicians’ prescribing behaviour. Chinauses a combination of regulation and pricing, establishing an essential medicines programme and reducingthe mark-up on retail drug prices at all primary care facilities. El Salvador and South Africa combine regulatorymeasures and organizational changes to control the rampant cost of medicines, in order to make themaffordable for their populations. The Democratic Republic of the Congo reasserts its role in the health sectorby better coordination and organization of financing from donors.
Gove
rnan
ceLe
adershipPolitical will Economic and social developm
ent
Policyinstrument Intermediate
outcomes
Finaloutcomes
InputsFinancing
Access
Healthstatus
Financialrisk
protection
Quality
Information Healthworkforce
Medical products
DrugsPhysicalinfrastructure
EquipmentRegulation
Caredelivery
Providerpaymentmethods
Organization
Publlicsatisfaction

3
This section summarizes the forms of inefficiency found in each of the 10 case studies, explains thesubsequent policy change and briefly describes the country’s experience and results. We first present eachcountry case, followed by a summary of their place in terms of technical and allocative efficiency, as definedin section 2. It should be noted that the inefficiency issues covered by these 10 cases are by no meansexhaustive.
3.1 Burundi
Forms of inefficiencyMaternal mortality and child malnutrition rates in Burundi are among the highest in Africa. In 2005, thematernal mortality rate was 910 per 100 000 live births and the mortality rates for infant and children under5 years were 75 and 119 per 1000, respectively (3). Approximately 75% of all mortality was due tocommunicable, maternal, neonatal and nutritional diseases, and nearly 60% of all children were chronicallymalnourished. Yet, use of maternal and child health services was limited. In response, the Governmentdecreed in 2006 a policy of free care for children under 5 and for pregnant women; this led to a dramaticincrease in the use of services (see Annex 1 for services covered by the free care policy). The increase putpressure on the already thinly stretched staff and resulted in frequent stock-outs of medicines, leading to adeterioration of performance. The central administration could not cope with the sudden influx of invoices,causing significant delays in payment to facilities, exacerbating already low morale and causing high staffturnover rates. Deliveries at health facilities plateaued in 2008 at 56%, antenatal care visits averaged 33%,and only approximately 10% of women used modern family planning services (3, 4) (Figure 2).
Policy changeTo meet the increased demand, performance-based financing was introduced in 2010 after a period of pilottesting in all contracted health facilities (public, private and faith-based), to incentivize providers to increasethe supply of services and improve their quality and to encourage the use of maternal and child healthservices. Facilities are eligible to participate if they cover a population of at least 7500, deliver 70% of theservices in the essential package (see Annex 1) and agree to deliver the free care policy for maternal and childhealth services. Contracted facilities then receive subsidies for items and services to be provided free ofcharge to supplement their input-based budgets. In addition, they receive a quality bonus of up to 25%allocated on a number of output indicators, such as antenatal and postnatal care, family planning visits, fullyvaccinated children and deliveries. Health care facilities report each month the quantity of incentivizedservices delivered. Local regulatory authorities make regular unannounced visits to facilities to assess drugavailability, prescription behaviour, facility sanitation and other standardized items. A provincial verificationcommittee exercises control (4, 5).
Results and experienceThe few evaluations performed in the early pilot years showed that integrating performance-based financingwith the free care policy significantly increased use of maternal and child health services and the qualityscores of health care facilities. The percentage of deliveries at health facilities increased to 72.9% in 2012,and modern family planning coverage rose to 25.3% (4) (Figure 2). External auditors found that technicalquality at health facilities and perceived quality improved from 59% to 79% and from 33% to 83%,
7
REFO
RMS
FOR
IMPR
OVIN
G TH
EEF
FICI
ENCY
OF
HEAL
TH S
YSTE
MS:
LES
SON
S FR
OM 1
0 CO
UNTR
Y CA
SES
COUNTRY CASES

8
HEAL
TH S
YSTE
MS
GOVE
RNAN
CE &
FIN
ANCI
NG
respectively, between 2010 and 2012, although there was no improvement in either technical or perceivedquality at district and national hospitals. The authors attributed the improvement to a change in qualityassessment practices at hospitals between 2010 and 2012. The reimbursement time dropped from an averageof 84 to 45 days in 2012. Nevertheless, 45% of health centres still experienced stock-outs of tracer essentialmedicines (4).
Figure 2. Increase in use of maternal and family planning services, Burundi, 2000-2012
Source: Burundi National Reproductive Health Programme.
80
70
60
50
40
30
20
10
02000 2001 2002 2003 2004 2005 2006 2007 2008 2009 2010 2011 2012
3.2 Chile
Forms of inefficiencyPublic and private health insurance developed side by side in Chile, leading to segmentation of health carefinancing by income and risk, which resulted in inequitable access and use of health services and outcomes byinsurance status. The National Health Fund (FONASA) is the single public insurer, covering 76.5% ofChileans, while private health insurers (known as ISAPRE) compete to cover approximately 20%. The publicscheme fully subsidizes the homeless and low-income members, while those who can contribute do so bycompulsory earnings-related payroll contributions, receiving a small subsidy from the State. For people whoopt out of the public system, private health insurers collected premiums based on the type of benefits, thehealth risk of the individual and the extent of coverage (i.e. cost-sharing or co-payment arrangements).While, in theory, people can choose their insurer, contributions are earnings-related, and “cream-skimming”was practised in the private sector; therefore, segmentation occurred by income and health risk. This resultedin a two-tier system in which members of private health insurers tended to be low-risk, high-income groupsusing exclusively private sector providers, and National Health Fund beneficiaries who were at higher risk andlower income, served mainly by an overburdened public sector. Because of longer waiting periods in thepublic sector, National Health Fund members disproportionately used less health care, resulting in inequity inaccess and health outcomes (6).
Policy changeIn 2005, a reform known as Universal Access with Explicit Guarantees (AUGE) was designed to providecitizens, irrespective of whether they were beneficiaries of the National Health Fund or private health insurers,an enforceable legal framework to access the same benefits package of services, high-quality, timely care forthe most prevalent health care problems in Chile and protection from health-related financial hardship. Inorder to maximize health gains, 56 priority health services representing 65% of the Chilean disease burdenwere offered (Annex 2), with capped, considerably reduced co-payments and limits on maximum waiting
Delivery rate in health facilities Modern family planning coverage

9
REFO
RMS
FOR
IMPR
OVIN
G TH
EEF
FICI
ENCY
OF
HEAL
TH S
YSTE
MS:
LES
SON
S FR
OM 1
0 CO
UNTR
Y CA
SES
times. Priorities were set on the basis of epidemiological studies of the disease burden, economic evaluationsof the available interventions and social studies on the needs and preferences of the population. The criteriaconsidered are listed in Table 1. Legislation required both public and private health care providers to offer themandated benefits package, abide by the caps on co-payments and deliver services within a given time.Accreditation and certification of providers was designed to raise quality standards by requiring providers tofollow a set of clinical guidelines for each medical condition prioritized in the AUGE reform (6).
Table 1. Prioritization of health problems and associated interventions, Chile
ñ Extent of the disease (e.g. incidence and prevalence) ñ Impact of the diseaseñ Cost of selected interventionsñ Analysis of potential demand for the interventionñ Supply available in the public and private systemsñ Financial burden on households
Source: Reference 6.
Results and experienceFor people in the lowest income quintile, the reform meant that 20% more services were now covered underAUGE (6), and, while use of AUGE services more than doubled between 2005 and 2011 (Figure 3) across allsocioeconomic groups, lower-income members of the National Health Fund used the system more (75%)than high-income groups (24.2%) (7). Targets for waiting time were generally met, although the waiting listfor AUGE treatments is longer than for non-AUGE services. Provider accreditation and licensing are stillincomplete, and health professionals have not welcomed the reform, as anticipated, as it adds a considerableadministrative burden to their daily routine. Only 40% of National Health Fund members were aware ofAUGE benefits in contrast to 98% of beneficiaries of private health insurance. Still, nearly 70% of Chileansconsidered that the country’s health care had improved since introduction of the AUGE reform, access beingthe most valued aspect; 60% of beneficiaries said that the change had resulted in higher-quality services (7).
Figure 3. Increase in new cases under Universal Access with Explicit Guarantees, Chile, 2005-2011
2 900
47 555
1 323 1 338
1 692
2 212 2 1751 984
2 683
89 78695 706
123 950110 509
124 810 126 952
200 000
180 000
160 000
140 000
120 000
100 000
80 000
60 000
40 000
20 000
0
2 8002 7002 6002 5002 4002 3002 2002 1002 0001 900
2005 2006 2007 2008 2009 2010 2011
1 8001 7001 6001 5001 4001 3001 2001 1001 000
900800700600500400300200100
0
Source: Reference 6.FONASA, National Health Fund; ISAPRE, private health insurers.
FON
ASA
(tho
usan
ds)
ISA
PRE
FONASA
ISAPRE

10
HEAL
TH S
YSTE
MS
GOVE
RNAN
CE &
FIN
ANCI
NG
3.3 China
Forms of inefficiencyInappropriate use of drugs and intravenous injections in China has been widely documented. Between 23%and 61% of all medical encounters result in injections, which is much higher than the WHO-recommended13–24%; and nearly half of all prescriptions for antibiotics are deemed medically unnecessary, as they areoften prescribed as treatment for the common cold, diarrhoea and cough. Fee-for-service payment anddistorted fee schedules that allow higher profit margins on drugs and sophisticated diagnostic tests presentstrong financial incentives for providers to overprescribe drugs, infusions and tests in order to maximize theirrevenue, especially when labour-intensive services such as office visits are undervalued.
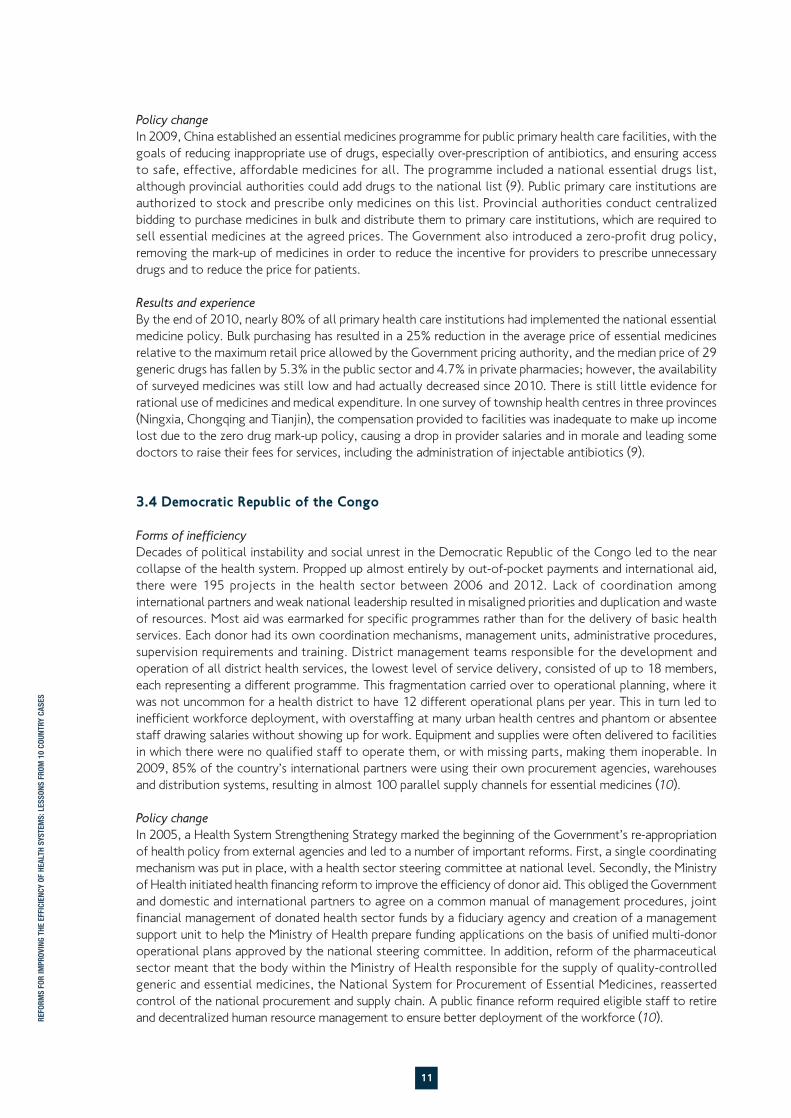
Provider incentives for higher-profit, branded products have also indirectly reduced the availability of essentialdrugs. A study in Shandong and Gansu provinces revealed that retail pharmacies stocked less than 20% ofproducts on the 2004 national essential drugs list and hospital pharmacies between 20% and 74%. The mostfrequent reason given by facilities for not purchasing essential medicines was that they were not the preferredtreatment choices of providers. Prescribing preferences in turn influence manufacturers’ production decisions,which are driven by economic considerations. This led drug expenditure to grow at an annual rate of 15%between 1990 and 2008, from CNY 36.59 to CNY 477.04 per capita, so that it accounted for nearly half ofall medical expenditure in 2008 (Figure 4). Liberal use of more expensive, branded products also increases theout-of-pocket burden on households (8). Thus, inappropriate use of drugs not only results in suboptimalquality of medical service delivery but also limits affordable access to essential medicines (9).
Figure 4. Rapid growth in medicine expenditure, China, 1990-2008
Source: Reference 8.
500
450
400
350
300
250
200
150
100
50
01990 1991 1992 1993 1994 1995 1996 1997 1998 1999 2000 2001 2002 2003 2004 2005 2006 2007 2008
Medicine expenditure per capita (RMB)
Policy changeIn 2009, China established an essential medicines programme for public primary health care facilities, with thegoals of reducing inappropriate use of drugs, especially over-prescription of antibiotics, and ensuring accessto safe, effective, affordable medicines for all. The programme included a national essential drugs list,although provincial authorities could add drugs to the national list (9). Public primary care institutions areauthorized to stock and prescribe only medicines on this list. Provincial authorities conduct centralizedbidding to purchase medicines in bulk and distribute them to primary care institutions, which are required tosell essential medicines at the agreed prices. The Government also introduced a zero-profit drug policy,removing the mark-up of medicines in order to reduce the incentive for providers to prescribe unnecessarydrugs and to reduce the price for patients.
Results and experienceBy the end of 2010, nearly 80% of all primary health care institutions had implemented the national essentialmedicine policy. Bulk purchasing has resulted in a 25% reduction in the average price of essential medicinesrelative to the maximum retail price allowed by the Government pricing authority, and the median price of 29generic drugs has fallen by 5.3% in the public sector and 4.7% in private pharmacies; however, the availabilityof surveyed medicines was still low and had actually decreased since 2010. There is still little evidence forrational use of medicines and medical expenditure. In one survey of township health centres in three provinces(Ningxia, Chongqing and Tianjin), the compensation provided to facilities was inadequate to make up incomelost due to the zero drug mark-up policy, causing a drop in provider salaries and in morale and leading somedoctors to raise their fees for services, including the administration of injectable antibiotics (9).
3.4 Democratic Republic of the Congo
Forms of inefficiencyDecades of political instability and social unrest in the Democratic Republic of the Congo led to the nearcollapse of the health system. Propped up almost entirely by out-of-pocket payments and international aid,there were 195 projects in the health sector between 2006 and 2012. Lack of coordination amonginternational partners and weak national leadership resulted in misaligned priorities and duplication and wasteof resources. Most aid was earmarked for specific programmes rather than for the delivery of basic healthservices. Each donor had its own coordination mechanisms, management units, administrative procedures,supervision requirements and training. District management teams responsible for the development andoperation of all district health services, the lowest level of service delivery, consisted of up to 18 members,each representing a different programme. This fragmentation carried over to operational planning, where itwas not uncommon for a health district to have 12 different operational plans per year. This in turn led toinefficient workforce deployment, with overstaffing at many urban health centres and phantom or absenteestaff drawing salaries without showing up for work. Equipment and supplies were often delivered to facilitiesin which there were no qualified staff to operate them, or with missing parts, making them inoperable. In2009, 85% of the country’s international partners were using their own procurement agencies, warehousesand distribution systems, resulting in almost 100 parallel supply channels for essential medicines (10).
Policy changeIn 2005, a Health System Strengthening Strategy marked the beginning of the Government’s re-appropriationof health policy from external agencies and led to a number of important reforms. First, a single coordinatingmechanism was put in place, with a health sector steering committee at national level. Secondly, the Ministryof Health initiated health financing reform to improve the efficiency of donor aid. This obliged the Governmentand domestic and international partners to agree on a common manual of management procedures, jointfinancial management of donated health sector funds by a fiduciary agency and creation of a managementsupport unit to help the Ministry of Health prepare funding applications on the basis of unified multi-donoroperational plans approved by the national steering committee. In addition, reform of the pharmaceuticalsector meant that the body within the Ministry of Health responsible for the supply of quality-controlledgeneric and essential medicines, the National System for Procurement of Essential Medicines, reassertedcontrol of the national procurement and supply chain. A public finance reform required eligible staff to retireand decentralized human resource management to ensure better deployment of the workforce (10).
11
REFO
RMS
FOR
IMPR
OVIN
G TH
EEF
FICI
ENCY
OF
HEAL
TH S
YSTE
MS:
LES
SON
S FR
OM 1
0 CO
UNTR
Y CA
SES

12
HEAL
TH S
YSTE
MS
GOVE
RNAN
CE &
FIN
ANCI
NG
Results and experienceReduced fragmentation resulting from the reforms decreased the management costs of internationallyfunded projects from an average of 28% in 2005 to 9% in 2011. Between 2009 and 2014, bettercoordination resulted in savings of more than US$ 56 million. Single multi-donor annual operational plans ateach level of service delivery also led to a significant reduction in waste and duplication at the provinciallevel in terms of drugs, medical equipment and human resources. The public finance reform allowed theGovernment to make substantial wage savings by reducing the overstaffing of hospitals, bringing them in linewith national standards and eliminating payments for phantom employees and staff eligible for retirement,who made up to 30% of the workforce in some urban facilities. The funds thus released were used to pay theremaining staff, increasing their motivation and productivity (Tables 2 and 3). Greater transparency inplanning and budgeting enabled some provinces to increase their operational budgets by 30%. Reform of thepharmaceutical sector and pooling of resources for drug transport by the regional distribution centres of theNational System for Procurement of Essential Medicines resulted in annual savings of more than US$ 3.5million (10).
Table 2. Reorganization of human resources in district hospitals in Kisangani and Bas-Congo, Democratic Republic of the Congo
District hospital No. of beds Initial staff Current staff Redeployed RetiredBoma (Bas-Congo) 200 225 114 49 62Lukula (Bas-Congo) 100 98 55 23 20Makiso (Kisangani) 168 226 112 26 88Kabondo (Kisangani) 160 85 88 0 0
Source: Direction d’Etudes et Planification, Ministère de la Santé Publique, 2010.
Table 3. Evolution of monthly salaries of hospital staff by occupational category, Democratic Republic of the Congo
Staff category Salary (in euros)Before rationalization After rationalization
Physician 50 230Administrator or manager 25 110Nurse A1 20 90Nurse A2 15 75Nurse A3 10 65Administrative assistant 10 70Driver n/a 50
A1, French Baccalauréat plus 3; A2, Baccalauréat; A3, pre-Baccalauréat.Source: Direction d’Etudes et Planification, Ministère de la Santé Publique, 2010.
3.5 El Salvador
Forms of inefficiencyA number of inefficiencies existed in El Salvador’s drug market before reform. There was limited competitionamong distributors, and entry of new participants was discouraged by high capital and registration costs. Druglegislation restricted the importation of a drug or product to a single distributor, and regulatory capture by thepharmaceutical industry led to conflicts of interest among the regulatory agencies meant to promote the bestinterests of the population. These distortions in the drug market resulted in high out-of-pocket expenditure fordrugs, limited access and consumer dissatisfaction. Lack of political will to regulate drug prices and capture bythe industry also meant that drugs were often registered without basic documentation on their quality andefficacy. Lack of laboratories, testing and inspection of drugs further compounded quality (11).

Policy changeThe 2012 Medicines Law modernized the regulation of drugs, creating an independent national regulatoryagency, the National Medicines Directorate, and setting the maximum retail prices at which drugs could besold. The Directorate updates the list of prices yearly and is responsible for monitoring compliance andissuing penalties when necessary for all activities in the supply chain, from the importation of foreign drugs todistribution to local facilities. It banned the pharmaceutical industry from giving royalties to physicians forpromoting their products, banned the hiring of Directorate officials who had direct relations with thepharmaceutical industry, regulated advertising on medicines, and required physicians to prescribe by activeingredient and not by brand. Updated standards of good practice and periodic inspections of laboratories andpharmacies were the first steps towards improved quality assurance of medicines (11).
Results and experienceThe effect was significant, with average overall price reductions of 20–25%, although the reductions differedby product, from 3.3% to 30.5%. The National Medicines Directorate estimated that Salvadorans were savedapproximately US$ 60 million a year in medicine expenses. The average increase of units in the inventories ofthe top five pharmacy chains was 616%, reflecting the number of units sold and the increase in sales volumefollowing the introduction of maximum retail prices. Surveillance and inspection of laboratories andpharmacies has also increased, leading to better-quality medicines. There is still some ambiguity in priceregulation, which could be taken advantage of; for instance, the maximum retail prices at which drugs can besold applies only to prescribed drugs and not to those sold over the counter. Therefore, the classification ofa drug has important implications for pharmaceutical companies (11).
3.6 Ethiopia
Forms of inefficiencyA large increase in the number of primary health care units in the past decade resulted in a doubling of healthposts and five times more health centres in Ethiopia. The health workforce required to meet the increase indemand did not, however, keep pace, showing aspects of both technical and allocative inefficiency. On theone hand, there was clearly an inefficient mix of inputs between capital and labour that limited productivity.Distances to staffed facilities were a major barrier to use of services. In 2005, there were 0.3 physicians and2 nurses per 10 000 population, which are among the lowest densities in Africa. On the other hand, thedistribution of the limited health workforce among and within districts was uneven, and they were poorlytrained, resulting in gaps in the delivery of essential services in rural areas. Only 25% of pregnant womenwere receiving antenatal care and only 33% of children were fully vaccinated (12).
Policy changeIn order to augment human resources for health, a new cadre of health extension worker was deployed tohealth posts to meet family and community demands. The goal was to have two salaried health extensionworkers for each population of 5000. Training would focus on a package of 16 well-defined healthinterventions and be considerably shorter than that of conventional health workers (Table 4). In addition,production of mid-level health professionals would be scaled up and tasks shifted from generalist andspecialist physicians to health officers and a new cadre of emergency surgical officers. Innovative pre-servicetraining programmes were introduced for general practitioners in 13 additional colleges and universities,many outside regional capitals. Regional quotas were set for applicants from disadvantaged regions (12).
13
REFO
RMS
FOR
IMPR
OVIN
G TH
EEF
FICI
ENCY
OF
HEAL
TH S
YSTE
MS:
LES
SON
S FR
OM 1
0 CO
UNTR
Y CA
SES

14
HEAL
TH S
YSTE
MS
GOVE
RNAN
CE &
FIN
ANCI
NG
Table 4. Services included in the health extension worker programme, Ethiopia
Hygiene and Environmental Sanitationñ Excreta disposalñ Solid and liquid waste managementñ Water supply safetyñ Food hygiene and safetyñ Healthy home environmentñ Arthropod and rodent controlñ Personal hygiene
Disease Prevention and Controlñ Prevention and control of HIV and other STIsñ Tuberculosis prevention and controlñ Malaria prevention and controlñ First aid
Family Health Servicesñ Maternal and child healthñ Family planningñ Immunizationñ Adolescent and reproductive healthñ Nutrition
Health Education
Source: Reference 12.
Results and experienceBy the end of 2012, more than 35 000 health extension workers had been trained and deployed, surpassing thecommunity-level targets (Figure 5). The ratio of health officers to population improved from 1 per 63 785 in2007 to 1 per 17128 in 2012. In 2013, 136 emergency surgical officers graduated and were deployed,improving emergency obstetric services in rural communities. An additional 3200 nurses graduated frommidwifery training and were deployed nationwide. While the number of general practitioners is stillconsidered inadequate, the number of graduates per year is projected to surpass 3000 after 2018, from alevel of 336 in 2010. As a result, use of high-impact interventions has increased. The rate of acceptance ofcontraceptives increased from 23% to 62%, use of antenatal care doubled, from 41% to 82%, attendedskilled deliveries rose from 10% to 17%, attendance at postnatal care increased from 16% to 42%, andaccess to improved sanitation reached 86% between 2004 and 2011 (Figure 6). In 2013, 95% of health postswere treating malnutrition, and 79% were offering integrated community case management of pneumonia,malaria, diarrhoeal diseases and severe acute malnutrition. While cost–effectiveness has not been studied,the salary of a health extension worker is less than that of a professional health worker, and health extensionworkers are chosen from within communities to ensure sustainability; this is the only cadre for which the ratioof health worker to population is similar in all regions. The estimated savings from lower wage bills forhealth extension workers, health officers and emergency surgical officers are US$ 20 million per year (12).

Figure 5. Number of health extension workers deployed, Ethiopia
Figure 6. Increased use of high-impact interventions, Ethiopia, 2004-2011
15
REFO
RMS
FOR
IMPR
OVIN
G TH
EEF
FICI
ENCY
OF
HEAL
TH S
YSTE
MS:
LES
SON
S FR
OM 1
0 CO
UNTR
Y CA
SES
2 737
9 900
Target 2015
17 653
24 57131 831
33 839
(33 320)
2005/6 2006/7 2007/8 2008/9 2009/10 2010/11
40 000
30 000
20 000
10 000
0
Source: Reference 12.
Source: Reference 12.
100
90
80
70
60
50
40
30
20
10
0Contraceptive
acceptance rateAntenatal
careSkilleddelivery
Postnatalcare
Access to improvedsanitation
2004 2011
Target for the universal coverage Training and deployment of HEWs

16
HEAL
TH S
YSTE
MS
GOVE
RNAN
CE &
FIN
ANCI
NG
3.7 Mexico
Forms of inefficiencyTwo parallel subsystems operate in Mexico. In the first, formal sector workers and their families receivecomprehensive health care through social security funded by payroll contributions from the FederalGovernment, employers, employees and a State subsidy. Various social security schemes, of which theMexican Institute of Social Security and the Institute of Social Security and Services for Government Workershave the largest membership, offer different health insurance benefits provided only through their ownnetwork of health care providers. In the second subsystem, uninsured people (farmers, self-employed andunemployed people), representing nearly half the population or 60 million people, relied on consistentlyunderfunded, limited health services provided by the State. Health sector resources were allocated frombudgets that were based on the availability of infrastructure and personnel, perpetuating inefficient andinequitable distribution. Wide variations in public expenditures on health were seen, not only between peoplecovered under social security schemes and those who were uninsured but also among states. In 2000, publichealth expenditure was twice as high for people covered by social security schemes than for the uninsured,and per capita Federal expenditure was six times higher in the state receiving the most funding than in thestate receiving the least support. Inequities in financing and access to health care services resulted in extensiveout-of-pocket health spending, accounting for nearly half of total health expenditure (13–15).
Policy changeIn 2003, the Government legislated creation of the Social Protection System in Health, which includedpopular health insurance, which guarantees defined benefits packages to all people not covered by any socialsecurity scheme; the Fund for Personal Health Services, which included essential primary and secondary levelinterventions considered the most cost–effective for treating the conditions prevailing in the population; andthe Fund for Protection against Catastrophic Health Expenditure, which offered additional coverage of alimited number of high-cost specialized treatments. Federal contributions to popular health insurance werealigned with that of the Mexican Institute of Social Security in order to redress some of the past fundinginequities between those with and without social security. Instead of relying on past budgets, actuariallycalculated premiums, transfers from the State and family contributions by ability to pay would now determinepublic health sector funding (13, 14).
Results and experienceBy 2013, an additional 53 million people were covered by popular health insurance and had access to284 interventions, 522 medicines and services for 57 catastrophic conditions. This led to a decrease inout-of-pocket expenditure as a share of income, especially among families newly covered by popularhealth insurance. Between 2004 and 2010, impoverishing health expenditure fell from 0.2% to 0.1% forhouseholds with social security and from 2.1% to 1.6% for those without. While public expenditure onhealth as a share of GDP increased by 0.7% from 2.4% between 2000 and 2009 to accommodate for theexpansion of health insurance, the ratio of public spending on people covered by social security andthose covered under the public system decreased from 2.1% to 1.2%. In 2007, the Institute of SocialSecurity and Services for Government Workers, the other major social security provider, was alsorestructured in anticipation of the creation of a single payer scheme. Large inefficiencies remain, however.Fragmentation among several health insurance schemes that offer different benefits, are financedseparately and deliver services through their own network of providers result in high administrative costs,amounting to 10.8% of total health expenditure in 2011 (14, 15).
3.8 Republic of Korea
Forms of inefficiencyThree types of health insurance funds existed in the Republic of Korea: one for employees, one for schoolteachers and civil servants and one for self-employed people. Membership was mainly based on workplace(for employees) or residential area (for self-employed people). While all three schemes provided the samestatutory benefits and reimbursement of providers, the premium contributions were unequal, self-employedpeople being charged on the basis of income, property and household size, while employees were charged

17
REFO
RMS
FOR
IMPR
OVIN
G TH
EEF
FICI
ENCY
OF
HEAL
TH S
YSTE
MS:
LES
SON
S FR
OM 1
0 CO
UNTR
Y CA
SES
only on the basis of wage income. The complexity of the contribution rules meant that many beneficiaries didnot understand what their premiums were meant to be. With the addition of the difficulty of measuring theincome of self-employed people, this led to higher noncompliance rates in this population than among thoseemployed in the formal sector.
The burden of contributions also differed from region to region, and fiscal deficits were common amongschemes for self-employed people. Despite Government subsidies to self-employed funds, the amount wasnot comparable to that which employers paid on behalf of their employees. The management of funds wasfragmented among more than 350 quasi-public not-for-profit insurers, so that the amount of insurance fundswas often too small to efficiently pool risk. Of major concern were the high administrative costs and inequityin premium contributions, fiscal sustainability and utilization of insurance funds (16).
Policy changeIn 2000, health insurance funds were merged into a single risk pool and managed by two agencies: theNational Health Insurance Scheme and the Health Insurance Review and Assessment. The National HealthInsurance Scheme collects premiums and processes claims to providers, while the Health Insurance Reviewand Assessment is responsible for purchasing, including setting the benefit package and provider paymentmethod, and reviewing claims. A health insurance policy committee approves major decisions on healthinsurance at national level, such as contribution rate, benefits packages and pricing. It is composed of 25members, with the Vice-Minister of Health and Welfare as the chair and a tripartite committee of payers,providers and experts and public agencies. Attempts have been made to equalize the contribution rates ofemployed and self-employed beneficiaries (16).
Results and experienceA major efficiency gain was obtained by merging the three insurance schemes into a single risk pool, resultingin significant savings in administrative costs, which dropped from 7.87% of all National Health InsuranceScheme expenditure to 2.38% between 1996 and 2008 (Table 5). There is limited evidence for equity of use,although the savings in administrative costs have allowed expansion of health insurance benefits to includemore services for all (e.g. screening programmes for five cancers, reduced co-insurance rates for conditionsthat incur significant out-of-pocket expenditure, and ceilings for cumulative out-of-pocket payments for theservices covered every 6 months) (16).
In addition, the collection and contribution rate as a share of total National Health Insurance Scheme revenuefor self-employed people has increased steadily, from 89.6% in 2000 to 96.3% in 2009 and from 9.8% in1988 to 20.5% in 2008 (17). While premium contributions have been equalized between self-employed andemployed groups, the self-employed contribution formula remains more regressive.
Table 5. Decreases in health insurance administrative costs (KRW), Republic of Korea, 1996-2008
Year 1996 1997 1998 1999 2000 2001 2002 2003 2004 2005 2006 2008Total 6 379 7 555 8 701 9 610 10 744 14 108 14 798 15 972 17 330 19 980 22 818 28 273expenditureAdministrative 502 618 639 571 696 629 598 634 693 759 779 672costsProportion of 7.87 8.18 7.34 5.94 6.48 4.46 4.04 3.97 4.00 3.80 3.41 2.38administrativecosts (%)
Source: Health Insurance Statistics (2012).

18
HEAL
TH S
YSTE
MS
GOVE
RNAN
CE &
FIN
ANCI
NG
3.9 South Africa
Forms of inefficiencyIn South Africa, years of apartheid resulted in a highly fragmented health care system, as reflected in thefinancing and delivery of medicines. First, medicines were financed and delivered in ways that reflected racialprivilege. For white patients, drugs were provided from private pharmacies and paid for by provincialdepartments of health. For non-whites, medicines were procured by the National Department of Health andthe Bantustan1 departments of health and distributed to hospitals and other facilities; however, funding forhealth care services and drugs were systematically underfunded in the Bantustans. In addition, weak,fragmented health authorities procured and distributed drugs inefficiently. Medicines for the public sectorwere selected by each provincial department of health, which operated its own central medical store ordepot, predominantly for curative care, and by the National Department of Health for preventive andpromotional services. Drug procurement was not evidence-based, medicines were overpriced, and stores werefilled with non-essential medicines. In 1994, the essential medicines list included 2600 items, including asignificant number of duplicates of the same pharmacological class (18).
Policy changeIn 1995, an essential drugs programme was established to rationalize the selection, procurement, distributionand use of drugs. After the democratic transition, each of the nine new provinces was required to set up itsown pharmaceutical depot in order to bring more effective distribution closer to health facilities. Provincialpharmacy and therapeutics committees would make selections and include drugs on procurement lists.Selection of an essential drug would be based on the needs of the population, evidence of effectiveness andproduct quality, use of generics, a commitment to support reliable local suppliers and, in general, a preferencefor single-agent products (18). The results of the programme are shown in Figure 7.
1 Bantustans were tribal homelands set aside for Black African ethnic groups as part of the policy of apartheid. The Bantustans hadquasi-independent powers, with separate health departments.
Figure 7. Results of an impact study by the South African Essential Drugs Programme
Source: Reference 18.EML, essential medicines list; STG, standard treatment guidelines.
% of encounters in which an injection was prescribed
% of encounters in which an antibiotic was prescribed
% of items prescribed generically
% of prescribed medicines from the EML
% availability of medicines from EML
% availability of key medicines
% availability of STG/EML
0 10 20 30 40 50 60 70 80 90 100
follow-up (2003) baseline (1998)

19
REFO
RMS
FOR
IMPR
OVIN
G TH
EEF
FICI
ENCY
OF
HEAL
TH S
YSTE
MS:
LES
SON
S FR
OM 1
0 CO
UNTR
Y CA
SES
Results and experienceBy 2008, the number of medicines on the essential drugs list had dropped to 337 (in 422 dosage forms);however, there is no published evidence that introduction of standard treatment guidelines and essentialmedicines lists improved the efficiency of procurement of medicines in the public sector. The variable financialmanagement in provinces meant that some provinces were unable to pay suppliers on time, resulting ininterruption of services and repeated stock-outs. While the use of injections and prescription of essential drugsbecame more rational, there was no evidence of more generic prescriptions between 1998 and 2003 (18).
3.10 Uruguay
Forms of inefficiencyHealth insurance in Uruguay was fragmented: the public State Health Services Administration provided healthservices free of charge to predominantly low-income groups, and a collective of health care institutions, themain private health provider, delivered care to workers in the formal sector through a network of privatehospitals and clinics. The collective, composed of small insurers and lenders, had complex, diversecontribution schemes, which varied by geographical location, their ability to attract clients and the age andrisk of the affiliated population (19). These small risk pools meant that most of the insurers had severefinancial difficulties. Between 2000 and 2005, 19% of collective members disappeared (42% in Montevideo).Growing concern about the efficiency and financial sustainability of the health sector were also due to theallocation of resources. Thus, the system had not responded to the country’s changing epidemiologicalprofile. In 2002, chronic diseases accounted for 75% of all lost disability-adjusted life years, andcardiovascular diseases and tumours accounted for 58% of all deaths, yet few health sector resources werededicated to primary care, prevention or health promotion (20).
Policy changeIn 2007, the National Integrated Health System brought together the private and public subsystems. Its aimwas to provide comprehensive, equitable universal health coverage under a single benefits plan known as theIntegrated Health Care Plan, which shifted the focus of service delivery back towards primary health care,prevention of noncommunicable diseases and health promotion activities. Twelve national programmes weremeant to cover conditions covering an individual’s entire life span, including a series of preventive anddiagnostic services (Table 6). The creation of the National Health Fund unified preexisting insurance schemesinto a single national health insurance scheme. It is funded by mandatory contributions from employers,pensioners and workers on the basis of income and household size and the central Government. It paysproviders by capitation adjusted for the age and gender of the beneficiaries and the fulfilment of predefinedhealth care goals. Integrated private providers, which include both public service providers such as the StateHealth Services Administration and private providers such as the collective of health care institutions, thendeliver services to national health insurance beneficiaries (20).
Table 6. Programmes included in the National Integrated Health System (Integrated Health Care Plan benefits), Uruguay
ñ National Child Health Programme ñ National Women’s and Gender Health Programme ñ National Adolescent Health Programme ñ National Senior Health Programmeñ National Oral Health Programmeñ National Mental Health Programmeñ National Programme for People with Disabilitiesñ Sexually Transmitted Diseases–AIDS Priority Programmeñ National Nutrition Programmeñ National Programme for Care of Problem Drug Usersñ National Tobacco Control ProgrammeThere is a plan to include mental health services in the integrated national health system.
Source: Reference 19.

20
HEAL
TH S
YSTE
MS
GOVE
RNAN
CE &
FIN
ANCI
NG
Results and experienceThe reform led to a number of positive changes: ñ expansion of health insurance coverage to immediate family members and retired formal workers; the
population covered by the national health insurance thus doubled, reaching 1.59 million people in 2010 or47.5% of the population;
ñ statutory benefits available to all;ñ renewed emphasis on primary care and the prevention of noncommunicable diseases;ñ more equitable, transparent national health insurance premiums that take into account household size and
income; and ñ a decrease in household out-of-pocket expenditures by more than 5 percentage points between 2007 and
2010 (19).
3.11 Summary The country cases presented here show that many reforms were motivated not only to improve efficiency butalso to improve equity, as seen in Burundi, Chile, Ethiopia, Mexico, the Republic of Korea and Uruguay.Further, inefficiencies in many countries manifested as problems of both allocative and technical efficiency.Nonetheless, this collection of country cases illustrates the increased attention to efficiency in the globalquest towards universal health coverage.
In both Burundi and Ethiopia, technical inefficiency resulted from an inefficient mix of inputs. In Burundi,increased funding for free maternal and child care did not increase use of those services as expected, untilperformance-based financing was introduced to incentivize providers to increase the quantity and quality ofservices delivered. In Ethiopia, investment in health centres to improve access to primary care had a limitedeffect until they were adequately staffed with health extension workers and mid-level professionals. This wasmade possible by task shifting and shorter training programmes that helped address the shortage of humanresources at minimum cost.
Chile, Mexico and Uruguay attempted to reduce inequity and fragmentation in their health insurance systems.Chile introduced services to standardize the benefit package of services for all, irrespective of whether theywere enrolled in public or private schemes. Similarly in Uruguay, an integrated national health systemproviding comprehensive care to all residents eliminated fragmentation in the insurance system and reducedinequities in financing of and access to services. While Mexico did not create a single national health insurancefund, it attempted to redress the inequity between people with and without social security by guaranteeing apackage of essential benefits to those not covered by social security and by harmonizing Federalcontributions to the public and the predominant social security scheme. All three countries attempted toachieve allocative efficiency by explicitly prioritizing their financing and benefits packages for the healthconditions that cause the greatest burden of disease and to include the most cost–effective interventions.For example, in Uruguay, health care was re-focused on primary care and health promotion and prevention tomanage the increasing prevalence of chronic diseases. In Chile and Uruguay, further attempts were made toimprove technical efficiency by mandating all providers (both public and private) to deliver priority healthcare services in the benefits package for the same price (Chile) and by using pay-for-performance (Uruguay).The Democratic Republic of the Congo also attempted to achieve better allocation of resources, by creatinga new set of transition structures to better coordinate donor involvement and development assistance forhealth with Government priorities.
China, El Salvador and South Africa had major technical inefficiencies in over-prescription of medicines,under-utilization of generic and essential drugs, fragmentation of supply and distribution chains and thepricing and regulation of pharmaceuticals (El Salvador). In other words, the same health gain could beachieved at lower cost by addressing these issues. The three countries introduced a combination of essentialdrug lists, maximum drug prices and good practice policies to limit inappropriate and ineffective use ofmedicines, encourage the use of generics over higher-priced brand-name drugs and curb the circulation ofsubstandard products in the system. The case study of the Republic of Korea illustrates how merging multipleinsurance funds can significantly reduce high administrative costs and achieve greater technical efficiency.

21
REFO
RMS
FOR
IMPR
OVIN
G TH
EEF
FICI
ENCY
OF
HEAL
TH S
YSTE
MS:
LES
SON
S FR
OM 1
0 CO
UNTR
Y CA
SES
Table 7 summarizes the problems addressed in each case study and the types of inefficiency the countriesattempted to overcome.
Table 7. Summary of case studies
Little use ofmaternal and child healthservices.Poor quality (e.g. frequent stock-outs).
Fragmentation of health financingby income and health risk.Inequity incoverage, accessand healthoutcomes.
High out-of-pocket drugexpenditure.Poor quality andinappropriate useof drugs.
Fragmentation of health financing andservice delivery.High managementcosts.Duplication andwaste of resources.Misallocation of resources.
High out-of-pocket drugexpenditure.Poor-qualityproducts.
Burundi
Chile
China
DemocraticRepublic of theCongo
El Salvador
Performance-basedfinancing explicitlylinked to benefits package to improvequantity and quality of services.
AUGE* benefit package.Accreditation |andcertification ofproviders.
Essential drugs list.Zero-profit drug policy.Subsidy to providers to compensate loss of drug revenue.
Single national steeringcommittee. Common manual ofprocedures agreed uponby Government and allpartners.Single operationaldistrict plans.Establishment of jointfinancial management.
Price controls.Creation of anindependent regulatoryagency.Standards of goodpractice.
Provision of free maternal, newborn and child services for targeted increasein use of priority health services.Complementary supply-sideintervention required to motivateproviders to deliver priority services Importance of managerial capacity and information systems in contractingproviders and monitoring theperformance-based financing scheme.Alignment of donor support withcountry priorities.
Prioritization of cost–effective healthinterventions.Complementary supply interventionrequired to motivate providers todeliver AUGE services.Importance of managerial capacity to monitor use of clinical guidelinesand accredit providers.
Prioritization of essential medicines for basic primary care.Difficult to implement policy objectivesin a decentralized context in theabsence of accountability mechanisms.Importance of managerial capacity toselect and procure drugs.
Strong leadership required to align andcoordinate international aid with sectorpriorities.Coordinated planning, budgeting and resource allocation to reducewaste and duplication of resources and decrease management costs.
Investment in independent regulatoryagencies required for licensing,accreditation, monitoring andevaluation functions.Importance of managerial capacity andinformation systems to regulate thepharmaceutical industry.
Problem Intervention Lessons

22
HEAL
TH S
YSTE
MS
GOVE
RNAN
CE &
FIN
ANCI
NG
Low-density healthworkforce.Health clinics notadequately staffed.Uneven distributionof health workersthroughout the country.Little use of services.
Inequitablefinancing andaccess to healthservices.Uneven distributionof resources.
Inequitablefinancing andhealth service use.High administrativecosts.
Inequitable drugfinancing andaccess tomedicines.
Fragmentation and inequity inhealth financing. Misallocation of resources.
Ethiopia
Mexico
Republicof Korea
SouthAfrica
Uruguay
Creation of a new cadre of communityhealth worker.Task-shifting fromphysicians to mid-levelprofessionals.Regional quotas for physicians fromdisadvantaged regions.
Creation of a package of guaranteed healthbenefits for all those not covered by socialsecurity.
Multiple health insurance schemesmerged into a singlepayer.Revision of premiumcontribution formula.
Essential drugs list.Standards and guidelines for drug use.
Merging of multiplehealth insuranceschemes into a singlenational health fund.Integrated Health Care.Plan benefit package.
Prioritization of primary care at community level.Use of non-traditional health workersand task-shifting to achieve a betterinput mix .
Prioritization of primary and secondarylevel cost–effective interventions.High administrative costs remain due to managing multiple and fragmentedinsurance schemes.
Merger to reduce fragmentation of riskpooling and administrative costs.
Prioritization of essential medicines for basic primary care.Difficult to implement policy objectivesin a decentralized context in theabsence of accountability mechanisms. Importance of managerial capacity toselect and procure drugs.
Merger to reduce administrative costs of fragmentation.Prioritization of primary care and health care provision aligned withepidemiological profile.
Problem Intervention Lessons
*AUGE, Universal Access with Explicit Guarantees.

23
REFO
RMS
FOR
IMPR
OVIN
G TH
EEF
FICI
ENCY
OF
HEAL
TH S
YSTE
MS:
LES
SON
S FR
OM 1
0 CO
UNTR
Y CA
SES
4LESSONS LEARNT
Latitude in defining inefficiencies in the various case studies makes it difficult to synthesize the lessons learnt.The types of inefficiency addressed in the 10 country case studies are different, with no standard frameworkto conceptualize or quantify efficiency. Little information has been reported on the costs of reform: studiesusually provide only output or outcome measures. Despite the widely varying forms of inefficiency, thedifferent country contexts and the range of policy instruments used to achieve greater efficiency in the healthsector, a number of lessons and recommendations emerge. In most cases, improving efficiency in the healthsystem will be complex and continuous, requiring careful planning and a coordinated system-wide approach.
4.1 Prioritization of primary health careMore than 30 years after the Alma Ata Declaration on the importance of primary health care, essential healthservices are receiving renewed attention. In Burundi, under the 2006 free care policy, health care facilitieswere funded to deliver maternal and child health services for free to children under 5 years and to pregnantwomen. Later policies included the provision of free services for the prevention and treatment of infectiousdiseases. In Ethiopia, childhood vaccination, family planning services, prevention and treatment of malariaand treatment of diarrhoea and pneumonia in children under 5 years formed the basis of the health extensionworker training programme to meet community demand. The Republic of Korea offers maternal and childhealth services, family planning, vaccination, prevention of both communicable and chronic diseases andcancer management programmes. In Uruguay, 12 national programmes are included in the NationalIntegrated Health System, which is focused on primary care and disease prevention. The programmes werechosen so as to follow individuals throughout their life span, with a reference physician who detects riskfactors early on and provides continuous care.
There is also better efficiency in the delivery of primary health care. China and South Africa established listsof essential drugs that must be stocked by all primary care facilities. National drug policies are intended, intheory, to promote rational, cost–effective use of drugs and ensure the availability and accessibility ofessential drugs for all citizens.
4.2 Alignment of financing and deliveryA second major lesson is complementarity of policies, in particular alignment of financing and deliverystrategies. Health insurance is a prime example of a complex intervention that can have multiple, system-wide effects. Stand-alone financing interventions that increase or modify benefits packages separately fromcomplementary supply-side interventions are unlikely to achieve the desired result. Before the reforms inBurundi, Chile and Ethiopia, policy-makers did not anticipate the physical, human and financial resources thatwould be required to accompany the extension of health care benefits. Burundi experienced a markeddeterioration of quality at health care facilities, with frequent stock-outs of medicines, equipment failures andlow staff morale. Providers in Chile were unwilling to inform patients about their AUGE entitlements, as eachAUGE treatment increased the administrative burden of recording information. The uneven distribution andinappropriate skill mix of health care workers in Ethiopia also led to low staff morale and unmanned healthfacilities, especially in rural areas.
4.3 Better accountability through outcome- and output-based contracts with providersThe empirical literature has shows consistently that providers often react to financial incentives in ways thatare at odds with cost containment. Each provider payment method, as well as the level of payment that is

24
HEAL
TH S
YSTE
MS
GOVE
RNAN
CE &
FIN
ANCI
NG
set, carries powerful incentives that drive both the quantity and quality of services (21, 22). Whileperformance-based financing in Burundi linked payment of institutions to predefined outputs, the zero-drugpolicy in China delinked provider payment from prescribing behaviour. Financial incentives are also not theonly way to motivate providers. Whereas Burundi used financial incentives to increase quality, Ethiopiaachieved a similar improvement in service quality by matching training to community needs and providingcareer development. The reforms in Chile lacked a clear implementation and training strategy to motivateproviders to deliver the priority AUGE interventions. Involving clinical physicians in prioritization of healthservices might have improved their responsiveness and acceptance of the reforms.
4.4 The right input mixFinding the optimal mix of skills in health workers and type of health facility can stretch limited health careresources and improve technical efficiency. For instance, task shifting among the health workforce in Ethiopiaand the creation of a new cadre of non-traditional health extension workers to deliver 16 commoninterventions in local communities not only redressed the skewed distribution of providers towards urbanareas but also resulted in large savings in wage bills.
4.5 Implementation in a decentralized system The organization of service delivery, including changes in incentives and the autonomy of decision-making,must be aligned with the policy objective. In South Africa, fiscal federalism under the 1996 constitution meantthat the national Department of Health had limited power to ensure the selection and procurement of drugs atprovincial level. As State revenues are allocated to provinces on the basis of demographic needs and socialindicators, provincial treasuries become the main source of funds for provincial departments, and they areunder no legal obligation to select and procure essential drugs. Therefore, despite a national drug policy andcomprehensive, standard treatment guidelines, some provinces choose drugs in the same pharmacologicalclass, creating unnecessary duplication of products, with no evidence-based reason. Similarly, provinces inChina can supplement essential drugs lists, and it is not uncommon to find that drugs that have been left offthe national drug list because of lack of effectiveness or negative side-effects are included on provincialsupplementary lists. This puts into question the ability of institutional structures to enforce national policies ina decentralized context in the absence of accountability mechanisms.
4.6 Independent regulatory agencies Countries that are successful in ensuring quality standards tend to have engaged an independent regulatoryagency to license and accredit facilities and providers and for monitoring and evaluation. In Burundi, theMinistry of Health remains the main financing agent, provider and regulator, making it difficult to applyfinancial sanctions. Similarly, in El Salvador before the reforms, the regulation of drugs involved considerableconflicts of interest, some officials being either directly or indirectly involved in the pharmaceutical industrythey were meant to regulate. Providers could also receive royalties for promoting pharmaceutical products.Creation of the National Medicines Directorate and its financial independence from the Government not onlyremoved conflicts of interest but also gave the regulator sufficient power and resources to monitorcompliance and impose penalties.
4.7 Managerial capacity and information systems All these reforms require managerial capacity and health information systems that allow monitoring andevaluation of health system performance to improve transparency and accountability. The cost ofimprovement can vary significantly among high-performing and low-performing ministries, organizations,facilities and providers. Therefore, it is important to understand the baseline capability of each. Purchasersshould be able to identify qualified, eligible providers who clearly demonstrate their capacity to supplyservices and to meet the service volume requirements and quality standards. Insurers themselves must be ableto negotiate and manage contracts with providers. Independent regulators must have access to timely,accurate data in order to assess provider compliance with contractual obligations and quality standards.
4.8 Fragmentation: a common source of inefficiencyFragmentation of organization and service delivery is a common source of inefficiency. In the Republic ofKorea, management of multiple risk pools incurred high administrative costs and inequities in financing andhealth care use. Mexico still struggles with high administrative costs and residual inequity in access to

25
REFO
RMS
FOR
IMPR
OVIN
G TH
EEF
FICI
ENCY
OF
HEAL
TH S
YSTE
MS:
LES
SON
S FR
OM 1
0 CO
UNTR
Y CA
SES
services, as multiple insurance schemes covered formal sector workers and the Social Protection System inHealth each had their own risk pools, funding sources, benefit packages, provider networks and administrativestructures. In Chile and Uruguay, parallel public and private insurance schemes segmented populations by riskand income, leading to inequity in coverage, access, quality and outcomes. In South Africa, the legacy ofapartheid carried over into separate financing and delivery of medicines. In the Democratic Republic of theCongo, lack of coordination among the many international partners resulted in the duplication of services,waste of resources and misallocation of financial and human resources.
Although not described explicitly in the case studies, a growing body of evidence links integrated deliverysystems with better quality and efficiency (23–26). It is not clear whether “gatekeeping” and coordinationpolicies are part of the reforms made in the 10 countries. If patients are allowed to by-pass primary carefacilities to seek care at tertiary hospitals or to demand brand-name drugs rather than generics, potentialsavings from the right mix of interventions and medicines are compromised. For example, in Kyrgyzstan, areform in outpatient drug packages for hypertension control meant that 95% of prescriptions were writtenfor generics, but only 45% of the medicines purchased with the prescriptions were for generics, as patientsdemanded brand names at the point of sale (probably due to the influence of pharmacists) (27). Attaininguniversal health coverage will require not only an appropriate mix of benefits and medicines to protectindividuals from out-of-pocket expenditures but also features to promote cost–effective use of care.
4.9 Alignment of donor support with country prioritiesCollaboration with development partners in Burundi helped the Government to pool resources forharmonized policy objectives, facilitate the design and implementation of performance-based financing anddevelop local capacity for negotiating contracts and monitoring and evaluating provider performance. Thismay be an interim solution for countries when sustained financial investment is needed and managerial,monitoring and evaluation capacity is weak. In the Democratic Republic of the Congo, poor governance andlack of leadership in the health sector meant that donor aid was often used to support disease-specificprogrammes rather than basic health services under a nationally coordinated health sector plan. It was notuntil a group of decision-makers from the Ministry of Health, civil society and aid agencies reassertedthemselves in the health sector that donor support became aligned with the country’s health priorities.

26
HEAL
TH S
YSTE
MS
GOVE
RNAN
CE &
FIN
ANCI
NG
5FUTURE DIRECTIONS
The lessons learnt indicate several ways of improving efficiency.
5.1 A broader systems focusThe case studies presented here clearly show that one intervention can affect the wider system; thus, it isimportant to design interventions by a systemic approach, in which different policy instruments are aligned.Achieving the desired results will depend on anticipating these effects and planning comprehensive or phasedreforms. For example, will providers and health care facilities be able to cope with an increased demand afterexpansion of health care benefits? Will providers be trained to comply with new and changing protocols, andwill they be compensated for providing additional services, especially if this increases their administrativeburden? Will the purchaser be able monitor service delivery agreements with providers?
5.2 Measures of health system efficiencyAs seen in the country case studies, “efficiency” can be interpreted broadly; therefore, a framework is requiredto measure, quantify and compare inefficiency. Outcome measures, in terms of health status, financial riskprotection and public satisfaction, are often given priority, with little thought for the inputs expended andthe costs required to effect such change. Yet, both are required for analysing system efficiency. For example,if the focus of an intervention is to improve allocative efficiency, the input indicators could include thepercentage of government health expenditure allocated to primary, secondary and tertiary care or thepercentage of the population covered by priority interventions, depending on the problem to be addressed bythe system, such as uneven distribution of physical and human resources between urban and rural areas, afocus on hospital and curative care or less use by lower-income groups (28). In contrast, the introduction ofperformance-based financing makes it easier to assess the technical efficiency of some interventions, asprocess indicators are often used, such as the percentage of doctors who follow clinical and best practiceguidelines, the number of antenatal care consultations given, the rate of health worker absenteeism and theaverage number of days required to register a drug.
5.3 Research on process and implementation Most of the interventions described in this report are measured as single activities, with a focus on impact, i.e.whether the intervention achieved its desired outcome. Much less attention is given to the political,organizational and service delivery environments in which they were implemented and the circumstances inwhich outcomes are maximized. Yet, allocative and technical efficiency are measures precisely of theconditions or processes under which inputs are translated into maximum output. Implementation researchcan offer valuable information about the factors that enable or constrain efficient use of public resources inthe health sector and the processes that must be in place. This is a currently neglected field of research.
5.4 Information systems and managerial capacityImproving transparency and accountability requires better administrative data on costs and routine service,plus the capacity to analyse and process information. While price and volume controls strongly affect costcontrol and service delivery, they are “blunt instruments”. As the capacity and experience of health authoritiesand regulatory agencies increase, aligning resource allocations to population need, value-based pricing,health technology assessments and performance-based financing may be more widely used as policyinstruments to increase efficiency.

27
REFO
RMS
FOR
IMPR
OVIN
G TH
EEF
FICI
ENCY
OF
HEAL
TH S
YSTE
MS:
LES
SON
S FR
OM 1
0 CO
UNTR
Y CA
SES
REFERENCES
1. Value for money in health spending. Paris: Organisation for Economic Co-operation and Development;2010.
2. Chisholm D, Evans D. Improving health system efficiency as a means of moving towards universalcoverage. Background paper for World health report: Health systems financing: the path to universalcoverage. Geneva: World Health Organization; 2010(http://www.who.int/healthsystems/topics/financing/healthreport/whr_background/en, accessed 24August 2015).
3. Health, nutrition and population statistics. Washington DC: World Bank; 2013.
4. Sibomana S, Reveillon M. Performance based financing of priority health services. Background paper,Burundi. 2015.
5. Bonfrer I, Van de Poel E, Van Doorslaer E. The effects of performance incentives on the utilization andquality of maternal and child care in Burundi. Soc Sci Med 2014;123:96–104.
6. Aguilera I, Infante A, Ormeno H, Urriola C. Implementation of the Universal Access with ExplicitGuarantees (AUGE) reform. Background paper. Chile. 2015.
7. Missoni E, Solimano G. Towards universal health coverage: the Chilean experience. Geneva: WorldHealth Organization; 2010.
8. Chen W, Tang S, Sun J Ross-Degnan D, Wagner A. Availability and use of essential medicines in China:manufacturing, supply, and prescribing in Shandong and Gansu provinces. BMC Health Serv Res2010;10:211.
9. Mao W, Chen W. The Zero Mark-up Policy for essential medicines at primary level facilities. Backgroundpaper, China. 2015.
10. Ntembwa H, Lerberghe W. Improving aid coordination in the health sector. Background paper, theDemocratic Republic of the Congo. 2015.
11. Yamagiwa TJ. The New Law on Medicines and its implementation. Background paper, El Salvador. 2015.
12. Alebachew A, Waddington C. Human Resources for Health reforms. Background paper, Ethiopia. 2015.
13. Lozano R, Garrido F. Catastrophic Health Expenditure Fund. Background paper, Mexico. 2015.
14. Bonilla-Chacin ME, Aguilera N. The Mexican social protection system in health (UNICO Studies Series 1).Washington DC: World Bank; 2013.
15. Knaul FM, Gonz ãalez-Pier E, Gfimez-Dantés O, Garc›a-Junco D, Arreola-Ornelas H, Barraza-Lloréns M, etal. The quest for universal health coverage: achieving social protection for all in Mexico. Lancet2012;380:1259–79.
16. Kwon S. Merger of statutory health insurance funds. Background paper, the Republic of Korea. 2015.
17. Jeong HS. Expanding insurance coverage to informal sector populations: experience from Republic ofKorea. Geneva: World Health Organization; 2010.
18. Gray A, Suleman F, Patel A, Bannenberg W. Implementation of reforms under the National Drug Policy.Background paper, South Africa. 2015.
19. Oreggioni C, Gimena V, Pagano JP. Building up the national integrated health system. Background paper,Uruguay. 2015.
20. Republic of Uruguay integrated national health system analysis of the governability of the SNIS benefitplan (PIAS)s. Washington DC: World Bank; 2012.

28
HEAL
TH S
YSTE
MS
GOVE
RNAN
CE &
FIN
ANCI
NG
21. Cutler DM, Zeckhauser RJ. The anatomy of health insurance. In: Cuyler AJ, Newhouse JP, editors.Handbook of health economics. Volume 1, Part A. Amsterdam: Elsevier; 2000:563–643.
22. McClellan M. Reforming payments to healthcare providers: the key to slowing healthcare cost growthwhile improving quality? J Econ Perspectives 2011;25:69–92.
23. Ofman JJ, Badamgaray E, Henning JM, Knight K, Gano AD Jr, Levan RK, et al. Does disease managementimprove clinical and economic outcomes in patients with chronic diseases? A systematic review. Am JMed 2004;117:182–92.
24. Oxley H. Improving health care system performance through better co-coordination of care. In:Achieving better value for money in health care (OECD Health Policy Studies). Paris: OECD Publishing;2009.
25. Tsiachristas A, Dikkers C, Boland MR, Rutten-van Molken MP. Exploring payment schemes used topromote integrated chronic care in Europe. Health Policy 2013;113:296–304.
26. Beaglehole R, Epping-Jordan J, Patel V, Chopra M, Ebrahim S, Kidd M, et al. Improving the prevention andmanagement of chronic disease in low-income and middle-income countries: a priority for primary healthcare. Lancet 2008;372:940–9.
27. Jakab M, Lundeen E, Akkazieva B. Health system effectiveness in hypertension control in Kyrgyzstan(Policy Research Paper 44). Bishkek: Health Policy Analysis Center; 2007.
28. Tandon A, Cashin C. Assessing public expenditures on health from a fiscal space perspective. WashingtonDC: World Bank; 2010.

29
REFO
RMS
FOR
IMPR
OVIN
G TH
EEF
FICI
ENCY
OF
HEAL
TH S
YSTE
MS:
LES
SON
S FR
OM 1
0 CO
UNTR
Y CA
SES
Health centres HospitalsNew clinical case (≥ 5 years) New clinical case (≥ 5 years)
(medical doctor)New clinical case (< 5 years) New clinical case (< 5 years)
(medical doctor)Inpatient day (≥ 5 years) Inpatient day (≥ 5 years)Inpatient day (< 5 years) Inpatient day (< 5 years)Minor surgery Minor surgeryReferral to hospital Major surgeryNew patient on anti-retroviral therapy (ART) Referral or counter-referral
to a health centrePatient maintained on ART for 6 months New patient on ARTSexually transmitted infection treated Patient maintained on ART
for 6 monthsNew tuberculosis case detected and initiated Sexually transmitted infection treatedPatient with tuberculosis cured New tuberculosis case detected (treated > 6 months) and initiated
New clinical case (pregnant woman) New clinical case (pregnant woman) (medical doctor)
Normal delivery Normal deliveryFamily planning visit (new and follow-up) Caesarean deliveryIntra-uterine device inserted Complicated deliveryPrenatal care Family planning visit (new and follow-up)Postnatal care Intra-uterine device inserted
Tubal ligationPrenatal carePostnatal care
Child fully vaccinated Male circumcisionPregnant woman fully vaccinated HIV-positive pregnant woman under ARTHIV-positive pregnant woman under ART New born care for infant born to an HIV+
motherCare for infant born to an HIV-positive mother Voluntary HIV testing and counsellingVoluntary HIV testing and counselling
Reproductivehealth
Preventiveservices
Clinicalservices
Annex 1. Services subsidized under the performance-based financing system in Burundi
ANNEXES
Service free of charge (other policies)Service free of charge (2006 policy)User charges permitted

30
HEAL
TH S
YSTE
MS
GOVE
RNAN
CE &
FIN
ANCI
NG
Annex 2. Diseases covered by Chile’s Universal Access with Explicit Guarantees (AUGE) reform
Incorporation Disease or illness Requirementsperiod
1 July 2005 End-stage renal diseaseOperable congenital heart disease < 15 yearsCervical cancerRelief of pain from advanced cancer and palliative careAcute myocardial infarctionDiabetes mellitus type IDiabetes mellitus type IIBreast cancer ≥ 15 yearsSpinal dysraphiaSurgical treatment of scoliosis < 25 yearsSurgical treatment of cataractTotal hip endoprostheses ≥ 65 years, severe,
limiting hip arthrosis Cleft lip and palateCancer < 15 yearsSchizophreniaTesticular cancer ≥ 15 yearsLymphoma ≥ 15 yearsHIV/AIDSAcute lower respiratory infection with outpatient management < 5 yearsCommunity acquired pneumonia of outpatient management ≥ 65 yearsPrimary or essential hypertension ≥ 65 yearsNon-refractory epilepsy 1–15 years Comprehensive oral health 6 yearsPrematurityDisorders in cardiac impulses and their conduction ≥ 15 years, need a pacemaker
1 July 2006 Preventive cholecystectomy of gall-bladder cancer 35–49 yearsGastric cancerProstate cancer ≥ 15 yearsRefraction errors ≥ 65 yearsStrabismus < 9 yearsDiabetic retinopathyNontraumatic rhegmatogenous detachmentof retinaHaemophiliaDepression ≥ 15 yearsSurgical treatment of benign prostatic hyperplasia in symptomatic patientsOrthotics (or technical help) ≥ 65 yearsIschaemic stroke ≥ 15 yearsChronic obstructive pulmonary disease with outpatient treatmentSevere bronchial asthma < 15 yearsRespiratory distress syndrome in the newborn

31
REFO
RMS
FOR
IMPR
OVIN
G TH
EEF
FICI
ENCY
OF
HEAL
TH S
YSTE
MS:
LES
SON
S FR
OM 1
0 CO
UNTR
Y CA
SES
1 July 2007 Medical treatment of osteoarthritis of the hip and/or knee, mild or moderate ≥ 55 yearsSubarachnoid secondary haemorrhage to ruptured cerebral aneurysmSurgical treatment of primary tumours of the central nervous system ≥ 15 yearsSurgical treatment of lumbar herniated pulposus nucleus Leukaemia ≥ 15 yearsOutpatient dental urgencyComprehensive oral health 60 years Severe polytraumatismUrgent care of moderate or severe head injurySevere ocular traumaCystic fibrosisRheumatoid arthritisHarmful consumption and dependence on alcohol and drug < 20 yearsCongenital analgesiaSevere burnsBilateral hearing loss 65 years, need hearing aid
1 July 2010 Retinopathy of prematurity Pulmonary dysplasia of prematurityBilateral sensorineural hearing loss of prematurityNon-refractory epilepsy ≥ 15 yearsBronchial asthma ≥ 15 yearsParkinson diseaseJuvenile idiopathic arthritisSecondary prevention of end-stage renal diseaseLaxative hip dysplasiaComprehensive oral health in pregnancyRelapsing–remitting multiple sclerosisHepatitis BHepatitis C
1 July 2013 Colorectal cancer > 15 yearsEpithelial ovarian cancerBladder cancer ≥ 15 yearsOsteosarcoma ≥ 15 yearsSurgical treatment of lesions of the aortic valve ≥ 15 yearsBipolar disorder ≥ 15 yearsHypothyroidism ≥ 15 yearsTreatment of moderate hearing loss < 2 yearsLupus erythematosusSurgical treatment of lesions of the mitral and tricuspid valves ≥ 15 yearsEradication therapy for Helicobacter pylori
Source: National Health Fund.


WE ARE ALSO PROUD TO HOST THE SECRETARIATS FOR:
In an increasingly interconnected world, we know that we achieve more when we work with others.
Recent collaborations include: Abt Associates Inc.; Australian Agency For International Development (AusAID); Bill &Melinda Gates Foundation; European Commission – Europeaid Cooperation Office (AIDCO); France, Ministry Of Foreign AndEuropean Affairs; Global Alliance for Vaccines and Immunisation (GAVI); Germany, Deutsche Gesellschaft Für InternationaleZusammenarbeit (GIZ) Gmbh; Global Fund To Fight Aids, Tuberculosis And Malaria (GFATM); Luxembourg DevelopmentCooperation; Netherlands, Ministry of Health, Welfare and Sport; Norwegian Agency For Development Cooperation(NORAD); Republic of Korea, Ministry of Health and Welfare; Republic of Korea, National Health Insurance Service (NHIS);Rockefeller Foundation; Susan G. Komen Breast Cancer Foundation Inc.; Spanish Agency for International Cooperation andDevelopment (AECID); Swedish International Development Cooperation Agency (SIDA); United Kingdom-Department ForInternational Development (DFID); United Nations Development Programme (UNDP); United States Agency For InternationalDevelopment (USAID).
And we are proud to be part of the Providing for Health Initiative (P4H) and to co-host the secretariat for InternationalHealth Partnerships (IHP+).
Work with us so we can support countries to reach our shared objective: country health governance and financing systems that ensure universal and sustainable coverage.
Health System Governance, Policy and AidEffectiveness (HGS)
Health Financing Policy (HFP)
Cost Effectiveness,Expenditure and PrioritySetting (CEP)
For additional information, please contact:
Department of Health Systems Governance and FinancingHealth Systems and InnovationWorld Health Organization
Email [email protected] www.who.int/topics/health_systems/en/