Improving Confidence in Compound Identification … Paper Authors Emma E. Rennie, Robert H....
10
White Paper Authors Emma E. Rennie, Robert H. Williams, Ruben Garnica, and Maria VanDamme Introduction The level of confidence in target and unknown compound identification is determined by the authenticity and integrity of the data contained within the databases and spectral libraries used for compound identification. Much of the database and library information that is publicly available on the internet, and from many vendors, is often crowd-sourced with little or no review. Poor quality libraries can negatively impact the quality of a laboratory’s results. A museum curator or art collector undertakes extensive research to evaluate the authenticity and integrity of each and every exhibit in their collection of art or artifacts. In a similar manner, Agilent uses an extremely detailed curation process to ensure the quality of each data entry and accurate mass spectrum in its compound databases and libraries. This White Paper explains how Agilent accurate mass libraries and databases are developed, the nature of the curation process, and why this curation process will improve the quality of the results produced by a laboratory. Improving Confidence in Compound Identification Using Agilent Curated Databases and Libraries
Transcript of Improving Confidence in Compound Identification … Paper Authors Emma E. Rennie, Robert H....

White Paper
AuthorsEmma E. Rennie, Robert H. Williams, Ruben Garnica, and Maria VanDamme
IntroductionThe level of confidence in target and unknown compound identification is determined by the authenticity and integrity of the data contained within the databases and spectral libraries used for compound identification. Much of the database and library information that is publicly available on the internet, and from many vendors, is often crowd-sourced with little or no review. Poor quality libraries can negatively impact the quality of a laboratory’s results.
A museum curator or art collector undertakes extensive research to evaluate the authenticity and integrity of each and every exhibit in their collection of art or artifacts. In a similar manner, Agilent uses an extremely detailed curation process to ensure the quality of each data entry and accurate mass spectrum in its compound databases and libraries.
This White Paper explains how Agilent accurate mass libraries and databases are developed, the nature of the curation process, and why this curation process will improve the quality of the results produced by a laboratory.
Improving Confidence in Compound Identification Using Agilent Curated Databases and Libraries
2
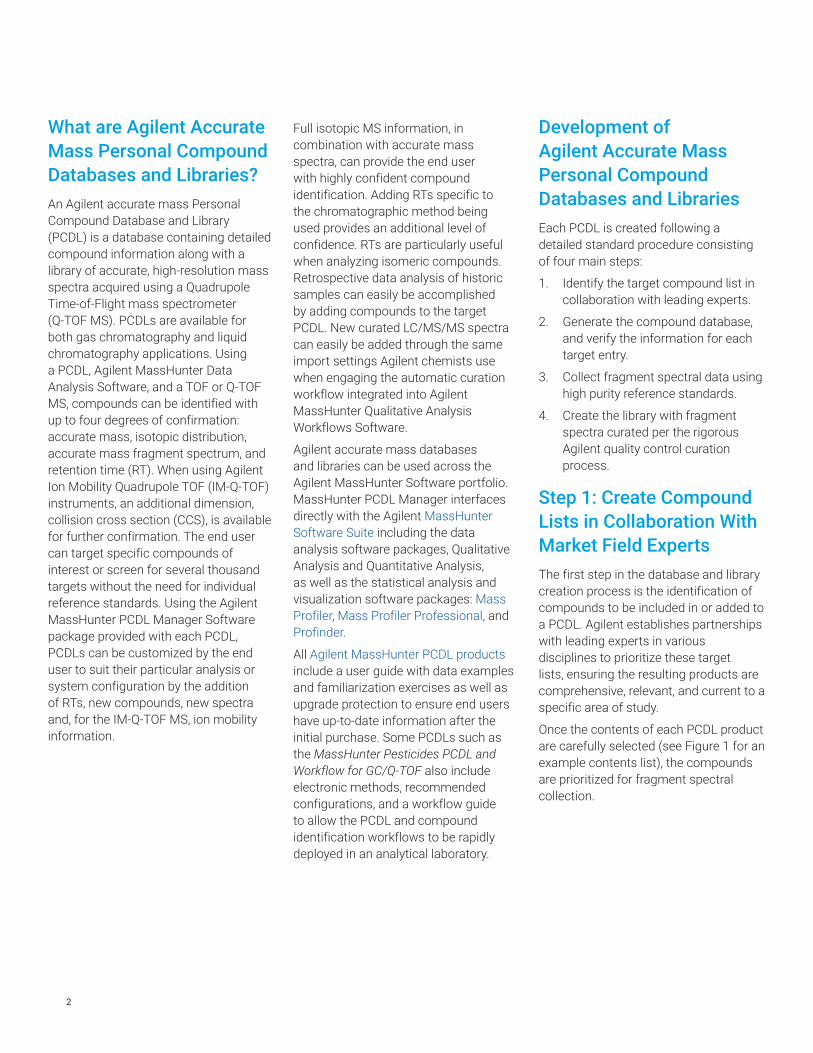
What are Agilent Accurate Mass Personal Compound Databases and Libraries?An Agilent accurate mass Personal Compound Database and Library (PCDL) is a database containing detailed compound information along with a library of accurate, high-resolution mass spectra acquired using a Quadrupole Time-of-Flight mass spectrometer (Q-TOF MS). PCDLs are available for both gas chromatography and liquid chromatography applications. Using a PCDL, Agilent MassHunter Data Analysis Software, and a TOF or Q-TOF MS, compounds can be identified with up to four degrees of confirmation: accurate mass, isotopic distribution, accurate mass fragment spectrum, and retention time (RT). When using Agilent Ion Mobility Quadrupole TOF (IM-Q-TOF) instruments, an additional dimension, collision cross section (CCS), is available for further confirmation. The end user can target specific compounds of interest or screen for several thousand targets without the need for individual reference standards. Using the Agilent MassHunter PCDL Manager Software package provided with each PCDL, PCDLs can be customized by the end user to suit their particular analysis or system configuration by the addition of RTs, new compounds, new spectra and, for the IM-Q-TOF MS, ion mobility information.
Full isotopic MS information, in combination with accurate mass spectra, can provide the end user with highly confident compound identification. Adding RTs specific to the chromatographic method being used provides an additional level of confidence. RTs are particularly useful when analyzing isomeric compounds. Retrospective data analysis of historic samples can easily be accomplished by adding compounds to the target PCDL. New curated LC/MS/MS spectra can easily be added through the same import settings Agilent chemists use when engaging the automatic curation workflow integrated into Agilent MassHunter Qualitative Analysis Workflows Software.
Agilent accurate mass databases and libraries can be used across the Agilent MassHunter Software portfolio. MassHunter PCDL Manager interfaces directly with the Agilent MassHunter Software Suite including the data analysis software packages, Qualitative Analysis and Quantitative Analysis, as well as the statistical analysis and visualization software packages: Mass Profiler, Mass Profiler Professional, and Profinder.
All Agilent MassHunter PCDL products include a user guide with data examples and familiarization exercises as well as upgrade protection to ensure end users have up-to-date information after the initial purchase. Some PCDLs such as the MassHunter Pesticides PCDL and Workflow for GC/Q-TOF also include electronic methods, recommended configurations, and a workflow guide to allow the PCDL and compound identification workflows to be rapidly deployed in an analytical laboratory.
Development of Agilent Accurate Mass Personal Compound Databases and LibrariesEach PCDL is created following a detailed standard procedure consisting of four main steps:
1. Identify the target compound list in collaboration with leading experts.
2. Generate the compound database, and verify the information for each target entry.
3. Collect fragment spectral data using high purity reference standards.
4. Create the library with fragment spectra curated per the rigorous Agilent quality control curation process.
Step 1: Create Compound Lists in Collaboration With Market Field ExpertsThe first step in the database and library creation process is the identification of compounds to be included in or added to a PCDL. Agilent establishes partnerships with leading experts in various disciplines to prioritize these target lists, ensuring the resulting products are comprehensive, relevant, and current to a specific area of study.
Once the contents of each PCDL product are carefully selected (see Figure 1 for an example contents list), the compounds are prioritized for fragment spectral collection.

3
Step 2: Create the Database Entries for Each CompoundA database entry is created for each target compound included in a PCDL. Each entry includes a variety of information about the compound, and each piece of information is manually verified. Molecular formulas, names, structures, CAS registry numbers, and compound class tags are cross-checked across multiple reputable sources (for example, SciFinder, ChemSpider, PubChem, ChemIDplus, or Chemistry Dashboard) by an experienced Agilent chemist. In addition, each individual chemical identifier is manually verified at its source site. This activity ensures a high degree of accuracy for the compound information included in each entry.
The specific types of chemical identifiers present in the database depends on the application area of the PCDL, and include such entries as:
• Common name
• IUPAC name
• Synonyms
• Molecular formula
• CAS registry number
• ChemSpider ID
• PubChem ID
• InChI
• SMILES
• Vendor product codes
Metabolite-based identifiers such as KEGG, METLIN ID, HMDB ID, LMP ID, ChEBI ID, and BioCyc ID are included for metabolites.
Figure 1. Each PCDL includes a content listing of all the included compounds with their Chemical Abstracts Service (CAS) registry number.
Figure 2. Agilent MassHunter PCDL Manager showing typical compound database entries.
Compounds view, containing accurate and up-to-date compound information:Common name, IUPAC name, accurate mass of neutral molecule, molecular formula, ChemSpider, CAS, PubChem, KEGG, METLIN ID, HMDB ID, LMP ID, InChI, SMILES, vendor product codes, and so forth
Common name:Verified from multiple different sources for commonality
Structure and Notes Area:• Structure• Compound class tags• Regulation tags and references• Chinese, Japanese and English
synonyms• Toxicology research references• Outdated and alternative CAS
identifiers• Compound descriptions
Each database entry also includes a chemical structure and notes for each compound. The notes are compound-specific, and can include:
• Compound, regulation, and country-specific class tags
• Chinese, Japanese, and English synonyms
• Toxicology research references
• Deleted (or outdated) and alternative CAS registry numbers
• Compound descriptions
All the above information for each compound entry in the database can be searched in PCDL Manager, using simple or advanced search functionalities (see Figure 2).

4
These entries can be used to filter the database to create smaller editable subsets of PCDLs from each PCDL product. For example, an end user could establish their own custom PCDL to create a screening workflow for a particular compound class or suspect list.
Finally, each compound entry is checked against the Agilent Master PCDL to eliminate the possibility of duplicate compound entries, which could drastically increase the time needed for results review in data analysis.
Compound identification information, such as common name, CAS, structure, and notes, is available through MassHunter Data Analysis software, as well as MassHunter PCDL Manager (see Figure 3).
Figure 3. Agilent MassHunter Qualitative Analysis Workflows, showing compound identifications for an LC/MS/MS analysis including structures, CAS, and notes.
5
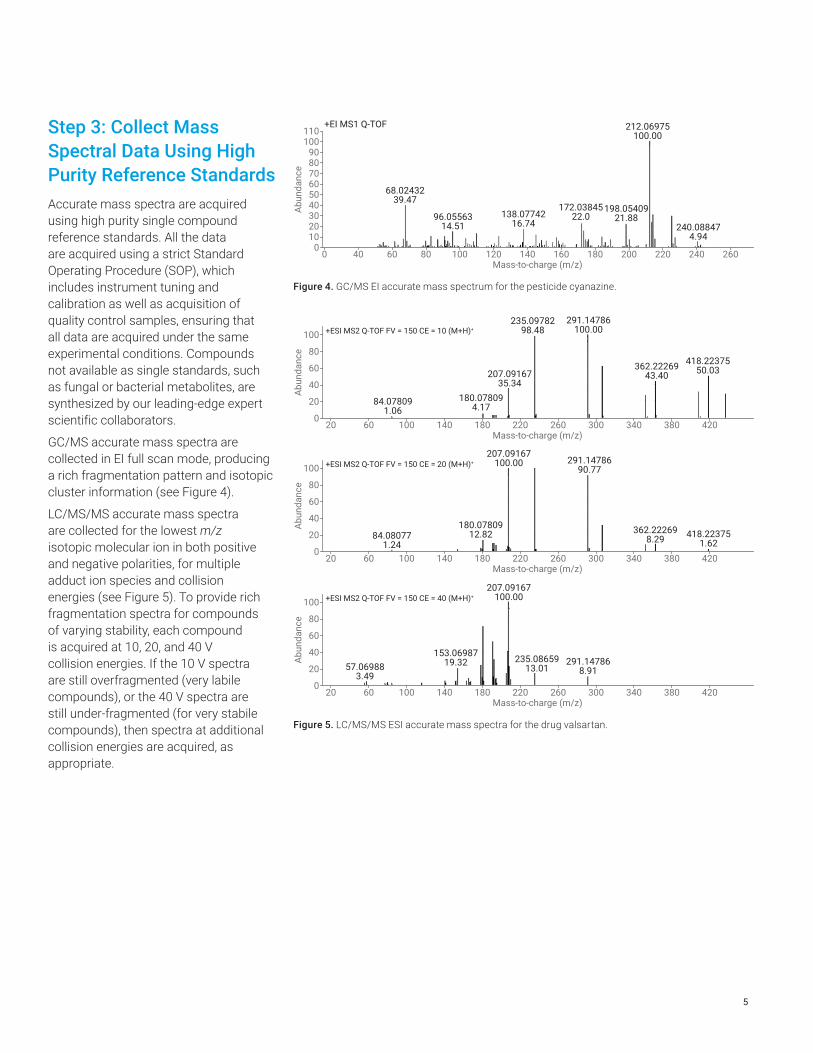
Figure 4. GC/MS EI accurate mass spectrum for the pesticide cyanazine.
0 40 60 80 100 120 140 160
240.088474.94
212.06975100.00
198.0540921.88
172.0384522.0138.07742
16.7496.05563
14.51
68.0243239.47
180 200 220 240 2600
102030405060708090
100110
Abun
danc
e
Mass-to-charge (m/z)
+EI MS1 Q-TOF
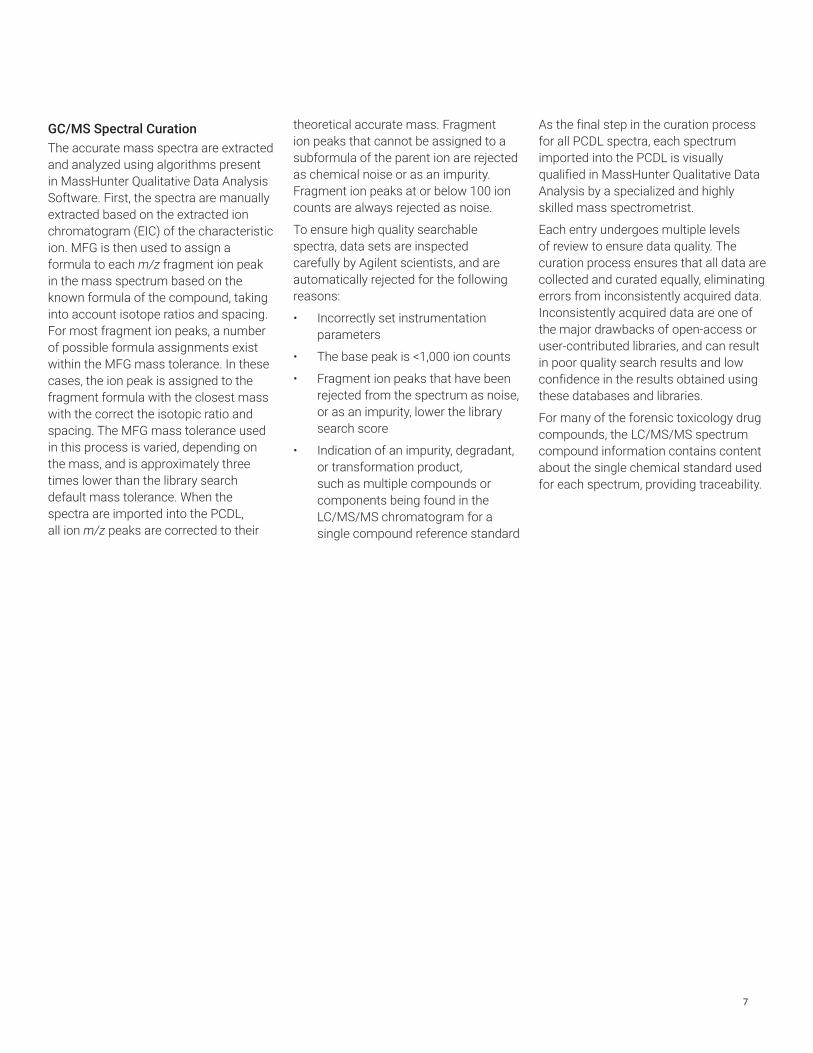
Figure 5. LC/MS/MS ESI accurate mass spectra for the drug valsartan.
20 60 100 140 180 220 260 300 340 380 420
291.147868.91
207.09167100.00
235.0865913.01
153.0698719.3257.06988
3.490
20
100
80
60
40
Abun
danc
e
Mass-to-charge (m/z)
+ESI MS2 Q-TOF FV = 150 CE = 40 (M+H)+
20 60 100 140 180 220 260 300 340 380 420
291.1478690.77
207.09167100.00
362.222698.29 418.22375
1.62
180.0780912.8284.08077
1.240
20
100
80
60
40
Abun
danc
e
Mass-to-charge (m/z)
+ESI MS2 Q-TOF FV = 150 CE = 20 (M+H)+
20 60 100 140 180 220 260 300 340 380 420
291.14786100.00
235.0978298.48
362.2226943.40
418.2237550.03
180.078094.17
207.0916735.34
84.078091.06
0
20
100
80
60
40
Abun
danc
e
Mass-to-charge (m/z)
+ESI MS2 Q-TOF FV = 150 CE = 10 (M+H)+
Step 3: Collect Mass Spectral Data Using High Purity Reference StandardsAccurate mass spectra are acquired using high purity single compound reference standards. All the data are acquired using a strict Standard Operating Procedure (SOP), which includes instrument tuning and calibration as well as acquisition of quality control samples, ensuring that all data are acquired under the same experimental conditions. Compounds not available as single standards, such as fungal or bacterial metabolites, are synthesized by our leading-edge expert scientific collaborators.
GC/MS accurate mass spectra are collected in EI full scan mode, producing a rich fragmentation pattern and isotopic cluster information (see Figure 4).
LC/MS/MS accurate mass spectra are collected for the lowest m/z isotopic molecular ion in both positive and negative polarities, for multiple adduct ion species and collision energies (see Figure 5). To provide rich fragmentation spectra for compounds of varying stability, each compound is acquired at 10, 20, and 40 V collision energies. If the 10 V spectra are still overfragmented (very labile compounds), or the 40 V spectra are still under-fragmented (for very stabile compounds), then spectra at additional collision energies are acquired, as appropriate.

6
Step 4: Create the Library Spectra Entries for the Prioritized Compound ListMass spectral information is acquired by Agilent applications chemists or one of the Agilent expert collaborators using the appropriate SOP. The choice of SOP depends on the chromatographic method being used.
LC/MS/MS Spectral CurationThe accurate LC/MS/MS mass spectra are extracted and analyzed using algorithms present in MassHunter Qualitative Data Analysis Software. First, the spectra are extracted using the Find by Formula algorithm. Molecular Formula Generation (MFG) assigns a formula to each m/z fragment ion peak in the mass spectrum, then each peak is validated to determine if it is a valid subformula of the parent ion formula. For most fragment ion peaks, a number of possible formula assignments exist within the MFG mass tolerance. In these cases, the ion peak is assigned to the fragment formula with the closest mass. The MFG mass tolerance used in this process is varied, depending on the mass, and is approximately three times lower than the library search default mass tolerance. When the spectra are imported into the PCDL, all ion m/z peaks are corrected to their theoretical accurate mass (see Figures 6A and 6B). Fragment ion peaks that cannot be assigned to a subformula of the parent ion are rejected as chemical noise or as an impurity. Fragment ion peaks at or below 1 % of the base peak are always rejected as noise.
60 80 100 120 140 160 180 200 220 240 260 280 300
121.076031.14
77.0385[C6H5]
+
94.0651[C6H8N]+
121.0762[C7H9N2]
+
121.0759[C7H9N2]
+
121.0758[C7H9N2]
+
195.0918[C13H11N2]
+
195.0914[C13H11N2]
+
209.0947[C13H11N3]
+
209.0947[C13H11N3]
+
222.1024[C14H12N3]
+
222.1030[C14H12N3]
+
222.1023[C14H12N3]
+
242.0603[C14H11ClN2]
+
146.0710[C8H8N3]
+
149.0704[C8H8N2O]+
250.0981[C15H12N3O]+
250.0974[C15H12N3O]+
286.0751[C15H13ClN3O]+
286.0751[C15H13ClN3O]+
167.0727[C12H9N]+
250.097493.14
286.07416100.00
257.
0704
0
25
50
75
100
Abun
danc
eCo
unts
Coun
tsCo
unts
Mass-to-charge (m/z)
Mass-to-charge (m/z)
+ESI MS2 Q-TOF FV = 380 CE = 10 (M+H)+
60 80 100 120 140 160 180 200 220 240 260 280 300
121.0760324.78
222.1025731.78
286.07416100.00
0
25
50
75
100
Abun
danc
e
Mass-to-charge (m/z)
+ESI MS2 Q-TOF FV = 380 CE = 20 (M+H)+
60 80 100 120 140 160 180 200 220 240 260 280 300
195.0916725.70
0
25
50
75
100
Abun
danc
e
Mass-to-charge (m/z)
1+
121.0762[C7H9N2]
+
121.0759[C7H9N2]
+
121.0758[C7H9N2]
+
1[
A
B
×105
×105
×105
0
2
4
6 7-Aminoclonazepam; C15H12ClN3O; 0.578: (M+H)+: +ESI Product ion
00.51.01.52.02.5
0
0.5
1
40 60 80 100 120 140 160 180 200 220 240 260 280 300
121.07603100.00
+ESI MS2 Q-TOF FV = 380 CE = 40 (M+H)+
Figure 6. A) LC/MS/MS ESI experimental accurate mass spectra for 7-aminoclonazepam and B) LC/MS/MS ESI spectra for 7-aminoclonazepam corrected to theoretical accurate mass. The blue highlighted areas show examples of the mass correction.
7
GC/MS Spectral CurationThe accurate mass spectra are extracted and analyzed using algorithms present in MassHunter Qualitative Data Analysis Software. First, the spectra are manually extracted based on the extracted ion chromatogram (EIC) of the characteristic ion. MFG is then used to assign a formula to each m/z fragment ion peak in the mass spectrum based on the known formula of the compound, taking into account isotope ratios and spacing. For most fragment ion peaks, a number of possible formula assignments exist within the MFG mass tolerance. In these cases, the ion peak is assigned to the fragment formula with the closest mass with the correct the isotopic ratio and spacing. The MFG mass tolerance used in this process is varied, depending on the mass, and is approximately three times lower than the library search default mass tolerance. When the spectra are imported into the PCDL, all ion m/z peaks are corrected to their
theoretical accurate mass. Fragment ion peaks that cannot be assigned to a subformula of the parent ion are rejected as chemical noise or as an impurity. Fragment ion peaks at or below 100 ion counts are always rejected as noise.
To ensure high quality searchable spectra, data sets are inspected carefully by Agilent scientists, and are automatically rejected for the following reasons:
• Incorrectly set instrumentation parameters
• The base peak is <1,000 ion counts
• Fragment ion peaks that have been rejected from the spectrum as noise, or as an impurity, lower the library search score
• Indication of an impurity, degradant, or transformation product, such as multiple compounds or components being found in the LC/MS/MS chromatogram for a single compound reference standard
As the final step in the curation process for all PCDL spectra, each spectrum imported into the PCDL is visually qualified in MassHunter Qualitative Data Analysis by a specialized and highly skilled mass spectrometrist.
Each entry undergoes multiple levels of review to ensure data quality. The curation process ensures that all data are collected and curated equally, eliminating errors from inconsistently acquired data. Inconsistently acquired data are one of the major drawbacks of open-access or user-contributed libraries, and can result in poor quality search results and low confidence in the results obtained using these databases and libraries.
For many of the forensic toxicology drug compounds, the LC/MS/MS spectrum compound information contains content about the single chemical standard used for each spectrum, providing traceability.
8
How to Use the Agilent Accurate Mass Personal Compound Databases and LibrariesAgilent PCDLs interface directly with the Agilent MassHunter Software Suite, and provide molecular formulas and reference library spectra along with compound information, ensuring unique compound identifiers for a variety of compound data mining and identification workflows.
Creating smaller targeted PCDLs specific to an analytical process such as metabolomic pathway, compound class, regulation, or country-specific list can significantly improve data analysis efficiency and accuracy by removing compounds that are not of interest from the PCDL and the compound data mining and identification pipeline.
Smaller targeted PCDLs can easily be created by:
1. Searching relevant compound class, regulation, or country-specific tags in PCDL Manager (see Figure 7 for an example)
2. Highlighting the desired compound results
3. Selecting Create Subset PCDL or Append to PCDL with a right mouse button click
Metabolomics workflows can use the MassHunter Pathways to PCDL software to create PCDLs for pathway directed data analysis (see Figure 8).
When new analytes emerge, the MassHunter PCDL Manager import functionality easily allows:
• Import of new compounds with chemical identifiers
• Addition or update of RTs for compounds or a subset of compounds
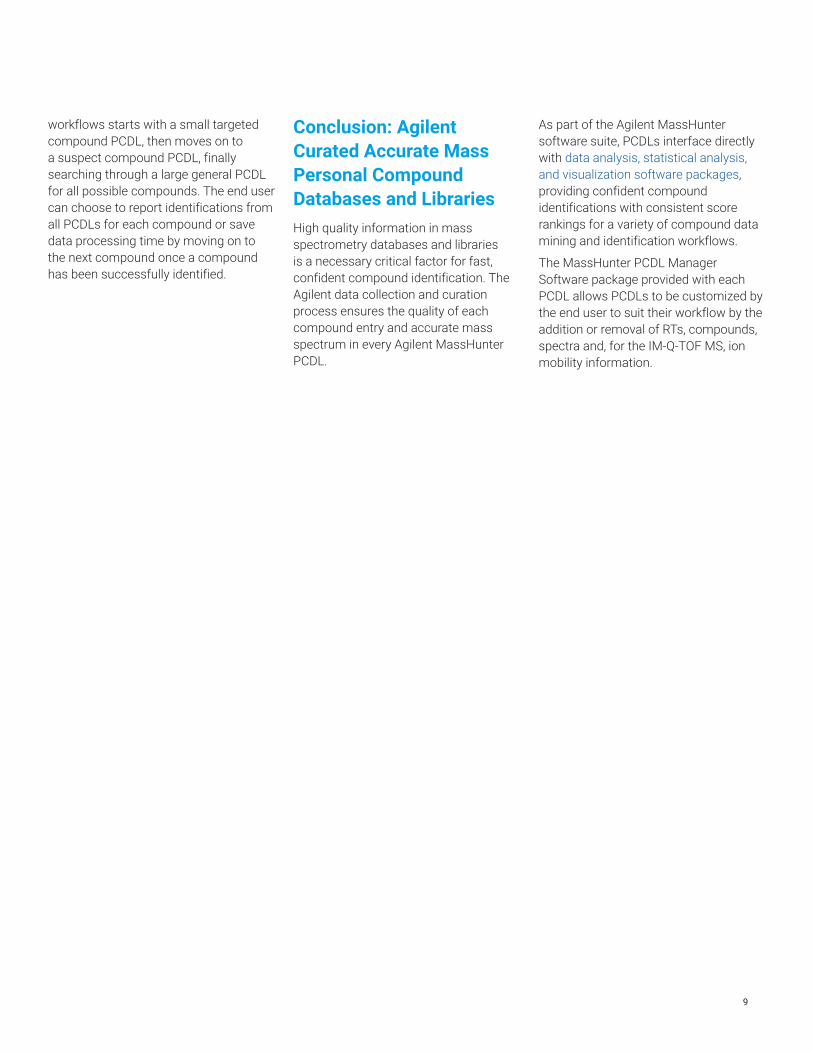
Figure 8. Agilent MassHunter Pathways to PCDL software for pathway directed analysis.
Figure 7. Agilent MassHunter PCDL Manager B.08.00 showing compound search results for US and Japanese governmental regulation tags (EPA 1694 and JDWQS) as well as the compound class tag for Pharmaceuticals and Personal Care Products (PPCP).
• Import of CCS values as well as other detailed Ion Mobility information (IM-Q-TOF LC/MS)
New spectra can be added from MassHunter Qualitative Analysis, copied from another PCDL, or added from a journal reference.
Curated LC/MS/MS spectra can easily be added using the same import settings used by Agilent R&D, with the Send Spectra to PCDL auto-curation workflow integrated into MassHunter Qualitative Analysis Workflows (see Figure 6).
End users using the same import parameters when adding new spectra ensures that the entire spectral library will produce the same accurate compound identification results with consistent score rankings for all compounds in the spectral library.
MassHunter Qualitative Data Analysis allows multiple PCDLs to be daisy-chained together and queried sequentially, reducing data analysis time while performing a comprehensive search. One of the most common sequential DB/Library searching
9
As part of the Agilent MassHunter software suite, PCDLs interface directly with data analysis, statistical analysis, and visualization software packages, providing confident compound identifications with consistent score rankings for a variety of compound data mining and identification workflows.
The MassHunter PCDL Manager Software package provided with each PCDL allows PCDLs to be customized by the end user to suit their workflow by the addition or removal of RTs, compounds, spectra and, for the IM-Q-TOF MS, ion mobility information.
Conclusion: Agilent Curated Accurate Mass Personal Compound Databases and LibrariesHigh quality information in mass spectrometry databases and libraries is a necessary critical factor for fast, confident compound identification. The Agilent data collection and curation process ensures the quality of each compound entry and accurate mass spectrum in every Agilent MassHunter PCDL.
workflows starts with a small targeted compound PCDL, then moves on to a suspect compound PCDL, finally searching through a large general PCDL for all possible compounds. The end user can choose to report identifications from all PCDLs for each compound or save data processing time by moving on to the next compound once a compound has been successfully identified.
www.agilent.com/chem
This information is subject to change without notice.
© Agilent Technologies, Inc. 2017 Printed in the USA, October 25, 2017 5991-8580EN
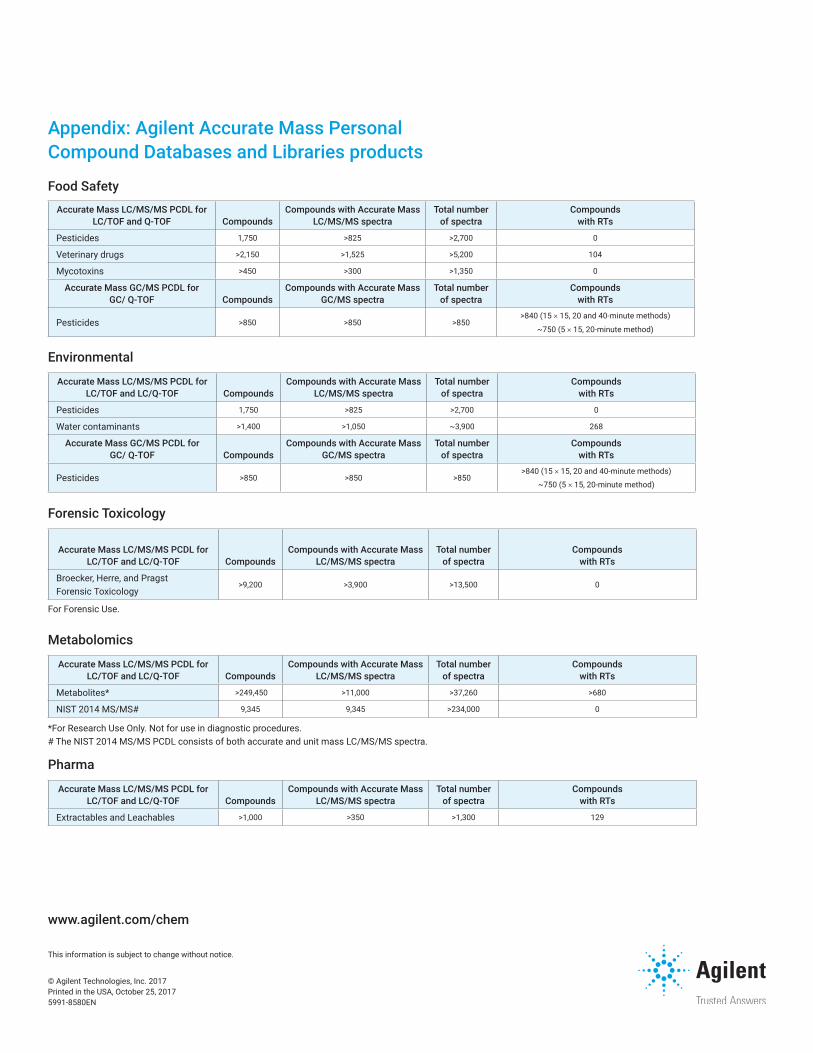
Accurate Mass LC/MS/MS PCDL for LC/TOF and Q-TOF Compounds
Compounds with Accurate Mass LC/MS/MS spectra
Total number of spectra
Compounds with RTs
Pesticides 1,750 >825 >2,700 0
Veterinary drugs >2,150 >1,525 >5,200 104
Mycotoxins >450 >300 >1,350 0
Accurate Mass GC/MS PCDL for GC/ Q-TOF Compounds
Compounds with Accurate Mass GC/MS spectra
Total number of spectra
Compounds with RTs
Pesticides >850 >850 >850>840 (15 × 15, 20 and 40-minute methods)
~750 (5 × 15, 20-minute method)
Appendix: Agilent Accurate Mass Personal Compound Databases and Libraries products
Food Safety
Environmental
Accurate Mass LC/MS/MS PCDL for LC/TOF and LC/Q-TOF Compounds
Compounds with Accurate Mass LC/MS/MS spectra
Total number of spectra
Compounds with RTs
Pesticides 1,750 >825 >2,700 0
Water contaminants >1,400 >1,050 ~3,900 268
Accurate Mass GC/MS PCDL for GC/ Q-TOF Compounds
Compounds with Accurate Mass GC/MS spectra
Total number of spectra
Compounds with RTs
Pesticides >850 >850 >850>840 (15 × 15, 20 and 40-minute methods)
~750 (5 × 15, 20-minute method)
Pharma
Accurate Mass LC/MS/MS PCDL for LC/TOF and LC/Q-TOF Compounds
Compounds with Accurate Mass LC/MS/MS spectra
Total number of spectra
Compounds with RTs
Extractables and Leachables >1,000 >350 >1,300 129
Forensic Toxicology
Accurate Mass LC/MS/MS PCDL for LC/TOF and LC/Q-TOF Compounds
Compounds with Accurate Mass LC/MS/MS spectra
Total number of spectra
Compounds with RTs
Broecker, Herre, and Pragst Forensic Toxicology
>9,200 >3,900 >13,500 0
For Forensic Use.
Metabolomics
Accurate Mass LC/MS/MS PCDL for LC/TOF and LC/Q-TOF Compounds
Compounds with Accurate Mass LC/MS/MS spectra
Total number of spectra
Compounds with RTs
Metabolites* >249,450 >11,000 >37,260 >680
NIST 2014 MS/MS# 9,345 9,345 >234,000 0
*For Research Use Only. Not for use in diagnostic procedures.# The NIST 2014 MS/MS PCDL consists of both accurate and unit mass LC/MS/MS spectra.