Improving Care for Patients Living with HIV/ fileImproving Care for Patients Living with HIV/AIDS M....
70
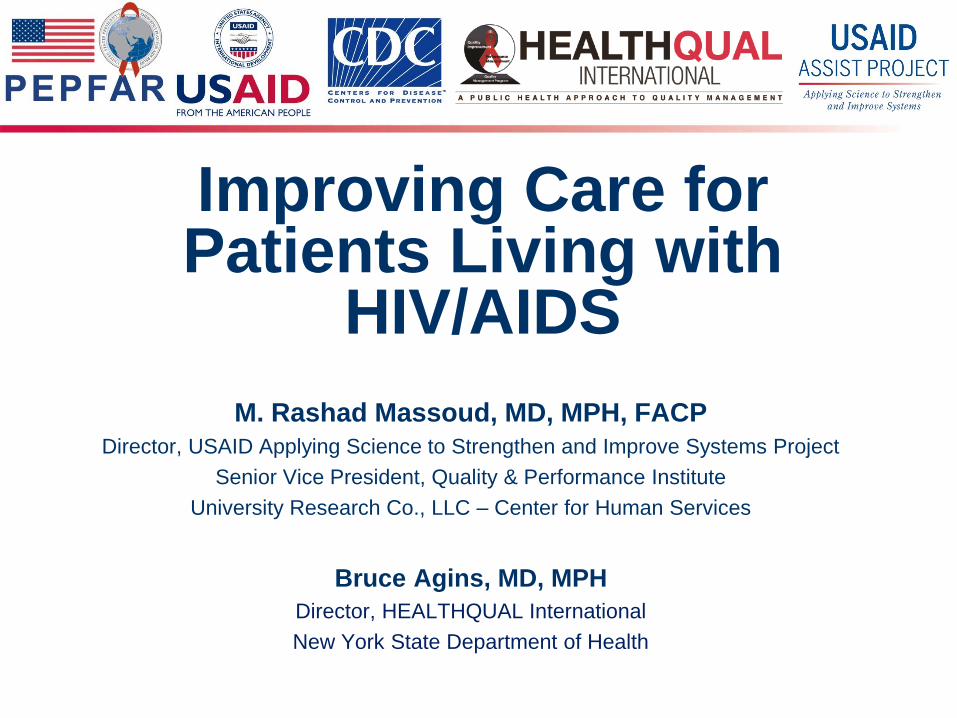
1 Improving Care for Patients Living with HIV/AIDS M. Rashad Massoud, MD, MPH, FACP Director, USAID Applying Science to Strengthen and Improve Systems Project Senior Vice President, Quality & Performance Institute University Research Co., LLC – Center for Human Services Bruce Agins, MD, MPH Director, HEALTHQUAL International New York State Department of Health
Transcript of Improving Care for Patients Living with HIV/ fileImproving Care for Patients Living with HIV/AIDS M....
1
Improving Care for Patients Living with
HIV/AIDS
M. Rashad Massoud, MD, MPH, FACP
Director, USAID Applying Science to Strengthen and Improve Systems Project
Senior Vice President, Quality & Performance Institute
University Research Co., LLC – Center for Human Services
Bruce Agins, MD, MPH
Director, HEALTHQUAL International
New York State Department of Health

USAID Applying Science to Strengthen and Improve Systems
Objectives
After this session, participants will be able to articulate:
1. The key issue in health care quality.
2. The fundamentals underlying the science of
improvement.
3. The link between evidence-based medicine and
organization of care delivery to produce better
outcomes.
4. How improvement enhances efficiency of care
delivery.
5. Examples of successful improvements in USAID OHA
programs from different countries.
2

USAID Applying Science to Strengthen and Improve Systems
Session Outline
3
Topic Presenter
What do we mean by
quality care?
Defining quality care
Vignette
Conclusion
Rashad
Bruce
What is the key issue in
quality of care?
Presentation Rashad
How do we improve
care?
Overview of the science of
improvement
Fundamental concept
underlying improvement
Principles of improvement
Bruce
Examples of improving
HIV/AIDS care
Project and national level
improvements
Rashad
Bruce

4
What do we Mean by Quality Health Care?

USAID Applying Science to Strengthen and Improve Systems
Definition of Health Care Quality
“ The degree to which health services for
individuals and populations increase the
likelihood of desired health outcomes and
are consistent with current professional
knowledge “
5
Institute of Medicine, USA

USAID Applying Science to Strengthen and Improve Systems
What is Quality Care?
Quality care is what happens at all the points of
service along the continuum of care, and high
quality care is a function of the system's ability
to produce care that will address the client's
needs in an effective, responsive and respectful
manner…
— David Nicholas
6

USAID Applying Science to Strengthen and Improve Systems
Aims for Quality Health Care System
• Safety
• Effectiveness
• Patient Centeredness
• Timeliness
• Efficiency
• Equity
7
Institute of Medicine, USA

Mediator between blocks and outcomes

QUALITY MANAGEMENT
S A F E T Y
LICENSURE CERTIFICATION
QUALITY CONTROL
PATIENTS’ RIGHTS

Quality Improvement
“the combined and unceasing efforts of everyone—healthcare professionals, patients and their families, researchers, payers, planners and educators—to make the changes that will lead to better patient outcomes (health), better system performance (care) and better professional development (learning)”
Batalden & Davidoff. What is “quality improvement” and how can it transform healthcare? Qual Saf Health Care 2007; 16: 2-3. doi: 10.1136/qshc.2006.022046

11
The key issue of quality in health care

USAID Applying Science to Strengthen and Improve Systems 12 Source: World Health Organization Source: United Nations 2013
Health MDGs Scorecard
GOALS AND
TARGETS
Africa Asia
Oceania
Latin
America
& the
Caribbean
Caucasus &
Central
Asia Northern Sub-
Saharan Eastern
South-
Eastern Southern Western

USAID Applying Science to Strengthen and Improve Systems
What is the problem: WHO
“The reality is straightforward. The power
of existing interventions is not matched by
the power of health systems to deliver them
to those in greatest need, in a comprehensive
way, and at an adequate scale.”
—Margaret Chan
Director General
World Health Organization
13

McGlynn et al. NEJM 2003. “The quality of health care delivered to adults in the U.S.”
• 439 indicators of clinical quality of care
• 30 acute and chronic conditions, plus
prevention
• Medical records for 6712 patients
• Participants received 54.9% of scientifically
indicated care (Acute: 53.5%; Chronic: 56.1%;
Preventive: 54.9%)
• Conclusion: The “defect rate” in the technical
quality of American health care is approximately
45%
14

USAID Applying Science to Strengthen and Improve Systems 15
“… Between the health
care we have and the
care we can have lies
not only a gap, but a
chasm…”
“… The problems
come from poor
systems – not bad
people…”
The Issue of Quality in Health Care

USAID Applying Science to Strengthen and Improve Systems
What is the problem: World Bank
“The enormous investments that have been made in
global health should have led to what we might have
called a science of implementation and execution…
…We have just not focused on the enormous
complexity of delivering health care in a way that
keeps people healthy ”
—Jim Kim
President, World Bank
16

17
How do we improve health care?

USAID Applying Science to Strengthen and Improve Systems
Improvement Principles & Frameworks
Fundamental Concept of Improvement:
“Every system is perfectly designed to achieve exactly
the results it achieves”
Principles of Improvement:
– Understanding work in terms of processes and
systems
– Developing solutions by teams of health care
providers and patients
– Focusing on patient needs
– Testing and measuring effects of changes
– Shared learning
18

What is a System? (IOM)
System: a set of interdependent elements working to
achieve a common aim. The elements may be both
human and nonhuman (eg, equipment, technologies).

Appreciation of a System
20 API- 2014

Systems Thinking
Source: Donabedian, A. Explorations in Quality Assessment and Monitoring Vol. 1.
The Definition of Quality and Approaches to Its Assessment . Ann Arbor, MI: Health
Administration Press, 1980. Adapted by USDHHS, HRSA.


Fundamental Concept of Improvement
“Every system is perfectly designed to achieve
exactly the results it achieves.”
23

Shewhart Charts
The Shewhart chart is a statistical tool used to distinguish between variation in a measure due to common causes and variation due to special causes
Note: A stable process does not say anything about the
quality of the process
HC Data Guide, p. 113 24

0
10
20
30
40
50
60
70
80
90
100
Jan-09 May Sep Dec Jan-10 May Sep Dec Jan-11 May Sep Dec
Pe
rfo
rman
ce R
ate
(%
) System Retention Rate

0
10
20
30
40
50
60
70
80
90
100
Jan-09 May Sep Dec Jan-10 May Sep Dec Jan-11 May Sep Dec
Pe
rfo
rman
ce R
ate
(%
)
System Retention Rate

0
10
20
30
40
50
60
70
80
90
100
Jan-09 May Sep Dec Jan-10 May Sep Dec Jan-11 May Sep Dec
Pe
rfo
rman
ce R
ate
(%
)
System Retention Rate

0
10
20
30
40
50
60
70
80
90
100
Jan-09 May Sep Dec Jan-10 May Sep Dec Jan-11 May Sep Dec
Pe
rfo
rman
ce R
ate
(%
)
System Retention Rate

29
0
20
40
60
80
100
Jan-09 May Sep Dec Jan-10 May Sep Dec Jan-11 May Sep Dec Jan-12 May Sep Dec Jan-13
Pe
rfo
rman
ce R
ate
(%
)
System Retention Rate

0
10
20
30
40
50
60
70
80
90
100
Perf
orm
an
ce R
ate
(%
)
New System Retention Rate

Understanding Variation
31
HC Data Improvement Guide

#
of
Ne
ed
les
tic
ks
Employee Needlesticksc c ha r t
UCL = 12.60
Mean = 5.54
New Needles Test
1-05 3-05 5-05 7-05 9-05 11-05 1-06 3-06 5-06 7-06 9-06 11-06 1-07 2-07
0
5
10
15
20
32

QI Principles
Fundamental Concept of Improvement:
“Every system is perfectly designed to achieve
exactly the results it achieves”
Principles of Improvement:
– Developing solutions by teams of providers and
patients
33

Why Teamwork?

What does the process really look like?

QI Projects: CD4 Monitoring
Challenges and Barriers
• Provider education • Ensure test done at first visit or in advance • Accompanying patient to the lab • Record test in clinic and health passport • Develop satellite testing sites • Transportation services by NGOs • Look at process flow of transport of
specimens and tracking of results • Involve pharmacist in monitoring for date of
test
Improvement Strategies
• Transport of specimens
• Return for monitoring
• Laboratory equipment access
36
CASE STUDY: Coordination of Team Activities at TASO Mbale Medical Officer: coordinate clinics & give health talks Triage Nurse: identifies clients for CD4 screening, Lab Technician: takes samples and release timely results, Data Officer: generates reports & ensures efficient filing system Front Desk Officer: streamline flow of clients Counselor: identifies clients, coordinates group sessions, educates clients about the importance of CD4 screening, Field Officer: links clients & streamlines field appointments for CD4 re-screening

What is robust process improvement?
1. Identifying root causes of a problem
2. Measuring the importance of each cause
3. Proving the effectiveness of the solutions
4. Deploying programs to ensure sustainability of the
improvements
Chassin and Loeb. Health Affairs, 30, no.4 (2011):559-568
The Ongoing Quality Improvement Journey: Next Stop, High Reliability

QI: Retention (Erie County Medical Center)
Identifying Root Causes & Establishing the Importance of Each Cause
REASON #
Patients
Mean
VL
Medically stable; Feel well 13 21
Job conflict with
appointment
6 258
Fear if disclosure if seen at
clinic
1 20
Ongoing alcohol/substance
use
14 32194
Mental health issues 8 15044
Lack of
understanding/engagement
13 27436
Transportation 1 415211
Housing instability 1 20
Also receiving care
elsewhere
1 20
Cost (coverage) 1 272
Refuses treatment 1 4942
Hospitalized 0
Incarcerated then released 2 2210
Deploying Programs to Ensure Sustainability of the Process

QI Principles
Fundamental Concept of Improvement:
“Every system is perfectly designed to achieve
exactly the results it achieves”
Principles of Improvement:
– Focusing on patient needs
39

Dimensions of Quality
Technical Quality
Provider
Perception of
Quality of HIV
Care
Experience Quality
Consumer
Perception of Quality
of HIV Care
Leonard Berry, Texas A&M University, IHI conference 2001

• Consumer advisory board
• Focus groups
• Exit interviews
• Participation on quality teams
• Reviewing data
• Setting priorities for improvement
• Patients serving on QM Committee
How to involve consumers?

QI Principles
Fundamental Concept of Improvement:
“Every system is perfectly designed to achieve
exactly the results it achieves”
Principles of Improvement:
– Testing and measuring effects of changes
42

TESTING CHANGES

What are we trying
to accomplish?
How will we know that a
change is an improvement?
What change can we make that
will result in improvement?
Act Plan
Study Do
Model for Improvement
Model
for
Improvement

QI Principles
Fundamental Concept of Improvement:
“Every system is perfectly designed to achieve
exactly the results it achieves”
Principles of Improvement:
– Peer learning
45

Regional QI Groups (learning networks; learning communities)
• Regional groups promote sharing of
improvements and strategies
• Local issues drive priorities
• Coordination of care enhanced
• Facilitates involvement of other
stakeholders:
– State….city….county….

FHI Quality Assurance Quality
Improvement guiding principles
Develop
standardsImplement
standards
Measure
performance
against
standards
Identify quality gaps
and performance
issues
Address
issues
QA
Identify the
improvement
goal/objectives
QIDevelop the
improvement
measurement
system
Develop ideas
for changes
Test system
changes

Sheila
Leatherman
ISQUA
GHAHA 2013

WHY IS THERE CONFUSION ABOUT QI?

Improvement Models
• Shewhart (SPC/PDCA)
• Deming – CQI
• Model for Improvement (PDSA)
• Six Sigma
• Lean
• 5S
• Kaizen
• Total quality management

Leatherman, Ferris, Berwick, Omaswa and Crisp. The Role of Quality Improvement in Strengthening Health Systems in Developing Countries. Int J Qual Healthcare 2010; 22: 23-43.
DEFINITION: Rather than attempt to re-define the meaning of quality in a global context, the group developed a shared understanding of the term ‘quality improvement’ as both a philosophy and a family of discrete technical and managerial methods.
Methods: Process investigation and analysis
Operations research
Teamwork
Assessment and improvement
Optimal use of measurement and statistics in daily work
Benchmarking
Participative management techniques
Methods are focused on patients and their families and enable providers and organizations to continuously learn and to change the systems in which they work to achieve improved health outcomes for those they serve.

Systems Thinking
Source: Donabedian, A. Explorations in Quality Assessment and Monitoring Vol. 1.
The Definition of Quality and Approaches to Its Assessment . Ann Arbor, MI: Health
Administration Press, 1980. Adapted by USDHHS, HRSA.

The Challenges That Lie Ahead
• The “deep reach” to the most marginalized, vulnerable and
remote populations.
• The use of real-time data to inform strategies for change at
the local level.
• The engagement of the providers and consumers to work
together to achieve improvement goals in their community.
• Undeveloped communication/knowledge management
strategies.
• Integration of HIV improvement work into national health
sector quality management programs.
– “Quality improvement requires that providers and policymakers identify
their own weaknesses and address them directly”. -Scott, Jha. NEJM 2014;
371: 5
• Sustainability of improvement once initial gains are
achieved.

Within Our Reach
• Biomedical interventions are now available to achieve both health outcomes and zero transmission.
• Improvement methods are known and have spread to provider communities.
• Implementation of guidelines is possible throughout the healthcare sector.
• We know and so we now must apply…

USAID Applying Science to Strengthen and Improve Systems
Employee Engagement (…or lack thereof)

59
Examples of Improving Health Care

USAID Applying Science to Strengthen and Improve Systems
% of clients whose nutritional status is assessed using mid-upper arm circumference (MUAC)
0
10
20
30
40
50
60
70
80
90
100
w-2
0
w-1
8
w-1
6
w-1
4
w-1
2
w-1
0
w-8
w-6
w-4
w-2 w1
w3
w5
w7
w9
w1
1
w1
3
w1
5
w1
7
w1
9
w2
1
w2
3
w2
5
w2
7
%
0
10
20
30
40
50
60
70
80
90
100
w-2
0
w-1
8
w-1
6
w-1
4
w-1
2
w-1
0
w-8
w-6
w-4
w-2 w1
w3
w5
w7
w9
w1
1
w1
3
w1
5
w1
7
w1
9
w2
1
w2
3
w2
5
w2
7
%
0
10
20
30
40
50
60
70
80
90
100
w-2
0
w-1
8
w-1
6
w-1
4
w-1
2
w-1
0
w-8
w-6
w-4
w-2 w1
w3
w5
w7
w9
w1
1
w1
3
w1
5
w1
7
w1
9
w2
1
w2
3
w2
5
w2
7
%
0
10
20
30
40
50
60
70
80
90
100
w-2
0
w-1
8
w-1
6
w-1
4
w-1
2
w-1
0
w-8
w-6
w-4
w-2 w1
w3
w5
w7
w9
w1
1
w1
3
w1
5
w1
7
w1
9
w2
1
w2
3
w2
5
w2
7
%
0
10
20
30
40
50
60
70
80
90
100
w-2
0
w-1
8
w-1
6
w-1
4
w-1
2
w-1
0
w-8
w-6
w-4
w-2 w1
w3
w5
w7
w9
w1
1
w1
3
w1
5
w1
7
w1
9
w2
1
w2
3
w2
5
w2
7
%
0
10
20
30
40
50
60
70
80
90
100
w-2
0
w-1
8
w-1
6
w-1
4
w-1
2
w-1
0
w-8
w-6
w-4
w-2 w1
w3
w5
w7
w9
w1
1
w1
3
w1
5
w1
7
w1
9
w2
1
w2
3
w2
5
w2
7
%
0
10
20
30
40
50
60
70
80
90
100
w-2
0
w-1
8
w-1
6
w-1
4
w-1
2
w-1
0
w-8
w-6
w-4
w-2 w1
w3
w5
w7
w9
w1
1
w1
3
w1
5
w1
7
w1
9
w2
1
w2
3
w2
5
w2
7
%
0
10
20
30
40
50
60
70
80
90
100
w-2
0
w-1
8
w-1
6
w-1
4
w-1
2
w-1
0
w-8
w-6
w-4
w-2 w1
w3
w5
w7
w9
w1
1
w1
3
w1
5
w1
7
w1
9
w2
1
w2
3
w2
5
w2
7
%
0
10
20
30
40
50
60
70
80
90
100
w-2
0
w-1
8
w-1
6
w-1
4
w-1
2
w-1
0
w-8
w-6
w-4
w-2 w1
w3
w5
w7
w9
w1
1
w1
3
w1
5
w1
7
w1
9
w2
1
w2
3
w2
5
w2
7
%
Train expert
clients to do
MUAC
Assign a staff person to do
MUAC after registration
A sustained change Tell everyone to do MUAC
a non-sustained change
Nutrition
training Informed of
external visit
Delivery of
commodities

USAID Applying Science to Strengthen and Improve Systems
Uganda: Applying Chronic Care Model to improve coverage, retention, and clinical outcomes
61
Examples of
Changes
Used SM
progress tool
and tally sheets
to record Pt SM
progress
Introduced a
VHT referral
form to give to
patients when
sent to a facility
Each patient
enrolled is
introduced to a
VHT in
catchment area
SM groups
formed
0
1000
2000
3000
4000
5000
6000
7000
8000
Oct
-10
No
v-1
0
De
c-1
0
Jan
-11
Feb
-11
Mar
-11
Ap
r-1
1
May
-11
Jun
-11
Jul-
11
Au
g-1
1
Sep
-11
Oct
-11
No
v-1
1
De
c-1
1
Jan
-12
Feb
-12
Mar
-12
Ap
r-1
2
May
-12
Jun
-12
Jul-
12
Au
g-1
2
Sep
-12
Oct
-12
No
v-1
2
De
c-1
2
Jan
-13
Feb
-13
Mar
-13
Ap
r-1
3
May
-13
Coverage, Retention, and Clinical Outcomes at 5 sites - Buikwe District Oct 2010 - May 2013
# of clients eligible to be enrolled on ART # of clients ever enrolled on ART
# of expected ART clients # of active ART clients
# of ART clients with good clinical outcome
Coverage Gap44%
1%
Retention Gap49%
23%
Wellness Gap53%
9%
End of intervention
16%
25%
14%

USAID Applying Science to Strengthen and Improve Systems
Uganda: Performance of Safe Male Circumcision sites on MOH quality standards (Baseline 2013 vs Jan 2014)
62
Health Unit
IP
Supportin
g Site
District
Manageme
nt systems
Supplies,
equipment
&
environme
nt
Registratio
n group
education
and IEC
Individual
counseling
& HIV
testing
Male
circumcisi
on surgical
procedure
Monitoring
&
evaluation
Infection
prevention
Manageme
nt systems
Supplies,
equipment
&
environme
nt
Registratio
n group
education
and IEC
Individual
counseling
& HIV
testing
Male
circumcisi
on surgical
procedure
Monitoring
&
evaluation
Infection
prevention
1 30 50 0 33 92 70 83 67 100 91 86 91
2 20 33 0 7 67 80 67 75 87 92
3 40 83 0 14 77 80 67 100 93 100
4 30 50 0 18 82 90 83 83 83 80 92 100
5 20 33 0 14 80 80 67 83 100 80 86 85
6 10 50 7 70 90 83 100 100 100 93 93
7 40 50 50 75 40 70 83 67 83 82 86 89
8 50 50 25 14 77 90 100 83 100 90 86 85
9 60 50 83 39 64 29 69 90 100 100 82 100 100 100
10 20 50 50 0 33 90 100 100 83 100 92 93
11 33 25 0 0 64 80 100 100 80 80 77 75
12 25 33 0 70 100 83 100 80 83 100 92
13 60 67 75 83 81 14 38 90 67 83 100 100 86 100
14 70 50 25 50 16 100 83 100 100 100 93 100
15 60 33 25 50 46 100 84 67 100 82 67 100
16 30 67 100 14 58 100 100 100 100 100 100 100
17 40 83 75 100 100 14 58 90 83 100 100 100 100 92
18 70 67 100 67 100 69 75 100 67 100 100 100 100 75
19 40 50 0 21 46 100 83 83 100 97 100 100
20 60 50 0 21 92 100 83 83 83 85 93 85
21 70 50 0 21 46 90 67 83 94 77 100 76
22 80 83 100 93 100 90 100 100 100 100 100 100
23 70 100 100 100 100 93 100 90 84 100 100 100 100 100
24 70 100 100 100 100 93 100 90 100 100 100 100 93 100
25 60 50 100 46 100 90 83 50 83 82 50 77
26 60 33 50 15 62 90 67 84 100 85 79 92
27 40 83 75 100 100 75 92 90 84 100 100 91 86 100
28 20 50 78 15 38 90 75 50 94 87 93 70
29 22 67 67 47 29 85 80 67 67 83 80 93 82
30 40 67 38 62 90 67 83 100 91 93 82
Baseline results As of January 2014

USAID Applying Science to Strengthen and Improve Systems
Tanzania: HIV-infected pregnant women started on or receiving ARVs (AIMGAPS)
63
0%
10%
20%
30%
40%
50%
60%
70%
80%
90%
100%
Jan-11 Apr-11 Jul-11 Oct-11 Jan-12 Apr-12 Jul-12 Oct-12 Jan-13 Apr-13 Jul-13 Oct-13 Jan-14
% HIV-infected pregnant women started on or receiving ART (treatment) or ARV prophylaxis in 11 sites in Iringa Region, Tanzania January, 2011 – February, 2014
0
100
200
300
400
Jan-11 Apr-11 Jul-11 Oct-11 Jan-12 Apr-12 Jul-12 Oct-12 Jan-13 Apr-13 Jul-13 Oct-13 Jan-14
Denominator: Total # HIV-infected pregnant women who are eligible for ART and ARV prophylaxis
Changes tested:
1. Storing ARV at RCH 2. Documentation at time of service provision
3. Keeping PMTCT care register at follow-up client care point. 4. Keeping constant stock levels of ARTs at RCH
May-11: LS 1—
Providers trained
on QI principles, QI
teams formed.
Aug-11: Adopted WHO 2010
guidelines. Change in guidelines
increased # of clients eligible for ARVs
Nov-11:
Increased stocks
of ARVs at RCH
to meet demand
Mar-12: Shortage of ARVs
Oct-13: All AIMGAPS
sites transitioned from
WHO treatment
Option A to Option B+

USAID Applying Science to Strengthen and Improve Systems 64
Study 27 Improvement Collaborative Improvements in 12 Countries: Scope and Content
Topic areas MNCH
FP
HIV/AIDS
Tuberculosis
Malaria
PHC
Countries (12)
Collaboratives (27) Benin (3)
Bolivia (1)
Ecuador (2)
Guatemala (2)
Honduras (1)
Nicaragua (1)
Niger (3)
Russia (6)
Rwanda (3)
Tanzania (3)
Uganda (1)
Vietnam (1)
Indicators and
Time series charts
135 time series charts
representing 81 indicators

USAID Applying Science to Strengthen and Improve Systems 65
How were the 135 time series charts analyzed?
Number of months to
reach ≥ 80%:
15 months
Absolute
improvement
from
baseline:
1496 =
82%
Relative
increase
from
baseline:
96/14=580%
Reached ≥ 80%? Yes
Interval
(range) at
stabilized
level of
quality:
75-97 = 22
Number of
consecutive
months that
indicator values
stayed over 80%:
25 months
Reached ≥90%? Yes
Number of months to
reach ≥90%:
39 months

USAID Applying Science to Strengthen and Improve Systems
Results of 135 Time Series Charts from 27
Collaborative Improvements in 12 Countries
• Performance improved regardless of baselines:
– 88% teams reached 80% compliance or above
– 76% teams reached 90% compliance or above
• Results were achieved relatively rapidly:
– For indicators starting at < 50%, teams reached 80%
compliance in 13 months
– For indicators starting at > 50%, teams reached 80%
compliance in 6 months
• Collaborative improvement can produce
sustained gains in performance
– 80% performance was sustained on average for 13.4
months out of 19.5 months of data collection
66

USAID Applying Science to Strengthen and Improve Systems
Idées pour surmonter les
Barrières
ANALYSES SYSTEMES
Implémentation

Improvement of ART enrollment through improvement of quality of service Experience of Hopital Universitaire de la Paix Derival Raymonde, MD; Bogart Mie Johanne, Nurse; Maisonneuve Yvette, Nurse; Isaac Daniel, SW; Aristile William,Data
Clerk; Auguste Marie Carmen , Nurse; Jenny X; Clerrier Nadege
BACKGROUND -Rationale of the ART Enrollment project All medically eligible HIV positive patients should be enrolled on ART. ART enrollment will reduce the morbidity and mortality rate and improve the patients’ quality of life.
From our Electronic Medical Record, data of HIVQUAL report from July to Dec 10 revealed that only 82 among 331 medically eligible patients (24.8%) had benefited from ART enrollment.
0102030405060708090
100
Co
nti
nu
ity
AR
V
Mo
nit
CD
4
AR
V E
nro
l
Px
TMS
Ad
her
ence
TB S
cren
nin
g
Nu
trit
ion
ass
ess
Fam
ily P
lan
nin
g
PM
TCT
Imm
un
isat
ion
%
HIVQUAL report jul-dec 10

A multidisciplinary team was created by the Quality Management Committee to assess the problem, led by 1 MD , with 3 nurses, 1 data cler, 1 field agent and 1 patient. AIM STATEMENT: To improve ART enrollment from 24.8% to 45% over six months.
IMPROVEMENT CHANGES & INTERVENTIONS
First Strategy-Patient Awareness: Psychologist & SW counsel patients about importance of visits; Clerk highlights new patients in register Second Strategy - Reduction in Pre-ART period: Weekly visits required for patients until ART Enrollment. Third strategy –Enrollment Acceleration: Increase number of new enrollees with new verifcation process by data clerk. Participation in post-test clubs.

Reduction of pre-ART wait and increasing patient contact had the greatest impact
LESSONS LEARNED: -Coordination between psychosocial and medical units was key to success of ART enrollment. -Need sufficient time for committee meetings to select patients for enrollment from pre-ART list. -Staffing levels require more than one psychologist to help patients accept treatment and address mental health problems.

HAITI: The Power of an EMR (iSante) but Why aren’t patients getting ART?
75.5
29.6
46.6
57.3
27.7 23.9
83.7
4.4
38.4
1.2
74.8
24.3
40.9
85.888.1
79.2
74
32.5
54.6
41.2
41
42
33
29
30
67
10
66
6
30
90
37
62
11
08
7
66
82
28
9
32
7
20
88
4
48
85
62
98
27
72
7
13
15
3
49
22
30
22
1
15
45
1
79
3
12
92
0
10
20
30
40
50
60
70
80
90
100
CC ARV CD4 ARV TMS Adh TB Nutrition PF PTME Vaccin
%
Indicators
DDB juin--08 DDS juin 11 # de cas juin 08 # de cas juin 11
LIMITATIONS SOLUTIONS
•Stringent requirements applied
for ARV Eligibility
•4 Adherence sessions
•Buddy companion
•Identification of patient house
•Refresher training for psycho-social staff
•Technical Assistance to “Selection
Committee”
• Focus on systems that get patients services
•Lack of implementation of
guidelines for treatment initiation
•Increase awareness about groups that could
be put on Rx without CD4
•Limitations with CD4 •Progressive phaseout of current equipment
Roll out of Facscount and regional hubs.
•Dedicate more man power at sites when
manual system is in use
•Logistics of Drugs for site
upgrade and launching of new
sites
•Better coordination between service
implementers and SCMS for site upgrade
and launching of new sites

*In 2011, Haiti data were retrospectively stratified into adult and pediatric (< 15 years old) data for all but nine clinics. Those nine clinics are not
included in the aggregate results for the first six review periods. Beginning in the 7th review period, Jan – Jun 11, all data from all clinics are stratified
and included in the aggregate results.
Haiti ARV Therapy Percentage of adult patients eligible for ART who were enrolled in ART during the six-month review period

NAMIBIA: A Tale of Improving Food Security
Initially lack of screening tool in the HIV patient care booklet Poor documentation Lack of proper referral mechanism No support groups address food security Staff turnover and high workload High national unemployed rate/poverty Alcohol abuse
INTERVENTIONS
⁻Training of HCWs on importance of issue & measuring --Health education to patients/clients (specifically on alcohol abuse ) ⁻Devise basic, simple food security screening tools ⁻Improve documentation system ⁻Reorganize patient flow to streamline assessment ⁻Identification of focal person to conduct assessments ⁻Referrals, documentation/follow-up of patients needing food supplementation to NGOs ⁻Arrange effective referral system ⁻Introduction of NACS (Nutritional Assessment Counseling and Support) programme Nationwide. ⁻Strengthen integration of social workers into care teams to assess food security ⁻Initiation of nutrition gardens ⁻Soup kitchen corners (nutritional education)