Improving automobile insurance ratemaking using telematics ...
23
UB Riskcenter Working Paper Series University of Barcelona Research Group on Risk in Insurance and Finance www.ub.edu/riskcenter Working paper 2017/01 \\ Number of pages 20 Improving automobile insurance ratemaking using telematics: incorporating mileage and driver behaviour data Mercedes Ayuso, Montserrat Guillen and Jens Perch Nielsen
Transcript of Improving automobile insurance ratemaking using telematics ...
UB Riskcenter Working Paper Series
University of Barcelona
Research Group on Risk in Insurance and Finance www.ub.edu/riskcenter
Working paper 2017/01 \\ Number of pages 20
Improving automobile insurance ratemaking using telematics:
incorporating mileage and driver behaviour data
Mercedes Ayuso, Montserrat Guillen and Jens Perch Nielsen
1
Improving automobile insurance ratemaking using telematics:
incorporating mileage and driver behaviour data
Mercedes Ayusoa,*
, Montserrat Guillenb, Jens Perch Nielsen
c
aRiskcenter, University of Barcelona, Av. Diagonal, 690, 08034 Barcelona (Spain)
E-mail: [email protected] bRiskcenter, University of Barcelona, Av. Diagonal, 690, 08034 Barcelona (Spain)
E-mail: [email protected]
cCass Business School, City University London, 106 Bunhill Row, London EC1Y8TZ (U.K.)
E-Mail: [email protected]
(*) Corresponding author
Abstract
We show how data collected from a GPS device can be incorporated in
motor insurance ratemaking. The calculation of premium rates based upon
driver behaviour represents an opportunity for the insurance sector. Our
approach is based on count data regression models for frequency, where
exposure is driven by the distance travelled and additional parameters that
capture characteristics of automobile usage and which may affect claiming
behaviour. We propose implementing a classical frequency model that is
updated with telemetrics information. We illustrate the method using real
data from usage-based insurance policies. Results show that not only the
distance travelled by the driver, but also driver habits, significantly
influence the expected number of accidents and, hence, the cost of
insurance coverage. This paper provides a methodology including a
transition pricing transferring knowledge and experience that the company
already had before the telematics data arrived to the new world including
telematics information.
Keywords: tariff, premium calculation, pay-as-you-drive insurance, count data models.
2
1. Introduction and motivation
Telematics is the technology of sending, receiving and storing information via
telecommunication devices in conjunction with affecting control on remote objects. Thus, vehicle
telematics allows driver information to be collected using an electronic device. Broadly speaking,
this GPS-based technology records mileage in addition to other data related to driver behaviour.
The significance of this for the field of transportation research has been highlighted in a number
of recent papers (Shafique and Hato, 2015; Xu et al., 20151; Isaacson et al., 2016) and it seems
likely to bring about fundamental changes in automobile insurance in the near future.
Pay-as-you-drive insurance (PAYD) was initially proposed by Vickrey (1968) and it has
evolved rapidly with technological advances. The potential benefits of this system have been
stated as improved actuarial accuracy and the opportunity for those policyholders that drive less
to reap the benefits (see, Tselentis et al., 2017, Baecke and Bocca, 2017).
Classical insurance ratemaking is based on frequency and severity models that predict the
expected number of claims and their expected cost on the grounds of historical information
stored in an insurance company’s database. Traditionally, the variables included in the predictive
models are collected about the driver and vehicle at the time of policy issuance, but information
about driving habits are not considered directly on the grounds that driving style and intensity
could not hitherto be measured objectively.
Guidelines governing the calculation of motor insurance premiums recognise that distance
driven is an exposure variable that should be taken into consideration in the modelling process.
However, as policyholders tend not to be very precise when reporting their average annual
mileage, attempts to introduce mileage in the models have not been successful. However, the
technology available today provides a means of collecting mileage information automatically. It
seems clear to us, therefore, that future ratemaking models will incorporate these technological
advances. Here, we propose a method for modernising the ratemaking system that involves
combining traditional motor insurance rating factors with new information obtained from
telemetric data collection. Our practical illustration, employing real data, shows that the
combination of classical actuarial insights with telematics information is superior to working
with either system in isolation.
1.1 The transition from classical insurance pricing to telematics pricing
This paper is particularly concerned about the transition process from classical insurance pricing
to insurance pricing including telematics. Let us say an insurance company wants to introduce
telematics. And let us say that this company has a long history of understanding their customers
and pricing their risk. It probably would not be a good idea to throw away the historical
knowledge and intellectual progress the company has obtained over the years. A better approach
1 See Xu et al. 2015 for an extensive review of studies examining human mobility patterns in the field of
transportation research.
3
seems to be to consider the problem as a three stage process: (i) pricing before telematics is
introduced, (ii) the transition to pricing including telematics, and (iii) a new regime, where
telematics data is fully integrated in the business processes of the company. Therefore, in this
paper we imagine telematics to be introduced to the insurance company as a correction to their
current pricing. At the surface, this results in something that looks like an inefficient estimation
method. It is technically speaking not statistically efficient to do classical pricing first based on
some variables and then afterwards correcting the pricing using new telematics covariates.
Statistical theory would tell us to estimate all variables at the same time. However, the
adjustment approach is not so much about statistical efficiency as about a transition from
classical pricing to pricing including telematics. When telematics is introduced to the company as
a correction to the current pricing, then it provides an incremental innovation to the business
processes of that company allowing the company to build on current strengths while developing
the new regime. After a transition period that is sufficient to have built up enough data and
enough confidence in the actuarial and pricing office of the insurance company, then it might be
time to transfer the statistical estimation to a full blown statistical estimation including all
parameters at the same time. However, the validations this paper provides based on real data
suggest that pricing based on a transition adjustment will be almost just as accurate as the more
complicated full blown statistical minimization. This is good news implying that the insurance
company can allow itself an extensive transition period, where experience, data and methodology
is built according to the new challenges of incorporating telematics data in the day-to-day
ratemaking.
1.2 Background
Various papers in the literature examine the ratemaking process from this classical point of view
(see Denuit et al., 2007, for an extensive review). The frequency and severity of claims have been
the main dependent variables in these models, both from an “a priori” perspective (considering as
regressors certain characteristics of the insured and his vehicle) and from an “a posteriori”
perspective within a bonus-malus system. In the case of “a priori” ratemaking, classical variables
such as the driver’s age, experience and the age of the vehicle have been used. The insured’s
gender has also been a traditional ratemaking variable; however, in Europe, this factor can no
longer be used for pricing, it having been deemed discriminatory under the ruling of the
European Court of Justice (ECJ), issued on 1 March 2011 (Aseervatham et al., 2016).
However, new methods of automobile insurance ratemaking have become available thanks to
technological advances. Information can now be collected via GPS devices installed in the
insured’s vehicle, which means insurance companies have access to more accurate information
about the distance driven each year by the insured and his driving patterns (Paefgen et al., 2013).
Analyses of driver behaviour are frequent in transportation research. Some authors, including
Ellison et al. (2015), Underwood (2013), Jun et al. (2011), Elias et al. (2010) and Ayuso et al.
(2010), have shown that factors such as night driving, urban driving, speeding and highway
4
driving are correlated with the risk of being involved in an accident and with the corresponding
severity of that accident.
In the insurance literature, papers examining PAYD policies clearly identify the opportunities
afforded by this focus on an insured’s driving patterns. In PAYD automobile insurance, the
premium is calculated on the basis of vehicle usage. Thus, premiums can be personalized
according to the distance driven each year by the insured (Edlin, 2003; Ferreira and Minikel,
2013). Additionally, drivers’ speed profiles, the type of roads they most frequently take, and the
time of day they are typically on the roads are taken into account in the rating system (Litman,
2005; Sivak et al., 2007; Langford et al., 2008; Paefgen et al., 2013, 2014). These policies are
often only sold to young drivers; yet, significant differences have been reported between novice
and experienced young drivers, suggesting young policyholders constitute a heterogeneous risk
group (Ayuso et al., 2014).
A number of analyses of PAYD insurance have generated interesting results that need to be
considered in the ratemaking process. For example, Boucher et al. (2013) and, previously,
Litman (2005) and Langford et al. (2008), report that the relationship between the number of
accidents and the distance travelled by a driver may not necessarily be linear (that is, the
relationship between the distance travelled by a vehicle and the risk of accident is not
proportional). Additionally, Ayuso et al. (2016a) show that gender differences are mainly
attributable to intensity of vehicle use, so while gender is significant in explaining the time to the
first crash, it is no longer significant when the average distance travelled per day is introduced in
the model. On this basis, these authors conclude that no gender discrimination is necessary if
telematics provides enough information about driving habits.
Despite the recent research on PAYD insurance and driving patterns, little has been said as to
how the information collected by telematics systems can be used to improve or complement
traditional ratemaking systems. Ferreira and Minikel (2013) show that mileage is a significant
predictor of insurance risk, but that this factor alone cannot replace traditional rating factors, such
as class and territory (yet, mileage gains in explanatory power when used in conjunction with
these traditional factors). Lemaire et al. (2016) demonstrate that annual mileage is a powerful
predictor of the number of claims at fault and its significance exceeds that of all other classical
variables, including those traditionally linked to bonus-malus systems (BMS). However, they
argue that the inclusion of annual mileage (as a new rating variable) should be combined with
classical BMS methods, given that information contained in the BMS premium level
complements that contained in annual mileage figures. Our objective here, therefore, is to weigh
up the different alternatives now available to the insurance sector of introducing the new risk
factors, obtained via telemetry, into the insurance pricing system. These alternatives, moreover,
are not just limited to annual mileage data, but include other factors related to driver behaviour.
The new pricing systems should benefit not only the insurance industry, by being able to charge
premiums based on the risk at hand, but drivers as well, since they should be motivated to
improve their driving and to drive more carefully as this will have a direct impact on their
insurance costs.
5
The rest of the paper is organized as follows. In the following section, we analyse the
traditional methods used by actuaries to estimate premiums and how these might be modified to
include risk factors based on exposure and driver behaviour. In the third section, we present the
data used in this study along with our descriptive statistics. In section four, we present the results
of the empirical evaluation. Finally, we highlight the conclusions and limitations of this paper,
and make suggestions for further research.
2. Methods
The usual method for identifying the pure insurance premium is to apply a frequency and
severity model, where frequency refers to the number of claims per year and severity is the cost
per claim. In this paper we concentrate on the number of claims and assume severity to be
obtained from another model. We analyse a variety of alternatives for including information
acquired from a GPS system into the pricing process.
2.1 Frequency model
Let Yi, i=1,...,n denote the number of claims reported by insured i during a fixed time period,
which is usually one year. A total of n policyholders are to be used to build the models and each
policy unit is considered independent from all others.
Since policyholders present different characteristics, we denote by xi=(𝑥𝑖1, … , 𝑥𝑖𝑘) the
vector of k exogenous variables that measure the individual features or the risk factors that are
believed to have an impact on the expected number of claims. These risk factors are assumed to
be known when the policy is issued and they are either static or perfectly predictable over time
(age being a typical example of a regressor that changes deterministically over time).
We assume that there is a degree of heterogeneity in the risk of reporting a claim and, so, the
expected number of claims depends on these risk factors.
The Poisson regression model is a special case of the generalized linear model class and can
be used as a benchmark model. We also know that it is robust to the distribution assumption,
provided the mean is correctly specified. This is a classical result proved by Gourieroux et al.
(1984a and 1984b) in two celebrated papers published in Econometrica, which explains why the
model is omnipresent in the predictive modelling of count data (see, also Denuit et al., 2007;
Boucher et al., 2009; Boucher and Guillen, 2009).
Let us assume that given xi, the dependent variable Y
i follows a Poisson distribution with
parameter i , which is a function of the linear combination of parameters and regressors,
𝛽0 + 𝛽1𝑥𝑖1 + ⋯ + 𝛽𝑘 𝑥𝑖𝑘. Indeed,
𝐸(𝑌𝑖|𝑥𝑖) = exp (𝛽0 + 𝛽1𝑥𝑖1 + ⋯ + 𝛽𝑘 𝑥𝑖𝑘). (1)
6
The unknown parameters to be estimated are (𝛽0, … , 𝛽𝑘).
When exposure to risk varies, we can include an offset in the model. Let us call Ti the
exposure factor for policy holder i, then the model can incorporate this factor as follows:
𝐸(𝑌𝑖|𝑥𝑖, 𝑇𝑖) = 𝑇𝑖exp (𝛽0 + 𝛽1𝑥𝑖1 + ⋯ + 𝛽𝑘 𝑥𝑖𝑘). (2)
In this case, the analysis can be understood as a model for the number of claims per unit of
exposure.
Traditional software programmes allow for the maximum likelihood estimation of these
models and other generalizations that take into account overdispersion or zero-inflation, which
are common in automobile insurance applications. The Poisson model has many good properties,
including the consistency of the parameter estimates if the expectation is correctly specified, as
discussed above. This means that the predictive performance is robust, so parameter estimates do
not change much when implementing distributions that have additional parameters such as the
Negative Binomial – provided the expectation specified in (1) is correct.
The Akaike information criterion (AIC) can be used to compare models. It is calculated as
twice the number of parameters in the model minus twice the value of the log-likelihood in the
maximum given an observed sample. The best model is the one that presents the smallest AIC
criterion. The AIC penalizes the number of parameters less strongly than does the Bayesian
information criterion (BIC), which is calculated on the basis of the logarithm of the number of
observations, as opposed to multiplying the number of parameters by two as in the AIC.
2.2 Frequency model with telematics
By implementing telematics, we assume that additional information about the driving habits of
the policyholder becomes available. Let us denote by zi=(𝑧𝑖1, … , 𝑧𝑖𝑙), the vector of l variables that
are collected from the electronic system. We only consider variables that refer to the whole
period of exposure and summarize the driving behaviour. We consider a new set of parameters
(𝛾1, … , 𝛾𝑙) so that we can include information on usage in the specification of the model. Thus,
we have a full model with telematics data as follows:
𝐸(𝑌𝑖|𝑥𝑖, 𝑇𝑖, 𝑧𝑖) = 𝑇𝑖exp (𝛽0 + 𝛽1𝑥𝑖1 + ⋯ + 𝛽𝑘 𝑥𝑖𝑘 + 𝛾1𝑧𝑖1 + ⋯ + 𝛾𝑘 𝑧𝑖𝑘). (3)
The vector of unknown (k+l+1) parameters to be estimated is now(𝛽0, … , 𝛽𝑘, 𝛾1, … , 𝛾𝑙). The
maximum likelihood method for the Poisson model can also be used here.
2.3 Telematics as a correction
In this section, a two-step procedure is considered including classical actuarial information.
The initial classical actuarial model is assumed not to contain telematics information. So, in
the first step, we rely on a classical frequency model, such as (1), to obtain a prediction of the
7
expected number of claims for every policy i. Let us call iY the prediction of the expected
number of claims for policy i given the information on the initial characteristics xi. In the second
step, we assume that additional information collected by a GPS system becomes available. ��𝑖𝑈𝐵𝐼
is the prediction from usage-based insurance that is obtained as in the second step. Let us specify
)...exp(ˆ)ˆ,|( 110 ikkiiii
UBI
i zzYYzYE (4)
The parameter estimates can now be obtained using iY as an offset.
This is a practical method assessing the influence on the expected claim frequency of the
usage-based indicators and can be viewed as a correction to the initial ratemaking model. Our
aim is to compare the goodness-of-fit of the previous models, not only from the point of view of
global significance but also when analysing the individual significance of each model parameter.
In order to assess the prediction performance of the models we implement a statistic based on
the comparison of pairs of observations with a different outcome and the predictions provided by
the models for these observations. A pair is concordant if the predicted value of the model is
higher for the observation within a pair that has the highest observed value. The percentage of
concordant pairs is a measure of the predictive accuracy of the model. This statistic, and other
transformations, such as Somers’ D, has been used extensively in the context of binary logistic
regression to assess model performance (Lokshin and Newson, 2011) and has also been
implemented for use with more general cases (Newson, 2015).
3. Data
We have information on risk exposure and number of claims for 25,014 insured drivers, with car
insurance coverage throughout 2011, that is, individuals exposed to the risk for a full year. Our
sample is composed of drivers who underwrote a PAYD policy in 2009 with a leading Spanish
insurance company. On signing the agreement, their driving patterns began to be registered using
a GPS system. The follow-up period was concluded on 31December 2011. All the drivers were
under the age of forty at the time of underwriting the policy. The sample mean age is 27.57,
which is younger that the average age of all drivers. Authors studying the driving population in
Spain report average age to be older than the age of our sample. Official figures on the age of
citizens who have a driver’s license in Spain indicate that the average is 48.63 years. Alcañiz et
al. (2014) analyse a sample of random drivers who were stopped at sobriety checkpoint and they
report similar results for Catalonia (Spain).
The variables included in the modelling are shown in Table 1. The explanatory variables include
both the traditional factors used for pricing, including the age of the insured driver and gender,
and the new risk factors derived from a remote system. Our descriptive statistics, presented in
Tables 2 and 3, highlight differences between drivers with no claims and those with claims.

8
Table 1. Explanatory variables included in the models
Traditional ratemaking factors
Age
Age of the insured driver (in years)
Age2 Age squared of the insured driver
Male Gender of the insured driver (1 if male, 0 female)
Age driving licence Nº of years in possession of a driving license
Vehicle age Age of the insured vehicle
Power Power of the insured vehicle
Parking 1 if the car is parked in a garage overnight, 0 otherwise
New telematic ratemaking factors
Km per year (000s)
Total kilometres travelled per year (in thousands)
Km per year at night (%) Percentage of kilometres travelled at night during the year
Km per year at night (%)2 Percentage of kilometres travelled at night squared
Km per year over speed limit (%) Percentage of kilometres travelled during the year above the limit
Km per year over speed limit (%)2 Percentage of kilometres travelled during the year above the limit
squared
Urban km per year (%) Percentage of kilometres travelled in urban areas during the year
N = 25,014
Table 2. Descriptive statistics by claims
(quantitative variables)
All Sample
N = 25,014
Drivers with no claims
N = 20,608 (82.4%)
Drivers with claims
N = 4,406 (17.6%)
Mean Std. Dev. Mean Std. Dev. Mean Std. Dev.
Age 27.57 3.09 27.65 3.09 27.18 3.10
Age driving licence 7.17 3.05 7.27 3.07 6.73 2.94
Vehicle age 8.75 4.17 8.76 4.19 8.69 4.11
Power 97.22 27.77 96.98 27.83 98.36 27.46
Km per year (000s) 7.16 4.19 6.99 4.14 7.96 4.35
Km per year at night (%) 6.91 6.35 6.85 6.32 7.16 6.49
Km per year over speed
limit (%) 6.33 6.83 6.28 6.87 6.60 6.59
Urban km per year (%) 25.87 14.36 25.51 14.31 27.56 14.47
9
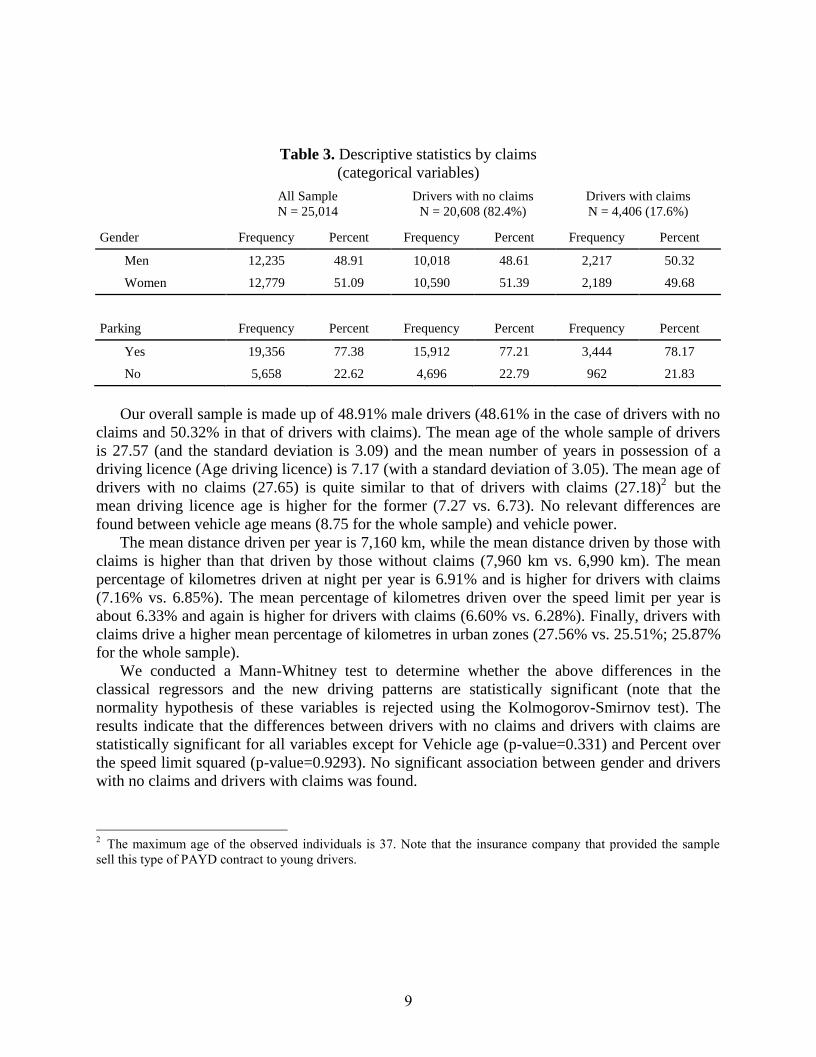
Table 3. Descriptive statistics by claims
(categorical variables)
All Sample
N = 25,014
Drivers with no claims
N = 20,608 (82.4%)
Drivers with claims
N = 4,406 (17.6%)
Gender Frequency Percent Frequency Percent Frequency Percent
Men 12,235 48.91 10,018 48.61 2,217 50.32
Women 12,779 51.09 10,590 51.39 2,189 49.68
Parking Frequency Percent Frequency Percent Frequency Percent
Yes 19,356 77.38 15,912 77.21 3,444 78.17
No 5,658 22.62 4,696 22.79 962 21.83
Our overall sample is made up of 48.91% male drivers (48.61% in the case of drivers with no
claims and 50.32% in that of drivers with claims). The mean age of the whole sample of drivers
is 27.57 (and the standard deviation is 3.09) and the mean number of years in possession of a
driving licence (Age driving licence) is 7.17 (with a standard deviation of 3.05). The mean age of
drivers with no claims (27.65) is quite similar to that of drivers with claims (27.18)2 but the
mean driving licence age is higher for the former (7.27 vs. 6.73). No relevant differences are
found between vehicle age means (8.75 for the whole sample) and vehicle power.
The mean distance driven per year is 7,160 km, while the mean distance driven by those with
claims is higher than that driven by those without claims (7,960 km vs. 6,990 km). The mean
percentage of kilometres driven at night per year is 6.91% and is higher for drivers with claims
(7.16% vs. 6.85%). The mean percentage of kilometres driven over the speed limit per year is
about 6.33% and again is higher for drivers with claims (6.60% vs. 6.28%). Finally, drivers with
claims drive a higher mean percentage of kilometres in urban zones (27.56% vs. 25.51%; 25.87%
for the whole sample).
We conducted a Mann-Whitney test to determine whether the above differences in the
classical regressors and the new driving patterns are statistically significant (note that the
normality hypothesis of these variables is rejected using the Kolmogorov-Smirnov test). The
results indicate that the differences between drivers with no claims and drivers with claims are
statistically significant for all variables except for Vehicle age (p-value=0.331) and Percent over
the speed limit squared (p-value=0.9293). No significant association between gender and drivers
with no claims and drivers with claims was found.
2 The maximum age of the observed individuals is 37. Note that the insurance company that provided the sample
sell this type of PAYD contract to young drivers.
10
4. Results
Table 4 presents the Poisson model estimates for all claim types using all available
information, both telematics and non-telematics data, and for the two-step approach. Table 5
presents similar Poisson model estimates as those presented in Table 4, but in this case for claims
where the policyholder was at fault. Claims “at fault” refer to accidents that have been caused by
other drivers. So they sometimes mean that at least another car was involved in the scene. Spain
has a “no fault” insurance system so that the policy covers the accident even it is not the
insured’s fault. In the United States, some States have regulation with no fault insurances, where
most often this just refers to the medical coverage provided in the policy. A minimum amount of
coverage is required depending the State's laws. Only the medical portion pays out regardless of
fault Tables 6 and 7 present the same model estimates including exposure to risk (kilometres
driven per year) as an offset in the model3. The reason why we show Tables 6 and 7 with offset
km per year is that we believe that many insurers are developing systems to price the insurance
contract based on mileage or kilometres driven. They plan to charge on a “per km” or “per mile”
basis. This is the reason why we have expressed the model on those units. However, as noted by
several authors (see, Boucher et al. 2013) the risk of an accident is not strictly proportional to the
distance driven. Indeed, there is a “learning effect” so that the risk does not increase
proportionally to distance driven.
3 We have used SAS PROC GENMOD to produce the model estimates and PROC IML to assess predictive
performance.
11
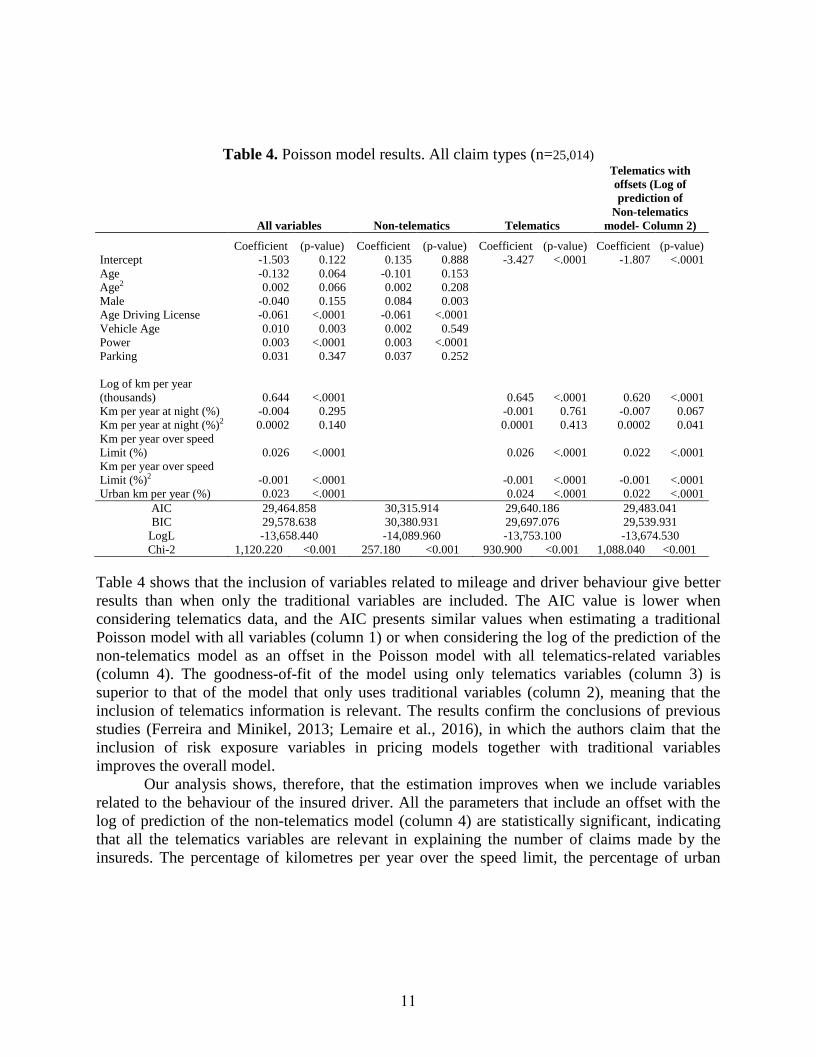
Table 4. Poisson model results. All claim types (n=25,014)
All variables Non-telematics Telematics
Telematics with
offsets (Log of
prediction of
Non-telematics
model- Column 2)
Coefficient (p-value) Coefficient (p-value) Coefficient (p-value) Coefficient (p-value)
Intercept -1.503 0.122 0.135 0.888 -3.427 <.0001 -1.807 <.0001
Age -0.132 0.064 -0.101 0.153
Age2 0.002 0.066 0.002 0.208
Male -0.040 0.155 0.084 0.003
Age Driving License -0.061 <.0001 -0.061 <.0001
Vehicle Age 0.010 0.003 0.002 0.549
Power 0.003 <.0001 0.003 <.0001
Parking 0.031 0.347 0.037 0.252
Log of km per year
(thousands) 0.644 <.0001 0.645 <.0001 0.620 <.0001
Km per year at night (%) -0.004 0.295 -0.001 0.761 -0.007 0.067
Km per year at night (%)2 0.0002 0.140 0.0001 0.413 0.0002 0.041
Km per year over speed
Limit (%) 0.026 <.0001 0.026 <.0001 0.022 <.0001
Km per year over speed
Limit (%)2 -0.001 <.0001 -0.001 <.0001 -0.001 <.0001
Urban km per year (%) 0.023 <.0001 0.024 <.0001 0.022 <.0001
AIC 29,464.858 30,315.914 29,640.186 29,483.041
BIC 29,578.638 30,380.931 29,697.076 29,539.931
LogL -13,658.440 -14,089.960 -13,753.100 -13,674.530
Chi-2 1,120.220 <0.001 257.180 <0.001 930.900 <0.001 1,088.040 <0.001
Table 4 shows that the inclusion of variables related to mileage and driver behaviour give better
results than when only the traditional variables are included. The AIC value is lower when
considering telematics data, and the AIC presents similar values when estimating a traditional
Poisson model with all variables (column 1) or when considering the log of the prediction of the
non-telematics model as an offset in the Poisson model with all telematics-related variables
(column 4). The goodness-of-fit of the model using only telematics variables (column 3) is
superior to that of the model that only uses traditional variables (column 2), meaning that the
inclusion of telematics information is relevant. The results confirm the conclusions of previous
studies (Ferreira and Minikel, 2013; Lemaire et al., 2016), in which the authors claim that the
inclusion of risk exposure variables in pricing models together with traditional variables
improves the overall model.
Our analysis shows, therefore, that the estimation improves when we include variables
related to the behaviour of the insured driver. All the parameters that include an offset with the
log of prediction of the non-telematics model (column 4) are statistically significant, indicating
that all the telematics variables are relevant in explaining the number of claims made by the
insureds. The percentage of kilometres per year over the speed limit, the percentage of urban
12
kilometres per year and, even, the total number of kilometres per year (all of which present a
p-value lower than 1%) show a direct relationship with the number of claims reported to the
insurance company. Additionally, the parameter of the square of the percentage of kilometres per
year driven at night is significant (p-value<5%), which means there is a non-linear relationship
between the percentage of kilometres driven at night and the number of claims. Thus, after a
driver has driven a certain number of kilometres per year at night, the effect of the variables
becomes positive and, so, the number of claims increases. Note that when we estimate the
Poisson model with telematics variables only (column 3), the percentage of kilometres driven per
year at night is not significant and, thus, the global goodness-of-fit is poorer than in the other
models. Nevertheless, the behaviour of the rest of the variables in this model is congruent with
respect to that of the model with offsets (column 4).
The effect of the classical variables is seen to change when we introduce the variables
related to risk exposure and driver behaviour to the specification (column 1 vs. column 2). Age
does not have a significant effect in the model that includes only the classical rating variables
(column 2) but, in the model that includes all variables, age becomes significant at the 10% level.
The inclusion of factors related to driver behaviour points to a degree of heterogeneity among the
group of young drivers. An analogous situation is evident in the case of driving experience (age
driving license). The negative sign presented by the coefficient of this variable (statistically
significant at the 1% level in the model that includes all variables and in that which includes only
traditional variables) tells us that the expected number of claims decreases as driving experience
increases. However, as the age of the vehicle increases, the expected number of claims increases,
although the parameter is not significant in the traditional model. Vehicle power presents a
positive effect in the traditional model as well in the model that includes all variables, but this is
not the case with gender, which is not significant when we include the telematics variables.
Indeed, Ayuso et al. (2016b) stress the importance of including the new variables of risk
exposure and driver behaviour in the new framework that prohibits companies from charging
different premiums according to the gender of the driver. Finally, the results are the same for the
model with telematics variables and the version with offsets (columns 3 and 4), with a significant
influence of the annual distance but also with the percentage of kilometres driven per year over
the speed limit and the percentage of urban kilometres driven per year.
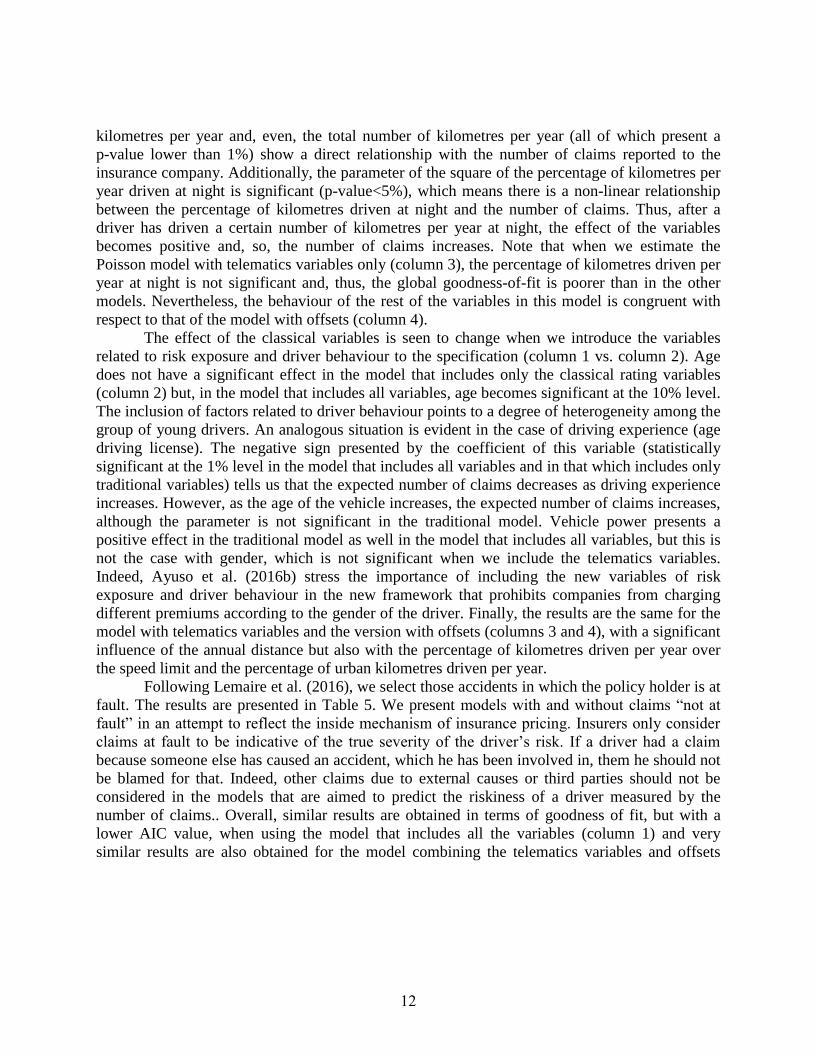
Following Lemaire et al. (2016), we select those accidents in which the policy holder is at
fault. The results are presented in Table 5. We present models with and without claims “not at
fault” in an attempt to reflect the inside mechanism of insurance pricing. Insurers only consider
claims at fault to be indicative of the true severity of the driver’s risk. If a driver had a claim
because someone else has caused an accident, which he has been involved in, them he should not
be blamed for that. Indeed, other claims due to external causes or third parties should not be
considered in the models that are aimed to predict the riskiness of a driver measured by the
number of claims.. Overall, similar results are obtained in terms of goodness of fit, but with a
lower AIC value, when using the model that includes all the variables (column 1) and very
similar results are also obtained for the model combining the telematics variables and offsets
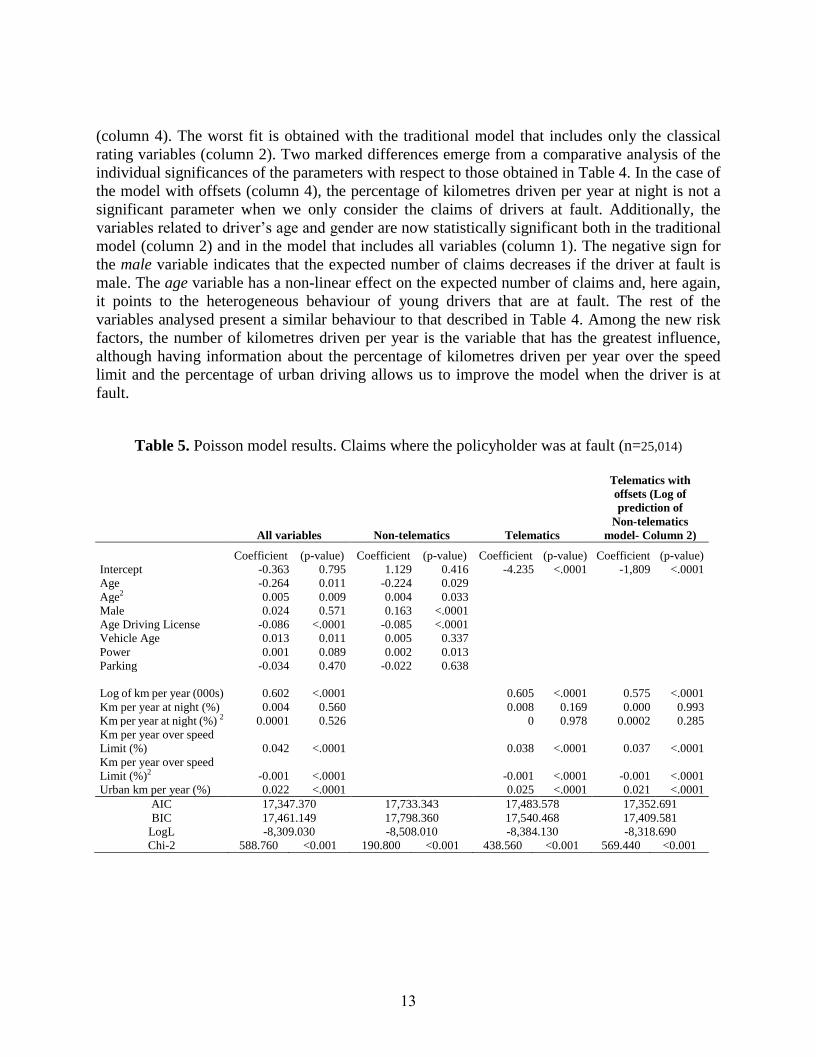
13
(column 4). The worst fit is obtained with the traditional model that includes only the classical
rating variables (column 2). Two marked differences emerge from a comparative analysis of the
individual significances of the parameters with respect to those obtained in Table 4. In the case of
the model with offsets (column 4), the percentage of kilometres driven per year at night is not a
significant parameter when we only consider the claims of drivers at fault. Additionally, the
variables related to driver’s age and gender are now statistically significant both in the traditional
model (column 2) and in the model that includes all variables (column 1). The negative sign for
the male variable indicates that the expected number of claims decreases if the driver at fault is
male. The age variable has a non-linear effect on the expected number of claims and, here again,
it points to the heterogeneous behaviour of young drivers that are at fault. The rest of the
variables analysed present a similar behaviour to that described in Table 4. Among the new risk
factors, the number of kilometres driven per year is the variable that has the greatest influence,
although having information about the percentage of kilometres driven per year over the speed
limit and the percentage of urban driving allows us to improve the model when the driver is at
fault.
Table 5. Poisson model results. Claims where the policyholder was at fault (n=25,014)
All variables Non-telematics Telematics
Telematics with
offsets (Log of
prediction of
Non-telematics
model- Column 2)
Coefficient (p-value) Coefficient (p-value) Coefficient (p-value) Coefficient (p-value)
Intercept -0.363 0.795 1.129 0.416 -4.235 <.0001 -1,809 <.0001
Age -0.264 0.011 -0.224 0.029
Age2 0.005 0.009 0.004 0.033
Male 0.024 0.571 0.163 <.0001
Age Driving License -0.086 <.0001 -0.085 <.0001
Vehicle Age 0.013 0.011 0.005 0.337
Power 0.001 0.089 0.002 0.013
Parking -0.034 0.470 -0.022 0.638
Log of km per year (000s) 0.602 <.0001 0.605 <.0001 0.575 <.0001
Km per year at night (%) 0.004 0.560 0.008 0.169 0.000 0.993
Km per year at night (%) 2 0.0001 0.526 0 0.978 0.0002 0.285
Km per year over speed
Limit (%) 0.042 <.0001 0.038 <.0001 0.037 <.0001
Km per year over speed
Limit (%)2 -0.001 <.0001 -0.001 <.0001 -0.001 <.0001
Urban km per year (%) 0.022 <.0001 0.025 <.0001 0.021 <.0001
AIC 17,347.370 17,733.343 17,483.578 17,352.691
BIC 17,461.149 17,798.360 17,540.468 17,409.581
LogL -8,309.030 -8,508.010 -8,384.130 -8,318.690
Chi-2 588.760 <0.001 190.800 <0.001 438.560 <0.001 569.440 <0.001
14
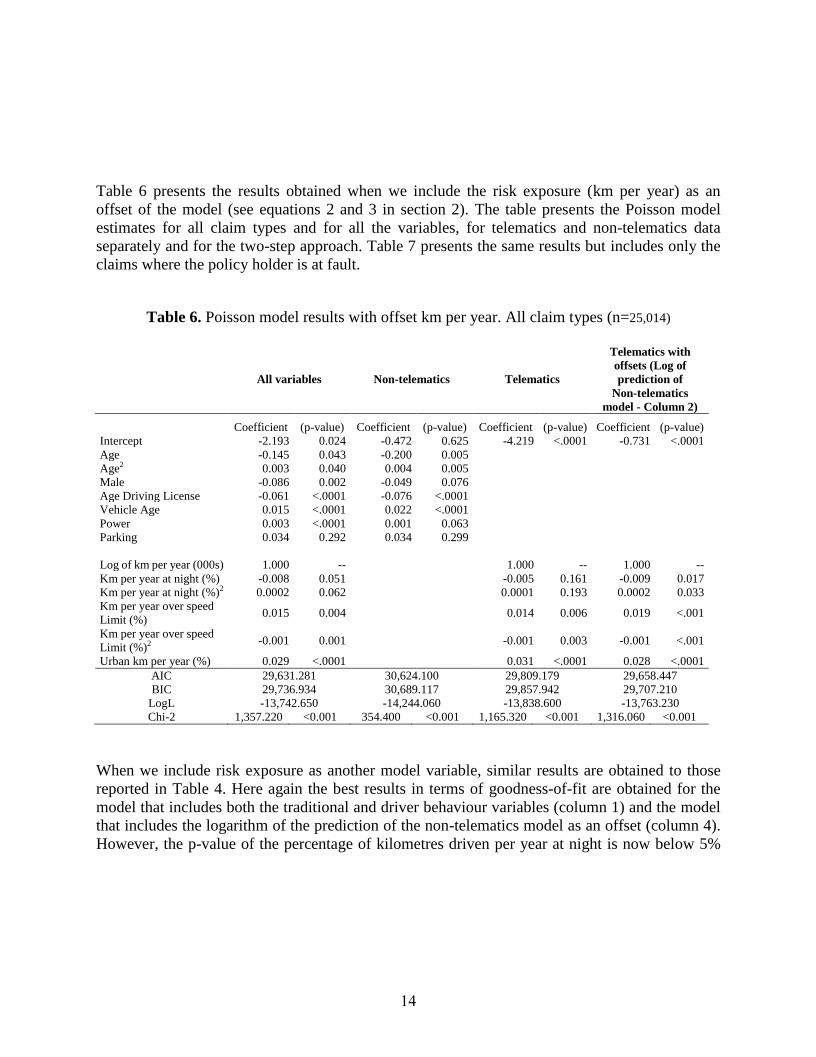
Table 6 presents the results obtained when we include the risk exposure (km per year) as an
offset of the model (see equations 2 and 3 in section 2). The table presents the Poisson model
estimates for all claim types and for all the variables, for telematics and non-telematics data
separately and for the two-step approach. Table 7 presents the same results but includes only the
claims where the policy holder is at fault.
Table 6. Poisson model results with offset km per year. All claim types (n=25,014)
All variables Non-telematics Telematics
Telematics with
offsets (Log of
prediction of
Non-telematics
model - Column 2)
Coefficient (p-value) Coefficient (p-value) Coefficient (p-value) Coefficient (p-value)
Intercept -2.193 0.024 -0.472 0.625 -4.219 <.0001 -0.731 <.0001
Age -0.145 0.043 -0.200 0.005
Age2 0.003 0.040 0.004 0.005
Male -0.086 0.002 -0.049 0.076
Age Driving License -0.061 <.0001 -0.076 <.0001
Vehicle Age 0.015 <.0001 0.022 <.0001
Power 0.003 <.0001 0.001 0.063
Parking 0.034 0.292 0.034 0.299
Log of km per year (000s)
1.000
--
1.000
--
1.000
--
Km per year at night (%) -0.008 0.051 -0.005 0.161 -0.009 0.017
Km per year at night (%)2 0.0002 0.062 0.0001 0.193 0.0002 0.033
Km per year over speed
Limit (%) 0.015 0.004 0.014 0.006 0.019 <.001
Km per year over speed
Limit (%)2 -0.001 0.001 -0.001 0.003 -0.001 <.001
Urban km per year (%) 0.029 <.0001 0.031 <.0001 0.028 <.0001
AIC 29,631.281 30,624.100 29,809.179 29,658.447
BIC 29,736.934 30,689.117 29,857.942 29,707.210
LogL -13,742.650 -14,244.060 -13,838.600 -13,763.230
Chi-2 1,357.220 <0.001 354.400 <0.001 1,165.320 <0.001 1,316.060 <0.001
When we include risk exposure as another model variable, similar results are obtained to those
reported in Table 4. Here again the best results in terms of goodness-of-fit are obtained for the
model that includes both the traditional and driver behaviour variables (column 1) and the model
that includes the logarithm of the prediction of the non-telematics model as an offset (column 4).
However, the p-value of the percentage of kilometres driven per year at night is now below 5%
15
(whereas it was just below 10% in Table 4). In the model that includes all driver variables, this
parameter, in addition to the gender variable, is significant, indicating a reduction in the expected
number of accidents if the driver is male.
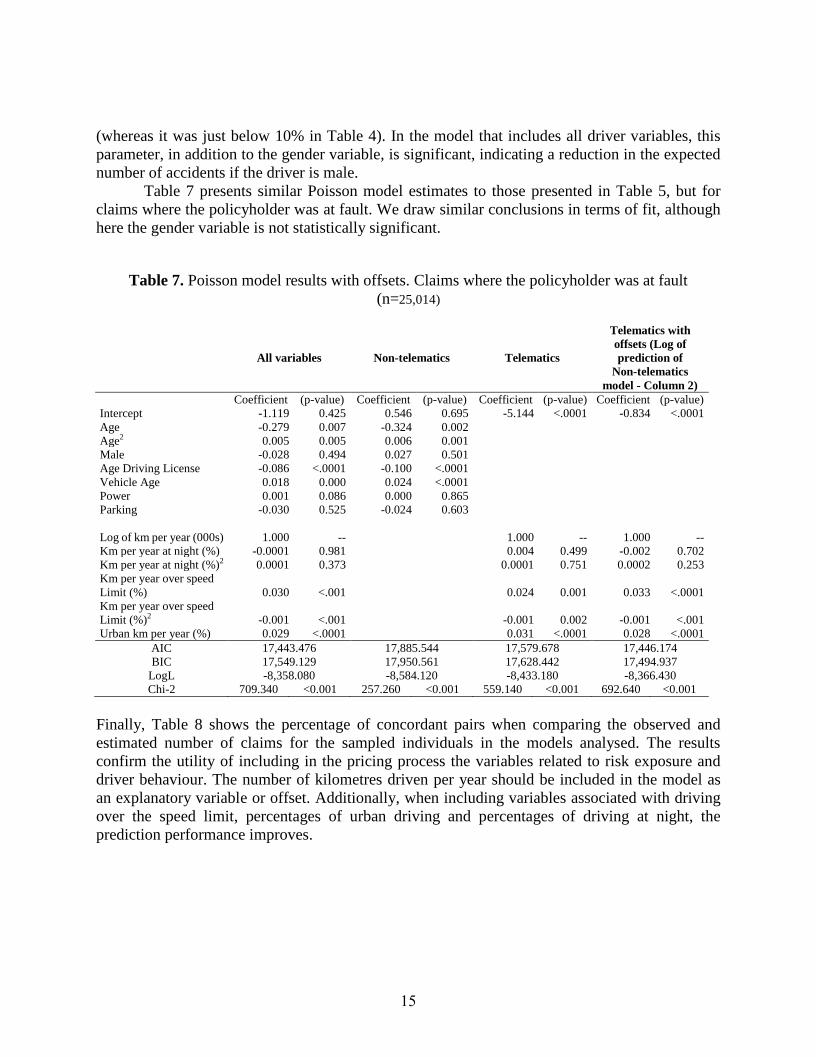
Table 7 presents similar Poisson model estimates to those presented in Table 5, but for
claims where the policyholder was at fault. We draw similar conclusions in terms of fit, although
here the gender variable is not statistically significant.
Table 7. Poisson model results with offsets. Claims where the policyholder was at fault
(n=25,014)
All variables Non-telematics Telematics
Telematics with
offsets (Log of
prediction of
Non-telematics
model - Column 2)
Coefficient (p-value) Coefficient (p-value) Coefficient (p-value) Coefficient (p-value)
Intercept -1.119 0.425 0.546 0.695 -5.144 <.0001 -0.834 <.0001
Age -0.279 0.007 -0.324 0.002
Age2 0.005 0.005 0.006 0.001
Male -0.028 0.494 0.027 0.501
Age Driving License -0.086 <.0001 -0.100 <.0001
Vehicle Age 0.018 0.000 0.024 <.0001
Power 0.001 0.086 0.000 0.865
Parking -0.030 0.525 -0.024 0.603
Log of km per year (000s)
1.000
--
1.000
--
1.000
--
Km per year at night (%) -0.0001 0.981 0.004 0.499 -0.002 0.702
Km per year at night (%)2 0.0001 0.373 0.0001 0.751 0.0002 0.253
Km per year over speed
Limit (%) 0.030 <.001 0.024 0.001 0.033 <.0001
Km per year over speed
Limit (%)2 -0.001 <.001 -0.001 0.002 -0.001 <.001
Urban km per year (%) 0.029 <.0001 0.031 <.0001 0.028 <.0001
AIC 17,443.476 17,885.544 17,579.678 17,446.174
BIC 17,549.129 17,950.561 17,628.442 17,494.937
LogL -8,358.080 -8,584.120 -8,433.180 -8,366.430
Chi-2 709.340 <0.001 257.260 <0.001 559.140 <0.001 692.640 <0.001
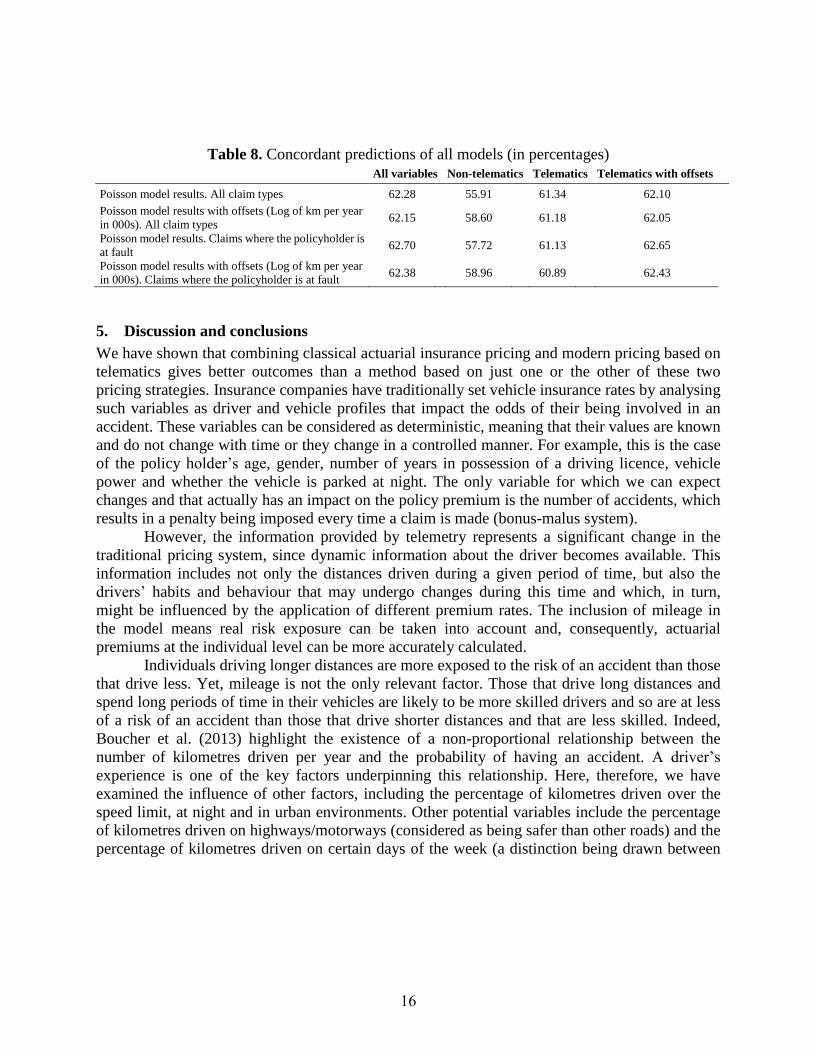
Finally, Table 8 shows the percentage of concordant pairs when comparing the observed and
estimated number of claims for the sampled individuals in the models analysed. The results
confirm the utility of including in the pricing process the variables related to risk exposure and
driver behaviour. The number of kilometres driven per year should be included in the model as
an explanatory variable or offset. Additionally, when including variables associated with driving
over the speed limit, percentages of urban driving and percentages of driving at night, the
prediction performance improves.
16
Table 8. Concordant predictions of all models (in percentages)
All variables Non-telematics Telematics Telematics with offsets
Poisson model results. All claim types 62.28 55.91 61.34 62.10
Poisson model results with offsets (Log of km per year
in 000s). All claim types 62.15 58.60 61.18 62.05
Poisson model results. Claims where the policyholder is
at fault 62.70 57.72 61.13 62.65
Poisson model results with offsets (Log of km per year
in 000s). Claims where the policyholder is at fault 62.38 58.96 60.89 62.43
5. Discussion and conclusions
We have shown that combining classical actuarial insurance pricing and modern pricing based on
telematics gives better outcomes than a method based on just one or the other of these two
pricing strategies. Insurance companies have traditionally set vehicle insurance rates by analysing
such variables as driver and vehicle profiles that impact the odds of their being involved in an
accident. These variables can be considered as deterministic, meaning that their values are known
and do not change with time or they change in a controlled manner. For example, this is the case
of the policy holder’s age, gender, number of years in possession of a driving licence, vehicle
power and whether the vehicle is parked at night. The only variable for which we can expect
changes and that actually has an impact on the policy premium is the number of accidents, which
results in a penalty being imposed every time a claim is made (bonus-malus system).
However, the information provided by telemetry represents a significant change in the
traditional pricing system, since dynamic information about the driver becomes available. This
information includes not only the distances driven during a given period of time, but also the
drivers’ habits and behaviour that may undergo changes during this time and which, in turn,
might be influenced by the application of different premium rates. The inclusion of mileage in
the model means real risk exposure can be taken into account and, consequently, actuarial
premiums at the individual level can be more accurately calculated.
Individuals driving longer distances are more exposed to the risk of an accident than those
that drive less. Yet, mileage is not the only relevant factor. Those that drive long distances and
spend long periods of time in their vehicles are likely to be more skilled drivers and so are at less
of a risk of an accident than those that drive shorter distances and that are less skilled. Indeed,
Boucher et al. (2013) highlight the existence of a non-proportional relationship between the
number of kilometres driven per year and the probability of having an accident. A driver’s
experience is one of the key factors underpinning this relationship. Here, therefore, we have
examined the influence of other factors, including the percentage of kilometres driven over the
speed limit, at night and in urban environments. Other potential variables include the percentage
of kilometres driven on highways/motorways (considered as being safer than other roads) and the
percentage of kilometres driven on certain days of the week (a distinction being drawn between
17
weekdays and weekends). However, one limitation of the conclusions of our results on the effects
on telematics factors on the risk of an accident is that our sample is composed of young drivers
and these results may not be extrapolated to a population of older drivers.
Telemetry can ensure the inclusion in the ratemaking process of factors that are typically
identified by traffic authorities as being accident indicators. It can provide important information
about traffic violations, as well as about the road types the driver typically travels on and about
the time of day and day of the week when the driver is using their vehicle. In this paper we have
specifically taken into account the percentage distance driven over the speed limit, but GPS
information could also provide details about such driver habits as sudden or hard braking, the
distance the driver maintains with other vehicles on the road and other habits in adverse weather
conditions. Many recent papers in the field of safety research, for example, have examined the
effects on driver behaviour of reduced visibility (Abdel-Aty et al. 2011; Hassan and Abdel-Aty
2013; Yan et al. 2014). The premium penalties for policyholders that ignore speed limits
contribute to the development of road safety policies and to collaboration between public
institutions and business.
We conclude, therefore, that the use of usage-based information is informative for
premium ratemaking. We also show that telemetrics information can serve to correct the classical
frequency model and is a practical approach to the implementation of telemetrics. Our results
show that variables related to the annual distance driven and to a driver’s behaviour lead to better
estimations of the expected number of accidents than those reached when using the traditional
variables of driver age and gender. However, the model that performs the best is the one that
includes both traditional and the new telemetric variables, with the annual distance included as
either a regressor or offset (risk exposure) in the model. The study of the effects on a model
accounting for a large number of zeros in the dependent variable constitutes our immediate line
of future research (given that 82.4% of the drivers were not involved in an accident, rising to
91.3% if we only consider cases where the policyholder was at fault), although this would be
oriented towards explaining the excess of zeros4 with respect to the relationship to the distance
driven rather than towards the prediction and correction of insurance rates.
4 The concept “excess of zeros” is a standard expression in the field of statistics that refers to situations where a
large proportion of observations equal the value zero. This is the case in our data, many drivers did not report a claim
in one year. It is likely that not all zeros are driven by the same rules. For instance, some may be due to a good
driving style, while others may be caused by insureds that do not drive at all. Additionally the same (or different) set
of explanatory variables might have varying effects on the two types of zeroes. For example, the car age may be a
factor of danger thus leading to a larger number of claims, but at the same time having an old car may be associated
to people who do not use the car much, so that they are likely to be occasional users and then the risk of a claim is
lower.
18
Acknowledgments
The study was supported by ICREA Academia, the Spanish Ministry of Economy and
Competitiveness and the ERDF under grants ECO2016-76203-C2-2-P and ECO2015-66314-R.
References
Abdel-Aty, M., Ekram, A., Huang, H., Choi, K.: A study on crashes related to visibility
obstruction due to fog and smoke. Accident Analysis and Prevention 43(5), 1730-1737
(2011)
Alcañiz, M., Guillen, M., Santolino, M., Sánchez-Moscona, D., Llatje, O., Ramón, Ll.:
Prevalence of alcohol-impaired drivers based on random breath tests in a roadside survey in
Catalonia (Spain). Accident Analysis and Prevention 65, 131-141 (2014)
Aseervatham, V., Lex, Ch., Spindler, M.: How do unisex rating regulations affect gender
differences in insurance premiums? The Geneva Papers on Risk and Insurance: Issues and
Practice 41, 128-160 (2016)
Ayuso, M., Guillen, M., Alcañiz, M.: The impact of traffic violations on the estimated cost of
traffic accidents with victims. Accident Analysis and Prevention 42, 709-717 (2010)
Ayuso, M., Guillen, M., Perez-Marin, A.M.: Time and distance to first accident and driving
patterns of young drivers with pay-as-you-drive insurance. Accident Analysis and
Prevention 73, 125-131 (2014)
Ayuso, M., Guillen, M., Perez-Marin, A.M.: Using GPS data to analyse the distance travelled to
the first accident at fault in pay-as-you-drive insurance. Transportation Research Part C:
Emerging Technologies 68, 160-167 (2016a)
Ayuso, M., Guillen, M., Perez-Marin, A. M.: Telematics and gender discrimination: some
usage-based evidence on whether men’s risk of accidents differs from women’s. Risks 4(2),
1-10 (2016b)
Baecke, P., Bocca, L.: The value of vehicle telematics data in insurance risk selection processes.
Decision Support Systems 98, 69-79 (2017)
Boucher, J. P., Denuit, M., Guillen, M.: Number of Accidents or Number of Claims? An
Approach with Zero Inflated Poisson Models for Panel Data. Journal of Risk and Insurance
76 (4), 821-846 (2009)
Boucher, J. P., Guillen, M.: A survey on models for panel count data with applications to
insurance. RACSAM-Revista de la Real Academia de Ciencias Exactas, Fisicas y Naturales.
Serie A. Matematicas 103 (2), 277-294 (2009)
Boucher, J.P., Perez-Marin, A.M., Santolino, M.: Pay-as-you-drive insurance: the effect of the
kilometers on the risk of accident. Anales del Instituto de Actuarios Españoles 19, 135-154
(2013)
Denuit, M., Maréchal, X., Pitrebois, S., Walhin, J. F.: Actuarial modelling of claim counts: Risk
classification, credibility and bonus-malus systems. John Wiley and Sons, New York (2007)
19
Edlin, A.S.: Per-mile premiums for auto insurance. In: Arnott, R., Greenwald, B., Kanbur, R.,
Nalebuff, B. (eds.) Economics for an imperfect world: Essays in honor of Joseph E. Stiglitz.
Cambridge, MA: MIT Press (2003)
Elias, W., Toledo, T., Shiftan, Y.: The effect of daily-activity patterns on crash involvement.
Accident Analysis and Prevention 42(6), 1682-1688 (2010)
Ellison, A.B., Bliemer, M.C.J., Greaves, S.P.: Evaluating changes in driver behaviour: a risk
profiling approach. Accident Analysis and Prevention 75, 298-309 (2015)
Ferreira, J., Minikel, E.: Measuring per mile risk for Pay-As-You-Drive auto insurance.
Transportation Research Record: Journal of the Transportation Research Board 2297, 10,
97-103 (2013)
Gourieroux, C., Monfort, A., Trognon, A.: Pseudo maximum likelihood methods: Theory.
Econometrica: Journal of the Econometric Society, 681-700 (1984a)
Gourieroux, C., Monfort, A., Trognon, A.: Pseudo maximum likelihood methods: Applications to
Poisson models. Econometrica: Journal of the Econometric Society, 701-720 (1984b)
Hassan, H., Abdel-Aty, M.: Predicting reduced visibility related crashes on freeways using
real-time traffic flow data. Journal of Safety Research 45, 29-36 (2013)
Isaacson, M., Shoval, N., Wahl H.W., Oswald, F., Auslander, G.: Compliance and data quality in
GPS-based studies. Transportation 43(1), 25-36 (2016)
Jun, J., Guensler, R., Ogle, J.: Differences in observed speed patterns between crash-involved
and crash-not-involved drivers: Application of in-vehicle monitoring technology.
Transportation Research Part C 19, 569-578 (2011)
Langford, J., Koppel, S., McCarthy, D., Srinivasan, S.: In defence of the ’low-mileage bias’.
Accident Analysis and Prevention 40 (6), 1996-1999 (2008)
Lemaire, J., Park, S.C., Wang, K.C.: The use of annual mileage as a rating variable. ASTIN
Bulletin 46 (1), 39-69 (2016)
Litman, T.: Pay-As-You-Drive pricing and insurance regulatory objectives. Journal of Insurance
Regulation, National Association of Insurance Commissioners 23 (3), 35-53 (2005)
Lokshin, M., Newson, R. B.: Impact of interventions on discrete outcomes: Maximum likelihood
estimation of the binary choice models with binary endogenous regressors. Stata Journal
11(3), 368-385 (2011)
Newson, R. B.: Somers’ D: A common currency for associations. In: United Kingdom Stata
Users' Group Meetings 2015, No. 01, Stata Users Group (2015)
Paefgen, J., Staake, T., Fleisch, E.: Multivariate exposure modelling of accident risk: Insights
from Pay-as-you-drive insurance data. Transportation Research Part A: Policy and Practice
61, 27-40 (2014)
Paefgen, J., Staake, T., Thiesse, F.: Evaluation and aggregation of pay-as-you-drive insurance
rate factors: a classification analysis approach. Decision Support Systems 56, 192-201
(2013)
Shafique, M. A., Hato, E. Use of acceleration data for transportation mode prediction.
Transportation 42 (1), 163-188 (2015)
20
Sivak, M., Luoma, J., Flannagan, M. J., Bingham, C. R., Eby, D. W., Shope, J.T.: Traffic safety
in the U.S.: Re-examining major opportunities. Journal of Safety Research 38(3), 337-355
(2007)
Tselentis, D.I., Yannis, G., Vlahogianni, E.I. Innovative motor insurance schemes: A review of
current practices and emerging challenges. Accident Analysis and Prevention 98, 139-148
(2017)
Underwood, G.: On-road behaviour of younger and older novices during the first six months of
driving. Accident Analysis and Prevention 58, 235-243 (2013)
Vickrey, W.: Auto accidents, tort law, externalities and insurance: An economist’s critique. Law
and Contemporary Problems 33(3), 464-487 (1968)
Xu, Y., Shaw, S.L., Zhao, Z., Yin, L., Fang, Z. and Li, Q.: Understanding aggregate human
mobility patterns using passive mobile phone location data: a home based approach.
Transportation 42 (4), 625-646 (2015)
Yan, X., Li, X., Liu, Y., Zhao, J.: Effects on foggy conditions on drivers’ speed control behaviors
at different risk levels. Safety Science 68, 275-287 (2014)
UB·Riskcenter Working Paper Series List of Published Working Papers
[WP 2014/01]. Bolancé, C., Guillen, M. and Pitt, D. (2014) “Non-parametric models for univariate claim severity distributions – an approach using R”, UB Riskcenter Working Papers Series 2014-01.
[WP 2014/02]. Mari del Cristo, L. and Gómez-Puig, M. (2014) “Dollarization and the relationship between EMBI and fundamentals in Latin American countries”, UB Riskcenter Working Papers Series 2014-02.
[WP 2014/03]. Gómez-Puig, M. and Sosvilla-Rivero, S. (2014) "Causality and contagion in EMU sovereign debt markets", UB Riskcenter Working Papers Series 2014-03.
[WP 2014/04]. Gómez-Puig, M., Sosvilla-Rivero, S. and Ramos-Herrera M.C. "An update on EMU sovereign yield spread drivers in time of crisis: A panel data analysis", UB Riskcenter Working Papers Series 2014- 04.
[WP 2014/05]. Alemany, R., Bolancé, C. and Guillen, M. (2014) "Accounting for severity of risk when pricing insurance products", UB Riskcenter Working Papers Series 2014-05.
[WP 2014/06]. Guelman, L., Guillen, M. and Pérez-Marín, AM. (2014) "Optimal personalized treatment rules for marketing interventions: A reviewof methods, a new proposal, and an insurance case study.", UB Riskcenter Working Papers Series 2014-06.
[WP 2014/07]. Piulachs, X., Alemany, R. and Guillen, M. (2014) "A joint longitudinal and survival model with health care usage for insured elderly", UB Riskcenter Working Papers Series 2014-07.
[WP 2014/08]. Abad, P and Chuliá, H. (2014) "European government bond market integration in turbulent times", UB Riskcenter Working Papers Series 2014-08.
[WP 2014/09]. Belles-Sampera, J., Guillen, M. and Santolino, M. (2014) "The use of flexible quantile-based measures in risk assessment", UB Riskcenter Working Papers Series 2014-09.
[WP 2015/01]. Bolancé C., Guillen, M. and Padilla, A (2015) "Estimación del riesgo mediante el ajuste de cópulas", UB Riskcenter Working Papers Series 2015-01.
[WP 2015/02]. Donnelly, C., Gerrard, R., Guillen, M. and Nielsen, J.P. (2015) "Less is more: increasing retirement gains by using an upside terminal wealth constrait", UB Riskcenter Working Papers Series 2015-02.
[WP 2015/03]. Chuliá, H., Guillen, G. and Uribe (2015) "Mortality and longevity risks in the United Kingdom: Dynamic factor models and copula-functions", UB Riskcenter Working Paper Series 2015-03.
[WP 2015/04]. Alaminos, E. and Ayuso, M. (2015) "Desarrollo metodológico del modelo actuarial de múltiples estados casado - viudo y cálculo actuarial del coste por pensiones de jubilación y viudedad", UB Riskcenter Working Paper Series 2015-04.
[WP 2015/05]. Belles-Sampera, J., Guillen, M. and Santolino, M. (2015) "What attitudes to risk underlie distortion risk measure choices?", UB Riskcenter Working Paper Series 2015-05.
[WP 2015/06]. Solé-Auro, A, and Alcañiz, M. (2015) "Is the educational health gap increasing for women? Results from Catalonia (Spain)", UB Riskcenter Working Paper Series 2015-06.
[WP 2015/07]. Donnelly, C., Guillen, M., Nielsen, J.P. and Pérez-Marín, AM. (2015) "On the practical implementation of retirement gains by using an upside and a downside terminal wealth constraint", UB Riskcenter Working Papers Series 2015-07.
[WP 2017/01]. Ayuso, M., Guillen, M. and Nielsen, J.P. (2017) "Improving automobile insurance ratemaking using telematics: incorporating mileage and driver behaviour data", UB Riskcenter Working Papers Series 2017-01.