Improving Access of Substance Abuse Facilities in CBSA 26980
28
Improving Access of Substance Abuse Facilities in CBSA 26980 Watson, Michael URP: 6225, ArcGIS for Planners Final Project May 5, 2016
-
Upload
michael-watson -
Category
Documents
-
view
29 -
download
0
Transcript of Improving Access of Substance Abuse Facilities in CBSA 26980

Improving Access of Substance Abuse Facilities in CBSA 26980
Watson, Michael
URP: 6225, ArcGIS for Planners
Final Project
May 5, 2016

Improving Access of Substance Abuse Facilities in CBSA 26980 | 0BWatson, Michael
Page 1 of 27
Executive Summary
According to a 2009 study, only 11.2% of those who seek substance abuse treatment
actually find it (SAMHSA, 2009). That means, on average, almost 21 million people within
the United States go without the help they desperately need. Couple this lack of access with
a sudden infusion of money from programs backed by the passage of the Affordable Care
Act (ACA), and there exists currently a window of opportunity for health care professionals
and agencies to improve the access of substance abuse services for all demographic groups.
This study uses the admissions data provided by SAMHSA from its TEDS-A dataset to
ascertain what types, or clusters, of demographic groups actively seek and find treatment
and, comparing that to actual demographic make-ups of specific areas recorded in the US
Census (namely, Johnson and Washington County in Iowa), find the best general locations
for new facilities. Through the creation of density maps filtered by population
demographics, and raster analysis maps that calculate according to the desired
demographics and relative seclusion of these populations from existing facilities, this study
finds that rural areas like Washington, Iowa need facilities introduced into the area and
more urban areas, like Iowa City, Iowa, need additional facilities established in neighboring
suburban locations.

Improving Access of Substance Abuse Facilities in CBSA 26980 | 0BWatson, Michael
Page 2 of 27
Introduction
In 2013, the National Institute of Health (NIH) conducted a study investigating drug use
across the United States which found that people had begun to turn towards illicit drug
consumption at ever increasing rates over the last decade. According to the study, an
estimated 24.6 million Americans (age 12 or above) admitted to using an illicit drug
sometime in the last month. This number, up a full percent since 2002, represents 9.4
percent of the population and includes a sudden and recent surge in the use of marijuana,
the most commonly used illicit drug (“DrugFacts: Nationwide Trends”, 2015). This swell in
usage suggests an increased need for facilities dealing with the abuse of such substances
and the recent passage of the Affordable Care Act (ACA) includes funding for such increases
(“Read the Law”, 2015; Frakt et al, 2014; Buck 2011). However, in general, this additional
funding and need has not equated to an increase in the number of facilities available for
those who desire them (Gorman, 2014). In fact, according to statistics released by SAMSHA
for 2009, only 11.2 percent out of 23.5 million people aged 12 and over who needed
treatment, found and received it (“DrugFacts: Treatment Statistics”, 2015). This means that
almost 21 million people who want such services never receive them. In a country with
expanding health resources, such a problem of access demands a solution. The simplest
course of action is to build more facilities, placing them in areas where the need proves
most pressing. But how to ascertain what types of people need such treatments or where
such facilities should be built?
This study aims to begin the process of answering these questions and decide what facility
locations would best fill the aforementioned treatment gaps. By sifting through admissions
data provided by the Substance Abuse and Mental Health Services Administration
(SAMHSA) and comparing it to the demographic data available through the US Census,
Improving Access of Substance Abuse Facilities in CBSA 26980 | 0BWatson, Michael
Page 3 of 27
specific areas with a particular demographic composition can be identified as needing
substance abuse facilities.
Method
Any study dealing with providing services to specific populations needs data. This study
focused on the Treatment Episode Data Set (TEDS) collected by SAMHSA. This data set
represents over 20 years (1992-2012) of admissions data from facilities across the United
States. For the purposes of simplicity and a desire to delve deeply into one area of the
country, this study deals only with the Core Based Statistical Area (CBSA) that includes Iowa
City, Iowa. This area, CBSA 26980, is comprised of the communities which reside in Johnson
and Washington County, and represents the highest level of geographic granularity
available within the admissions data set. All collected demographic data of this CBSA comes
from the 2010 census. As such, the only attributes of the TEDS admissions data inspected
includes only demographic data collected by census.gov. Therefore, out of the 64 available
variables within the TEDS dataset, only eight (age, gender, marital status, education,
employment, vet status, living arrangement, and primary income) gained consideration for
analysis. Race and ethnicity, attributes included in the original data date, were simulated in
the clustering process. Instead of grouping patients together with their race and ethnicities
included, this study clustered each race and/or ethnicity separately. This prevented
clusters forming based on the specific races and ethnicities of the patients and allowed the
study to focus on other, less superficial, connections. This meant that a pre-clustering of
sorts occurred before applying the hierarchical method as discussed in the next subsection,
‘Grouping the Data: Clustering’. This study grouped each patient according to their racial
designation (missing values excluded), only collecting patients who identified as non-

Improving Access of Substance Abuse Facilities in CBSA 26980 | 0BWatson, Michael
Page 4 of 27
Hispanic. All Hispanic individuals fell into their own pre-cluster, regardless of other
associated racial classifications.
Once set, these pre-clusters had each of their selected features endured a standardization
procedure where any ordinal categories (age, education, living arrangement) were changed
into equal increments between 0 and 1, and all non-ordinal categories were transformed
into binary features with 1 equal to the desired category (all other categories in feature
equaled 0). The following python code illustrates these transformations:
Figure 1: Python code for dictionary created to standardize attributes
Each category within the created python dictionary ‘attributeRanges’ used the list of
numbers at the end of the tuple associated with it to create the intervals. For instance, ‘AGE’
has a list of numbers 2 through 12, meaning that its range of values between 0 and 1 will
have 11 breaks (0, 0.1, 0.2, . . ., 1.0). A categorical feature, like ‘MARSTAT’ (denoted with a
‘cat’ designation in the first position of its associated tuple) has a specific value (the second
positon in the associated tuple, in this case a ‘2’) used to transform it into a binary variable.
This designated value becomes a ‘1’ during the transformation, and all other values within a
feature’s list turns to a ‘0’. This way, all features have uniform weights and allow any
analysis to consider each variable equally.
Grouping the Data: Clustering
In order to discover what types of demographic groupings existed within the TEDS
admissions data, this study employed hierarchical clustering using the Ward metric for
Improving Access of Substance Abuse Facilities in CBSA 26980 | 0BWatson, Michael
Page 5 of 27
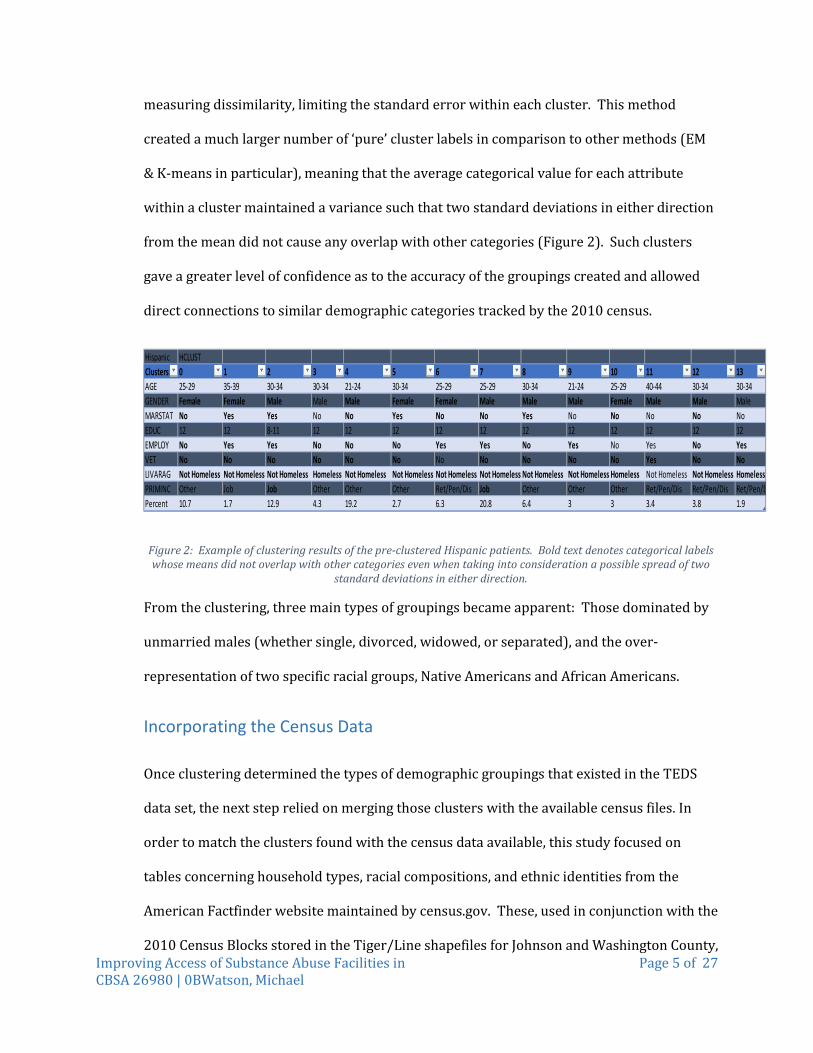
measuring dissimilarity, limiting the standard error within each cluster. This method
created a much larger number of ‘pure’ cluster labels in comparison to other methods (EM
& K-means in particular), meaning that the average categorical value for each attribute
within a cluster maintained a variance such that two standard deviations in either direction
from the mean did not cause any overlap with other categories (Figure 2). Such clusters
gave a greater level of confidence as to the accuracy of the groupings created and allowed
direct connections to similar demographic categories tracked by the 2010 census.
Figure 2: Example of clustering results of the pre-clustered Hispanic patients. Bold text denotes categorical labels whose means did not overlap with other categories even when taking into consideration a possible spread of two
standard deviations in either direction.
From the clustering, three main types of groupings became apparent: Those dominated by
unmarried males (whether single, divorced, widowed, or separated), and the over-
representation of two specific racial groups, Native Americans and African Americans.
Incorporating the Census Data
Once clustering determined the types of demographic groupings that existed in the TEDS
data set, the next step relied on merging those clusters with the available census files. In
order to match the clusters found with the census data available, this study focused on
tables concerning household types, racial compositions, and ethnic identities from the
American Factfinder website maintained by census.gov. These, used in conjunction with the
2010 Census Blocks stored in the Tiger/Line shapefiles for Johnson and Washington County,
Hispanic HCLUSTClusters 0 1 2 3 4 5 6 7 8 9 10 11 12 13AGE 25-29 35-39 30-34 30-34 21-24 30-34 25-29 25-29 30-34 21-24 25-29 40-44 30-34 30-34GENDER Female Female Male Male Male Female Female Male Male Male Female Male Male MaleMARSTAT No Yes Yes No No Yes No No Yes No No No No NoEDUC 12 12 8-11 12 12 12 12 12 12 12 12 12 12 12EMPLOY No Yes Yes No No No Yes Yes No Yes No Yes No YesVET No No No No No No No No No No No Yes No NoLIVARAG Not Homeless Not Homeless Not Homeless Homeless Not Homeless Not Homeless Not Homeless Not Homeless Not Homeless Not Homeless Homeless Not Homeless Not Homeless HomelessPRIMINC Other Job Job Other Other Other Ret/Pen/Dis Job Other Other Other Ret/Pen/Dis Ret/Pen/Dis Ret/Pen/DPercent 10.7 1.7 12.9 4.3 19.2 2.7 6.3 20.8 6.4 3 3 3.4 3.8 1.9

Improving Access of Substance Abuse Facilities in CBSA 26980 | 0BWatson, Michael
Page 6 of 27
allowed a way of visualizing the general locations of those specific demographic groups
identified by the clustering analysis.
Map Visualization
The last stage of the analysis centered on map creation. Using the demographic labels of the
clusters described above, all generated maps incorporated visualizations of these
population characteristics as well as raster calculations involving marital status, racial
identity, and proximity (3-mile radius) to existing facilities geocoded according to listed
address (“National Directory of Drug and Alcohol Abuse Treatment Programs”, 2013).
Based on those maps, location possibilities for new or additional facilities emerged.
Improving Access of Substance Abuse Facilities in CBSA 26980 | 0BWatson, Michael
Page 7 of 27
The Maps
Each of the following used ArcGIS by ESRI for creation. They all incorporate the GCS North
American 1983 coordinate system and each follow these initial design steps:
1. Downloaded the 2010 Census Block tables for Johnson and Washington counties for
Race, Hispanic, Household Type, and the TIGER/LINE 2010 Census Block shapefile for
each county.
2. Both the tables and shapefiles for Johnson and Washington county were joined together
to create one table each for Race, Hispanic, and Household Type for the CBSA 26980,
and one shapefile incorporating both counties.
3. Any census block within the new, joined, CBSA shapefile which had a land area equal to
zero was deleted. This eliminated all blocks comprised of only water.
4. Data from SAMHSA containing the addresses of each known substance abuse facility
across the United States was used to geo-locate each location within the state of Iowa. I
used the Texas A&M geocoding services and exported the results as its own shapefile.
From there, each map endured different sets of changes depending on the information
desired to extract. The following display of maps includes both a brief description of those
additional steps (listed in further detail in the Appendix), as well as a quick summary of
observations obtained from them.

Improving Access of Substance Abuse Facilities in CBSA 26980 | 0BWatson, Michael
Page 8 of 27
Map 1: The Facility Locations
Using the joined county shapefiles to create the light blue highlight for the location of
Johnson and Washington County, this map also used source data from the State of Iowa in
the form of a shapefile representing a polygon conforming to the state borders. This map
Improving Access of Substance Abuse Facilities in CBSA 26980 | 0BWatson, Michael
Page 9 of 27
used only the outline of that shapefile and pinpointed the geographic location of each
known facility.
Besides the visualization of facility locations, the above map also gives a glimpse as to one of
the issues this analysis highlights: the difference in access between rural and urban areas.
Aside from some counties in the west, most of the facilities exist in, or relatively near,
population centers like Des Moines, Cedar Rapids, Iowa City, Waterloo, and the Quad Cities
(Davenport). This rather stark contrast in proximal accessibility provides an area of
emphasis for later raster analysis. It also uncovers another problem: only four substance
abuse facilities exist with the CBSA 26980 (light blue section on the map), and they are all
located in the Iowa City area.

Improving Access of Substance Abuse Facilities in CBSA 26980 | 0BWatson, Michael
Page 10 of 27
Map 2: CBSA 26980
Improving Access of Substance Abuse Facilities in CBSA 26980 | 0BWatson, Michael
Page 11 of 27
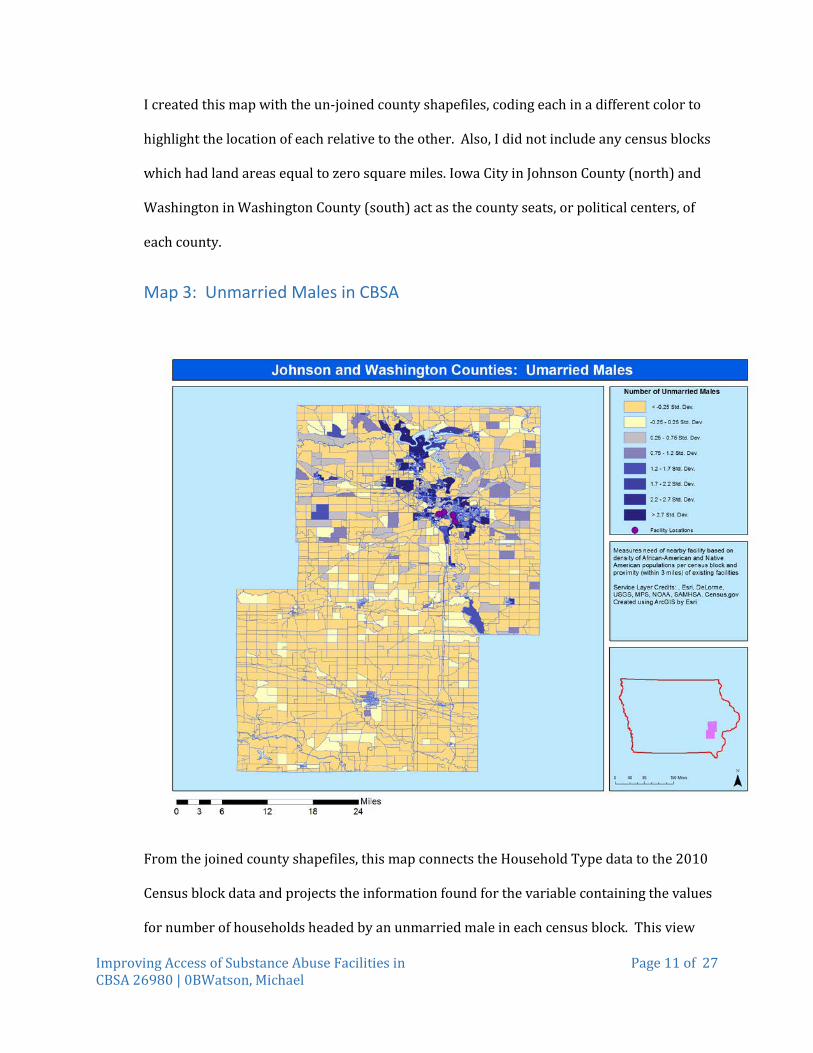
I created this map with the un-joined county shapefiles, coding each in a different color to
highlight the location of each relative to the other. Also, I did not include any census blocks
which had land areas equal to zero square miles. Iowa City in Johnson County (north) and
Washington in Washington County (south) act as the county seats, or political centers, of
each county.
Map 3: Unmarried Males in CBSA
From the joined county shapefiles, this map connects the Household Type data to the 2010
Census block data and projects the information found for the variable containing the values
for number of households headed by an unmarried male in each census block. This view

Improving Access of Substance Abuse Facilities in CBSA 26980 | 0BWatson, Michael
Page 12 of 27
offers insight into the locations of areas with larger populations of unmarried males,
displaying the 0.5 standard deviation from the mean as a way of lending the map more
contrast between census blocks (particularly in rural areas). Not surprisingly, such areas
occur most often in Johnson County, in the northern half of the CBSA, particularly close to
the Iowa City area and the University of Iowa.
Map 4: A close-up of unmarried males in Washington, Iowa
This map zooms in on the previous map, this time centered on Washington, Iowa in the
center of Washington County. This map also tracks the standard deviations of population
numbers of unmarried males and suggests that even in more remote rural areas, this
apparent at-risk population has found a home, and in a location with no nearby services.

Improving Access of Substance Abuse Facilities in CBSA 26980 | 0BWatson, Michael
Page 13 of 27
Map 5: Close-up of unmarried males in Iowa City, IA
Another zoom, this map also includes the facility location shapefile, with each facility
identified with a purple dot. From this view, many of the largest deviations from the mean
of unmarried males include nearby facility locations, but certain census blocks towards the
north and west (particularly in the Coralville, Tiffin, and North Liberty areas) suggest future
expansion of services to these neighborhoods.

Improving Access of Substance Abuse Facilities in CBSA 26980 | 0BWatson, Michael
Page 14 of 27
Map 6: Minority Populations in the CBSA
Beginning with the same source materials as the other maps, this one uses the Race table
available from Census.gov to calculate the percentage of minority peoples within each
census block. However, it omits anyone identifying as Asian as that particular ethnic group
makes up only about a quarter of a percent of all of the admissions data for this CBSA. As
such, many of the largest clusters of high percentage minority (not Asian) blocks exist
around the Iowa City and Washington, Iowa areas. Using the border shapefile adapted from
the state of Iowa, the extent of the map’s coverage is revealed in the insert in the lower
right-hand corner.

Improving Access of Substance Abuse Facilities in CBSA 26980 | 0BWatson, Michael
Page 15 of 27
Map 7: Minority Populations in Washington, Iowa
This map also uses the shapefile from the state of Iowa for the border inset, and zooms in on
the Washington, Iowa area, located in the inset by a black dot within the purple CBSA
region, and displays the population percentages of minorities within each census block.
This, combined with the map revealing a relatively large population of unmarried males
within the town limits, suggests that a need exists for a substance abuse facility in this area
to address the high population levels of at-risk groups identified by the earlier clustering
phase of the study.

Improving Access of Substance Abuse Facilities in CBSA 26980 | 0BWatson, Michael
Page 16 of 27
Map 8: Minority Populations in Iowa City, Iowa
As with the previous two maps focused on the minority population within CBSA 26980, this
map also incorporates a zoom; on the Iowa City area. This reveals a large number of high
percentage minority blocks to the southeast and northwest, towards North Liberty (upper
left corner). As with Washington, Iowa, the high concentrations of minorities combined
with the relatively large numbers of unmarried males suggests that this regions requires a
large number of substance abuse facilities. Even with four already available, more could be
built towards the northwest, near North Liberty and Coralville.

Improving Access of Substance Abuse Facilities in CBSA 26980 | 0BWatson, Michael
Page 17 of 27
Map 9: Raster Analysis in CBSA
Created by taking the Race table from Census.gov and the geocoded locations of the existing
facilities, this map assigns service levels according to the size of population densities of
African-American and Native American minorities, and lack of a nearby facility (each
concentric circle indicates a 3-mile radius) for each census block. According to these
results, the western half of Washington County (southwest corner) includes the most
underserved areas, with certain census blocks in the Iowa City area also needing further
attention.

Improving Access of Substance Abuse Facilities in CBSA 26980 | 0BWatson, Michael
Page 18 of 27
Map 10: Raster Analysis in Washington, Iowa
Once again zooming in on Washington, Iowa, this map reveals the location of the area in
Washington County where the Level of Service values start to decline towards the lowest half of the
scale without any recovery by certain census blocks. At this distance from the existing facilities in
Iowa City, any occurrences of at-risk populations pushes values towards the minimum
(underserved). As such, this, and locations to the west, indicate a need for substance facilities of
any kind in such isolated communities.

Improving Access of Substance Abuse Facilities in CBSA 26980 | 0BWatson, Michael
Page 19 of 27
Map 11: Raster Analysis in Iowa City, Iowa
For Iowa City, most of the area falls under the ‘Best Served’ category, with some isolated
clusters of census blocks indicating a large at-risk population. With the four current located
towards the south side of the map (green circles), it suggests that, despite the large amount
of red, a basic amount of coverage exists. However as the red moves to the north, and no
other facilities exist to provide such coverage, it appears as if future locations should focus
on the Coralville and North Liberty areas. Despite their proximity to local services, these
areas still register high in need.

Improving Access of Substance Abuse Facilities in CBSA 26980 | 0BWatson, Michael
Page 20 of 27
Conclusions
When taking into consideration the proximity of communities in relation to current
facilities and the existence of at-risk minority groups, the above maps tend to highlight one
important point: census blocks with relatively high numbers of African American and/or
Native American populations AND located more than 9 miles away from current facilities
rated as most in need of intervention. Places like Washington, IA in the center of
Washington County, with its relatively large Hispanic and Native American population and
lack of nearby facilities, require greater access to substance abuse services. These places
contain high concentrations of at-risk groups and have the added barrier of distance
preventing ease of access making them prime candidates for an infusion of substance and
mental health resources.
One area, though, provides an exception to the above rule. Iowa City, including its
surrounding suburbs of Coralville and North Liberty, also contains high ratings of need
despite its relative proximity to four current facilities. This suggests that, though services
exist in the area, there may not be enough to assure that the available facilities match the
surrounding population in scope of need or physical availability. For instance, do the sheer
numbers of at-risk populations far outweigh the current capabilities of the local facilities?
Do waiting lists exist? If so, how long? Do these facilities provide services in sync with the
substance abuse issues common in the area? How might other new facilities established in
outlying rural areas free up the already established ones in regards to how they can serve
their community?

Improving Access of Substance Abuse Facilities in CBSA 26980 | 0BWatson, Michael
Page 21 of 27
Future Study
All of these questions point to one over-arching lesson when dealing with data: more study
is required. Besides the fact that this data only deals with those admitted to substance
abuse facilities and does not include anyone needing but unable to find such services, this
data also in no way represents the quality or types of treatment offered. With the ever
shifting complexity of the drug use problem within the United States, facilities often have to
adjust their tactics as well as their services. This means staying on top of current trends of
drug use and issues that stem from such use can create a system of services tailored only to
specific groups and not necessarily to those still in need. The data used for this study
cannot account for such structural and societal fluctuations.
This means any further study should expand and incorporate information and insights from
the facilities themselves. This data could lend researchers a greater sense of both the
problem and area involved as well as suggesting further analytical methods. Armed with
such additional knowledge, researchers can be more effective in the ongoing endemic war
against substance abuse. In order for studies like this to truly provide actionable
intelligence regarding this problem, analysts will have to go much deeper than simple data
exploration to tell the stories the need to be told in order to guide future policy.

Improving Access of Substance Abuse Facilities in CBSA 26980 | 0BWatson, Michael
Page 22 of 27
Data Sources
Coordinate Systems: GCS North American 1983, NAD 1983
Datum: D North American 1983
Other Data:
“2010 Census Blocks, Johnson County”. Tiger/Line Shapefiles. United States Census. Web. 22 March
2016. https://www.census.gov/cgi-bin/geo/shapefiles/index.php
“2010 Census Blocks, Washington County”. Tiger/Line Shapefiles. United States Census. Web. 22
March 2016. https://www.census.gov/cgi-bin/geo/shapefiles/index.php
“Boundary of the State of Iowa”. Iowa Department of Natural Resources. State of Iowa. Web. 22
March 2016. http://programs.iowadnr.gov/nrgislibx
“Household Type for the Population in Households, Johnson County, Iowa”. American Factfinder.
United States Census. Web. 22 March 2016.
http://factfinder.census.gov/faces/nav/jsf/pages/index.xhtml
“Household Type for the Population in Households, Washington County, Iowa”. American Factfinder.
United States Census. Web. 22 March 2016.
http://factfinder.census.gov/faces/nav/jsf/pages/index.xhtml
“Race, Johnson County, Iowa”. American Factfinder. United States Census. Web. 22 March 2016.
http://factfinder.census.gov/faces/nav/jsf/pages/index.xhtml
Improving Access of Substance Abuse Facilities in CBSA 26980 | 0BWatson, Michael
Page 23 of 27
“Race, Washington County, Iowa”. American Factfinder. United States Census. Web. 22 March 2016.
http://factfinder.census.gov/faces/nav/jsf/pages/index.xhtml
“Treatment Episode Data Set - Admissions (TEDS-A) Series.” ICPSR. University of Michigan. n.d.
Web. 14 December 2015.
References
Buck, J.A., “The Looming Expansion and Transformation of Public Substance Abuse Treatment
Under the Affordable Care Act.” Health Affairs. 30(8) (2011): 1402-1410. PDF.
“DrugFacts: Nationwide Trends.” National Institute of Health; National Institute on Drug Abuse.
drugabuse.gov, June 2015. Web. 9 December 2015.
“DrugFacts: Treatment Statistics.” National Institute of Health; National Institute on Drug Abuse.
drugabuse.gov, March 2011. Web. 14 December 2015.
Frakt, Austin B., Trafton, Jodie, Pizer, Steven. “Maintenance of Access as Demand for Substance
Abuse Use Disorder Grows.” Journal of Substance Abuse Treatment. 55 (2014): 58-63. PDF.
“Geography: Geographic Terms and Concepts.” United States Census Bureau. census.gov, n.d., Web.
18 December 2015.
Gorman, Anna. “Barriers Remain Despite Health Law’s Push to Expand Access to Substance Abuse
Treatment.” Kaiser Health News. Kaiser Family Foundation, 10 Apr. 2014. Web. 14
December 2015.
“Homepage for PyPDF2 Project”. Phaseit. github.io n.d. Web. 18 December 2015.
“List of Metropolitan Statistical Areas.” Wikipedia. Wikimedia Foundation, Inc. 30 November 2015.
Web. 18 December 2015.

Improving Access of Substance Abuse Facilities in CBSA 26980 | 0BWatson, Michael
Page 24 of 27
Müllner, Daniel. “fastcluster: Fast Hierarchical, Agglomerative Clustering Routines for R and
Python”. Journal of Statistical Software. 53(9) (2013): 1-18. URL.
http://www.jstats.org/v53/i09/
“National Directory of Drug and Alcohol Abuse Treatment Programs”. Substance Abuse and Mental
Health Services Administration. United States Department of Health and Human Services.
samhsa.gov. June 2013. Web. December 2015.
“Read the Law: The Affordable Care Act, Section by Section.” U.S. Department of Health & Human
Services. hhs.gov. 28 August 2015. Web. 18 December 2015.
“SciPy.org.” SciPy Developers & Enthought. scipy.org. 14 December 2015. Web. 18 December 2015.
“Texas A&M Geoservices”. Department of Geography. Texas A&M University. 30 November 2015.
Web. 22 March 2016.
“Welcome to RStudio.” RStudio. rstudio.com. 2015. Web. 18 December 2015.
“Weka 3: Data Mining Software in Java.” The University of Waikato. cs.waikato.ac.nz. n.d. Web. 18
December 2015.

Improving Access of Substance Abuse Facilities in CBSA 26980 | 0BWatson, Michael
Page 25 of 27
Appendices: Map Creation Steps
Map 1: The Facility Locations
• Extracted facility addresses for state of Iowa with python-created .pdf scraper that
used the PyPDF2 package for access.
• Extracted addresses geocoded by Texas A&M batch geocoding services, with any
failures done manually through Google Maps.
• Imported geocoded data set and exported as a shapefile in NAD 1983 coordinate
system.
• Imported Facility Locations shapefile into blank document and added state of Iowa
border shapefile from Iowa Department of Natural Resources.
• Formatted point locations and border color and size
Map 2: CBSA 26980
• Imported Tiger/Line shapefiles for the 2010 census block data for Johnson and
Washington Counties.
• Formatted color of each shapefile and zoom level of map
Map 3-5: Unmarried Males
• Imported 2010 Household Types census block data for both Johnson and
Washington Counties.
• Imported Tiger/Line shapefiles for the 2010 census block data for Johnson and
Washington Counties.

Improving Access of Substance Abuse Facilities in CBSA 26980 | 0BWatson, Michael
Page 26 of 27
• Merged the Johnson and Washington County shapefiles into one shapefile. Exported
it as new shapefile, CBSA 26980
• Imported CBSA 26980 shapefile and joined the Household Type census block data to
it.
• Symbolized number of households with unmarried males as head of household as ½
standard deviations from mean
• Imported Facility Locations shapefile.
• Formatted points of locations and zoom levels of each map
Map 6-8: Minority Populations
• Imported 2010 Race census block data for both Johnson and Washington Counties.
• Calculated new field that subtracted number of white and Asian peoples from the
total population in each census block, and represented the result as a percentage of
the whole.
• Imported CBSA 26980 shapefile and joined the Race census block data to it.
• Symbolized percentage of minorities (not Asian) as stretched color ramp.
• Imported Facility Locations shapefile.
• Formatted points of locations and zoom levels of each map
Map 9-11: Raster Analyses
• Imported 2010 Race and Household Type census block data for both Johnson and
Washington Counties.
• Imported CBSA 26980 shapefile.
• Made same calculations and joins as mentioned for maps 3-8.
• Converted joined CBSA 269808 shapefile into polygon-raster data set

Improving Access of Substance Abuse Facilities in CBSA 26980 | 0BWatson, Michael
Page 27 of 27
• Imported Facility Locations shapefile
• Converted Facility Locations dataset into a point-raster data set
• Calculated Euclidean distance buffer of 3 miles for Facility Locations point-raster
• Reclassified all raster datasets on a 1-7 scale, with low numbers of minorities or
unmarried males registering as a 7, highest as a 1, and small proximal distance to
current facilities registering as a 7, and greatest distances as a 1.
• Calculated the reclassified rasters according to their adjusted scales and symbolized
the data as a stretched color ramp.
• Formatted point locations and zoom levels for each map.