IMPROVEMENTS IN NUMERACY ON A MICRO … FIELD STUDY IN THE PHILIPPINES . by . ... Improvements in...
46
IMPROVEMENTS IN NUMERACY ON A MICRO LEVEL: A FIELD STUDY IN THE PHILIPPINES by Karin Lindell NATIONALEKONOMISKA INSTITUTIONEN VID LUNDS UNIVERSITET Department of Economics at the University of Lund 2013:2 Minor Field Study Series No. 222 Mailing address: ISSN 0283-1589 Nationalekonomiska Institutionen Box 7082 S-220 07 LUND Sweden
Transcript of IMPROVEMENTS IN NUMERACY ON A MICRO … FIELD STUDY IN THE PHILIPPINES . by . ... Improvements in...

IMPROVEMENTS IN NUMERACY ON A MICRO LEVEL:
A FIELD STUDY IN THE PHILIPPINES
by
Karin Lindell
NATIONALEKONOMISKA INSTITUTIONEN VID LUNDS UNIVERSITET
Department of Economics at the University of Lund
2013:2
Minor Field Study Series
No. 222 Mailing address: ISSN 0283-1589 Nationalekonomiska Institutionen Box 7082 S-220 07 LUND Sweden

Improvements in numeracy on a micro level:
A field study in the Philippines Bachelor Thesis May 2013 Lund University Department of Economics Author: Karin Lindell Supervisors: Andreas Bergh and Therese Nilsson

2
Acknowledgements I would like to thank IKEA for their donation of pencils and Clas Ohlson for the discount on
reflexes. I would especially like to thank Alega Skolmaterial AB who donated 100 solar
powered calculators to the project. I also want to thank my supervisors Andreas Bergh and
Therese Nilsson for excellent guidance all the way through the project.
A project like this would not have been possible without financial support from SIDA, for
which I am very thankful. I am also grateful for the assistance in finding two high schools
suitable for the project, which the Philippine Red Cross Palawan provided me with.
Finally, but most importantly, I would like to thank all the teachers, the principal and
especially all the amazing students at Francisco Lagan Senior Memorial High School in
Caramay and Tagumpay National High School. I appreciate your great hospitality, support
and kindness.

3
Abstract This project investigates if access to a solar powered calculator improves numeracy and who
benefits the most from the use of a calculator. A randomized field study was carried out in
two different high schools in Palawan, a province in the Philippines. All participating students
took two identical mathematics tests based on mental arithmetic, the first at the initial stage
and the second seven weeks later at the end of the project. Difference-in-differences
estimation was used to find the difference between the change in test scores over time for
control and treatment groups.
In one of the schools the calculator did have a significant positive effect on test scores among
students in the treatment group. The difference-in-differences estimate indicates that the
treatment group increased its test score by approximately one point more than the control
group over the project’s time period. The results also suggest that the improvements in mental
arithmetic were highest in calculation problems based on division. Students living with
neither parent and with access to fewer schoolbooks tend to have lower test scores at baseline.
The change in test scores is reduced among students who have a higher number of siblings or
high absenteeism. To increase numeracy overall focus has to be directed at low performers to
improve basic knowledge in mathematics, as well as high performers who benefit the most
from a calculator.

4
Table of contents
Abbreviations 5 List of figures and tables 6
1. Introduction 7
2. Background 9
2.1. Palawan – a province in the Philippines 9
2.2. The Philippine education system 9
2.3. Education in Palawan 10
3. Theory 11
3.1. Human capital and economic growth 11
3.2. Definition of numeracy 13
3.3. The importance of numeracy 14
3.4. Illustration of the importance of numeracy 15
3.5. Levels of numeracy around the globe 17
4. Method 18
4.1. Specifics of the project 18
4.2. Difference-in-differences estimation 20
4.3. Limitations of the project 21
5. Results 23
5.1. Significance analysis at baseline 23
5.2. Difference-in-differences estimation 25
5.2.1. Regression model 25
5.2.2. Difference-in-differences estimation on total test score 25
5.2.3. Difference-in-differences estimation on categories of calculation problems 27
5.3. Regressions based on test scores and baseline characteristics 29
5.3.1. Regression models 29
5.3.2. Regression results 30
6. Discussion 33
7. Conclusion 36
8. Bibliography 37
Appendix 1 40
Appendix 2 42
Appendix 3 44

5
Abbreviations DepED MIMAROPA Department of Education Mimaropa
FLSMHS Francisco Lagan Senior Memorial High School
TNHS Tagumpay National High School

6
List of figures and tables Figure 1. Numeracy vs. mathematics
Figure 2. Change in average total test score over time (FLSMHS)
Figure 3. Change in average total test score over time (TNHS)
Table 1. Education statistics on children in the age span 12-15 years old
Table 2. Summary of research on test scores and economic growth
Table 3. Number of students in the project and the total number of enrollees
Table 4. An illustration of difference-in-differences estimation
Table 5. Mathematics test scores at baseline (FLSMHS)
Table 6. Mathematics test scores at baseline (TNHS)
Table 7. Difference-in-differences estimation on total test scores in FLSMHS and TNHS
Table 8. Categories of calculation problems
Table 9. Difference-in-differences estimation on categories of calculation problems
(FLSMHS)
Table 10. Difference-in-differences estimation on categories of calculation problems (TNHS)
Table 11. Regression results with test score at baseline as dependent variable
Table 12. Regression results with difference in test scores as dependent variable
Table 13. Significance analysis on baseline data (FLSMHS)
Table 14. Significance analysis on baseline data (TNHS)

7
1. Introduction The traditional Solow growth model states that an increased input of capital and labor into the
economy will enhance economic growth, but to a limited extent due to diminishing returns to
capital and labor. Instead, exogenous technological progress is considered to be the only
source of long-run growth (Jones, 2002, p. 22-45). One consequence of the model is that an
increase in inputs in less developed countries will result in more sizable economic growth
than in countries where levels of capital and labor are already high. Thus an increase in
capital can be very beneficial for less developed countries (Calmfors and Persson, 1999, p.
74-75). More recent models have put higher emphasis on economic growth as explained by
factors inside the economic system itself. The concept of capital is extended to include not
only monetary and physical capital, but also human capital. According to the models the
assumption of diminishing returns to scale is not necessarily true. Improvements in human
capital will enable labor to make use of both technology and also monetary and physical
capital more efficiently, resulting in economic growth (Romer, 1986).
The models illustrate the importance of human capital in countries’ economic growth;
however, the actual increase in human capital takes place on a micro level among the
individuals within a country. This project will focus on the individuals within the economy
and how human capital can increase on the individual level.
Unlike numeracy, literacy is traditionally a common proxy for human capital. As a
consequence, the literature on literacy is extensive while substantially less research has been
made on numeracy (Hippe, 2012). Numeracy skills are nonetheless of great importance at
individual level, both in individuals’ professions as well as in everyday life. It is not only
bankers and people working in financial services who are in need of numeracy skills; a shop
owner in Manila or farmers in rural areas also need some numeracy skills to run their
businesses. So an increase in numeracy, and hence an increase in human capital, would be
beneficial for the overall economy as well as for the individual. The essential question is then;
how can numeracy be improved?
To put a higher emphasis on how numeracy skills can be improved, I initiated a project
among students in two high schools in Palawan, a province in the Philippines. I stayed in
Palawan for seven weeks to perform the field study; during this time I organized a baseline
8
survey and two mathematics tests, based on mental arithmetic, for the students. The aim of
the project is to investigate if access to a solar powered calculator improves numeracy skills.
There are two possible connections between having access to a calculator and improvements
in numeracy, either a direct or an indirect connection. A direct improvement would be if the
use of the calculator itself resulted in higher numeracy. An indirect improvement on the other
hand would be if access to a calculator makes the student more enthusiastic about
mathematics overall, resulting in more time spent on studying mathematics and thus
improving numeracy skills. The main purpose of this project is not to study the direct or
indirect connection, but to investigate the possible effect on numeracy that access to a
calculator could have. Thus, the question of concern is as follows:
Does access to a calculator have a significantly positive effect on numeracy skills?
A calculator is likely to be more beneficial for some students than others, resulting in larger
improvements in numeracy. In order to reach all students to enhance numeracy overall, the
following question needs to be addressed:
Which students benefit the most from having access to a calculator?
To address the questions above, the following disposition has been used: chapter 2 provides
background information on the province of Palawan, the Philippine education system, and the
education in Palawan. Chapter 3 demonstrates the connection between human capital and
economic growth. The importance of numeracy is described and illustrated with the example
of Africa and Asia, and numeracy levels around the globe are presented. Chapter 4 presents
the applied data and econometric model, and some limitations of the project are also
discussed. The results in chapter 5 are followed by a discussion on the results in chapter 6 and
a general conclusion in chapter 7.

9
2. Background
2.1. Palawan -‐ a province in the Philippines
The province of Palawan is situated west of the main part of the Philippines. It is
geographically one of the largest areas in the Philippines with the elongated Palawan Island as
the main center of the province, and an additional 1780 islands surrounding it. The location as
the most eastern province of the Philippines has been proven favorable since Palawan is
protected from strong winds originating from the Pacific Ocean, and is rarely affected by
typhoons (Palawan Chamber of Commerce and Industry, Inc., n.d.). The Philippines became a
Spanish colony in 1521; the Christian church is one of the main heritages from the Spanish
era. It remained Spanish until the outbreak of the Spanish-American war, and in 1898 a Peace
treaty was signed, giving way to American rule over the Philippines (Dolan, 1991). During
American rule Puerto Princesa was named the capital of Palawan, agricultural and educational
reforms were being carried out, and new schools were built to make education more
accessible to the public (Palawan Chamber of Commerce and Industry, Inc., n.d.). Palawan
was occupied by Japan in 1942 and was liberated by the end of the Second World War in
1945. In 1946 the Philippines became independent from the US and the first president was
elected (Dolan, 1991). In 2010 the total population of Palawan was 996,340, out of which
222,673 lived in Puerto Princesa (NSO, 2010). The official languages of the country are the
Tagalog-based Filipino and English, but a wide variety of local languages are spoken
throughout the Philippines (Belvez, n.d.). Agriculture is the backbone of Palawan’s economy,
with corn, rice and coconuts being some of the main products. Fishing, logging and mining
are also of great importance, and in addition to this, oil-findings in the province have resulted
in a growing oil industry (NE, 2013).
2.2. The Philippine education system
The education system consists of six compulsory years of elementary school, between the age
of 6 and 11. This is followed by secondary school, which is comprised of four years of high
school for children between 12 and 15 years old. Elementary and secondary school combined
result in ten years of schooling (SEAMEO, n.d.). The Philippines is the only country in Asia
with solely ten years of basic education, and only two other countries worldwide use the same
educational system. The Philippine government has found that a high percentage of high
school graduates lack sufficient skills needed in the labor market or for higher education. In

10
order to increase the quality of education the Department of Education has recently
introduced the K-12 policy program. The program is an attempt to adapt to the internationally
accepted education system to make Filipinos more competitive in the global labor market (De
Justo, Digal, and Lagura, 2012). The program will transform the education system into a
twelve-year system in which two additional years will be added to the current high school,
extending secondary school into four years of junior high school and two extra years of senior
high school. The program will be implemented gradually; the first changes are to be made
during the ongoing academic year of 2012/2013, and the current grade seven will be the first
to graduate from senior high school in 2018 (The Official Gazette, 2012).
2.3. Education in Palawan
There are 114 public high schools and 19 private high schools in Palawan, with the majority
of the children being enrolled in public education. Table 1 shows the number of students
enrolled in high school compared to number of children in the corresponding age span living
in the region. In rural settings of Palawan, approximately half of the children between 12 and
15 years old do not enroll in high school. Approximately six out of ten children study at a
high school in the urban Puerto Princesa. The gender parity index of 1.27 and 1.19 indicates
that a higher number of females than males enroll in high school. Approximately half of the
enrolled students in the rural setting complete high school; the corresponding number is 44 %
in Puerto Princesa. The drop out rate is relatively similar in both Palawan and Puerto
Princesa, and it is higher among boys than girls (DepED MIMAROPA, 2008).
Table 1. Education statistics on children in the age span 12-15 years old. (Information retrieved from DepED MIMAROPA, 2008.) Enrollment Population NER GPI Completion rate Drop out rate Palawan Total 32 170 67 164 47.9 % 1.27 51.9 % 7.6 % Boys 14 366 33 950 42.3 % 48.5 % 9.8 % Girls 17 804 33 214 53.6 % 55.2 % 5.6 % Puerto Princesa Total 10 924 18 055 60.5 % 1.19 44.0 % 7.0 % Boys 5 040 9 126 55.2 % 35.3 % 7.5 % Girls 5 884 8 929 65.9 % 53.4 % 6.5 % Notes: Enrollment: number of children in the age span 12-15 enrolled in high school Population: total population of children in the age span 12-15 NER: Net Enrollment Ratio is the percentage of children in the age span 12-15 years old who are enrolled in high school. GPI: Gender Parity Index shows the ratio of female to male NER.

11
3. Theory
3.1. Human capital and economic growth
As Hanushek and Woessmann (2012) mention, investments in human capital, especially in
education, have been regarded as highly instrumental in enhancing economic growth over the
past few decades. They further point out that, such investments should result in improved
economic progress, according to the well-established growth models (as presented in chapter
1), but the results have been disappointing. In their study they suggest that the effect of
educational investments on growth is underestimated due to the use of less suitable measures
of human capital. Numerous studies have used years of schooling as a proxy for human
capital, but this measure has several deficiencies. The proxy is based on the assumption that
the benefits for human capital of one additional year of schooling are the same worldwide.
The assumption implies that one extra year in Bolivia should result in the same knowledge
accumulation as in Germany. Furthermore, knowledge is assumed to be accumulated mainly
through formal schooling, which means that alternative educational sources are ignored.
Instead of years of schooling, Hanushek and Woessmann (2012) use international tests in
mathematics and science over the time period 1964 to 2003. The cognitive skills of students,
measured by test scores, are thus used as a proxy for human capital. The study is based on the
growth model from Hanushek and Woessmann’s (2012, p. 271) study presented in equation 1
below in which g represent the growth rate of a country, GDP per capita. The independent
variable H denotes skills of workers, which is approximated by using test scores of students in
the particular country, and X signifies other aspects that have an impact on growth.
𝑔 = 𝛾𝐻 + 𝛽𝑋 + 𝜀 1)
Moreover, Hanushek and Woessmann (2012, p. 271) have decomposed the skills of workers,
namely human capital, into four different parts according to equation 2 below. The variable F
stands for educational inputs from the family, qS denotes the quantity and quality of
schooling, A represents individual ability and Z signifies other aspects such as health and
knowledge obtained in the labor market. Human capital is approximated by cognitive skills.
𝐻 = 𝜆𝐹 + 𝜙 𝑞𝑆 + 𝜂𝐴 + 𝛼𝑍 + 𝜈 2)

12
The strength of this model compared to using years of schooling as a proxy for human capital
is that it incorporates other parts than solely formal schooling. It takes into consideration the
quality of schooling, not only the quantity, and it also incorporates other sources for human
capital such as the family and the labor market. Performing a regression based on the growth
model (1) above shows that test scores have a considerably stronger positive effect on
economic growth than years of schooling. The average scores in all mathematics and science
tests completed during the time period 1964 to 2003 in 50 different countries were used in the
model. The result implies that test scores are a stronger proxy for human capital than years of
schooling, which indicates that not only the quantity of formal schooling affect human capital.
The quality of schooling, knowledge accumulated from other sources than school, individual
ability and health also have an impact on test scores and, by extension, on human capital.
According to the result, a one standard deviation improvement in test scores should on
average lead to a 2 % increase in annual GDP growth rate over 40 years (Hanushek and
Woessmann, 2012). Several other studies have found similar results; table 2 below presents a
summary of different studies in the same field of interest.
Table 2. Summary of research on test scores and economic growth Summary of research on test scores and economic growth Authors Year Human capital proxy Main results Lee and Lee 1995 International science Test scores have a higher association with economic
test scores growth than years of schooling or enrollment rates do. In addition, increased test scores reduce countries’ fertility rates.
Hanushek and 2000 International A stronger significant effect of students’ test scores, as an Kimko mathematics and approximation of labor skills, on growth than for years of
science test scores schooling. (Hanushek and Woessmann (2012) is based on this research, but the study has been extended).
Bosworth and 2003 International A high association between test scores, which represent Collins mathematics and quality in education, and GDP per capita. science test scores
Altinok 2007 International The study is similar to Hanushek and Kimko’s (2000) mathematics, research but includes a larger number of countries. reading and The quality of education, in terms of test scores, has a
science test scores significant positive effect on economic growth, unlike quantity of education.
Appleton, 2013 International Lagged test scores have a positive association with Atherton, and mathematics and subsequent economic growth, which emphasizes that not Bleaney science test scores only quantity of education but also quality has an impact on future growth.

13
Altogether, the research presented above emphasizes the role of cognitive skills in economic
growth, and highlights the significance of test scores as a measure of human capital. This
implies that increased test scores indicate higher levels of human capital, which enhance
economic growth. In other words, the development starts at a micro level with improved test
scores among students, and higher skills among workers, and unfolds itself in macroeconomic
growth. The main question is then how cognitive skills, and thus test scores, can be improved.
Moreover, if efforts to enhance cognitive skills should focus on individuals with high or low
test scores is an important question since it implies that policy on education may take two
different directions, to educate a few specialists or to educate the masses. Research shows that
both education initiatives result in increased economic growth, and interdependence can be
found between labor with basic skills and highly educated labor. Individuals with high
education are necessary to develop new innovations or to imitate other countries, while the
practical implementation of such changes are dependent on a labor force with at least basic
skills. To conclude, it is essential to improve test scores in order to achieve higher levels of
human capital and economic growth, and it is also important to focus on improvements
among all segments in society (Hanushek and Woessmann, 2012).
3.2. Definition of numeracy
The main focus in chapter 3.1 is on how human capital affects a country on the macro level,
through economic growth. However, the last paragraph of the chapter emphasizes that the
change in test scores, and human capital, takes place among individuals on the micro level.
The remaining chapters of the theory focus on the importance of human capital, and more
especially of numeracy, on the individual level. The term quantitative literacy, or
mathematical literacy, is an alternative name for numeracy (Hippe, 2012). Numeracy can be
interpreted according to the definition of mathematical literacy below, presented by OECD
PISA (2012, p. 25).
“Mathematical literacy is an individual’s capacity to formulate, employ, and interpret
mathematics in a variety of contexts. It includes reasoning mathematically and using
mathematical concepts, procedures, facts, and tools to describe, explain, and predict
phenomena. It assists individuals to recognise the role that mathematics plays in the
world and to make the well-founded judgments and decisions needed by constructive,
engaged and reflective citizens.”

14
The definition shows that school mathematics is a part of numeracy but that numeracy as a
concept is wider (OECD PISA, 2012).
3.3. The importance of numeracy
Developments in the education system and an emerging capitalist society have historically
enhanced numeracy skills as increased trade and entrepreneurship require the ability to
perform basic calculations concerning key indicators such as profits, losses and interest.
Several studies in Australia and the United Kingdom have found that higher numeracy skills
have a significant positive effect on wages, full-time employment and labor force
participation. Similar results were found in the United States, where higher numeracy skills
were associated with a higher probability of full-time employment (A’Hearn, Crayen, and
Baten, 2009). A study on 16-24 year olds in Canada found a strong positive association
among women between numeracy on the one hand, and employment and number of weeks
worked on the other. Basic numeracy skills had a significant positive effect on income, for
both men and women (Finnie and Meng, 2000). Moreover, the importance of basic arithmetic
obtained in school as a predictor of income in subsequent working life has grown over time.
The results were found by comparing the predictive power of numeracy in United States over
two decades, the 70s and 80s (Murnane, Willet, and Levy, 1995). Numeracy usually has a
stronger explanatory power than literacy rates when it comes to wages and employment
among those less educated and women (A’Hearn, Crayen, and Baten, 2009).
Christelis, Jappelli, and Padula (2007) and Lusardi and Mitchell (2007) have focused their
research on financial decisions, in both Europe and North America, to map the level of
numerical and financial literacy among the population. The importance of numeracy skills for
people’s ability to make sensible financial decisions has been the primary motivation for
research. Lusardi and Mitchell’s (2007) study on retirement saving plans among people over
the age of 50 in the United States involved a series of questions, which required participants
to perform calculations. The study found that participants with low numeracy skills and
financial literacy had poor retirement saving plans compared to those with high numeracy
skills. Poor numeracy was associated with low levels of savings and most of the existing
wealth was in housing, making the household vulnerable to housing bubbles and the overall
economy. Christelis, Jappelli, and Padula (2007) found similar results in a comparable study
carried out in 11 different European countries.

15
The importance of numeracy skills in business has resulted in research focused on numeracy
skills as a part of financial training. For a business to succeed, efficient financial decisions
have to be made, and low financial literacy can have a critical impact on the quality of such
decisions. Numeracy skills are an important part of financial management. In 2006-2008 a
project in the Dominican Republic focused on the effects of financial training on
microenterprises. Two groups of entrepreneurs received different types of training; one of the
groups was taught basic rules of thumb on financial decisions and the other one more
advanced financial accounting. There was no significant effect on the group receiving the
more advanced training. However, the ones who received more basic financial training
significantly improved their financial decision-making, which was illustrated by an increased
likelihood of both bookkeeping and doing revenue calculations. There was no difference on
average but sales did improve during bad periods, which suggests that higher financial
literacy improves the entrepreneur’s ability to deal with negative shocks, thus having a
positive impact on enterprises’ growth opportunities. The findings in this project indicate that
basic and simple financial training can have a large influence in the success of a business
(Drexler, Fischer, and Schoar, 2010). Positive impacts of financial training were also found in
a project conducted in Bosnia-Herzegovina, where young entrepreneurs participated in a
business-training program that covered subjects such as financial growth strategies and
accounting. The entrepreneurs who received training did improve their enterprises’ financial
situation by for example developing more efficient production processes, higher investment
rates and refinancing loans for better terms (Bruhn and Zia, 2011).
3.4. Illustration of the importance of numeracy
To illustrate the importance of enhanced numeracy skills, Africa and Asia serve as examples.
Youth unemployment is a severe problem in Africa; young adults have not yet accumulated
as much human capital as older adults, which makes the youth less attractive on the labor
market. The problem has escalated in South Africa; approximately half of the youth
population is unemployed. Unemployment in early age comes with high costs, many young
people fall deeper into poverty, and future employment opportunities diminish. The problem
is particularly present in urban areas where youth unemployment is six times higher than in
the countryside. Self-employment is one possible solution; street trading is becoming more
common among young people living in the cities and the more prosperous African countries
have a higher proportion of young business owners. Young women are especially vulnerable,

16
with 35 % of all women between 15 and 24 years old classified as NEETs (Not in
Employment, Education, or Training), while the rate for their male counterparts is 20 %. The
early years of adulthood are critical; in a Kenyan study female NEET rates increased with age
to a higher proportion than it did for males. Lack of qualifications and low levels of individual
human capital, is one of the main obstacles preventing women from entering the labor market.
In conjunction with gender segregation on the labor market resulting in a high proportion of
women in more informal employment, these gender differences make women more
vulnerable and at a higher risk of poverty (African Economic Outlook, 2012).
The average youth unemployment rate in South East Asia was 14.0 % in 2009 and the highest
rates were found in Indonesia, 22.2 %, and the Philippines, 17.4 %. The rates were high
already before the financial crisis in 2007-2008; in 2000 the rates were 19.9 % and 21.2 % in
Indonesia and the Philippines respectively. There is a significant gap between the genders in
the labor market in Asia and the Pacific; for every 100 male employees there are 65 female
employees. Economic empowerment is an important step to decrease gender inequalities. One
way to enter the labor market is through entrepreneurship. Discrimination in legal aspects and
access to credit are two obstacles for women to enter the labor force through self-
employment. Lack of human capital is another difficulty. Microloans have given the
opportunity for women to start their own businesses, but increased human capital is important
to be able to keep the business alive. Moreover, the overall employment on the South East
Asian labor market has experienced a large shift since the early 90s from the agricultural
sector to the rapidly growing service sector; such a shift requires accumulation of new kinds
of human capital (UN-ESCAP, 2011).
The African and Asian experience illustrates why basic numeracy skills are important. As
mentioned previously, higher numeracy skills have a positive association with full-time
employment, and it also enhances entrepreneurial skills. Higher numeracy skills could thus
ease the transition for young adults into the labor force, either into paid employment or self-
employment. It could also enhance economic independence and empowerment of women in
all ages.

17
3.4. Levels of numeracy around the globe
Extensive data can be found on literacy rates worldwide, while the data on numeracy is very
limited. Hippe (2012) demonstrates a high correlation between literacy and numeracy,
concluding that numeracy is as good as literacy as a proxy for human capital. These findings,
combined with that basic arithmetic is often included in the definition of literacy rates, result
in data on literacy being presented in this chapter as a substitute for numeracy (The World
Bank, 2012).
There are 793 million illiterate adults around the globe, out of which 518 million live in Asia
and the Pacific. This region is also the most populous area in the world, home to 61 % of the
total world population. 89 % of the illiterate adults in the region are concentrated mainly in
India, China, Pakistan, Bangladesh and Indonesia. The average literacy rate in South and
South-West Asia is 64 %, compared to the worldwide average of 84 %. Illiteracy is also a
question of gender, and 65 % out of the 518 million of illiterate adults are women. The
Philippines is one of the countries with highest gender equality in literacy rates, with almost
equal numbers of literate men and women (UN-ESCAP, 2011).
Literacy levels are usually lower in marginalized groups such as ethnic minorities or people
living in informal settlements. For example, 94 % of the ethnic majority population in
Vietnam is literate, while the corresponding number is 74 % for ethnic minorities. In
Bangladesh 76 % of the richer families are literate, while the percentage rate is 28 % among
the poorer families. A problem with statistics on literacy is that they often fail to incorporate
marginalized groups, which results in an overestimation of the literacy rate in the country
(UN-ESCAP, 2011). Indigenous people, used interchangeably with ethnic minorities, can be
defined as a group separated from the mainstream society with their own economic, cultural
and social establishments. In 2005-2009 the adult literacy rate in the Philippines was 95.4 %,
but estimations indicate that the number of indigenous people exceeds 12 million. Another
report from the National Statistics Office estimates the indigenous people to constitute 20 %
of the total population in the Philippines (Asian Development Bank, 2002).

18
4. Method
4.1. Specifics of the project
To evaluate whether access to a calculator improves numeracy skills among high school
students, I conducted a field study in Palawan during a time period of seven weeks. The
project was set up as a randomized controlled trial with two unmatched groups, a control
group and a treatment group. The purpose of the randomized design was to eliminate any
systematic differences between the two groups; any differences between them should be
solely random. At the initial stage, the students were given a survey on socioeconomic
factors, access to school material and educational habits. The survey that was used is found in
Appendix 1. As an example the students were asked questions about the living arrangements
and occupation of people in the same household, number of siblings and access to different
household accessories such as radio and TV. Other questions concerned how many textbooks
the student owned, how often the student stayed at home from school to assist with chores in
the household and how many hours per day were spent on chores at home. The purpose of the
baseline survey was to compare the control and treatment group to assess if there was any
statistically significant difference between the two groups. The aim was to assure that the
randomization had been successful.
In addition to the survey, the students took a mathematics test based on mental arithmetic at
the initial stage in order to map their numeracy skills prior to treatment. The mathematics test
was marked with a letter, indicating if the student belonged to the control or treatment group.
The papers had been mixed before the test was handed out, resulting in the students being
randomly assigned either a reflex or a solar powered calculator, which they received when
handing in the test. The reflexes did not have a specific role in the project; the purpose of
handing them out to the control group was for equal treatment of the students. After grading
the mathematics test, it was decided to add another test with an extra five, more difficult,
calculations two days later. After the survey, the first mathematics test and the additional five
calculation problems had been made, the students were left to use their calculator or reflex as
they desired. Seven weeks later the students took a second, and final, mathematics test. Some
calculations used in the baseline test were dropped since they were too basic, and the low
variation would have created a problem in the final analysis. Apart from the calculations that
were dropped, the same calculations were used as in the initial baseline test, and it was once

19
again based on mental arithmetic. Students were thus not allowed to use the calculators during
the mathematics tests. After the exclusion of the too basic calculation problems in the baseline
test, the maximum total test score on both tests was 12 points. The duration of the final test
was the same as for the baseline test. Mathematics is part of the normal curriculum, as it was
during the seven weeks of the project. However, setting up control and treatment groups
solves the problem of improved numeracy skills due to lectures in mathematics.
The Philippine Red Cross, the Palawan chapter, assisted in finding two suitable high schools.
The two schools where the project was initiated are located in a rural setting in the
municipality of Roxas, Palawan. To mitigate the risk of theft or students selling their
calculator, a rural setting was preferred over an urban setting. Francisco Lagan Senior
Memorial High School, FLSMHS, is situated along the ocean in the barangay of Caramay,
approximately 100 kilometers north of Puerto Princesa. Tagumpay National High School,
TNHS, belongs to the barangay of Tagumpay, which is located a little bit more inland and
further north of Caramay. For administrative purposes the municipalities in the Philippines
are the second smallest division, while barangays are the smallest and could be a village
(Dolan, 1991). The local language in both barangays is Cuyonon, which is used
interchangeably with the official languages of instruction, English and Filipino, during
lectures.
Table 3. Number of students in the project and the total number of enrollees.
Treatment Control Students in project Enrolled in 7th grade/2nd year Number of students FLSMHS 42 35 77 126 TNHS 27 24 51 104
TNHS has fewer enrollees, and is slightly smaller than FLSMHS. Since the high schools have
a large catchment area, many students live in other surrounding barangays and walk a long
distance to school every day. The project includes the 7th grade and 2nd year high school in
both schools. Table 3 shows the number of students participating in the project and the total
number of students enrolled in 7th grade and 2nd year in both schools. High absenteeism is
the reason why there is a large number of enrolled students who are not a part of the project.
Absenteeism was unusually high in TNHS on the day of the baseline test due to a local
festival taking place in the barangay the evening before.

20
4.2. Difference-‐in-‐differences estimation
The difference-in-differences model is applied to evaluate if access to a calculator improves
numeracy skills. Difference-in-differences estimation is based on the concept of a comparison
of two groups across two time periods, pre-treatment and post-treatment, in order to estimate
the treatment effect. It is important to note that the comparison is based on the average of the
groups (Imbens and Wooldridge, 2008, p. 64-65). In the current project, the model will imply
taking the difference in the average baseline test score between the control and treatment
groups, and comparing it to the difference in the average test scores at the end of the project.
Table 4 provides an example to illustrate the concept of difference-in-differences by using
data from TNHS. The difference-in-differences estimate of 0.982 found by using this method
almost equals the difference-in-differences estimate given by OLS regression, which is
presented in chapter 5.2. The difference between the two estimates, 0.001, is due to the
rounding error of decimals in table 4.
Table 4. An illustration of difference-in-differences estimation
Average test scores Post-treatment Pre-treatment Difference (post-pre) Treatment group 8.259 6.444 1.815 Control group 7.708 6.875 0.833 Difference-in-differences estimation 0.982 Notes: The difference between the average test score by the end of the project (8.259) and the average test score at the baseline (6.444) equals the first difference for the treatment group (1.815). The same calculation has been made to find the first difference for the control group (0.833). The difference-in-differences estimate (0.982) is obtained by subtracting the first difference for the control group (0.833) from the first difference for the treatment group (1.815).
Calculation problems with a rate of correct answers of 90 % or higher at baseline in both the
control and treatment groups simultaneously have been excluded from the difference-in-
differences estimations. The reason for excluding problems on which many students
performed well was that a high initial test score provides limited room for further
improvements.
The main assumption in difference-in-differences estimation is the common trend
assumption; the meaning of this is that omitted variables are considered to be constant over
time. The implication of the common trend assumption is that potential differences in average
test scores between the two groups at the baseline are assumed to reflect a selection effect. By
the end of the project, the difference in test scores will reflect the selection effect and the

21
treatment effect. If the selection effect is constant, which the model assumes, the difference in
average test score between the two time periods will eliminate the selection effect, and
represent the treatment effect. The shorter the time period evaluated by difference-in-
differences estimation, the more likely it is that the common trend assumption will hold.
Comparisons of data over several time periods can be made to test the assumption of a
common trend. However, in many studies such data is not available, which is the case in the
current project. A discussion on the assumption is therefore necessary. (Angrist and Pischke,
2008, p. 185-190).
The baseline survey covered a large range of variables and the significance analysis showed
that the control and treatment groups were similar for most of the variables. Still, it is possible
that there is some unobserved variables for which the two groups are different. Nevertheless,
if the controlled variables and the omitted variable bias stay constant during the time period,
the common trend assumption is satisfied. The time scale of the project was seven weeks. It is
possible that some student-specific shocks occurred during this time, but it can be assumed
that the number of disruptive changes was relatively low during such a short time period.
Moreover, the project took place in a rural setting where many households have similar living
arrangements and livelihoods. If drastic changes were to happen, it is likely that they would
affect both groups. One example could be if heavy rainfall was to destroy the harvest it would
affect households in both control and treatment group, which means that the common trend
assumptions would still be valid. In this project it is therefore assumed that the common trend
assumption is satisfied due to the short time period and the rural setting in which the project
took place.
4.3. Limitations of the project
Some limitations of the project are necessary to mention. The sample size is relatively small
in the difference-in-differences estimation, when the control and treatment groups are
compared in both schools. In the regressions performed in chapter 5.3, all students
participating in the project have been merged together, which increases the sample size and
makes the results more reliable. Moreover, the seven-week time frame of the project might be
too short for any differences in improvements of test scores to be found. It is also worthwhile
mentioning that a noisy classroom environment and a short distance between the student’s
school desks might result in biased test scores.

22
The theoretical framework presented in chapter 3 focuses on the broad concept of numeracy
as defined in chapter 3.2. The field study was more limited, and focused on the area that
numeracy and traditional classroom mathematics have in common: arithmetic. The figure
retrieved from National Numeracy (n.d.) illustrates the role of arithmetic as in between
numeracy and mathematics. Basic mental arithmetic including addition, subtraction, division
and multiplication was used in the mathematics tests in the study. Due to language
differences, testing the wider concept of numeracy would have been problematic.
Figure 1. Numeracy vs. mathematics (Figure retrieved from National Numeracy, n.d.)

23
5. Results
5.1. Significance analysis at baseline
The results of the baseline survey concerning socioeconomic factors, access to school
material and educational habits are presented in appendices 2 and 3. The tables show mean
and standard deviations for the different variables, and the p-value reflects the result from the
significance analysis. The null hypothesis states that there is no difference in mean, or
median, between the two groups while the alternative hypothesis suggests the opposite. A chi-
square test was used for all qualitative variables. Quantitative variables that satisfied the
assumptions of a normal distribution and equal variance in both groups were tested with a
Student’s t-test (Montgomery, 2012, p. 30-43). A Jarque-Bera test was used to test if the
variable was normally distributed. Variables that had a normal distribution were examined
with a F-test to establish if the variance was similar in control and treatment group. Four
variables did not fulfill the assumptions; the age variable in FLSMHS, number of siblings
living at home in TNHS and number of siblings living at home and working in both TNHS
and FLSMHS. The mentioned variables were tested with the non-parametric Wilcoxon rank
sum test/Mann-Whitney’s test instead of a Student’s t-test. A few statistically significant
differences between control and treatment groups were found. In FLSMHS, 26 % of the
students in the treatment group, compared to 3 % in the control group, stated that their
household owns other kinds of livestock than the ones listed in the table. The difference was
statistically significant at the 1 % level. Another significant difference, at the 5 % level, was
that 7 % of the students in the treatment group in TNHS own more than eight textbooks,
compared to 38 % in the control group. However, overall, the two groups are similar in both
schools, and the significance analysis shows that the randomization was successful.
Tables 5 and 6 show the result of the mathematics test at baseline, before students in the
treatment group received calculators. The result was similar in the control and treatment
groups in both schools, with the exception of one calculation problem (523 / 2 = 261.5) in
TNHS for which there was a statistically significant difference between the two groups at the
5 % level. 33 % of the students in the control group answered the question correctly while the
corresponding number was 7 % in the treatment group. It is also noteworthy that many
students already had a high test score on several of the calculation problems in the first
mathematics test.

24
Table 5. Mathematics test scores at baseline (FLSMHS) Francisco Lagan Senior Memorial High School Treatment group Control group Mean (s.d.) Mean (s.d.) p-value 7 x 6 = 42 0.81 (0.40) 0.71 (0.46) 0.91 11 x 5 = 55 0.90 (0.30) 0.86 (0.36) 0.91 117 + 24 + 36 = 177 0.90 (0.30) 0.94 (0.24) 0.91 140 / 7 = 20 0.74 (0.45) 0.80 (0.41) 0.91 18 x 12 = 216 0.67 (0.48) 0.77 (0.43) 0.91 220 x 7 = 1540 0.83 (0.38) 0.86 (0.35) 0.91 813 – 125 - 216 = 472 0.60 (0.50) 0.66 (0.48) 0.91 1034 + 767 – 933 = 868 0.86 (0.35) 0.89 (0.32) 0.91 237 x 23 = 5451 0.89 (0.33) 0.91 (0.28) 0.91 523 / 2 = 261.5 0.74 (0.45) 0.66 (0.48) 0.91 2112 – 675 + 389 = 1826 0.79 (0.46) 0.79 (0.42) 0.91 324 x 16 = 5184 0.86 (0.35) 0.74 (0.44) 0.91 Notes: *** Significantly different from zero at 1 % ** Significantly different from zero at 5 % * Significantly different from zero at 10% Table 6. Mathematics test scores at baseline (TNHS) Tagumpay National High School Treatment group Control group Mean (s.d.) Mean (s.d.) p-value 7 x 6 = 42 0.96 (0.19) 0.96 (0.20) 0.89 11 x 5 = 55 0.93 (0.27) 0.92 (0.28) 0.89 117 + 24 + 36 = 177 0.85 (0.36) 0.79 (0.41) 0.89 140 / 7 = 20 0.89 (0.32) 0.96 (0.20) 0.89 18 x 12 = 216 0.85 (0.36) 0.83 (0.38) 0.89 220 x 7 = 1540 0.93 (0.27) 0.96 (0.20) 0.89 813 – 125 - 216 = 472 0.67 (0.48) 0.67 (0.48) 0.89 1034 + 767 – 933 = 868 0.67 (0.48) 0.71 (0.46) 0.89 237 x 23 = 5451 0.93 (0.27) 0.88 (0.34) 0.89 523 / 2 = 261.5 0.07 (0.27) 0.33 (0.48) 0.05** 2112 – 675 + 389 = 1826 0.67 (0.48) 0.79 (0.41) 0.89 324 x 16 = 5184 0.85 (0.36) 0.92 (0.28) 0.89 Notes: *** Significantly different from zero at 1 % ** Significantly different from zero at 5 % * Significantly different from zero at 10%

25
5.2. Difference-‐in-‐differences estimation
5.2.1. Regression model
To perform the difference-in-differences estimation an OLS regression has been used:
𝑦!" = 𝛽! + 𝛽!𝐺! + 𝛽!𝑇! + 𝛽!𝐺!𝑇! + 𝜀!"
The dependent variable Y represents the test scores. Index i refers to the individual student
and t to time. The variables G and T are dummy variables, G refers to which group the
student belongs to; 0 denotes control group and 1 treatment group. T indicates the time
period; 0 denotes pre-project and 1 post-project time period. The treatment effect is estimated
by the coefficient β3, thus representing the difference-in-differences estimate. The performed
difference-in-differences estimations have all been tested for the OLS regression assumptions;
any corrections made are presented in the notes under the tables displaying the results.
Calculation problems with a rate of correct answers of 90 % or higher at baseline in both the
control and treatment groups simultaneously have been excluded from the difference-in-
differences estimations and the graphs. In FLSMHS, one calculation problem has been
excluded (117 + 24 + 36 = 177), resulting in a maximum test score of 11 points. The
following three problems have been excluded in TNHS: 7 x 6 = 42, 11 x 5 = 55 and 220 x 7 =
1540. The maximum test score in TNHS is thus 9 points.
5.2.2. Difference-‐in-‐differences estimation on total test score
The dependent variable Y in this difference-in-differences estimation represents the total test
score. Table 7 below shows the difference-in-differences estimation for both schools. The
high p-value for FLSMHS implies that no significant difference in change in test scores can
be found. However, with a p-value of 0.091, the difference-in-differences estimate in TNHS
is statistically significant at the 10 % level. The value of the coefficient (0.981) indicates that
the treatment group increased its test score by approximately one point more than the control
group over the project’s time period.

26
Table 7. Difference-in-differences estimation on total test scores in FLSMHS and TNHS Difference-in-differences estimate total score School Dependent variable Difference-in-differences estimate p-value (s.d.) FLSMHS Total test scores 1) 0.100 0.860 (0.564) TNHS Total test scores 2) 0.981 0.091* (0.576) Notes: *** Significantly different from zero at 1 % ** Significantly different from zero at 5 % * Significantly different from zero at 10% 1) Regression corrected for autocorrelation with Newey-West standard errors. 2) Regression corrected for homoscedasticity with White’s heteroscedasticity-consistent standard errors
The following graphs illustrate the actual change in average total test score for control and
treatment during the time period. In FLSMHS the treatment group scored higher than the
control group on both tests. The average test score decreased over time in both control and
treatment groups, and the change followed the same pattern in both groups. In TNHS, the
treatment group had a lower average test score than the control group on the baseline test, and
at the final test the results were the opposite. The average test score increased in both groups,
but the treatment group had a slightly larger improvement in average test scores than the
control group.
Figure 2. Change in average total test score over time (FLSMHS)
Notes: Time period 1 = pre-treatment, 2 = post-treatment Maximum total test score: 11 points
0 1 2 3 4 5 6 7 8 9 10
1 2
Aver
age
tota
l tes
t sco
re
Time period
Change in average total test score over time (FLSMHS)
Treatment
Control
27
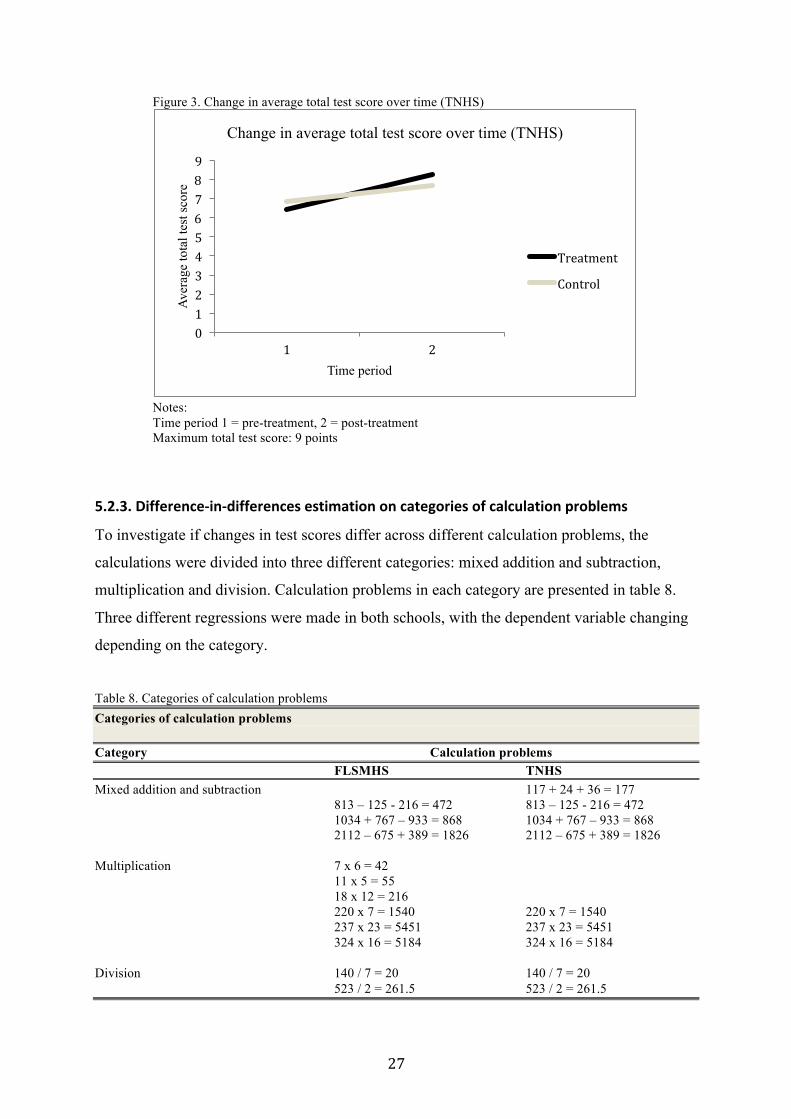
Figure 3. Change in average total test score over time (TNHS)
Notes: Time period 1 = pre-treatment, 2 = post-treatment Maximum total test score: 9 points
5.2.3. Difference-‐in-‐differences estimation on categories of calculation problems
To investigate if changes in test scores differ across different calculation problems, the
calculations were divided into three different categories: mixed addition and subtraction,
multiplication and division. Calculation problems in each category are presented in table 8.
Three different regressions were made in both schools, with the dependent variable changing
depending on the category.
Table 8. Categories of calculation problems Categories of calculation problems Category Calculation problems FLSMHS TNHS Mixed addition and subtraction 117 + 24 + 36 = 177 813 – 125 - 216 = 472 813 – 125 - 216 = 472 1034 + 767 – 933 = 868 1034 + 767 – 933 = 868 2112 – 675 + 389 = 1826 2112 – 675 + 389 = 1826 Multiplication 7 x 6 = 42 11 x 5 = 55 18 x 12 = 216 220 x 7 = 1540 220 x 7 = 1540 237 x 23 = 5451 237 x 23 = 5451 324 x 16 = 5184 324 x 16 = 5184 Division 140 / 7 = 20 140 / 7 = 20 523 / 2 = 261.5 523 / 2 = 261.5
0 1 2 3 4 5 6 7 8 9
1 2
Aver
age
tota
l tes
t sco
re
Time period
Change in average total test score over time (TNHS)
Treatment
Control

28
Table 9 presents the results of the regressions made on test scores in FLSMHS, while the
result for TNHS is displayed in table 10. None of the difference-in-differences estimates in
FLSMHS are statistically significant. The p-value (0.128) for the division category in TNHS
is almost significant at the 10 % level, which would suggest that the treatment group
increased its test score on calculation problems based on division by approximately 0.3 points
more than the control group.
Table 9. Difference-in-differences estimation on categories of calculation problems (FLSMHS) Francisco Lagan Senior Memorial High School difference-in-differences estimate categories Dependent variable Difference-in-differences estimate p-value (s.d.) Test scores mixed addition and subtraction 1) 0.095 0.713 (0.258) Test scores multiplication 1) 0.067 0.850 (0.352) Test scores division 1) - 0.157 0.334 (0.162) Notes: *** Significantly different from zero at 1 % ** Significantly different from zero at 5 % * Significantly different from zero at 10% 1) Regressions corrected for autocorrelation with Newey-West standard errors. Table 10. Difference-in-differences estimation on categories of calculation problems (TNHS) Tagumpay National High School difference-in-differences estimate categories Dependent variable Difference-in-differences estimate p-value (s.d.) Test scores mixed addition and subtraction 0.468 0.198 (0.360) Test scores multiplication 0.208 0.340 (0.217) Test scores division 0.306 0.128 (0.199) Notes: *** Significantly different from zero at 1 % ** Significantly different from zero at 5 % * Significantly different from zero at 10%

29
5.3. Regressions based on test scores and baseline characteristics
5.3.1. Regression models
In addition to the difference-in-differences estimations, regressions were performed to
investigate if different socioeconomic factors affect the test score at baseline, and the change
in test score over time. All calculation problems have been included, and the total test score is
therefore 12 points on both tests. The regressions investigate which students who benefit the
most from having access to a calculator, in other words, which students who improve their
numeracy the most. In the regressions all students participating in the project in both schools
were merged together, thus the division into control and treatment groups does not apply to
the regressions in this chapter. The regressions performed are presented below and the result
is displayed in table 11 and 12 in chapter 5.3.2. In models 1) to 8), two different regressions
are made. The dependent variable, Y, is the test score at baseline in the first regression and the
difference in test scores (post-treatment – pre-treatment) in the second.
1) 𝑦! = 𝛽! + 𝛽!𝐺𝐸𝑁𝐷𝐸𝑅! + 𝜖!
2) 𝑦! = 𝛽! + 𝛽!𝑆𝐼𝐵𝐿𝐼𝑁𝐺𝑆! + 𝜖!
3) 𝑦! = 𝛽! + 𝛽!𝐶𝐸𝐿𝐿! + 𝜖!
4) 𝑦! = 𝛽! + 𝛽!𝑇𝐼𝑀𝐸! + 𝜖!
5) 𝑦! = 𝛽! + 𝛽!𝐿𝐼𝑉𝐸_1! + 𝛽!𝐿𝐼𝑉𝐸_2! + 𝜖!
6) 𝑦! = 𝛽! + 𝛽!𝐵𝑂𝑂𝐾_1! + 𝛽!𝐵𝑂𝑂𝐾_2! + 𝜖!
7) 𝑦! = 𝛽! + 𝛽!𝐻𝑂𝑀𝐸! + 𝜖!
8) 𝑦! = 𝛽! + 𝛽!𝐶𝐻𝑂𝑅𝐸𝑆! + 𝜖!
The variable GENDER is coded as a dummy variable where 1 is boy and 0 is girl. SIBLINGS
represents the number of siblings living in the student’s household. The dummy variable

30
CELL is 1 if the student owns a cell phone, otherwise it is 0. TIME takes the value 1 if it
takes the student more than 30 minutes to get to school, and 0 if it takes less than 30 minutes.
The dummy variable LIVE_1 indicates if the student lives with one of the parents, while
LIVE_2 means that the student lives with neither parent. The student lives with both parents
when the variables are zero, and living with both parents is thus the reference category.
BOOK_1 and BOOK_2 are dummy variables denoting the number of schoolbooks the student
owns; they represent categories of between zero and three, or four and seven schoolbooks.
The variables are in relation to the reference category; if the student owns eight or more
schoolbooks. The dummy variable HOME indicates if the student stays at home two days, or
more, per month to assist with household chores. The effect of HOME on the result is in
comparison with the alternative; if the student never, or once per month, stays at home from
school. CHORES is a dummy variable that signifies if the students spend three or more hours
per day doing chores at home. The effect on the test score is relative to the alternative of
spending less than three hours per day on chores.
It can be seen in appendices 1 and 2 that there are fewer categories of response options in
regression 4) to 8) than in the baseline survey. The explanation for this is that some response
options have been merged together in the regressions in order to limit the loss of degrees of
freedom. The performed difference-in-differences estimations have all been tested for the
different OLS regression assumptions; any corrections made are presented in the notes under
the tables with the results.
5.3.2. Regression results
The results of the regressions are presented in tables 11 and 12 on the following pages. The
dependent variable in table 11 is test scores at baseline. Students who live with neither parent
have approximately two points (- 2.05) lower test scores at baseline compared to students who
live with both parents. The negative effect of such differing living arrangements is
statistically significant at the 5 % level. There is a statistically significant negative effect of
owning fewer schoolbooks at the 10 % level. Students who owns zero to three schoolbooks
have a 0.84 points lower score at the baseline test than students who owns eight or more
books.

31
Table 11. Regressions results with test score at baseline as dependent variable Regression results Dependent variable: Test score at baseline Independent variable Coefficient (s.d.) p-value Gender - 0.46 (0.42) 0.28 Number of siblings living at home - 0.08 (0.14) 0.56 Ownership of cell phone 0.39 (0.43) 0.37 Time to get to school More than 30 minutes 0.05 (0.50) 0.93 Living arrangements Live with one parent - 0.18 (0.72) 0.80 Live with neither parent - 2.05 (0.91) 0.03** Number of schoolbooks student owns
0-3 - 0.84 (0.49) 0.09* 4-7 - 0.74 (0.53) 0.16
How often student stays at home from school to assist with household chores Two days or more per month 0.65 (0.42) 0.13 Hours per days doing chores at home
3 or more - 0.09 (0.41) 0.82 Notes: *** Significantly different from zero at 1 % ** Significantly different from zero at 5 % * Significantly different from zero at 10%
Difference in test scores is the dependent variable in the regressions in table 12. A statistically
significant negative effect of number of siblings on the difference in test scores is found at the
10 % level. One additional sibling results in a 0.3 points lower change in test scores over
time. The coefficient for if the student lives with one parent is almost significant at the 10 %
level. The value of the coefficient implies that the change in test score over time would be
1.14 points lower for students living with one parent compared to students living with both
parents. The change in test score over time is almost one point (- 0.98) lower among students
who stay at home two days or more per month in comparison with students who never, or one
day per month, stay at home. This effect is significant at the 5 % level.

32
Table 12. Regression results with difference in test scores as dependent variable Regression results Dependent variable: Difference in test scores (post-treatment – pre-treatment) Independent variable Coefficient (s.d.) p-value Gender 1) 0.11 (0.46) 0.82 Number of siblings living at home 1) - 0.30 (0.17) 0.07* Ownership of cell phone 1) - 0.18 (0.46) 0.69 Time to get to school 1) More than 30 minutes - 0.02 (0.48) 0.97 Living arrangements Live with one parent - 1.14 (0.72) 0.11 Live with neither parent 0.45 (0.82) 0.58 Number of schoolbooks student owns 1)
0-3 0.54 (0.42) 0.20 4-7 0.66 (0.66) 0.32
How often student stays at home from 1) school to assist with household chores Two days or more per month - 0.98 (0.44) 0.03** Hours per days doing chores at home 1)
3 or more - 0.62 (0.44) 0.17 Notes: *** Significantly different from zero at 1 % ** Significantly different from zero at 5 % * Significantly different from zero at 10% 1) Regressions corrected for autocorrelation with Newey-West standard errors.

33
6. Discussion
The two graphs of changes in average total test score over time in chapter 5.2.2 illustrate that
the initial test score at baseline was relatively high in both schools. As mentioned previously,
the adult literacy rate, which includes basic arithmetic, is quite high in the Philippines.
However, statistics on literacy often fail to incorporate indigenous people, resulting in an
overestimation of the literacy rate (UN-ESCAP, 2011). The number of indigenous people is
estimated to exceed 12 million in the Philippines (Asian Development Bank, 2002).
Education statistics on children between 12-15 years old in rural Palawan (table 1) show that
less than half of the children are enrolled in high school. One possible explanation is that
children of indigenous people living in the inland rainforest are not enrolled in school.
Another explanation for the low enrollment rates could be long distances to school, in
combination with poor infrastructure and a lack of vehicles. In addition to this, the alternative
cost of children’s schooling might be too high in less fortunate families. Time spent in school
implies less time spent on household chores, and fewer hours spent on working to bring
income to the family.
Furthermore, there is a large difference between enrollment and number of students
participating in the project, due to high absenteeism. In FLSMHS, 77 students participated,
out of 126 enrollees. The corresponding numbers in TNHS were 51 participants and 104
enrollees. High absenteeism is usually due to reasons similar to those for low enrollment
rates: long distances and high alternative costs. Taken together, low enrollment rates and high
absenteeism result in test scores not reflecting an accurate picture of children’s numeracy
skills in rural Palawan. The average total test scores is thus based on those children who have
low school absenteeism, and who are likely to already spend more time on school work than
those students not participating in the project.
The high initial test scores provide little room for extensive improvements in test scores. As
mentioned previously, a direct improvement would be if the use of the calculator itself
resulted in higher numeracy. On the other hand, an indirect improvement would be if access
to a calculator makes the student more enthusiastic about mathematics overall, resulting in
more time spent on studying mathematics and thus improving numeracy skills. If the students
participating in the project already spend a large amount of time on schoolwork, it would
result in a lower possible increase in study hours than for less active students. If this is the

34
case, the exclusion of students with high absenteeism means that the difference-in-differences
estimation would be biased downwards. The consequence of the bias would be that the true
potential of having access to a calculator would be underestimated. To allow for
improvements in test scores, some calculation problems in which the rate of correct answers
at baseline was high were excluded from the estimations. Nevertheless, the possibility of an
underestimation is still an important factor to consider since the project did not reach children
who are not enrolled in high school or have high absenteeism.
The result of the difference-in-differences estimation on total test score was not statistically
significant in FLSMHS. In fact, the average total test score decreased over time. The
explanation for this is that the classroom environment in the second mathematics test was
considerably noisier than in the baseline test, which resulted in less time for the students to
fully focus on the calculations. In addition to this, some students were late for the second test,
but still handed it in at the same time as their classmates. In TNHS, the difference-in-
differences estimate was significant at a 10 % level, and the treatment group increased its test
score by approximately one point more than the control group over the project’s time period.
This result indicates that the calculator did have a positive effect on test scores among
students in the treatment group.
When the calculation problems were divided into different categories, none of the difference-
in-differences estimates were significant. However, in TNHS the category with division was
almost statistically significant. The category contained two calculation problems, and one of
them required knowledge of decimals. The result implies that the highest positive impact of a
calculator is found on the performance in mental arithmetic in which division and decimal
numbers are used. Access to a calculator provides students with the opportunity to experiment
with different calculations on the calculator, which may increase students’ understanding of
division and decimals. If the calculator evokes enthusiasm about mathematics, students may
spend more time on complicated calculation problems, which facilitates increased knowledge
of division and decimals. Moreover, improved performance in more complicated problems
with division and decimals suggests that students who already have some basic knowledge in
mathematics might benefit the most from access to a calculator.
As mentioned previously, the regressions in chapter 5.3 were performed to examine if
different socioeconomic factors affect test scores at baseline, but also the change in test score

35
over time. The regressions in which test scores at baseline is the dependent variable show
what factors that negatively affect the numeracy skills among students. In relation to the fact
that the maximum test score is 12 points, a two points lower score in the baseline test among
students living with neither parent compared to those living with both parents is a rather large
drop in test scores. Possible explanations might be that students who live with neither parent
might have a larger responsibility for household chores, and hence less time to focus on
mathematic studies. Moreover, parents may regard education of their children as an
investment for future security since the Philippine society has a high emphasis on the family,
which includes taking care of the elderly in the family. If the student does not live with his
parents, such expectations of future security might not be present in the student’s household
and studying time might be less prioritized. That ownership of fewer schoolbooks negatively
affects the test score at baseline is not surprising. Lower access to such important school
supplies as schoolbooks reduces the possibility for students to study mathematics at home.
The regressions with the change in test score over time as the dependent variable show which
students who benefit the most from having access to a calculator. As the number of siblings
living at home increases, the change over time is reduced by 0.3 points. It is reasonable to
assume that a higher number of siblings result in less time spent on studying mathematics and
using the calculator, which leads to a lower change in test score. The coefficient for students
living with one parent was almost significant. Students living with one parent might have less
time over to use the calculator for schoolwork than students living with both parents; a reason
for this might be that they have to spend more time on helping the single parent at home.
Finally, students who stay at home more often to assist with household chores had a lower
change in test scores than other students. Students who have high absenteeism miss out on
some of the mathematics education; if they are lacking basic knowledge in mathematics, a
calculator might be less useful. Moreover, enthusiasm about school overall and especially
mathematics, might be lower among students with high absenteeism if they fall behind in the
education. Finally, one explanation for high absenteeism could be that the student has to stay
at home to work, assist with chores and to keep the family economy running. If this is the
case, the student might have less time to spend on studying mathematics and using the
calculator, than more fortunate students.

36
7. Conclusion
The significant difference-in-differences estimate in TNHS shows that access to a calculator
does have a positive effect on numeracy. Moreover, the greatest improvements are made on
more complicated problems based on division and decimals. This result implies that students
who already have some basic knowledge in mathematics can use the calculator to extend their
comprehension to more challenging problems. The implication of this result is that students
who actively take part in the mathematical education in school benefit the most from having
access to a calculator.
There are also other essential areas that need to be addressed in order to improve numeracy
overall. A critical issue is that many children are not enrolled in school at all, and absenteeism
among enrollees is high. The students who benefit the greatest from having access to a
calculator are those who live with both parents, have a low number of siblings, and spend a
significant amount of time in school. Hanushek and Woessmann (2012) discussed whether
focus should be directed at low or high performers, concluding that both segments are
mutually important. The same conclusion is applicable in this field study. To increase
numeracy overall, efforts need to be focused on the students with lower performance in the
initial test. In order to benefit from having access to a calculator, basic knowledge in
mathematics is necessary. To increase numeracy among low achievers, higher enrollment
rates and decreased absenteeism are critical. Among those students who did well in the
baseline test, a calculator encourages the students to extend the knowledge in mathematics
that they already possess, resulting in improved numeracy. Thus, efforts need to be focused
on both low and high performers in order to increase numeracy overall.
To further evaluate the improvements a calculator could contribute to, additional research on
the area is needed. In addition, the design of the research needs to cover a longer time-period.
The current project lasted for seven weeks, but a more extensive time frame would give the
students more time to use the calculators and yield larger improvements in numeracy. It is
also important to reach all students, and not only those with already low absenteeism, to avoid
underestimated difference-in-differences estimates. More extensive research on additional
ways to improve numeracy through the education system, such as different kinds of
schoolbooks or extended educational training for the teachers, is also of interest.

37
8. Bibliography
African Economic Outlook (2012), African Economic Outlook 2012: Promoting Youth
Employment, OECD publishing
A’Hearn, B., Crayen, D., and Baten, J. (2009), “Quantifying Quantitative Literacy: Age
Heaping and the History of Human Capital” in The Journal of Economic History, vol.
69, is. 3, p. 783-808
Altinok, N. (2007), “Human Capital Quality and Economic Growth” working paper, IREDU,
Institut de Recherche sur l’Education – Sociologie et Economie de l’Education
Angrist, J.D. and Pischke, J-S. (2008), Mostly Harmless Econometrics: An Empiricist’s
Companion, Princeton University Press, Princeton
Appleton, S., Atherton, P., and Bleaney, M. (2013) “International School Test Scores and
Economic Growth” in Bulletin of Economic Research, vol. 65, is. 1, p. 82-90
Asian Development Bank (2002), Indigenous Peoples/Ethnic Minorities and Poverty
Reduction, Asian Development Bank, Manila
Belvez, P.M. (n.d.) “Development of Filipino, the National Language of the Philippines”,
National Commission for Culture and the Arts, www.ncca.gov.ph, search word:
Belvez
Bosworth, B.P. and Collins, S.M. (2003) “The Empirics of Growth: An Update” in Brookings
Papers on Economic Activity, vol. 34, is. 2, p. 113-179
Bruhn, M. and Zia, B. (2011) “Stimulating Managerial Capital in Emerging Markets – the
Impacts of Business and Financial Literacy for Young Entrepreneurs”, Working paper
5642, The World Bank, Development Research Group
Calmfors, L. and Persson, M. (1999), Tillväxt och ekonomisk politik, Studentlitteratur, Lund
Christelis, D., Jappelli, T. and Padula, M. (2007), “Cognitive Abilities and Portfolio Choice”
in European Economic Review, vol. 54, is. 1, p. 18-38
De Justo, H.G.A., Digal, E.J.O., and Lagura, G. (2012), “An Analysis of the Policy: K-12
Education Program”, www.academia.edu, search word: the article name
DepED MIMAROPA Region IV-B, (n.d.) “Statistics for Annual Report 2011-2012” and
“Performance Indicators – secondary 2008”, www.depedmimaropa.ph, found under
subdivision “Facts & Figures”, date accessed 2013-03-17
Dolan, R.E. (1991), “The early Spanish period”, “Outbreak of war, 1898“, “World War II”,
“Independence” and “Rural social patterns” in Philippines: A Country Study, GPO for
the Library of Congress, Washington

38
Drexler, A., Fischer, G., and Schoar, A. (2010) “Keeping it Simple: Financial Literacy and
Rules of Thumb”, presented at CEPR Development Economics Workshop, 8-9
October 2010, Barcelona
Finnie, R., and Meng, R. (2000) “Cognitive skills and the youth labour market” in Applied
Economic Letters, vol. 8, is. 10, p. 675-679
Hanushek, E.A. and Kimko, D.D. (2000), “Schooling, Labor-Force Quality and the Growth of
Nations” in American Economic Review, vol. 90, is. 5, p. 1184-1208
Hanushek, E.A. and Woessmann, L. (2012), “Do better schools lead to more growth?
Cognitive skills, economic outcomes, and causation” in Journal of Economic Growth,
vol. 17, is. 4, p. 267-321
Hippe, R. (2012), “How to measure human capital? The relationship between numeracy and
literacy” in Economies et Societes, vol. 46, is. 8, p. 1627-1654.
Imbens, G.M. and Wooldridge, J.M. (2008), “Recent Developments in The Econometrics of
Program Evaluation”, working paper 14251, NBER, Cambridge
Jones, C.I. (2002), Introduction to Economic Growth, 2nd edition, WW Norton & Company,
New York
Lee, D.W. and Lee, T.H. (1995), “Human Capital and Economic Growth: Tests Based on the
International Evaluation of Educational Achievement” in Economics Letters, vol. 47,
is. 2, p. 219-225
Lusardi, A. and Mitchell, O.S. (2007), “Baby Boomer Retirement Security: The Roles of
Planning, Financial Literacy, and Housing Wealth”, in Journal of Monetary
Economics, vol. 54, is. 1, p. 205-224
Montgomery, D.C. (2012), Design and Analysis of Experiments, 8th edition, John Wiley &
Sons, Inc., Asia.
Murnane, R., Willet, J.B. and Levy, F. (1995), “The Growing Importance of Cognitive Skills
in Wage Determination” in Review of Economics and Statistics, vol 77, is. 2, p. 251-
261
National Numeracy, (n.d.) “Numeracy vs. Maths” www.nationalnumeracy.org.uk, found
under division “What is numeracy?” and then subdivision “Numeracy vs. Maths”, date
accessed 2013-05-15
NE, Nationalencyklopedin, (2013), “Palawan”, www.ne.se, search word: Palawan, date
accessed 2013-03-17

39
NSO, Republic of the Philippines National Statistics Office, (2010) “2010 Census of
Population and Housing”, www.census.gov.ph, found under subdivision “People” and
then “Population”, name of document: Population Counts - MIMAROPA
OECD PISA – Programme for International Student Assessment (2012), PISA 2012
Assessment and Analytical Framework: Mathematics, Reading, Science, Problem
Solving and Financial Literacy, OECD
Palawan Chamber of Commerce and Industry, Inc. (n.d.) “About Palawan”,
www.palawanchamber.com, found under subdivision “About Palawan”, date accessed
2013-03-17
Romer, P.M. (1986), “Increasing Returns and Long-Run Growth” in The Journal of Political
Economy, vol. 94, is. 5, p. 1002-1037
SEAMEO, Southeast Asian Ministers of Education Organization, (n.d.) “Philippine Education
System Profile” www.seameo.org found under subdivision “About” and then
“SEAMEO Member Countries”, date accessed 2013-03-17
The Official Gazette (2012-11-30), “The K to 12 Basic Education Program”, www.gov.ph,
search word: the article name
The World Bank (2012) “Literacy rate, adult total (% of people ages 15 and above)”,
www.worldbank.org, found under subdivision “Data” and “Indicators”, date accessed
2013-04-20
UN-ESCAP (2011), Statistical Yearbook for Asia and the Pacific, United Nations
Publication, Thailand

40
Appendix 1 First name: ……………………………………………… Last name:……………………………………………… Age: ……………. Current school year: ……………… Put a cross in the box with the right answer. Boy Girl
Catholic Protestant Muslim Other
How long does it take for you to get to school? Less than 15 minutes Less than 30 minutes Less than 60 minutes More than 60 minutes
How do you live? Live with both parents Live with mother only Live with father only Live with neither parent
What do the ones you live with do for their living? (You can choose more than one) Farming Fishing Meat production Logging Working in a store Tourism Other
If you have any siblings, what are their names? ……………………………………………… ………………………………………………… ……..………………………..………………… ……………………………………………… ………………………………………………… ……..………………………..………………… ……………………………………………… ………………………………………………… ……..………………………..………………… ……………………………………………… ………………………………………………… ……..………………………..………………… If you have siblings still living in your home, what are their names? ……………………………………………… ………………………………………………… ……..………………………..………………… ……………………………………………… ………………………………………………… ……..………………………..………………… ……………………………………………… ………………………………………………… ……..………………………..………………… ……………………………………………… ………………………………………………… ……..………………………..………………… If you have siblings still living in your home, name the ones who work (not in school): ……………………………………………… ………………………………………………… ……..………………………..………………… ……………………………………………… ………………………………………………… ……..………………………..………………… ……………………………………………… ………………………………………………… ……..………………………..…………………

41
Which, if any, of the following do you have? Cell phone Bicycle Motorbike/tricycle
Which, if any, of the following do you have at your home? Radio TV Refrigerator Electricity Water pump Latrine in the house More than one room in the house
Do you have any livestock? (You can choose more than one) None Sheep/goats Cows Pigs Poultry/chickens Other
If you have livestock, how many animals do you have?
0 1 2 3 4 5 6 7 8 More than 8 How many textbooks do you have at home? 0 1 2 3 4 5 6 7 8 More than 8
How many new books did you get last semester? 0 1 2 3 4 5 6 More than 6
Have you during the last week used a textbook at home? Yes No
Have you done any homework in last week? Yes No
How often do you stay at home from school to help out with chores? Never A couple of days per year One day per month Two days per month More than two days per month
How many hours per day do you spend doing chores at home? 0 1 2 3 4 5 More than 5
Do you like going to school? Yes No
Do you think mathematics is fun? Yes No

42
Appendix 2 Table 13. Significance analysis on baseline data (FLSMHS) Francisco Lagan Senior Memorial High School Treatment group Control group Variable Mean (s.d.) Mean (s.d.) p-value Age 13.7 (0.97) 13.7 (1.08) 0.54 Gender 0.38 (0.49) 0.49 (0.51) 0.49 Religion Catholic 0.90 (0.30) 0.74 (0.44) 0.91 Protestant 0.05 (0.22) 0.06 (0.24) 0.74 Other 0.05 (0.22) 0.20 (0.41) 0.09* Time to get to school < 15 minutes 0.29 (0.46) 0.30 (0.47) 0.93 < 30 minutes 0.45 (0.50) 0.52 (0.51) 0.76 < 60 minutes 0.14 (0.35) 0.15 (0.36) 0.82 > 60 minutes 0.12 (0.33) 0.03 (0.17) 0.33 Living arrangements Live with both parents 0.68 (0.47) 0.79 (0.42) 0.91 Live with mother only 0.15 (0.36) 0.09 (0.29) 0.71 Live with father only 0.07 (0.26) 0.06 (0.24) 0.80 Live with neither parent 0.10 (0.30) 0.06 (0.24) 0.88 Occupation of people in the household Farming 0.35 (0.48) 0.58 (0.50) 0.09* Fishing 0.35 (0.48) 0.27 (0.45) 0.65 Meat production 0.00 (0.00) 0.00 (0.00) 0.91 Working in a store 0.03 (0.16) 0.00 (0.00) 0.92 Other 0.38 (0.49) 0.21 (0.42) 0.21 Siblings Number of siblings 3.00 (2.02) 2.94 (1.89) 0.90 Number living at home 1.71 (1.22) 1.57 (1.36) 0.94 Number living at home and 0.24 (0.66) 0.17 (0.45) 0.94 working Ownership of Cell phone 0.67 (0.48) 0.74 (0.44) 0.91 Bicycle 0.19 (0.40) 0.29 (0.46) 0.48 Available household accessories Radio 0.74 (0.45) 0.66 (0.48) 0.91 TV 0.52 (0.51) 0.49 (0.51) 0.91 Electricity 0.00 (0.00) 0.00 (0.00) 0.91 Latrine in the house 0.12 (0.33) 0.11 (0.32) 0.77 More than one room 0.36 (0.48) 0.14 (0.36) 0.06* in the house Livestock None 0.00 (0.00) 0.09 (0.28) 0.18 Sheep/goats 0.10 (0.30) 0.06 (0.24) 0.85 Cows 0.14 (0.35) 0.29 (0.46) 0.21 Pigs 0.60 (0.50) 0.63 (0.49) 0.91 Poultry/chickens 0.40 (0.50) 0.37 (0.49) 0.95 Other 0.26 (0.45) 0.03 (0.17) 0.01*** Number of schoolbooks student owns 0-2 0.26 (0.45) 0.29 (0.46) 0.98 3-5 0.38 (0.49) 0.34 (0.48) 0.91 6-8 0.07 (0.26) 0.06 (0.28) 0.85 > 8 0.29 (0.46) 0.26 (0.44) 0.98

43
How often student stays at home from school to assist with household chores Never 0.00 (0.00) 0.06 (0.24) 0.42 A couple of days per year 0.10 (0.30) 0.09 (0.28) 0.85 1-2 days per month 0.15 (0.36) 0.14 (0.36) 0.81 > 2 days per month 0.75 (0.44) 0.71 (0.46) 0.91 Hours per day doing chores at home 0-2 0.37 (0.49) 0.48 (0.51) 0.45 3-5 0.29 (0.46) 0.21 (0.42) 0.64 > 5 0.34 (0.48) 0.30 (0.47) 0.92 Notes: *** Significantly different from zero at 1 % ** Significantly different from zero at 5 % * Significantly different from zero at 10% 1. Gender is coded as a dummy variable where 1 is boy and 0 is girl. 2. Multiple choices were available for “Occupation of people in the household” and “Livestock”.

44
Appendix 3 Table 14. Significance analysis on baseline data (TNHS) Tagumpay National High School Treatment group Control group Variable Mean (s.d.) Mean (s.d.) p-value Age 13.5 (0.99) 13.8 (1.14) 0.34 Gender 0.26 (0.45) 0.33 (0.48) 0.79 Religion Catholic 0.89 (0.32) 0.88 (0.34) 0.89 Protestant 0.07 (0.27) 0.04 (0.20) 0.92 Other 0.04 (0.19) 0.08 (0.28) 0.92 Time to get to school < 15 minutes 0.26 (0.45) 0.48 (0.51) 0.19 < 30 minutes 0.52 (0.51) 0.35 (0.49) 0.35 < 60 minutes 0.15 (0.36) 0.09 (0.29) 0.82 > 60 minutes 0.07 (0.27) 0.09 (0.29) 0.72 Living arrangements Live with both parents 0.96 (0.19) 0.79 (0.41) 0.89 Live with mother only 0.00 (0.00) 0.04 (0.20) 0.95 Live with father only 0.00 (0.00) 0.00 (0.00) 0.89 Live with neither parent 0.04 (0.19) 0.17 (0.38) 0.28 Occupation of people in the household Farming 0.92 (0.27) 0.91 (0.29) 0.89 Fishing 0.12 (0.33) 0.09 (0.29) 0.88 Meat production 0.00 (0.00) 0.04 (0.21) 0.95 Working in a store 0.00 (0.00) 0.09 (0.29) 0.42 Other 0.08 (0.27) 0.13 (0.34) 0.88 Siblings Number of siblings 1.70 (1.92) 2.50 (2.89) 0.25 Number living at home 1.07 (1.49) 1.21 (1.86) 0.92 Number living at home and 0.22 (0.51) 0.25 (0.61) 0.94 working Ownership of Cell phone 0.63 (0.49) 0.58 (0.50) 0.89 Bicycle 0.07 (0.27) 0.25 (0.44) 0.18 Available household accessories Radio 0.44 (0.51) 0.71 (0.46) 0.89 TV 0.44 (0.51) 0.46 (0.51) 0.86 Electricity 0.30 (0.47) 0.29 (0.47) 0.79 Latrine in the house 0.11 (0.32) 0.21 (0.41) 0.57 More than one room 0.19 (0.40) 0.33 (0.48) 0.37 in the house Livestock None 0.07 (0.27) 0.08 (0.28) 0.67 Sheep/goats 0.00 (0.00) 0.08 (0.28) 0.42 Cows 0.04 (0.19) 0.13 (0.34) 0.52 Pigs 0.63 (0.47) 0.75 (0.44) 0.89 Poultry/chickens 0.41 (0.50) 0.54 (0.51) 0.50 Other 0.26 (0.42) 0.17 (0.38) 0.65 Number of schoolbooks student owns 0-2 0.41 (0.50) 0.21 (0.42) 0.22 3-5 0.44 (0.51) 0.38 (0.50) 0.83 6-8 0.07 (0.27) 0.04 (0.20) 0.92 > 8 0.07 (0.27) 0.38 (0.49) 0.02**

45
How often student stays at home from school to assist with household chores Never 0.07 (0.27) 0.04 (0.21) 0.89 A couple of days per year 0.11 (0.32) 0.17 (0.39) 0.82 1-2 days per month 0.41 (0.50) 0.39 (0.50) 0.86 > 2 days per month 0.41 (0.50) 0.39 (0.50) 0.86 Hours per day doing chores at home 0-2 0.54 (0.51) 0.41 (0.51) 0.55 3-5 0.23 (0.43) 0.36 (0.49) 0.50 > 5 0.23 (0.43) 0.23 (0.43) 0.75 Notes: *** Significantly different from zero at 1 % ** Significantly different from zero at 5 % * Significantly different from zero at 10% 1. Gender is coded as a dummy variable where 1 is boy and 0 is girl. 2. Multiple choices were available for “Occupation of people in the household” and “Livestock”.