Improvement of the Voltage Quality of Hyderabad … transmission network of Hyderabadcity was...
7
International Journal of Scientific & Engineering Research, Volume 7, Issue 1, January-2016 1199 ISSN 2229-5518 IJSER © 2016 http://www.ijser.org Improvement of the Voltage Quality of Hyderabad Network in India Ibrahim A. Nassar Abstract— In this paper the performance of the electrical network of India is studied by considering a small part on the network (Hyderabad city). The transmission network of Hyderabad city was created for 220 kv, 132 kv, 33 kv and 11 kv in the digital simulation and electrical network calculation (DIgSILENT Power Factory Software) to study the voltage profiles. The load flow operational analysis was performed to obtain the voltage magnitudes at every bus bar. The voltage magnitudes in 33 kv and 11 kv networks were 10% to 15% less than the nominal value due to overloading of the transmission lines and the voltage magnitudes in 132 kv and 220 kv were within permissible limits. By using automatic tap-changing transformer or Static VAR System, the main idea of this paper is to obtain the voltage profiles at every bus bar to improve the voltage quality of the networks, so as to achieve better voltage profiles on the low voltage side without much affecting high voltage side under various operating conditions. Index Terms— Voltage Quality, Network, Automatic Tap-Changer, Static VAR System. —————————— —————————— 1 INTRODUCTION ndia’s electricity grid has the highest transmission and dis- tribution losses in the world – a whopping 27%. Numbers published by various Indian government agencies put that number at 30%, 40% and greater than 40% [1, 2].This is at- tributed to technical losses and theft. Because of the grids inef- ficiency and theft, India has got a lot of power issues (voltage). Recently the most common problem seen in many parts of India is sudden increase in voltage resulting in damaging the electrical and electronic appliances on the consumer end. Many cities reportedly experienced higher than normal volt- age, due to which power appliances were burnt or damaged. “Refrigerators, television sets and computers were either burnt totally or stopped functioning due to high voltage sup- ply. India is one of the south Asian countries; the gross electricity generation includes auxiliary power consumption of power generation plants. India became the world's third largest pro- ducer of electricity in the year 2013 with 4.8% global share in electricity generation surpassing Japan and Russia. About 69% of the electricity consumed in India is generated by thermal power plants, 17% by hydroelectric power plants, 2% by nu- clear power plants and 12% by Renewable energy sources [3]. More than 50% of India’s commercial energy is met by coun- try’s vast coal reserves. Though the country is able to generate electricity to meet the increasing demand, it has failed to maintain the efficiency while transporting it. In recent times the research analysis shows that during the transmission and distribution, the electricity losses are extremely high varying between 30 to 45%. Almost 90% of the Indian urban and rural populations face low voltage problems round the clock reducing the life expec- tancy and malfunctioning of the electrical equipment on the consumer end. Considering these problems, in this paper we study the per- formance of the electrical network of the city Hyderabad (Cap- ital of Andhra Pradesh) located in the southern part of India . The geographical area of Hyderabad is 260 sq km with a population of over 5 million. 2 NETWORK OF HYDERABAD Figure 1 shows the transmission and distribution network of Hyderabad consists of overhead lines operating at various voltage levels ranging from 400 kv to 220 kv, 132 kv, 66 kv, 33 kv and 11 kv respectively. The city is not connected directly to any power plant. Instead the city receives power from 400 kv transmission line connected in between Mamidipally and Ghanapur villages. Fig. 1. Overview of the Hyderabad Network I ———————————————— • Ibrahim A. Nassar, Department of Electrical Power and Machine, Fac- ulty of Engineering, Alazhar University- Cairo, Egypt, PH- 00201005357921. E-mail: [email protected] IJSER
Transcript of Improvement of the Voltage Quality of Hyderabad … transmission network of Hyderabadcity was...

International Journal of Scientific & Engineering Research, Volume 7, Issue 1, January-2016 1199 ISSN 2229-5518
IJSER © 2016 http://www.ijser.org
Improvement of the Voltage Quality of Hyderabad Network in India
Ibrahim A. Nassar
Abstract— In this paper the performance of the electrical network of India is studied by considering a small part on the network (Hyderabad city). The transmission network of Hyderabad city was created for 220 kv, 132 kv, 33 kv and 11 kv in the digital simulation and electrical network calculation (DIgSILENT Power Factory Software) to study the voltage profiles. The load flow operational analysis was performed to obtain the voltage magnitudes at every bus bar. The voltage magnitudes in 33 kv and 11 kv networks were 10% to 15% less than the nominal value due to overloading of the transmission lines and the voltage magnitudes in 132 kv and 220 kv were within permissible limits. By using automatic tap-changing transformer or Static VAR System, the main idea of this paper is to obtain the voltage profiles at every bus bar to improve the voltage quality of the networks, so as to achieve better voltage profiles on the low voltage side without much affecting high voltage side under various operating conditions.
Index Terms— Voltage Quality, Network, Automatic Tap-Changer, Static VAR System.
—————————— ——————————
1 INTRODUCTION ndia’s electricity grid has the highest transmission and dis-tribution losses in the world – a whopping 27%. Numbers published by various Indian government agencies put that
number at 30%, 40% and greater than 40% [1, 2].This is at-tributed to technical losses and theft. Because of the grids inef-ficiency and theft, India has got a lot of power issues (voltage). Recently the most common problem seen in many parts of India is sudden increase in voltage resulting in damaging the electrical and electronic appliances on the consumer end. Many cities reportedly experienced higher than normal volt-age, due to which power appliances were burnt or damaged. “Refrigerators, television sets and computers were either burnt totally or stopped functioning due to high voltage sup-ply. India is one of the south Asian countries; the gross electricity generation includes auxiliary power consumption of power generation plants. India became the world's third largest pro-ducer of electricity in the year 2013 with 4.8% global share in electricity generation surpassing Japan and Russia. About 69% of the electricity consumed in India is generated by thermal power plants, 17% by hydroelectric power plants, 2% by nu-clear power plants and 12% by Renewable energy sources [3]. More than 50% of India’s commercial energy is met by coun-try’s vast coal reserves. Though the country is able to generate electricity to meet the increasing demand, it has failed to maintain the efficiency while transporting it. In recent times the research analysis shows that during the transmission and distribution, the electricity losses are extremely high varying between 30 to 45%. Almost 90% of the Indian urban and rural populations face low voltage problems round the clock reducing the life expec-tancy and malfunctioning of the electrical equipment on the consumer end. Considering these problems, in this paper we study the per-formance of the electrical network of the city Hyderabad (Cap-
ital of Andhra Pradesh) located in the southern part of India . The geographical area of Hyderabad is 260 sq km with a population of over 5 million.
2 NETWORK OF HYDERABAD Figure 1 shows the transmission and distribution network of Hyderabad consists of overhead lines operating at various voltage levels ranging from 400 kv to 220 kv, 132 kv, 66 kv, 33 kv and 11 kv respectively. The city is not connected directly to any power plant. Instead the city receives power from 400 kv transmission line connected in between Mamidipally and Ghanapur villages.
Fig. 1. Overview of the Hyderabad Network
I
———————————————— • Ibrahim A. Nassar, Department of Electrical Power and Machine, Fac-
ulty of Engineering, Alazhar University- Cairo, Egypt, PH-00201005357921. E-mail: [email protected]
IJSER

International Journal of Scientific & Engineering Research, Volume 7, Issue 1, January-2016 1200 ISSN 2229-5518
IJSER © 2016 http://www.ijser.org
Figure 2 shows extra high tension (EHT) grid of Hyderabad. The city consists of 17 EHT substations located in different areas within the city, from where the voltage is step down and transferred to various local substations (400 kv line is replaced by two external grids)
Fig. 2: Extra High Tension Grid of Hyderabad
The voltage levels are step-down to 132 kv and distributed to different areas within the city, where they are further step-down to 33 kv. From 33 kv feeders are distributed to various local areas in the city, emanating 33/11 kv substations over 33 kv feeders and then start the distribution network, where the 11 kv feeders are emanated and distributed to various local transformers in the city where the voltages are step-down to 440v or 220v, depending on the consumer end.
3 MODELLING OF HYDERABAD NETWORK IN DIGSILENT POWER FACTORY
DigSilent PowerFactory is a high end power system analysis tool for applications in transmission, distribution, generation, industrial, and smart grid operations. It has set standards and trends in power system modelling, analysis and simulation [4]. The DigSilent program helps in creating power system designs, by creating all components in a textual database envi-ronment and by manually connecting them, thus defining the topology. The more convenient method however, is to use the interactive single line graphics [5]. Figure 3 show the overview of modelled grid of Hyderabad in DigSilent.
Fig. 3: Overview of modelled grid of Hyderabad in DigSilent
3.1 Power Flow Problems After the completion of constructing the network we need to obtain the voltage magnitude values at every bus bar. This is obtained by performing load flow. DigSilent offers a selection of calculation methods, including a full AC Newton Raphson method for balanced, unbalanced and a linear DC method. The implemented algorithms exhibit excellent stability and several iteration levels guarantee convergence under all condi-tions, with optional automatic relaxation and modification of constraints [6]. The results obtained after performing load flow problem clear-ly state that the network has severe low voltage problem. The maximum voltage drop in the network is found to be around 15% less than the nominal value at 11 kv Nehru Nagar. The overall voltage drops in the network are found to be differing by 0-15% of the nominal value. Figure 4 shows the individual bus voltage magnitudes in per unit of the 11 kv network of Hyderabad. The results clearly show that around 96% of the bus voltage levels in the 11 kv network are less than the nomi-nal value.
Fig. 4: Individual bus (11 kv) voltage magnitudes (p.u) for real network
An efficient grid usually has voltage magnitudes in the range
IJSER
International Journal of Scientific & Engineering Research, Volume 7, Issue 1, January-2016 1201 ISSN 2229-5518
IJSER © 2016 http://www.ijser.org
of (0.95-1.05p.u). Since the load is connected to 33/11 kv sub-stations, figure 5 shows the individual bus voltage magnitudes in the 33 kv and 11 kv networks are 10% to 15% less than the nominal value, due to overloading of the transmission lines.
Fig. 5: Individual bus (33 kv) voltage magnitudes (p.u) for real network
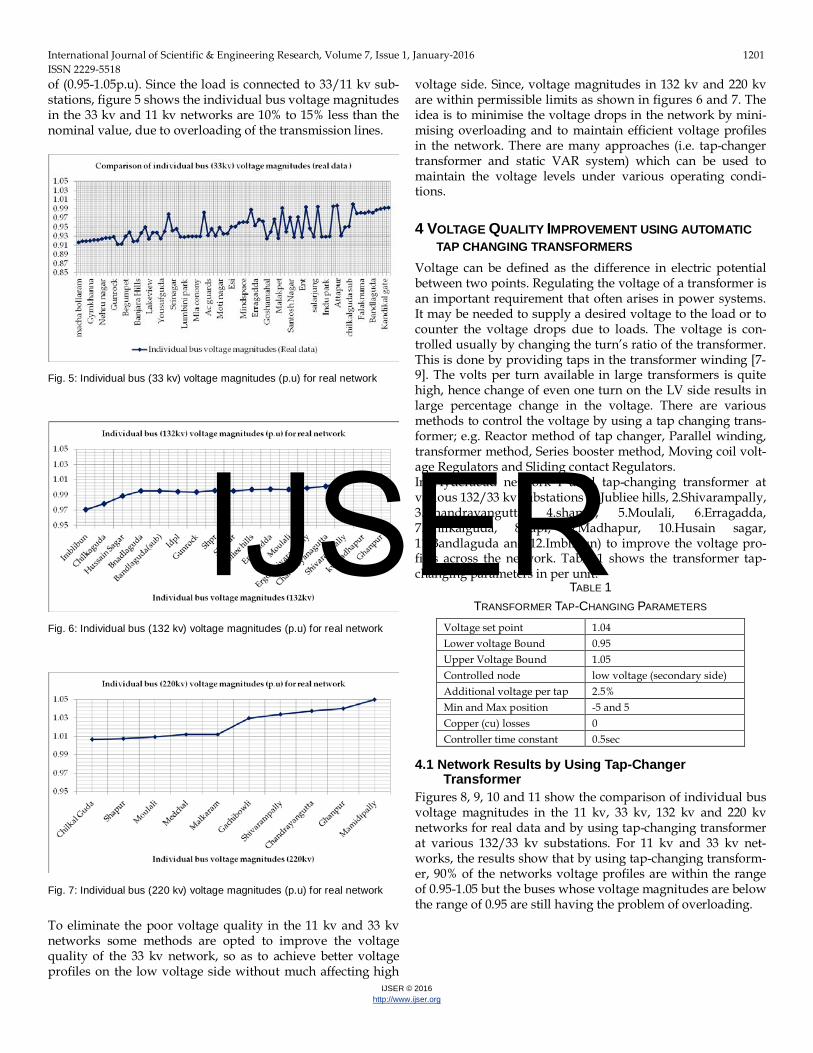
Fig. 6: Individual bus (132 kv) voltage magnitudes (p.u) for real network
Fig. 7: Individual bus (220 kv) voltage magnitudes (p.u) for real network
To eliminate the poor voltage quality in the 11 kv and 33 kv networks some methods are opted to improve the voltage quality of the 33 kv network, so as to achieve better voltage profiles on the low voltage side without much affecting high
voltage side. Since, voltage magnitudes in 132 kv and 220 kv are within permissible limits as shown in figures 6 and 7. The idea is to minimise the voltage drops in the network by mini-mising overloading and to maintain efficient voltage profiles in the network. There are many approaches (i.e. tap-changer transformer and static VAR system) which can be used to maintain the voltage levels under various operating condi-tions.
4 VOLTAGE QUALITY IMPROVEMENT USING AUTOMATIC TAP CHANGING TRANSFORMERS
Voltage can be defined as the difference in electric potential between two points. Regulating the voltage of a transformer is an important requirement that often arises in power systems. It may be needed to supply a desired voltage to the load or to counter the voltage drops due to loads. The voltage is con-trolled usually by changing the turn’s ratio of the transformer. This is done by providing taps in the transformer winding [7- 9]. The volts per turn available in large transformers is quite high, hence change of even one turn on the LV side results in large percentage change in the voltage. There are various methods to control the voltage by using a tap changing trans-former; e.g. Reactor method of tap changer, Parallel winding, transformer method, Series booster method, Moving coil volt-age Regulators and Sliding contact Regulators. In Hyderabad network I used tap-changing transformer at various 132/33 kv substations (1.Jubliee hills, 2.Shivarampally, 3.Chandrayangutta, 4.shapur, 5.Moulali, 6.Erragadda, 7.Chilkalguda, 8.Idpl, 9.Madhapur, 10.Husain sagar, 11.Bandlaguda and 12.Imblibun) to improve the voltage pro-files across the network. Table 1 shows the transformer tap-changing parameters in per unit.
TABLE 1 TRANSFORMER TAP-CHANGING PARAMETERS
Voltage set point 1.04 Lower voltage Bound 0.95 Upper Voltage Bound 1.05 Controlled node low voltage (secondary side) Additional voltage per tap 2.5% Min and Max position -5 and 5 Copper (cu) losses 0 Controller time constant 0.5sec
4.1 Network Results by Using Tap-Changer Transformer
Figures 8, 9, 10 and 11 show the comparison of individual bus voltage magnitudes in the 11 kv, 33 kv, 132 kv and 220 kv networks for real data and by using tap-changing transformer at various 132/33 kv substations. For 11 kv and 33 kv net-works, the results show that by using tap-changing transform-er, 90% of the networks voltage profiles are within the range of 0.95-1.05 but the buses whose voltage magnitudes are below the range of 0.95 are still having the problem of overloading.
IJSER

International Journal of Scientific & Engineering Research, Volume 7, Issue 1, January-2016 1202 ISSN 2229-5518
IJSER © 2016 http://www.ijser.org
Fig. 8: Comparison of individual bus (11 kv) voltage magnitudes (real net-work and with T/C).
Fig. 9: Comparison of individual bus (33 kv) voltage magnitudes (real net-work and with T/C).
Fig.10: Comparison of individual bus (132 kv) voltage magnitudes (real net-work and with T/C).
Fig.11: Individual bus (33 kv) voltage magnitudes (p.u) using automatic tap changing transformers.
The results obtained by using automatic tap changing trans-formers, helped to minimise the voltage drops in the network up to certain extent. But there are still places in the 33 kv and 11 kv networks where the voltage profiles are still quite low when compared with the nominal value. This is mainly be-cause of the heavy overloading of the network elements and since automatic tap changing transformers does not have the capability of generating reactive power there operation is lim-ited.
5 STATIC VAR SYSTEM For further improvement a static VAR system (SVS) was in-stalled in the network for compensating the reactive power to minimise heavy overloading of the transmission lines by providing sufficient reactive reserves to the network and achieve better voltage profiles. A static VAR system is an elec-trical system which provides fast acting reactive power on high voltage electricity transmission networks [10]. To im-prove the transmission capability of the system, not by exten-sion but by improving the transmission quality of the existing system can be achieved by the following factors: stabilizing the system voltage, balancing of system voltage, limiting of over voltages and voltages collapses, damping of oscillations and reduction of reactive power flow. These requirements can be achieved by static VAR compensator or system because of its continuous and fast controllability. A rapidly operating static VAR compensator can provide continuous reactive power required to control the dynamic voltage swings under various system conditions and thereby improve the power system transmission and distribution performance. Installing an SVC at one or more suitable points in the network can in-crease transfer capability and reduce losses while maintaining a smooth voltage profile under different network conditions [11, 12].
5.1 Working of a Static VAR system Shunt capacitor compensation is required to maintain the sys-tem voltage during heavy load condition of transmission line while reactors needed to reduce the overvoltage of the line at
IJSER

International Journal of Scientific & Engineering Research, Volume 7, Issue 1, January-2016 1203 ISSN 2229-5518
IJSER © 2016 http://www.ijser.org
light load condition. SVS can perform these two tasks together utilizing the static VAR compensator [13-17]. A static VAR compensator is basically a parallel combination of controlled reactor and fixed static capacitor as shown in figure 12.
Fig. 12: Schematic view of a static VAR compensator
DigSilent power factory is a tool which provides highly inte-grated graphical one line interface. The tool contains a graphics board in which all the devices required for modelling a power system network are enlisted. This makes it easy to access the components required for modelling the network. The static VAR system (SVS) is used to improve the voltage quality of Hyderabad network by providing enough reactive reserves. The place where SVS needs to be installed must be accurate so as to achieve best voltage profiles and system sta-bility. For this, the entire network was exploited for installing SVS and came up with a possible solution where SVS can be installed. The SVS is connected on the 33 kv side of 132/33 kv Gunrock substation. The SVC Parameters considered: thyristor controlled reactance maximum limit (TCR) equal 200Mvar, thryristor shunt capacitance (TSC): maximum number of ca-pacitors of 5 (40Mvar/Capacitor) and the amount of reactive power injected into the network at bus (33 kvGunrock) is Q equal 139.30Mvar. (Automatically generated value from load flow problem)
5.2 Network Results by Static VAR system Figures 13, 14, 15 and 16 show the comparison of the individ-ual bus voltage magnitudes across the 11 kv, 33 kv, 132 kv and 220 kv networks of Hyderabad for real network, with tap-changer transformer and with static VAR system.
Fig. 13: Comparison of individual bus (11 kv) voltage magnitudes (real network, with T/C and SVC)
Fig. 14: Comparison of individual bus (33 kv) voltage magnitudes (real network, with T/C and SVC)
IJSER

International Journal of Scientific & Engineering Research, Volume 7, Issue 1, January-2016 1204 ISSN 2229-5518
IJSER © 2016 http://www.ijser.org
Fig. 15: Comparison of individual bus (132 kv) voltage magnitudes (real network, with T/C and SVC)
Fig.16: Comparison of individual bus (220 kv) voltage magnitudes (real network, with T/C and SVC)
As a result, by using SVS show that the individual bus voltage magnitudes of the entire network seemed to be within permis-sible range (i.e. 0.95-1.05p.u). The voltage drops in the network are also reduced making the grid efficient. This approach ( i.e. by using automatic tap changing transformers and static VAR compensator) helps the Hyderabad network to maintain the voltage profiles within the permissible range under light load as well as heavy load conditions, also providing measures to handle high voltages in specific regimes. This approach is best suitable solution for improving the grid efficiency of Hyderabad network, specially keeping in view the major problems associated in maintaining the electrical grid of Hyderabad (stated in introduction).The above studies and results give us the static characteristics of the network.
6 CONCLUSION The paper mainly deals with investigating the voltage quality
of the city Hyderabad and problems associated with it. The main idea of this paper is to improve the voltage quality of the existing network, without making any further extensions to the network. For this we modelled the transmission network of Hyderabad in DigSilent software tool and performed load flow operation to obtain individual bus voltage magnitudes. From the initial results obtained by performing load flow problem, it could be shown that the electrical network of Hy-derabad has severe low voltage problem, especially in the 33 kv and 11 kv networks due to heavy over loading of network elements. The voltage at many places differs by 10%-15% of the nominal voltage. This is attributed mainly due to technical losses. After obtaining the initial results by performing load flow problem certain basic methods were adopted to improve the voltage quality of the network and reduce heavy line loadings. First method: to improve the voltage levels in the network by using automatic tap-changing transformers at various EHT substations in the city. This helped to improve 90% of the net-works voltage quality. Second method: to obtain better voltage profiles, to optimise the reactive power of the network by installing a static VAR compensator. For this, the entire network of Hyderabad was exploited and found possible solutions to install the SVC. Finally, the approaches used above help to improve the volt-age quality of the existing Hyderabad network. From the static results achieved it can be clearly suggested that the approach-es used are one of the best possible and suitable solutions to improve efficiency of the existing Hyderabad electrical net-work, keeping in view the problems the grid has. The results achieved helps to minimise the continuous overloading of the network elements, by providing enough reactive reserves and mantain the voltage quality of the network.
REFERENCES [1] Priyaranjan Kumar Priya Pant and Udita Dimri, "Wireless Electricity
Transmission Fuel for Future Development", International Journal of Science and Research (IJSR), 2014, ISSN (Online): 2319-7064
[2] S. Sheik Mohammed, K. Ramasamy and T. Shanmuganantham, "Wireless Power Transmission – A Next Generation Power", Trans-mission System, International Journal of Computer Applications , Vol-ume 1 – No. 13, 2010
[3] Electricity sector of india: en.wikipedia.org/wiki/ Electricity_sector_in_India
[4] Digsilent: www.digsilent.de/Software/DIgSILENT_PowerFactory [5] DigSilent:Digsilent Power factory manual version [6] Ian A.Hiskens, Power flow analysis, University of Wisconsin-Madison,
2003 [7] Raju Ahmed and Mohammad Jahangir Alam, “Power Quality Im-
provement Using Switch Mode Regulator”,2013, ISBN 978-953-51-1079-8
[8] S.Khalid and Bharti Dwivedi, “power quality issues, problems, standards & their effects in industry with corrective means”, Interna-tional Journal of Advances in Engineering & Technology, May 2011. ISSN: 2231-1963
[9] Dharmendra kumar Singh, “Impact of power thefts and Power sys-tem quality standards in Indian scenario:-Survey”, International Jour-nal of Scientific & Engineering Research, Volume 4, Issue 12, December-
IJSER

International Journal of Scientific & Engineering Research, Volume 7, Issue 1, January-2016 1205 ISSN 2229-5518
IJSER © 2016 http://www.ijser.org
2013 323 ISSN 2229-5518 [10] H. Pesch, S. Ranade, M. Schubert and P. Sieber, “Static VAR-
Compensators for stabilizing traction and transmission systems in South Africa” , AEG Germany ,2007
[11] J.Sridevi, Dr. J. Amarnath and Dr. G.Govinda Rao, “Zonal Power Quality improvement using Static Var Compensator for an Indian Utility System”, International Journal of Engineering Research, Vol. 2, Is-sue 3, May-Jun 2012, pp.1320-1325, ISSN: 2248-9622
[12] Ibrahim Nassar, Reactive power control in power systems using neural networks, Master Thesis, Al–Azhar University,2004,Cairo
[13] S. Al-Ali, Ibrahim A. Nassar and Harald Weber, "Interconnection of the European ENTSO-E-CE System with the Turkish system: Investi-gation of the Expected Inter-Area-Oscillations Behaviour", 17th Power Systems Computation Conference, August 22-26, 2011, Stockholm, Swe-den, Volume 2, pp. 853-858.
[14] Peng Fei , Shunxian Bao and Yong Ding, “Power quality improve-ment with SVC in power supply system”, Electricity Distribution (CICED), 2012 China, ISSN: 2161-7481
[15] P. Venkata Kishore and S. Rama Reddy, “Power Quality Improve-ment Using Multiple Statcoms”, The International Journal Of Engineer-ing And Science, Pages 101-108, 2014 , ISSN (e): 2319–1813
[16] S. Sujatha, R. Anita, P. Selvan and S. Selvakumar, “Impact of Static VAR Compensator in Stability and Harmonics Mitigation for Real Time System with Cogeneration”, Indian Journal of Science and Tech-nology, Vol 8(12), DOI: 10.17485/ijst/2015/v8i12/54007, June 2015, ISSN (Online) : 0974-5645
[17] Ashish Kumar Choubey, “Stability Improvement of Power System by Using Fuzzy Coordinated Static Var Compensator”, International Journal of Engineering Trends and Technology (IJETT) – Volume 25 Number 1- July 2015 IJSER