Improvement of the methanol-to-hydrocarbons catalytic ...
146
Improvement of the methanol-to-hydrocarbons catalytic performance for one-dimensional zeolites obtained by post-synthetic modifications Dissertation for the degree of Philosophiae Doctor Pablo del Campo Huertas Department of Chemistry Faculty of Mathematics and Natural Sciences UNIVERSITY OF OSLO January 2017
Transcript of Improvement of the methanol-to-hydrocarbons catalytic ...

Improvement of the methanol-to-hydrocarbons
catalytic performance for one-dimensional
zeolites obtained by post-synthetic modifications
Dissertation for the degree of
Philosophiae Doctor
Pablo del Campo Huertas
Department of Chemistry
Faculty of Mathematics and Natural Sciences
UNIVERSITY OF OSLO
January 2017

© Pablo del Campo Huertas, 2017 Series of dissertations submitted to the Faculty of Mathematics and Natural Sciences, University of Oslo No. 1854 ISSN 1501-7710 All rights reserved. No part of this publication may be reproduced or transmitted, in any form or by any means, without permission. Cover: Hanne Baadsgaard Utigard. Print production: Reprosentralen, University of Oslo.

ii
to my parents, to my sister, to my Ana


iii
Preface
he work presented in this thesis was carried out as a part of a 3.5 year PhD scholarship
(beginning May 2013). The project was jointly financed by Department of Chemistry,
University of Oslo and the CRI-centre “Innovative Natural Gas processes and Products”
(inGAP). The PhD study comprises 30 ECTS and research stays for 6 months at the R&D
facilities at Haldor Topsøe (Lyngby, Denmark) and for 3 months at the ITQ-UPV Institute
(Valencia, Spain). Professor Stian Svelle (University of Oslo) has acted as my principal
supervisor and Senior Scientist Palo Beato (Haldor Topsøe) as subsidiary supervisor during
the entire project. Professor Unni Olsbye and Professor Karl Petter Lillerud were co-
supervisors of the project.
I had the great pleasure to work in a scientific field that really excited me. All the supervisors
are acknowledged for the advice and guidance throughout this period. Special thanks to Stian
for his professional guidance, sharing excellent ideas, assisting with equipment issues and
facilitating my stay in Oslo. Also, I really appreciated the scientific and non-scientific
enthusiastic discussions with Unni. She was always open to any query. Pablo is greatly
acknowledged for sharing optimism, fresh and innovative ideas and giving me a great time
under the period in Denmark. I thank all the UiO group which accompanied me for the help
with the experiments performed at the ESRF and the collaboration in the resulting papers. I
would like to thank Gloria Bostick for her kind patient assistance with all the administration.
The stay at the ITQ-UPV institute was supervised by Professor Fernando Rey and Professor
Jose Serra, with experimental help of Miguel Palomino and Maria Teresa Navarro. Thanks to
all you for the data discussion and also for the support during my sick leave.
I would like to thank all my present and former colleagues in the catalysis group for a great
working environment and time together. Special thanks to Dani Rojo and Michael Dyballa for
reading the thesis and Juan S. Martinez-Espín and Andrea Molino for the nice time and useful
contributions to the presented work.
Thanks of course to my parents, my sister, family and home friends for all the support given
to me. Finally, very special thanks to my Ana, for her loving support and persistence. Without
you it would have been impossible to complete this journey together.
T

iv
List of abbreviations and symbols
IUPAC International Union of Pure and Applied Chemistry
FCC Fluid Catalytic Cracking
HDS Hydrodesulphurization
SCR Selective Catalytic Reduction
Ea Activation Energy
EFAl Extra-framework Aluminium
EFSi Extra-framework Silicon
SDA Structure Directing Agent
MTH Methanol-to-Hydrocarbons
NG Natural Gas
MTG Methanol-to-Gasoline
TIGAS Topsøe Integrated Gasoline Synthesis
DME Dimethyl Ether
MTO Methanol-to-Olefins
MTP Methanol-to-Propylene
HCP Hydrocarbon Pool
PMB Polymethylbenzene
WHSV Weight Hour Space Velocity
TOS Time on Stream
PDA Pore Directing Agent

v
CTAB Cetyltrimethylammonium Bromide
TBAOH Tetrabutylammonium Hydroxide
BAS Brønsted Acid Site
MAS NMR Magic-Angle Nuclear Magnetic Resonance
USY Ultra-Stable Zeolite Y
LAS Lewis Acid Site
BA Brønsted Acidity
LA Lewis Acidity
ASD Acid Site Density
LDPE Low Density Polyethylene
IZA International Zeolite Association
PXRD Powder X-Ray Diffraction
a.u. Arbitrary Units
MP-AES Microwave Plasma-Atomic Emission Spectrometry
SEM Scanning Electron Microscopy
TEM Transmission Electron Microscopy
BET Brunauer, Emmett and Teller
PSD Pore Size Distribution
BJH Barett-Joyner-Halenda
FTIR Fourier Transformed Infrared
MS Mass Spectrometer
TPD Temperature Programmed Desorption
TGA Thermogravimetric Analysis

vi
HXRD High Energy X-Ray Diffraction
PDP Powder Diffraction Pattern
GC Gas Chromatography
FID Flame Ionization Detector
GC-MS Gas Chromatograph-Mass Spectrometer
HTI Hydrogen Transfer Index
Å Åmstrong (10-10
m)
µm Micrometer (10-6
m)
λ Wavelength
ρ Density
ϴ Angle of diffraction

vii
Table of contents
List of publications ................................................................................................................... ix
The author’s contribution ......................................................................................................... x
Papers not included in this Thesis ........................................................................................... xi
List of conference contributions ............................................................................................. xii
Scope .......................................................................................................................................... 1
1. Introduction ......................................................................................................................... 3
1.1. Catalysis in general .................................................................................................... 3
1.2. Zeolites as heterogeneous acid catalysts ................................................................... 6
1.2.1. Diffusion and shape selectivity in zeolites ............................................................ 11
1.3. Materials related to this work .................................................................................. 13
2. The Methanol-To-Hydrocarbon Reaction....................................................................... 16
2.1. Energetic perspectives .............................................................................................. 16
2.2. Development of MTH technologies .......................................................................... 18
2.3. Evolution of the reaction mechanisms ..................................................................... 20
2.4. Shape selectivity in MTH .......................................................................................... 24
2.5. Challenges of one-dimensional zeolites ................................................................... 26
3. Catalyst Improvement by Post-synthetic Approaches ................................................... 32
3.1. Desilication by alkaline treatment ........................................................................... 35
3.2. Additional pore directing agents .............................................................................. 39
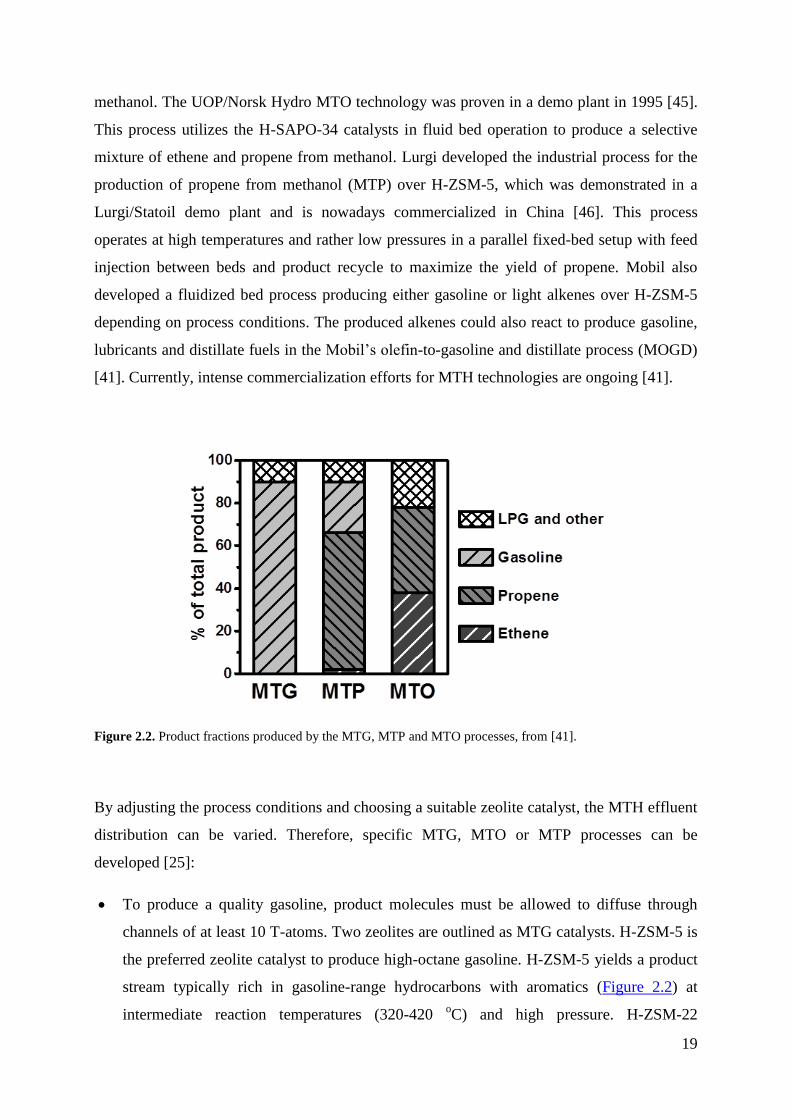
3.2.1. Alkaline-surfactant combined methods ................................................................ 39
3.2.2. Alkaline-tetralkylammonium hydroxides combined methods ............................... 41
3.3. Effect of acid treatments ........................................................................................... 42
3.4. Influence on the catalytic properties ........................................................................ 43
4. Experimental ...................................................................................................................... 50
4.1. Catalyst synthesis and preparation .......................................................................... 50
4.1.1. Calcination and ion-exchange ............................................................................. 51
4.2. Post-synthetic strategies ........................................................................................... 51
4.2.1. Alkaline desilication ............................................................................................. 51
4.2.2. Alkaline-surfactant desilication ........................................................................... 52

viii
4.2.3. Alkaline-tetrabutylammonium desilication .......................................................... 52
4.2.4. Acid treatment ...................................................................................................... 52
4.3. Ex-situ characterization ........................................................................................... 54
4.3.1. Powder X-Ray Diffraction (PXRD) ...................................................................... 54
4.3.2. Elemental Analysis ............................................................................................... 55
4.3.3. Scanning Electron Microscopy (SEM) ................................................................. 56
4.3.4. Transmission Electron Microscopy (TEM) .......................................................... 56
4.3.5. Physisorption Measurements ............................................................................... 56
4.3.6. Infrared Spectroscopy (IR) ................................................................................... 63
4.3.7. Additional characterization .................................................................................. 67
4.4. Operando High Energy XRD (HXRD) ..................................................................... 68
4.5. Catalytic testing ........................................................................................................ 69
4.5.1. Catalytic testing at home laboratory .................................................................... 69
4.5.2. Catalytic testing at ESRF ..................................................................................... 72
4.5.3. Analysis of the retained species ........................................................................... 73
5. Summary of Results........................................................................................................... 74
5.1. Effect of the post-synthetic modifications on the catalyst properties ....................... 75
5.1.1. Relevance of the starting material on the mesopore generation .......................... 75
5.1.2. Effect of the desilication and acid treatments ...................................................... 79
5.1.3. Composition – porosity – acidity interdependence .............................................. 84
5.2. Assessing the catalytic consequences ....................................................................... 89
5.2.1. Improvement of the MTH performance ................................................................ 89
5.2.2. Correlation with catalyst features ........................................................................ 95
5.2.3. Structure-deactivation investigations ................................................................... 99
5.3. Extension to other one-dimensional 10-ring structures ......................................... 104
5.4. Main conclusions .................................................................................................... 108
6. Suggestions for Further Work........................................................................................ 111
References ............................................................................................................................. 113
Appendix ............................................................................................................................... 125

ix
List of publications
This Thesis is based on the four manuscripts listed and numbered below. The full manuscripts
are collected in the Appendix.
Paper I: Time- and space-resolved high energy operando X-ray diffraction for monitoring the
methanol to hydrocarbons reaction over H-ZSM-22 zeolite catalyst in different conditions.
Pablo del Campo, W. A. Slawinski, R. Henry, M. Westgård Erichsen, S. Svelle, P. Beato, D.
Wragg*, U. Olsbye*, Surface Science 648 (2016) 141–149.
Paper II: Influence of post-synthetic modifications on the composition, acidity and textural
properties of ZSM-22 zeolite. Pablo del Campo, P. Beato*, F. Rey, M.T. Navarro, U. Olsbye,
K.P. Lillerud, S. Svelle*, Catalysis Today (2017)
http://dx.doi.org/10.1016/j.cattod.2017.04.042
Paper III: Impact of post-synthetic treatments on unidirectional H-ZSM-22 zeolite catalyst:
Towards improved clean MTG catalytic process. Pablo del Campo, U. Olsbye, K.P. Lillerud,
S. Svelle*, P. Beato*, Catalysis Today (2017) http://dx.doi.org/10.1016/j.cattod.2017.05.011
Paper IV: Syngas to liquids via oxygenates. M. Westgård Erichsen, J.S. Martinez-Espin, F.
Joensen, S. Teketel, Pablo del Campo, K.P. Lillerud, S. Svelle, P. Beato*, U. Olsbye*, Book
Chapter in "Small-Scale Gas to Liquid Fuel Synthesis", CRC Press 2015.
*corresponding author(s)

x
The author’s contribution
Paper I: The author participated in planning the experiments and synthesized all the samples.
The author was strongly involved in the construction of the experimental setup at synchrotron
facilities, contributed to the catalytic operando measurements and performed all the in house
catalytic testing and characterization of the samples. The author was strongly involved in data
interpretation and writing of the manuscript and all graphics.
Paper II: The author planned the experiments, synthesized and prepared all the samples. The
author performed all the characterization of the samples (TEM was done with a technician at
ITQ-Valencia or Haldor Topsøe AS). The author strongly participated in data interpretation
and writing of the manuscript and all graphics.
Paper III: The author participated in planning the experiments, synthesized all the samples
and performed all the characterization of the samples and all the catalytic tests over the
materials. The author strongly participated in data interpretation and writing of the manuscript
and all graphics.
Paper IV: The author was involved in writing of the manuscript (mostly Sections 3.4 and 3.5
of Paper IV) and preparation of graphics.
This paper is printed as separate and comprises a literature survey on previous publications of
the catalysis group. The most relevant results are presented as a part of the introductory
Chapter 3 (Section 2.5). The study forms part of the european large-scale OCMOL (Oxidative
Coupling of Methane followed by Oligomerization to Liquids) project.

xi
Papers not included in this Thesis
CHA/AEI intergrowth materials as catalysts for the Methanol-to-Olefins process. R.L. Smith,
S. Svelle, Pablo del Campo, T. Fuglerud, B. Arstadd, A. Lind, S. Chavan, M.P. Attfield, D.
Akporiayed, M.W. Anderson*, Applied Catalysis A: General 505 (2015) 1-7.
Fossil Fuels: The Effect of Zeolite Catalyst Particle Morphology on Catalyst Performance in
the Conversion of Methanol to Hydrocarbons. K.A. Łukaszuk, Pablo del Campo, A. Molino,
M. Nielsen, D. Rojo-Gama, J.S. Martinez-Espin, K.P. Lillerud, U. Olsbye, S. Bordiga, P.
Beato, S. Svelle*, Book Chapter in “Nanotechnology for Energy Sustainability”, B. Raj, M.
Van de Voorde and Y. Mahajan (Ed.) (2017) Wiley-VCH Verlag GmbH & Co. KGaA.
*corresponding author

xii
List of conference contributions
Improved catalytic performance for the methanol to gasoline reaction over mesoporous one-
dimensional ZSM-22 and ZSM-23 zeolites obtained by desilication Pablo del Campo, P. Beato,
S. Svelle.
Oral presentation at the 14th
Norwegian Catalysis Symposium, March 2-3 2014, Trondheim,
Norway
Improved catalytic performance for the methanol to gasoline reaction over mesoporous one-
dimensional 10-ring zeolites obtained by desilication. Pablo del Campo, P. Beato, S. Svelle.
Poster presented for poster symposium at the 16th
Nordic Symposium on Catalysis, June
15-17 2014, Oslo, Norway
Operando time- and space-resolved X-ray diffraction for monitoring the methanol to
hydrocarbons reaction over H-ZSM-22 zeolite catalyst in different conditions. Pablo del
Campo, W. A. Slawinski, R. Henry, M.W. Erichsen, S. Svelle, P. Beato, D. Wragg, U. Olsbye.
Poster presented at the inGAP Closing Seminar, March 3 2015, Oslo, Norway
Influence of post-synthetic treatments on unidirectional ZSM-22 catalyst: Towards improved
clean gasoline catalytic process. Pablo del Campo, P. Beato, S. Svelle.
Oral presentation at the 15th
Norwegian Catalysis Symposium, December 3-4 2015, Bergen,
Norway
Influence of post-synthetic treatments on unidirectional ZSM-22 zeolite catalyst: Towards
improved clean gasoline catalytic process. Pablo del Campo, S. Svelle, P. Beato.
Oral presentation at the 11th
Natural Gas Conversion Symposium, June 5-9 2016, Tromsø,
Norway

1
Scope
he overall objective of this Ph.D. project was to improve the catalyst performance of
unidirectional 10-ring ZSM-22 and ZSM-23 zeolite catalysts in the conversion of
methanol to hydrocarbons with particular focus on catalyst lifetime, while maintaining the
high selectivity towards the aromatic-free alkene fraction.
The work presented herein is based on previous investigations of the group, which showed
that the MTH-shape selective ZSM-22 and ZSM-23 catalysts yield a product spectrum being
rich in C5+ branched alkanes and alkenes and virtually without aromatics. Thus, they are
potential catalysts to yield a product that might be suitable as aromatic-free gasoline after
hydrogenation. However, the investigations outlined the lower stability towards deactivation
of these catalysts in comparison with commercially used ZSM-5 catalyst.
The primarily objective of this work is to prolong the lifetime by introducing mesoporosity in
the one-dimensional ZSM-22 and ZSM-23 zeolites by post-synthetic treatments based on
organic aided desilication in alkaline solution and sequential acid washes. While the
introduction of mesoporosity for more open structures has been extensively examined, very
little work has been reported for 10-ring unidirectional zeolites. It was therefore decided to
carry out an extensive investigation of the preparation and characterization of a large body of
samples prepared by NaOH and surfactant aided desilication under different conditions. Over
time, the study over ZSM-22 was extended to organic assisted desilication with TBAOH, with
the aim of arriving at general observations and predictable procedure for mesopore
introduction in one-dimensional 10-ring materials, which are very prone to pore blocking.
During the work, it was noticed that basic characterization (composition, textural properties,
particle morphology and acidity) was not sufficient to completely understand the relationships
between the zeolite properties and their MTH catalytic performance. It was therefore decided
to employ advanced characterization FTIR spectroscopic techniques combined with sterically
demanding probe molecules and accessibility/uptake measurements to overcome this
challenging issue. Preliminary mechanistic studies were carried out to elucidate the evolution
of the reaction mechanism. In addition, structure-activity/deactivation correlations brought by
time- and space-resolved operando synchrotron methods were performed in order to provide
new insights in the deactivation mechanism of the ZSM-22 catalysts for the MTH reaction.
T

2
During the Ph. D. project large amount of work was carried out related to the MTH reaction
also with other catalysts. For this reason, discussions on the MTH reaction with additional
catalysts are also included in this Thesis.
This Thesis is organized in five main chapters. The first chapter provide a background for the
general aspects of catalysis and zeolites as acid catalysts. In the second chapter an overview
of the energetic, technology and mechanistic aspects of the MTH reaction is given, with
particular focus on previous work concerning the performance of one-dimensional catalysts in
the MTH conversion. Chapter three provides a broad literature survey on the desilication
methods developed to improve the catalytic properties of one-dimensional materials. Chapter
four provides details on the experimental methods used. Chapter five presents a summary of
the results of the work performed during this project. For a detailed discussion of the results
the author encourages consulting the papers collected in the Appendix.

3
1. Introduction
1.1. Catalysis in general
he IUPAC defines catalysis as “the action of a catalyst” and a catalyst is defined as “a
substance that increases the rate of a reaction without modifying the overall standard
Gibbs energy change in the reaction”. Catalysis is, thus, the chemical process of increasing
the reaction rate by the action of a catalyst, which do not affect the thermodynamic
equilibrium composition after the termination of the reaction. A catalyst is not consumed in
the reaction and can be used for successive catalytic cycles.
This definition came immediately from the description brought by J.J. Berzelius in 1835 after
systematically investigating the vague observations recorded until then, and classifying them
as “Catalysis” for the first time [1]. From the XIX century, the application of catalysis have
led to the optimization of most of the chemical and industrial processes, promoted by the
astonishing growth of academic knowledge gained on the field [2]. Certainly, the increase in
the demand of bulk chemicals for the growing mankind activities has been a driving force to
the remarkable development of the catalytic processes. One significant stage in the
development of catalysis happened when Haber and Bosch developed the process for the
fixation of atmospheric nitrogen in the ammonia synthesis in 1909, motivated by the Chilean
embargo on potassium nitrate as a nitrate source [3]. The increase of the catalytic industrial
production had also notable events of the history as a backdrop. For instance, the demands on
explosives based on nitric acid were extremely high during World War One [4]. In the first
period of the XX century, catalysis was mostly developed for the industrial production of
synthetic fuels by innovative technologies such as Fischer-Tropsch and FCC processes [3, 4],
which, for example, contributed to the provision of fuel to the means of transport during
World War Two. From the last period of the XX century the efforts were principally focussed
on the petrochemical industry to cover the automotive demands and other catalytic processes
related to the manufacturing of synthetic polymers. Nowadays, catalysis is involved in about
90 % of the current chemical processes, ranging from the production of fine chemicals to
exhaust gas catalysts [2]. Furthermore, catalysis has gained significance owing to the recent
society concerns on the industry impacts on the environment. The ultimate goal of the use of
catalysts is to lower process investments and operation costs and also increase the selectivity
T

4
or rate of formation of one particular reaction product minimizing the formation of undesired
by-products.
Currently, significant efforts are devoted to exploit the catalytic applications by synthesizing
more selective and stable catalysts and expanding the knowledge towards a molecular-level
understanding of the catalytic reaction, by the development of surface science or in-
situ/operando characterization techniques, computational chemistry and reactor modelling.
Efforts are ongoing to bridge the pressure and material gap to real conditions for practical
applications.
The reason behind the extraordinary application of catalysts is based on the fact that the
catalysed reaction proceeds more efficiently than the ordinary reaction. Figure 1.1a compares
the potential energy diagram of a catalysed and non-catalysed reaction. A non-catalytic
reaction will proceed only if reactants A and B collide with sufficient energy to overcome the
activation barrier (Ea in Figure 1.1). The stronger the chemical bond, the higher the activation
energy needed to break this bond. Formation of new bonds lowers again the energy curve as
the product is formed. A catalyst increases the rate of a reaction by increasing the number of
successful interactions between reactant particles and, thus, provides an alternative route for
the reaction that is energetically favourable (needing a lower activation energy). It does it by
forming an adsorption complex with the reactant with a transient bond, which stabilizes the
transition state. Chemically, it changes the electron distribution and relative orientation in a
way that favours the formation of new bonds, whereas the intermolecular bond of the
adsorbed molecules is weakened and the bond breaking is facilitated [2]. A catalyst does not
lower the original activation energy of the reaction. Note that the non-catalysed curve in
Figure 1.1a is not affected, meaning that if particles collide with enough energy, they will
follow the same way as without the action of the catalyst. However, the majority of the
particles will react via the easier catalysed route.

5
Figure 1.1. (a) Potential energy diagram of a non-catalysed (upper curve) and a heterogeneous catalysed (lower
curve) reaction and (b) Volcano plot showing the catalytic activity of various supported metals for the ammonia
synthesis. Adapted from [2].
The catalytic reaction is fully described as a cycle process in which the catalyst is recovered
unaltered after acting in the reaction. The catalytic process consists of three main steps, i.e.
adsorption, reaction and desorption, as illustrated in Figure 1.1a. The reactant molecules are
first bond to the catalyst surface in a spontaneous adsorption reaction and the Gibbs free
energy is lowered. In a second step, the reactants interact to form the product while they are
bound to the catalyst paying an energy cost (Ea), which is significantly lower than that of the
non-catalysed reaction. The last step is desorption of the product from the catalyst in an
endothermic step, which brings the total Gibbs energy to the same level as that of the non-
catalysed process. After desorption, the catalyst is in the same state as before adsorption and
ready to catalyse the next reaction in the next cycle. This cyclic process is not always ideal
since the interaction between the catalyst and reacting molecules can add some complexity. A
proper energetic balance of all steps is required for successful catalytic process. In other
words, for the completion of a catalytic reaction, this interaction should not be too weak, but
also not too strong. This is the basis of the Sabatier’s principle, illustrated in the so-called
volcano plot in Figure 1.1b for the particular case of ammonia synthesis catalysed with
different supported metals. The catalysts in the left region (red) can dissociate N2 molecule,
but the product nitrogen atoms bound very strongly, hindering them to desorb form the

6
catalytic surface and causing blocking. The reactant is weakly adsorbed on the catalysts to the
right (blue) and they are unable to dissociate the N2 molecule. All show lower catalytic
activity than the optimal catalysts in the centre of the plot (green), with the highest ammonia
production.
Catalysis can be classified in homogeneous or heterogeneous, depending on whether the
catalyst is in the same or in a different phase as the reactants, respectively. There is a third
discipline, named biocatalysis, which involve natural enzymes as very specific catalysts. The
synthetic catalytic processes tend to mimic the chemistry of the enzymatic catalysis in order
to reach the best shape selective properties and highest activity for a targeted process.
This work is focussed on heterogeneous catalytic processes in which reacting molecules
interact in gas phase with a solid catalyst. More precisely, zeolites will be used as solid acid
catalysts and the methanol conversion will be investigated in the gas phase.
1.2. Zeolites as heterogeneous acid catalysts
Zeolites are inorganic crystalline aluminosilicates containing channels and cavities. The
zeolite structure is formed by a three-dimensional framework composed of tetrahedral TO4
building blocks (where T are Si4+
or Al3+
tetrahedrally coordinated atoms) linked to each other
through corner oxygen atoms. The arrangement of these building blocks gives rise to the
different zeolite structures, which are characterized by the presence of well-defined channels
and cavities of molecular dimensions, typically in the range of 4 to 12 Å, as schematically
represented in Figure 1.2. The system of channels and cavities leads to solids with very high
surface area and pores of different sizes. Accordingly, small molecules can enter these pores
whereas larger molecules are sieved out. This concept is exploited to direct the chemical
reaction towards the production of a desired product. Therefore, zeolites belong to the wider
class of materials known as molecular sieves [5, 6].
One defining property of zeolites is their internal channel system, which is determined by the
zeolite crystalline lattice structure. This system can be highly variable in pore size and degree
of interconnection. The zeolite channel system is described by the number of tetrahedral units
that form the ring, the internal ring diameter and the uni-, bi- or tri-directional arrangement of

7
channels, which can be interconnected or not. The number of connected O or T atoms
determines the effective pore aperture of the zeolite channel. Zeolites are defined as small (8-),
medium (10-), or large (12-membered-ring) pore materials, depending on the ring size of the
largest channel. According to the IUPAC Commission on Zeolite Nomenclature, the different
zeolite topologies are named with a three capital letters code [7]. As an example, MFI
topology (ZSM-5, Silicalite-1) is a three-dimensional system formed by the intersection of 10-,
6- and 5-membered ring channels formed from arrangement of pentasil units, whereas TON
topology (ZSM-22. Theta-1, NU-10) is composed of one-dimensional 10-ring channels
(Figure 1.2). Both zeolites are medium pore materials. The rings are, however, not always
perfectly symmetrical due to, among other effects, the strain induced by the bonding between
sub-units or coordination of some oxygen atoms of the ring to cations within the structure.
Additionally, zeolite channels may have small apertures or side pockets, which enlarge the
internal volume.
Figure 1.2. Structure of MFI- and TON- type zeolites and their internal micropore system. Adapted from [8].
Zeolites are naturally formed, but they can also be obtained by synthetic means [5]. It was the
Swedish mineralogist A. F. Cronstedt who discovered the first mineral zeolite in 1756. He
observed that large amounts of steam and water were released upon rapid heating of the
mineral and decided to refer to this material as “boiling stone”, or “zeolite” in Greek (zeo
means “to boil” and lithos mean “stone”). However, since large mineable deposits of natural
zeolites were unknown or hardly exploited, there was no significant commercial application
of zeolites until synthetic procedures were developed. About 200 years after Cronstedt

8
discovery, the New Zealand-born R. Barrer successfully made the first synthetic zeolite in
1948 [5, 8, 9]. Around the same time, zeolites A (LTA), X (Al-rich FAU) and Y (Si-rich FAU)
were discovered by Milton and Breck [9]. Zeolites were first commercialised in 1954 and
used as desiccants and in NG drying by exploiting their hydrophilic properties (see below).
New zeolites for novel uses appeared steadily through the 1960s, but the paramount eruption
of new zeolite structures happened in the last two decades of the XX century [2]. Currently,
approximately 200 zeolites have been identified, and about 40 naturally occurring zeolites are
known [7]. Many synthetic zeolites have analogue structural natural materials, such as
synthetic Mordenite. However, chemical impurities contained in natural zeolites, which are
costly to remove, make synthetic zeolites more attractive for specific applications, in case that
both natural and synthetic form of the same zeolite is available. In applications where purity is
not so important, the cheapness of a natural zeolite may favour its choice.
The chemical composition of a zeolite is determined by the composition of its unit cell. The
zeolite unit cell has the chemical formula [xM2/nO·xAl2O3·ySiO2·wH2O] in the as-synthesized
form [10], where M is the cation with valence n of an element which can belong to the group
IA or IIA of the periodic table, or an organic cation, (x + y) is the number of tetrahedras per
unit cell and w are moles of water contained in the zeolite voids.
The Si/Al ratio calculated from the structure determines the zeolite properties to a large extent.
On this basis, a classification of zeolites according to the silicon content has been established.
Low silica (or, conversely, high alumina) zeolites have Si/Al ratios in the range of 1 to 1.5,
whereas high silica (or low alumina) zeolites show Si/Al from 10 to 200. Zeolites with Si/Al
between these values are considered as intermediates. There are also pure silica molecular
sieves with a Si/Al of theoretically ∞, such as Silicalite-1.
Once certain pore architecture has been synthesized, the second step necessary to obtain a
zeolite catalyst is to introduce catalytically active sites within their pores, such as Brønsted
acidity. In heterogeneous catalysis, an active site is the specific place on the surface of a
catalyst where chemical reactions take place. Identification of the active site is essential to
design better catalysts. The possibility to introduce active sites inside zeolite channels and
cavities in a controllable manner and to identify the nature of these sites by the available
characterization techniques makes zeolites unique solid catalysts when compared with metals,
oxides and sulfides, in which the particular active sites are frequently unknown [11]. If the
zeolite structure contained only SiO4 tetrahedras (Figure 1.3a), it would be electrically neutral

9
and highly hydrophobic and, therefore, it would not have acidic character. Brønsted acid sites
are introduced by isomorphically substituting a Si4+
ion by a trivalent metal cation, such as
Al3+
. This creates a negative charge in the zeolite lattice, which can be compensated by
organic or inorganic alkaline cations. Such zeolites still show no Brønsted acidity. This is
generated by ion exchange of the cations by protons using NH4+ and di- or trivalent cations,
followed by calcination. The proton is bonded to the oxygen atom connected to neighbour Si
and Al atoms, resulting in a bridged hydroxyl group responsible for the Brønsted acidity
(Figure 1.3c) [10, 11]. Theoretically, one proton should be introduced for each Al3+
in the
zeolite framework. Thus, one acid site is generated for each Al atom. Accordingly, the larger
the number of Al atoms (or the lower Si/Al ratio) the higher the potential number of acid sites.
The Si/Al ratio is, thus, a good indicator of the acid site density of the zeolite catalyst.
However, the Brønsted acid sites must have sufficient strength to produce appropriate
catalytic activity, i.e. to donate or partially transfer a proton to the reacting molecule. The
strength of the acidic sites depends, among other parameters, on the zeolite topology and the
framework composition [12].
Figure 1.3. Schematic representation of the molecular structure of a non-acidic zeolite (a), a silanol site located
on the external zeolite surface (b), a Brønsted acid site (c) and possible extra-framework Al species (d).
The total acid site density also depends on the number and type of extra-framework Al (EFAl)
species, which may be generated during the activation processes of the zeolite or post-
synthetic treatments [13]. The nature of these EFAl species remains mostly unknown.

10
However, some studies identified EFAl species as Al3+
, oxoaluminium AlO+, Al(OH)2
+ or
Al(OH)2+
cations, or neutral species such as Al-OH species [12-16]. The active centres
present as Al3+
EFAl species has strong Lewis character, i.e. they are capable to accept an
electron pair from the reacting molecule. Such Lewis sites may modify the acid strength when
interacting with surrounding Brønsted sites, which ultimately affect the catalytic properties of
the zeolite [17, 18]. Other common structural defects encountered in zeolite catalysts are
silanol (Si-OH) groups, formed due to the lack of chemical bonding between two vicinal
tetrahedra located on the external surface (Figure 1.3b), or extra-framework Si (EFSi) species
or silanol nests when a T-atom is missing [12-14, 19, 20].
The control of the chemical composition through the synthesis process is of paramount
importance to tailor not only the number acid sites and acid strength but also the porous
structure. Zeolites are usually synthesized under hydrothermal conditions following the steps
[9, 10]: amorphous sources of silica and alumina are mixed together in an aqueous solution of
a metallic cation source and SDA (template), usually in a basic medium. The resulting
solution is well mixed and then heated at high temperatures in a sealed autoclave. The
crystallization takes place after a certain induction period in which the product is still
amorphous. After this time, crystallization starts by sequential steps of nucleation of the
phases, followed by growth of the nuclei to form larger crystalline crystals. Gradually, all the
amorphous material is replaced by approximately equal mass of zeolite crystals. The final
crystals are recovered by filtration, washed with deionized water and dried at mild conditions.
Harsh activation conditions have to be applied in order to remove the template from the
framework.
Efforts have been devoted to synthesize materials containing other elements than silicon and
aluminium [5, 7]. Similar crystalline structures but with additional tetrahedrally coordinated
atoms, such as phosphorous, as well as ion-exchanged transition metals, can be synthesized.
They belong to the generic group of zeotypes, which includes aluminophosphates (AlPO4),
silicoaluminophosphates (SAPO) and substituted aluminophosphates (MeAlPO and MeSAPO)
molecular sieves.

11
1.2.1. Diffusion and shape selectivity in zeolites
Diffusion effects are decisive for the performance of zeolites as catalysts. When the size of a
reacting molecule is similar to the zeolite pore dimensions, as is the case of acid catalysed
hydrocarbon reactions, the diffusion of the reactant through the micropores to reach an active
site, or the diffusion of the products out of the zeolite crystal, play a crucial role in the
catalytic performance. Zeolites operate in the intra-crystalline regime, which is the more
restricted regime of diffusion in porous materials. This implies that zeolites may be easily
subjected to diffusion limitations if the pore system is restricted. Zeolites with channels of
different pore dimensions cause molecules of different sizes diffuse preferentially through one
or another channel. Differences in diffusivities are then used to increase the selectivity to a
targeted product by control of the pore size of the zeolite catalyst [11], which brings to the
concept of shape selectivity. The shape selectivity concept was first described by Mobil
scientists in 1960 as the ability of zeolites to discriminate reactants, products and reaction
intermediates based on molecular diffusion dominating over their thermodynamic equilibrium
distribution [21]. Shape selective properties are important to avoid undesired side products.
Three types of shape selectivity are exhibited by zeolites [21, 22]:
By reactant shape selectivity, reactant molecules are discriminated on the basis of their
molecular size. Accordingly, molecules in the reactant mixture that are too large to enter
the pore openings are prevented to reach the active sites in the zeolite crystal, whereas
reactant molecules small enough can enter and react in the active sites. As an example,
the linear n-butanol molecule is dehydrated over the narrow-pore A zeolite, but the more
bulky isobutanol, having a larger cross sectional area, is not (Figure 1.4). By this
principle, the two alcohols can be easily separated by choosing the adequate zeolite [3].
Product shape selectivity occurs by discrimination among product molecules. Certain
product molecules are too big to diffuse intact out of the zeolite pores. The alkylation of
toluene by methanol over medium-pore H-MFI zeolite illustrates the product shape
selectivity (Figure 1.4). The primary product of the alkylation reaction is not rich in p-
xylene, since o- and m-xylenes are thermodynamically more favoured. However, H-MFI
yields preferentially p-xylene because its diffusivity is about 1000 times faster than that
of its isomers and, thus, it leaves the zeolite crystal more rapidly. On the other hand, o-

12
and m-xylenes are diffusion limited and remain within the zeolite pores to undergo
further isomerization reactions, which result in increased yields of p-xylene [3].
Transition-state selectivity is characterized by constraints imposed by the zeolite channel
structure on forming molecules during the transition stage. Only certain products from
reactions that involve transition-state complexes small enough or with the appropriate
orientation to accommodate inside the pores are formed, as represented in Figure 1.4. In
transition-state selectivity, neither reactants nor potential product molecules are prevented
to diffuse in or out the zeolite crystal.
Figure 1.4. Examples of the three cases of shape selectivity in zeolites. Adapted from [21].
The intrinsic acidity combined with the tuneable porosity and molecular sieve properties
make zeolites highly active and selective and, therefore, highly applicable in many targeted
catalytic processes. Particularly, the successful application of zeolites as acid catalysts in large
scale petrochemical and refining processes has been extensively demonstrated. A brief
summary of the main breakthroughs in the history of heterogeneous catalysis is given based
on literature [2, 3, 23]. The major advance in zeolite catalysis took place when FAU and MFI
zeolites were added to acid clays and silica-alumina cracking catalysts in the FCC process to
convert oil into fuels and chemicals in the mild-1960s. The use of zeolites allowed higher
conversions and yields, but gasoline with low octane numbers. Few years earlier, Union
Carbide successfully used Y zeolite in isomerization reactions. This catalyst was also applied
to catalytic cracking of heavy oil fractions by researchers of Mobil Oil in 1962. However, it

13
was not until 1983 when they tested the first large-scale commercial cracking facility. Over
time, the zeolite-based FCC technologies evolved towards the production of high-octane
gasoline. Zeolites catalysts have been also applied in the conversion of methanol-to-
hydrocarbons (MTH) since Chang and Mobil co-workers discovered that H-ZSM-5 catalyst
selectively converted methanol into an aromatic-rich hydrocarbon mixture when operated at
long contact times [24]. Further commercialization efforts based on Mobil Oil´s methanol to
gasoline process have been limited by the energy market of that period [25]. A detailed
description of the development of the MTH technologies is given in Chapter 2 (Section 2.2).
The application of zeolites as acid catalysts in hydrocarbon conversion reactions is becoming
increasingly important in today´s oil industry. With today’s increase of the fuel demand, the
use of zeolite catalysts allows the transformation of gas oil and other oil distillate residues into
more environmental friendly fuels, such as lead-free gasoline and diesel. By using zeolites,
the energetic efficiency of a process is improved and emissions and hazardous wastes can be
reduced. Zeolites are also extremely successful catalysts for organic synthesis in the
production of fine chemicals and lower-cost synthetic plastics [2, 6]. Beyond catalytic
applications, zeolites have also high performance in adsorption, gas separation and ion-
exchange processes [2, 6, 26, 27].
1.3. Materials related to this work
Two one-dimensional 10-ring zeolites are the materials employed in the present work: ZSM-
22 and ZSM-23. Figure 1.5 (top) shows simplified representations of the two one-dimensional
channel structures, in which the accessible space inside the pores is represented in blue.
The crystal structures of ZSM-22 and ZSM-23 are closely related to each other due to their
identical structural subunits. Both show orthorhombic crystal system. Both framework
structures are made up by 5-, 6-, and 10-membered rings which are constructed from the same
5-1 secondary building units (see Figure 1.2). These subunits generate non-interconnecting
one-dimensional 10-ring channels parallel to the short 5 Å axis [10]. The channel dimensions
of ZSM-22 and ZSM-23 are practically the same. Nevertheless, there are small differences in
the shapes and the openings, giving rise to different framework topologies with slightly
different framework density. Main parameters are listed in Table 1.1.

14
Figure 1.5. Schematic representation of the channel systems (top) and projection of the framework structure
(bottom) of the ZSM-22 (a) and ZSM-23 (b) zeolites, from IZA web site (http://www.iza-
structure.org/databases/ModelBuilding/TON)
ZSM-22 has a TON topology. The 10-ring channels of TON are elliptical and slightly
zigzag in shape, with dimensions 5.7 x 4.6 Å. The projection of the structure of the cell
parallel to [001] (along the shortest c direction) is shown in Figure 1.5a (bottom). There
are two such 10-membered ring channels per unit cell. The maximum diameter of a
sphere that can be included inside the largest channel is 5.71 Å. TON has a framework
density of 19.7 T-atoms per 1000 Å3 [7, 28, 29].
ZSM-23 has a MTT topology. The tear-drop shaped non-connected 10-ring channels of
MTT show a slight side pocket and dimensions 5.2 x 4.5 Å. The framework structure of
ZSM-23 can be constructed by repeated twining of the ZSM-22 framework after (110)
[30-32]. The projection of the structure of the cell along the shortest a direction is shown
in Figure 1.5b (bottom). The small side pocket makes the maximum diameter of a sphere
that can be included inside the channel increase to 6.19 Å and the framework density
slightly larger than that of TON, with 20.1 T-atoms per 1000 Å3 [7, 30, 33].

15
Table 1.1
Main parameters of the one-dimensional ZSM-22 and ZSM-23 zeolite structures.
Structure Topology 10-ring channel system Max.
diameter1
Framework
density Dimensions Shape Side pocket
ZSM-22 TON 5.7 x 4.6 Å elliptical none 5.71 Å 19.7 T/1000 Å3
ZSM-23 MTT 5.2 x 4.5 Å tear-drop very small 6.19 Å 20.1 T/1000 Å3
1 Maximum diameter of a sphere that can be included in the largest channel.
The templates used in the synthesis gel of one-dimensional materials usually consist of long
hydrocarbon chains with polar species at both chain ends. These templates act as structure
directing agents and direct the crystallization preferentially towards similar needle-like
morphologies for both ZSM-22 and ZSM-23 [29, 34-37]. This can be explained by a directing
effect of the template, minimizing the surface energy of the intermediates as described in the
mechanisms of crystal growth proposed by Cundy and Cox [9].
Only one batch ZSM-22 was in house synthesized, and ZSM-22 and ZSM-23 zeolites were
provided from a commercial vendor. All zeolites were calcined, extensively characterized and
submitted to various post-synthetic treatments with the aim to introduce additional
mesoporosity. The protonated zeolites were catalytically tested in the MTH reaction.

16
2. The Methanol-To-Hydrocarbon Reaction
2.1. Energetic perspectives
rude oil remains as the present world’s leading source for both liquid fuels and raw
materials, accounting for about 33 % of the global energy consumption (Figure 2.1a)
[38]. However, current estimates, based on the up-to-date proved size of oil reserves (some
1700 thousand million barrels) and the increasing demand of energy needs, predict that the
global oil reserves would last for 50.7 years at the current rate of consumption [38]. This,
however, also depends on the development of new crude oil extraction technologies and
unexploited wells. This scenario calls for new feasible alternative energy sources to cover the
global demand, such as natural gas, coal, biomass, atomic energy, hydrogen, urban waste (for
district heating) or even recycled CO2 [39]. It has been estimated that current sources of liquid
fuels will not have the capacity to cover all demand in 2020 [40] (Figure 2.1b). However,
sources for liquid fuels are currently over covering this need. Nevertheless, alternative carbon
sources or new technologies will be important for covering the demand of fuel needs.
Syngas (CO and H2) can be produced from methane (NG) or coal. Methanol is currently
synthesized almost exclusively from fossil-fuel-based syngas using Cu/ZnO/Al2O3-based
catalysts [25], but it can also be obtained from biomass or by direct oxidative conversion of
NG [2]. The MTH technologies can potentially fill the gap for an alternative route to produce
petroleum-related and raw chemicals from C1 sources, which are considerably more abundant
than crude oil. Despite the fact that coal reserves may last for more than one century and coal
remain the dominant energy source in Asia [38], the socio-economical, safety and
environmental adversities associated with coal extraction from mines makes coal not the best
fossil fuel alternative [39]. Biomass technologies still need to be developed to be considered a
real alternative to produce methanol. The economics to produce, for instance, agriculture-
based ethanol to replace fossil fuels is still not favourable [39]. Natural gas, hence, represent
the most convenient alternative source of methanol [25, 41].
C

17
Figure 2.1. World primary energy consumption in million tones oil equivalent from year 1990 to 2015 (a) and
projected world liquid fuels demand and supply (b). Adapted from [38] and [40], respectively. 1Enhanced Oil
Recovery, 2Energy Information Administration, Business as Usual.

18
Nowadays, less than a quarter of natural gas produced annually is burned in flares. As shown
in Figure 2.1a, the remainder natural gas accounted for a considerably 23.8 % of primary
energy consumption in 2015. The estimated natural gas total proved reserves are comparable
but some larger to that of oil (52.8 % at the current rate) [38], also dependent on the new
advances in exploration and recovery methods. As long as natural gas remains abundant, it
appears reasonable to use it as methanol source. Also, the potential greenhouse effect of
methane can be reduced. Regarding the process efficiency, natural gas treatments do not give
solid residues and it is economically favourable to extract and transport as well as flexible in
use. On the other hand, its storage is not easy.
Methanol from natural gas-based syngas does not reduce the current dependence on non-
renewable fossil fuels. This implies that at some point, the synthesis of methanol will have to
turn to alternative renewable technologies, such as the reductive conversion of CO2 recycled
from industrial effluents and exhausts [39]. Interestingly, the use of atmospheric CO2 itself
offers a feasible long-range solution to produce hydrocarbons via methanol, which would
eventually replace fossil fuel technologies and alleviate global warming [39].
2.2. Development of MTH technologies
The methanol catalytic conversion into hydrocarbons was discovered by Chang and Mobil co-
workers in the 1970s. They showed that H-ZSM-5 yielded an aromatic rich hydrocarbon
mixture terminated at C10 when operated at long contact times [42]. This opened a new era of
extensive research interest and commercial efforts for the MTH technologies, which lasts until
today [24, 25]. The Mobil´s methanol-to-gasoline (MTG) process was firstly commercialised
on New Zealand during the oil crisis in the 1980s, with a high-octane gasoline production
over 600 000 ton/year, but later shut down due to the subsequent drop in the oil price relative
to that of methanol [24, 43]. Around the same time, the TIGAS process, also based on H-
ZSM-5, was demonstrated on pilot scale [44]. By combining methanol and DME synthesis in
a single reactor unit and using high pressures and moderate temperatures, the conversion of
syngas towards high-octane gasoline was increased. However, this process was never further
developed due to the global energy market status. Later on, more attention was paid to the
methanol-to-olefins (MTO) reaction for production of light olefins (ethene and propene) from
19
methanol. The UOP/Norsk Hydro MTO technology was proven in a demo plant in 1995 [45].
This process utilizes the H-SAPO-34 catalysts in fluid bed operation to produce a selective
mixture of ethene and propene from methanol. Lurgi developed the industrial process for the
production of propene from methanol (MTP) over H-ZSM-5, which was demonstrated in a
Lurgi/Statoil demo plant and is nowadays commercialized in China [46]. This process
operates at high temperatures and rather low pressures in a parallel fixed-bed setup with feed
injection between beds and product recycle to maximize the yield of propene. Mobil also
developed a fluidized bed process producing either gasoline or light alkenes over H-ZSM-5
depending on process conditions. The produced alkenes could also react to produce gasoline,
lubricants and distillate fuels in the Mobil’s olefin-to-gasoline and distillate process (MOGD)
[41]. Currently, intense commercialization efforts for MTH technologies are ongoing [41].
Figure 2.2. Product fractions produced by the MTG, MTP and MTO processes, from [41].
By adjusting the process conditions and choosing a suitable zeolite catalyst, the MTH effluent
distribution can be varied. Therefore, specific MTG, MTO or MTP processes can be
developed [25]:
To produce a quality gasoline, product molecules must be allowed to diffuse through
channels of at least 10 T-atoms. Two zeolites are outlined as MTG catalysts. H-ZSM-5 is
the preferred zeolite catalyst to produce high-octane gasoline. H-ZSM-5 yields a product
stream typically rich in gasoline-range hydrocarbons with aromatics (Figure 2.2) at
intermediate reaction temperatures (320-420 oC) and high pressure. H-ZSM-22

20
catalytically behaves as a 10-ring zeolite, but with an effective pore size slightly smaller
than H-ZSM-5 and one-directional channel system. It yields a product effluent mainly
composed of aromatic-free C5+ branched alkanes and alkenes, as an effect of its unique
shape selective properties. Despite this catalyst has not been commercialized yet, owing
to its rapid deactivation, the H-ZSM-22-based MTG product might be suitable as
environmental friendly gasoline production.
The archetype MTO catalyst is the zeotype H-SAPO-34. The CHA topology of H-SAPO-
34 is responsible of the product distribution. While aromatic intermediates can be
generated in the large cavities of H-SAPO-34, the narrow pore apertures do not allow
molecules larger than C4 to diffuse out of the crystal. Thus, aromatics react further to
smaller hydrocarbons before they can diffuse out. As a result, a product stream rich in
ethene and propene is selectively obtained (Figure 2.2). Zeolites with 10-ring channels
can also be tuned to more olefin production. Bhan et al. proved that by increasing the
crystal size of H-ZSM-5 the selectivity towards light olefins can be enhanced [47].
By using high temperatures and low pressures, H-ZSM-5 can catalyse the MTH reaction
to produce propene (MTP) with some by-product LPG-type fuel and lower gasoline
content, as shown in Figure 2.2.
2.3. Evolution of the reaction mechanisms
A MTH-based catalyst can transform methanol into hydrocarbons in an apparently single step
or black box. Far from it, the extensive research carried out in the last decades has shown that
the MTH mechanism is indeed very complex, but it can be understood by applying a number
of approaches. Isotopic labelling studies, single reaction kinetics and novel computational and
experimental methods, such as advanced spectroscopic techniques, gave breakthrough insight
into the reaction and deactivation mechanisms [25]. The MTH mechanisms are difficult to
determine owing to the heterogeneity of the adsorption and the transport limitations imposed
by the pore system of the zeolites [24]. However, it is the same pore system that allows a
rational study of the reaction. By choosing the appropriate zeolite catalyst and technique, the
MTH reaction could be described in detail [25].

21
The MTH reaction is highly exothermic. Generally, it proceeds via first alkene formation
from an equilibrium mixture of methanol and DME. The formed alkenes react further to a
mixture of higher alkenes, alkanes and aromatics in the so-called hydrocarbon pool (HCP). It
has been demonstrated that the MTH reaction is autocatalytic [48]. This means that small
amount of products can catalyse the reaction and the rate of conversion of this route is
substantially higher than the rate of direct C–C bond formation. Last findings demonstrated
that the MTH reaction takes place over hybrid organic-inorganic sites, where alkene and/or
aromatic molecules act as autocatalytic species within the catalyst pores in the so-called dual
cycle mechanism [25]. The main mechanistic findings are listed below and the relevant
proposals are shown in Figure 2.3.
Chen and Reagan proposed the autocatalytic nature of the MTH reaction [48].
Dessau an co-workers co-fed 13
C labelled methanol with 12
C-alkenes and -arenes over H-
ZSM-5 and proposed that the MTH reaction proceed via sequential alkene methylation/
cracking steps [49, 50], as illustrated in Figure 2.3a. The initial alkenes come from C-–C
coupling reactions, but once trace impurities of C2+ are formed, they are capable to
initiate the autocatalytic reaction. Aromatics were proposed as final products resulting
from hydrogen transfer reactions and not act as active centres for product formation.
Langner [51], Mole and co-workers [52, 53] carried out co-feed experiments by reacting
cyclic alcohols and isotopic labelled aromatics together with methanol. The expeiments
supported Dessau’s indirect mechanism for alkene formation, but involving also
methylated cyclic or aromatic as intermediates.
The MTH mechanism was in part clarified when Dahl and Kolboe co-fed supposed
intermediates (ethene and propene) and 13
C labelled methanol over the zeotype H-SAPO-
34, which yields predominantly C2-C4 alkenes [54-56]. The experiment showed not only
singly and triply, but also doubly 13
C labelled propene. This suggested a more complex
picture than a simple consecutive mechanism. The HCP concept, consisting in fragments
of (CH2)n which react repeatedly with methanol to form other intermediates or products
(Figure 2.3b) was proposed. The stoichiometry of the HCP was not specified.

22
The groups of Haw and Kolboe simultaneously identified polymethylbenzenes (PMBs) as
principal HCP species in H-SAPO-34 [57-59]. Later studies supported the importance of
PMB intermediates in H-Beta zeolite [60, 61]. Additional studies by Hunger et al.
evidenced the HCP mechanism in H-ZSM-5, H-SAPO-34 and H-SAPO-18 catalysts [62-
64].
Steady-state isotope transient experiments over H-ZSM-5 catalyst showed that ethene and
lower PMBs with up to four methyl substitutes displayed similar contents of 13
C, whereas
the higher alkenes (C3+) were more reactive for the 13
C methanol than the PMBs [65, 66].
The dual cycle concept, by which the HCP proceeds through two interconnected
mechanisms running in parallel (Figure 2.3c), was proposed. In the aromatic or arene
cycle, the aromatic molecules get methylated until higher PMB are formed, which either
leave the catalyst pores or split to lighter alkenes (mainly ethene) by de-alkylation
reactions. In the alkene or olefin cycle, alkenes are successively methylated up to a
certain size and leave the pores or are cracked down to lighter alkenes, similarly as
proposed by Dessau [49, 50], however, with negligible contribution of the alkene cycle to
ethene formation. Both cycles are connected through cyclization and hydrogen transfer
reactions.

23
Figure 2.3. Evolution of the MTH mechanisms. Schemes of the (a) methylation/cracking mechanism proposed
by Dessau, adapted from [49], (b) hydrocarbon pool mechanism proposed by Dahl and Kolboe, adapted from [55]
and (c) dual cycle mechanism proposed by Svelle and co-workers, reproduced from [67].
The dual cycle mechanism is the currently accepted mechanism for the MTH reaction. It
shows that not only aromatics, but also alkenes can act as reaction centres for the autocatalytic
reaction. The relative importance of each cycle as well as the structure of the intermediates

24
depend on the catalyst structure and process conditions [25]. It was shown that medium pore-
sized zeolite catalysts favoured the alkene cycle and only accommodated low substituted
PMBs, whereas in catalysts with pores or cavities large enough to accommodate larger PMBs,
the arene cycle is more favoured [68-72]. However, it has also been suggested that low
reaction temperatures and high pressures may favour the alkene cycle over large pore zeolites
[73, 74] as well as catalysts with low acid strength [67, 75].
The implication that aromatics only participate in one of the cycles and that the reduction of
the catalyst pore size imply a lower contribution of the arene cycle, raised the idea of whether
it was possible to suppress the aromatic cycle by choosing the appropriate catalyst
architecture. This was addressed using the narrow-pore one-dimensional ZSM-22 zeolite as
catalyst. Steady-state isotopic transient studies demonstrated that H-ZSM-22 strongly favours
the alkene cycle, while the formation of aromatic products from methanol through the arene
cycle was virtually suppressed [76-79]. This resulted in low yield of ethene, virtually no
aromatics and high selectivity towards branched C5+ hydrocarbons. The zeolite pore structure
was the dominant parameter to force the operation of only one of the cycles.
The mechanism is more complex for catalysts that allow the operation of both cycles. In this
sense, Bhan and co-workers introduced a descriptor by which the relative rates of propagation
of the alkene and arene cycles that can operate in MFI catalyst can be described [80].
Assuming that ethene was formed essentially from the aromatic cycle and 2-methylbutane +
2-methyl-2-butene were preferentially from the alkene cycle, the ratio between them was used
to describe the relative propagation of the cycles. The influence of temperature, co-feeding
and particle size was also studied and related to particular properties of the catalyst [47, 81].
2.4. Shape selectivity in MTH
The product distribution of the MTH reaction is strongly controlled by the shape-selective
effects of the diverse zeolite topologies [25], although the effect of the Si/Al ratio, acid site
density and strength or crystal size should not be discarded [76]. The ideal study should be
focussed only in the pore topology while maintaining the rest of the properties uniform.
Reactant shape selectivity will not influence the MTH reaction, since methanol is small

25
enough (3.6 Å) to enter the pores of all the MTH-based zeolites. However, both product and
intermediate shape selective effects affect the effluent distribution.
The size of the larger product is controlled by the dimensions of the channel by product shape
selectivity. Figure 2.4 shows a correlation between the cross-section area of the largest
channel of a series of zeolite catalysts and the kinetic diameter of the largest product formed
in appreciable amounts in the MTH reaction over each material. Small pore 8-ring openings
limit the products to linear alkenes. Medium pore size channels of 10-ring zeolites may limit
the effluent products to either branched alkenes or aromatics, depending on small size
variations. Smaller 10-ring channels produce branched alkenes and alkanes, while larger
channels yield mainly methylbenzenes. Zeolites with 12-ring channels provide essentially no
product shape selectivity and, hence, the heaviest methylated benzene (HexaMB) is the
largest product.
Figure 2.4. Kinetic diameter of the largest product vs. cross section of the largest pore. Reproduced from [76].
Cavities and side-pockets present on the main channels, as well as channel intersections of
three-dimensional structures, also affect the product distribution, as they provide larger space
where reactions may occur. Changes in product selectivity induced by these parameters make
the discrimination between different shape selective effects complex [21, 76]. The selectivity
over small pore zeolites is restricted by product-shape selectivity. However, the product

26
selectivity over medium (10-ring) and large (12-ring) pore zeolites is found to be further
restricted by intermediate shape selectivity [76]. Zeolites which large pores and/or extra space
favour the more space-demanding hydride transfer reaction, by which the aromatics and
alkanes are produced from higher alkenes. As the size of the zeolite structure decreases to
medium pore sizes and without alterations, the arene-based reactions and alkene-based
cracking reactions are less favoured, whereas methylation reactions, which are less space-
demanding, are increasingly favoured. Hence, the product spectrum ranges from aromatics
and alkanes rich mixture to a product rich in C5+ alkenes [76]. The different product
distribution as a result of slight variations in the same pore sizes is illustrated with the three-
dimensional ZSM-5 and the one-dimensional ZSM-22 10-ring structures (Sections 2.2-2.3).
The influence of the cavities or side-pockets is illustrated with the comparison of two one-
dimensional 10-ring structures: H-ZSM-22 (TON) and H-EU-1 (EUO), which contains large
12-ring side cavities that provide significantly more space than the 10-ring channels. Product
distributions containing larger products than would be expected based on the medium sized
channel size of EUO were reported [78]. The involvement of the more spacious pockets open
to the external surface of the H-EU-1 crystal allows the formation of aromatics otherwise
prevented in the small unmodified 10-rings. It should be mentioned that the H-EU-1 crystals
employed in the study were smaller than H-ZSM-22 crystals, so reactions occurring on the
external surface area may be more pronounced for H-EU-1.
2.5. Challenges of one-dimensional zeolites
Although aromatics boost the gasoline octane number, there are limits on the aromatic content
in gasoline fuels, since they can cause cancer [82]. While the carcinogenic aromatics content
of low-silica H-ZSM-5-based MTG gasoline (23-35 vol%) is not particularly high compared
to standard gasoline [41], it is still higher than desired. An environmental friendly gasoline
consists of branched alkanes of 5-10 carbon atoms and is free of aromatics [82]. Teketel et al.
firstly demonstrated that it was possible to obtain a product virtually without aromatics under
appropriate conditions over H-ZSM-22 (TON) catalyst [79]. The H-ZSM-22-based MTG
product, being rich in C5+ aromatic-free branched alkanes and alkenes (Figure 2.5) meets the

27
fuel requirements and might be suitable as high octane gasoline after hydrogenation.
Alternatively, the C2-C4 alkene rich product might be utilized as an alkylation feedstock.
The potential of 10-membered ring one-dimensional zeolites as catalysts for MTH reside in
their ability to produce environmental friendly gasoline [41, 78, 79]. Other unidimensional
10-ring zeolites closely related to the ZSM-22 structure with similar catalyst properties were
also investigated as MTH catalysts [78]. Figure 2.5 shows the C2-C4, C5+ aliphatic and
aromatic yields for H-ZSM-22 (TON), H-ZSM-23 (MTT), H-EU-1 (EUO) and H-ZSM-48
(MWW) zeolite catalysts versus methanol conversion together with the pore system of each
zeolite. The small side pocket of MTT zeolite did not affect the product distribution. On the
other hand, the slightly larger channel diameter of the MRE structure strongly affected the
product distribution and notable amount of aromatics were observed in the C5+ fraction, in
agreement with previous discussion (Section 2.4). The effluent of this material showed
significantly lower selectivity for C5+ hydrocarbons but appreciable formation of aromatics.
Therefore, H-ZSM-22 and H-ZSM-23 are suitable catalysts to produce environmental friendly
gasoline.
Figure 2.5. Yields of various hydrocarbon products as a function of methanol conversion at 400 oC and WHSV
= 2 ggcath-1
and illustrations of the pore systems for the one-dimensional catalysts. For the H-ZSM-22 catalysts,
“C” and “H” denotes commercial and in house synthesized, respectively. Adapted from [41].

28
The major drawback associated with one-dimensional 10-ring zeolites is the low activity for
methanol conversion as well as the limited lifetime or rapid deactivation by coking, compared
to commercially used zeolite catalysts, such as H-ZSM-5 [25, 78, 79, 83]. Teketel et al.
demonstrated that high contact times or low weight hourly space velocities (WHSV) (< 4
gMeOHgcat-1
h-1
) were required to obtain appreciable conversion of methanol over H-ZSM-22 at
400 oC [79]. Li et al. similarly found that a WHSV of 1 ggcat
-1h
-1 was needed to achieve
certain conversion at 450 oC [84, 85]. The low activity of H-ZSM-22 was further explored by
Janssens et al. using an autocatalytic deactivation model [86]. They found that the critical
contact time (i.e. the contact time needed to launch the autocatalytic MTH reaction) was much
higher for H-ZSM-22 than for H-ZSM-5, meaning that H-ZSM-22 necessitates longer time
for the autocatalytic reaction to dominate the reaction rate. Similar consideration can be
drawn for H-ZSM-23, which displayed a critical contact time similar to H-ZSM-22 under the
same operation conditions [41, 87]. Screening tests of all these catalysts showed that WHSVs
below 4 ggcat-1
h-1
were required to achieve initial conversions near 100 %. An increase in
space velocity resulted in more rapid deactivation, in agreement with previous studies [79, 87].
The low lifetime of one-dimensional catalysts is evidenced in the methanol conversion versus
time of stream plot shown in Figure 2.6.
The total methanol conversion capacity (i.e. the total gram amount of methanol converted into
hydrocarbons per gram of catalyst before complete deactivation) serves as quantitative
comparing parameter of the MTH catalytic performance, given that the acid site density of the
catalysts is similar. Teketel et al. showed that a maximum conversion capacity for H-ZSM-22
of 12 gMeOHgcat-1
, with a WHSV of 2 gg-1
h-1
[79]. While this value was lower than the
conversion capacity of the commercially used H-SAPO-34 catalyst [88], the lower amount of
acid sites in H-ZSM-22 means that the conversion capacity per acid site in this catalyst was
higher. However, the H-ZSM-22 conversion capacity was estimated in the order of one
twentieth of that of H-ZSM-5 with similar acid site density [86].

29
Figure 2.6. Comparison of the methanol lifetime between the one-dimensional zeolite catalysts and the
commercially used H-ZSM-5 at 400 oC and WHSV = 2 ggcath
-1. Reproduced from [41].
The rapid deactivation of the one-dimensional catalysts is a direct consequence of their
restricted channel structure. The channels of the zeolite can be considered tunnels inside the
catalyst crystal within which small molecules may diffuse in and out. It has been mentioned
that the shape and connectivity of these tunnels play a major role in determining which
products are actually formed, but also influence the stability against coking. Figure 2.7 shows
that in the case of zeolites with three-dimensional (3D) pore architecture, the tunnels intersect
each other and the number of pore openings multiplies, making the structure more resistant
against pore blocking. In one-dimensional zeolites, however, the channels go from one side to
the other without crossing, so the diffusion of molecules throughout the crystal is limited and
coke deposits can easily block the pores and deactivate the catalyst.
Figure 2.7. Schematic representation of the dimensionality of zeolites.

30
The mechanism of deactivation during the MTH reaction has been recently reviewed by
Olsbye et al. [83]. It is assumed that coke deposits are the main cause of catalytic deactivation
in MTH either by pore blocking or poisoning the active sites. However, the autocatalytic
nature of the MTH reaction makes deactivation studies a very challenging task. Firstly, they
are to be carried out at full initial conversion to ensure that the autocatalytic reaction is
dominating methanol conversion. Secondly, species which are active intermediates (such as
PMBs) in one topology (CHA) may be deactivating species in another topologies (TON, MTT)
[25]. Olsbye et al. employed two different approaches to model the deactivation behaviour of
the MTH reaction: First, an autocatalytic deactivation model was proposed, assuming that
deactivation is proportional to methanol conversion [89]. It was found that the slope of a
linear plot of catalyst lifetime to 50% conversion versus contact time characterized the
deactivation of H-ZSM-22. Secondly, it was assumed that coke was only formed by the
reaction between methanol and aromatic species [86]. Recently, Lercher et al. compared the
MTH reaction over H-ZSM-5 in plug-flow and back-mixed reactors and hypothesized that the
evolution of coke species depends on the position of the catalyst particle in the catalytic bed
[90]. In the early stages of the MTH reaction, the H-ZSM-5 zeolite deactivated fast by
blocking of individual Brønsted acid sites due to oxygen-containing surface species. These
species were further transformed to aromatic compounds and deactivation proceeded by
forming large coke species that blocked the catalyst pores.
The shape of the deactivation curve can be correlated with the mode of coke formation. It was
proposed that the typical S shape of the MTH deactivation curve, involving a short period of
full conversion followed by a reduction of the slope and final deactivation, appears when
methanol is strongly involved in reactions leading to deactivation by coke and the
interconversion reaction among products contribute less to the catalyst deactivation. On the
other hand, a progressive reduction of the curve with time on stream (TOS) as the product
concentration decreases was indicative of a different mechanism of deactivation, by which
coke is formed mainly from reaction products.
Very recent spatio-temporal studies performed by Rojo et al. [87] suggested that, for one-
dimensional 10-ring topologies (TON and MTT), methanol is strongly involved in reactions
leading to coke formation, whereas products alone are not involved in coke forming reactions,
validating previous investigations [83]. Other studies also showed that the accumulation of
molecular coke occurred mainly within the micropores [25, 83, 87] . Other catalytic properties,
such as acid strength and acid site density, may also have a strong influence in the

31
deactivation mode [83, 91]. These findings were previously proposed by space- and time-
resolved operando XRD investigations which are included in Paper I, and will be elaborated
in Chapter 5.
The diffusion limitations imposed by the one-dimensional 10-ring structures might be
partially solved by using one-dimensional zeolites but with larger channel size, such as 12-
membered ring structures. MTH research has focussed on H-Mordenite (MOR), a one-
dimensional 12-ring channel with side pockets. This zeolite, however, showed also rapid
deactivation mainly caused by the involvement of aromatics as coke precursors at 350–400 oC
[87, 92]. However, better catalytic performance in MTH has been shown for MOR catalysts
when decreasing the acid site density by Park et al. [92].
The major challenge associated with the materials relevant to this work (ZSM-22 and ZSM-23)
is to increase the low lifetime in MTH conversion while maintaining the selectivity towards
low-aromatic gasoline products. A significant extension of the catalyst lifetime will lead to
less frequent regeneration and might allow regular fixed bed operation, thereby significantly
lowering process investment and operation costs.

32
3. Catalyst Improvement by Post-synthetic
Approaches
he optimization of the MTH catalytic performance can be reached by changes in the
operation conditions or in the catalytic properties. This work is mainly focussed on the
improvement by modification of the catalyst properties, particularly by means of post-
synthetic treatments.
It is the presence of differently sized micropores that give rise to the use of zeolites as shape
selective catalysts. However, the micropore system also limits the applicability of zeolites as
MTH catalysts, often imposing diffusion limitations and preventing access to the active sites
of the zeolite crystal [93]. Furthermore, ZSM-22 and ZSM-23 zeolites crystalize preferentially
as long needles, with the 10-ring channels running in the direction of the needles. Several
approaches have pointed to the crystal morphology as a key factor for solving the accessibility
problems of the catalyst. In particular, an increased number of pore openings are accessible by
using nanosized crystals or by introducing a secondary network of mesopores into the crystal.
This can be achieved by a variety of synthetic (bottom-up) and post-synthetic (top-down)
approaches. The preparation of such hierarchical zeolites and their improved catalytic
performance has been extensively reviewed [13, 94-106].
In these materials molecules diffuse closer to the Knudsen diffusion regime, which is
characterized by diffusivities 2-3 orders of magnitude larger than those observed in the more
restrictive intra-crystalline regime typical for the purely microporous zeolites [96, 107].
Figure 3.1a, b shows preferential Knudsen pathways in the mesopores (green) than random
diffusion paths within the micropores (yellow). Additionally, diffusivity in medium sized
zeolites can be specially affected by amorphous species or structural defects in the crystal [11,
108, 109].
T

33
Figure 3.1. (a) Magnitudes of diffusion coefficients in different diffusion regimes as a function of pore size and
illustration of the diffusion of different sized molecules within mesopores (green) and micropores (yellow). (b)
Section of a microporous material with embedded interconnected mesopores. Solid lines show molecular
trajectories of intra-crystalline diffusion in micropores (yellow) and Knudsen diffusion in mesopores (green). (c)
Relative position of micro- and mesopores in hierarchical zeolites. Adapted from [96, 107].
Only having different pore diameters (micro/meso) is not the only requisite for the zeolite to
be considered hierarchical. The pore systems needs to be efficiently interconnected into well-
organized open pathways [102]. If the created mesopores are occluded within the existing
micropore system without exiting to the outer parts (case 4 in Figure 3.1c), the catalyst will
show diffusion limitations. Hierarchical zeolites must combine the intrinsic catalytic
properties of microporous zeolites and the facilitated access and transport in the created
mesopore network. The secondary porosity can be either intra- (created within the crystal) or
inter-crystalline (agglomerated particles or sheets), as illustrated in cases 2 and 3 of Figure
3.1c, respectively, or even a combination of those.
The effectiveness factor (η), which relates the reaction rate with the intrinsic chemical rate, is
generally used in heterogeneous catalysis to illustrate the different degree of catalyst
utilization [96, 102]. It is generally presented as a function of the Thiele modulus (ϕ), as in
Figure 3.2b. Large Thiele modulus indicates that the diffusion rate is low and diffusion,
instead of kinetics, limits the overall reaction. High Thiele modulus and low effectiveness
factor results in a poor utilization of the catalyst. In these cases, the concentration throughout
the catalyst crystal (c) is much lower than the surface concentration (cs) and c/cs approaches
zero (Figure 3.2a). Full use of the catalyst particle is associated with a kinetically-controlled
regime with no diffusion limitations with Thiele modulus close to zero and effectiveness

34
factor close to unity. In these cases, the surface concentration approximates the concentration
throughout the catalyst and c/cg approaches one. In order to maximize the effectiveness factor,
the diffusion length (L) has to be minimized, and this can be reached with hierarchical zeolites.
Figure 3.2. (a) Concentration profiles in a zeolite crystal with slab geometry at different Thiele modulus. (b)
Effectiveness factor as a function of Thiele modulus. (c) Formulas of concentration profile, Thiele modulus and
effectiveness factor. Adapted from [102].
Post-synthetic treatments usually involve destruction of part of the zeolite structure.
Depending on the extracted zeolite atoms, these treatments are divided into dealumination and
desilication. Dealumination strategies involve leaching of Al from the zeolite framework,
usually by steaming at high temperatures. During desilication, Si species are leached out of
the zeolite framework and mesopores can be created. Desilication with alkaline solutions,
usually NaOH, is the most employed technique to create mesoporosity in zeolites, owing to
the efficiency and simplicity of the method. More advanced techniques involve the addition of
different molecules to the solution usually referred as pore directing agents (PDA), such as
surfactants or alkylammonium hydroxides. This may affect the zeolite catalytic properties in
different ways. Further strategies involve a secondary step of acid leaching in order to solve
the limitations encountered by the aforementioned methods.

35
The preparation, characterization and catalytic effects of desilicated ZSM-22 and ZSM-23
zeolites have been extensively investigated in this thesis (Papers I-III). Mixtures of NaOH
with CTAB (cetyltrimethylammonium bromide) or TBAOH (tetrabutylammonium hydroxide),
as well as subsequent acid washing, were employed, thereby encompassing the array of
desilication methods reported. Along this chapter, the different desilication methods will be
presented, with particular emphasis on one-dimensional zeolites. Table 3.1 (showed at the end
of the chapter) presents a summary of all relevant studies dedicated to introduce mesopores in
one-dimensional 10-ring and 12-ring zeolites by desilication post-synthetic treatments.
3.1. Desilication by alkaline treatment
Desilication is based on the attack of the hydroxyl ions of the alkaline agent to the framework
Si atoms. The preferential removal of Si results in a reduction of the Si/Al ratio and partial
dissolution of the zeolite structure, which might be accompanied by mesopore formation. The
amount of Si leached out strongly on the number of accessible Si-O linkages. The first
challenge is, thus, carry out proper calcination of the microporous zeolite in order to allow
larger crystal areas susceptible to mesopore formation [110].
Process conditions such as duration, temperature, base concentration or solid-to-liquid ratio,
have a strong influence on the mesopore formation [106]. Generally, more severe conditions
generate larger mesopores. However, since different zeolites have different structural
properties, desilication parameters need to be adjusted for each particular topology to avoid
inefficient dissolution or, on the contrary, excessive loss of material or reduced crystallinity.
Zeolite properties, such as chemical composition and structural features, also greatly affect
the sensitivity to framework dissolution and mode of mesopore creation by alkaline treatment.
General findings applicable to various topologies will be described now.
The mechanism of mesopore formation is markedly dependent on the Al concentration and
distribution [111-114]. The negative charge introduced by an Al atom in local framework
positions prevents the OH- attack to surrounding Si atoms and zeolite dissolution is prevented
[111]. Therefore, Al-rich zeolites are less susceptible to mesopore generation by desilication
than high silica zeolites. High Si/Al ratios, however, result in an excessive dissolution of the
framework. In this sense, Groen and co-workers found an optimal Si/Al range of 25 to 50 for

36
the generation of uniform mesoporosity in MFI framework while maintaining the crystallinity
[109, 114], as illustrated in Figure 3.3a. Location of gradients in Al concentration also
influences the mechanism of mesopore formation. Mesopores will be preferentially developed
from low alumina framework environments, as demonstrated by Al-zoning experiments
performed on desilicated ZSM-5 crystals [94, 106, 113, 115]. Additionally, the nature of the
Al species may impact desilication by alkaline treatment. Alkaline treated ZSM-5 zeolite with
high degree of non-framework Al showed low Si extraction and, consequently, limited
mesopore development [116].
Table 3.1 shows that all the desilicated 10-ring zeolites have Si/Al ratios within the optimal
range of mesopore generation found for MFI zeolites. On the other hand, some studies
reported increased mesopore surface areas even for 12-ring MOR zeolites with relatively low
Si/Al after NaOH treatment [117-121]. However, the degree of mesopore surface created was
lower than for other 12-ring desilicated structures listed in Table 3.1. Muraza et al. [122]
showed that the high Si/Al ratio of a ZSM-12 MTW zeolite was neither an impediment to the
mesopore development by alkaline treatment, when desilication was carried out under
microwave irradiation. Also a first dealumination step previous to desilication has been used
for increasing the Si/Al ratio and favour mesopore creation in initially high alumina MOR
zeolites [118, 120].
Defects or intergrowths within the zeolite crystal may also strongly influence the mode of
mesopore creation. Ogura et al. [123] proposed the formation of mesopores by removal of the
less resistant amorphous SiO2 species along boundaries between twining MFI crystals and
Svelle et al. [124] showed that for MFI zeolite crystals with high number of defects, the Si/Al
effect becomes less important and mesopores are formed preferentially from the defects or
intergrowths (Figure 3.3b).

37
Figure 3.3. (a) Effect of the Si/Al on the desilication process and developed mesopores surface area (ΔSmeso) and
(b) relationships between effects of defects/intergrowths and Si/Al ratio on the mesopores formation during
desilication of MFI type zeolites. Adapted from [102] and [124].
With respect to the topology, it appears obvious that more open structures with two- or three-
dimensional connected channels or large cavities would require less severe conditions to
generate effective mesopores within the zeolite crystal than denser one-directional zeolites
with similar composition [125, 126]. From Table 3.1, intra-crystalline type mesopores with a
narrow size distribution typically of 5-10 nm in size are generally generated within 12-ring
zeolite crystals, whereas similar NaOH treatments often results in a higher contribution of
inter-crystalline type of mesopores over 10-ring structures. Additionally, pores of different
shape and size can be generated depending on the location where the zeolite framework has
been dissolved. For instance, if Si areas connecting channels and/or cages are dissolved, new
accessible pores will be created in the zeolite structure. This possibility to open new volumes
is limited for one-directional channel structures.

38
The morphology of the zeolite crystal may also impose limitations to develop intra-crystalline
mesopores. Verboekend et al. investigated the mechanism of mesopore formation by alkaline
treatment over different morphologies and concluded that the efficiency of the desilication
method and the type of mesopores are strongly influenced by the size of the parent zeolite
crystal [127]. If the smallest dimension of the crystal decreases to the typical mesopore size
range (5-10 nm), the introduction of intra-crystalline mesoporosity by alkaline treatment was
found to dramatically decrease. The short thickness of the needle-shaped crystals
characteristic of one-dimensional zeolites favours the formation of inter-crystalline type of
mesopores created by roughening of the crystal surface or fragmentation of the crystallites.
For 10-ring zeolites, most of the studies reported increased mesopore surface attributed to the
presence of both intra- and inter-crystalline mesopore with broad distribution of mesopore
sizes (Table 3.1). Inter-mesoporosity generally resulted in lower developed surface area than
the one associated with intra-crystalline mesoporosity, generated in larger 12-ring zeolites
crystals (plate- and beam-like) under similar conditions. Noteworthy, an exceptional increase
in external surface was observed by Liu and co-workers on a ZSM-22 (TON) zeolite modified
by alkaline desilication [128]. On the other hand, Ahmed et al. reported loss of external
surface area on desilicated EU-1 (EUO) zeolite [129], most likely caused by the deposition of
EFAl species on the crystal surface. van Laak et al. [121] demonstrated inter-crystalline
porosity between MOR coffin-shaped crystals with limited dimensions.
Despite desilication by alkaline treatment selectively removes Si from the zeolite framework,
it is usually accompanied by framework Al extraction, especially in high alumina zeolites.
With increasing desilication conditions, a larger number of amorphous EFAl species can be
redeposited in the zeolite crystal. Increased concentration of EFAl species is usually
associated with increased Lewis acidity. In addition, desilication treatments may lead to other
structural effects, such as T-OH groups or hydroxyl silanol nests as extra-framework Si
species (EFSi) [13]. These species might partially block the zeolite pores and modify the
acidic properties of the mesoporous material, as previously mentioned in Chapter 1.
The realumination process affects particularly one-dimensional medium pore size structures.
Table 3.1 shows that that mesopore generation upon alkaline treatment is generally
accompanied by a drastic reduction of the micropore volume, caused by redeposited EFAl
species. If these species are formed from framework Al, a reduction of the Brønsted acidity is
generally accompanied by generation of Lewis acidity. A sequential acid step washing can
restore the microporosity. A different scenario is found for the reported 12-ring zeolites. For

39
MOR zeolites, mesopores were usually generated without altering the micropore volume or
acid site density. On the other hand, some studies reported a reduction of the micropore
volume for desilicated MOR, MTW and IFR structures (Table 3.1). Most of these 12-ring
treated samples maintained the Brønsted acidity, whereas others showed reduced acidic
properties as a consequence of the deposition of amorphous EFAl or EFSi species. EFAl can
be generated without drastically reducing the density of Brønsted acid sites [121, 130-132].
3.2. Additional pore directing agents
Desilication with NaOH is known to occasionally result in the destruction of the zeolite
framework. The treatment is also not very specific with respect to the size of the mesopores
developed. Instead, treatments combining NaOH with other agents such as surfactants or
hydroxides or various organic (tetralkylammonium) cations, tend to result in controlled
mesopore size. These methods are particularly appealing for high silica zeolites, for which the
desilication via alkaline treatment alone results in excessive zeolite dissolution [133].
3.2.1. Alkaline-surfactant combined methods
The addition of micelle-forming surfactants to the alkaline solution protects the zeolite
structure against the attack of the OH- groups and provides better control of the mesopore
development, irrespective of the Si/Al ratio. This strategy usually employs CTAB as
surfactant under mild conditions and longer dissolution times than alkaline desilication. Such
treatments often results in lower loss of material compared to alkaline desilication.
The NaOH attack to the Si-O bonds during desilication results in the dissolution of zeolite
fragments. Surfactant molecules, with the positive-charged surfactant polar end pointing to
the aqueous solution, may connect to the dissolved zeolite fragments and slowly induce
reassembly or re-deposition of them to the zeolite structure, as schematically represented in
Figure 3.4c. The process is therefore known as surfactant-assisted recrystallization. It has
been mostly applied to FAU, MFI and MOR zeolites [98, 100, 134]. Ivanova et al. [134]
clarified the mechanism of zeolite recrystallization by an extensively analysis of the

40
intermediate products recovered during each recrystallization step over as-synthesized and
protonated MOR. The proposed mechanism involved a first rapid proton ion-exchange with
Na+ cations and formation of small mesopores within the crystals, followed by diffusion of
CTAB molecules in the intra- and inter-crystalline spaces of the zeolite and ion-exchange of
Na with CTA+ cations. Finally, micelle formation and condensation of siliceous fragments
around micelles both in the intra and inter-crystalline mesopores occurs. Surfactant species
embedded in the zeolite crystal are eventually removed by calcination and pores of
dimensions determined by the micelle size are created. Accordingly, by varying the chain
length of the surfactant, the size of the created mesopores can be tuned to a range of pore size
distributions [135, 136]. For instance, the addition of CTAB surfactant with C16 chain length
in the desilication medium typically give 3-10 nm mesopores within the zeolite crystals.
A two-step recrystallization process, where the zeolite is partially dissolved in NaOH solution
and then treated with CTAB, also leads to mesopores with controlled size. Ivanova and co-
workers reported the formation of new mesoporous phases over MOR zeolites using this
method [137]. Variation of the NaOH concentration resulted in different degrees of
dissolution, which in turn lead to different types of MOR recrystallized materials, as
represented in Figure 3.4a, b [138, 139]. By using mild NaOH solutions, composite materials
consisting of two phases, a micro/mesoporous MOR-type zeolite and a mesoporous MCM-41
phase deposited on the crystal surface can be synthesized (Figure 3.4b). Excessive NaOH
concentration resulted in too much crystal dissolution leading to a complete transformation to
MCM-41 mesoporous material with absence of microporosity (Figure 3.4a). Table 3.1 shows
that narrow 3-4 nm mesopores could be formed in MOR and MTW zeolites [131, 139] by this
process. A similar recrystallization process was carried out over 10-ring ZSM-22 zeolite by
Liu et al. [128]. Interestingly, the limitation imposed by the ZSM-22 crystal size on the
generation of intra-crystalline type mesopores could be overcome, since well-defined 3-4 nm
sized mesopores were achieved. Furthermore, the surfactant treatment removed extra-
framework amorphous species generated by the NaOH treatment, resulting in enhanced
accessibility to the reactive sites.
41
Figure 3.4. Schematic representation of the different materials prepared by two-step (a, b) and single-step (c)
surfactant-assisted approaches. Adapted from [98].
3.2.2. Alkaline-tetralkylammonium hydroxides combined methods
Tetraalkylammonium cations, such as tetrapropyl (TPA+) or tetrabutyl (TBA
+) cations, may
also participate in the desilication process when organic TPAOH or TBAOH bases are mixed
with inorganic NaOH in aqueous solutions. These cations have been reported to largely
protect the zeolite crystal upon desilication, resulting in mesopores of small diameter and
narrow pore size distribution. In comparison with inorganic hydroxides, they are intrinsically
less reactive to break Si-O bonds and interact preferentially with the zeolite surface hindering
the OH- attack [94, 116]. Most of the research in this field has been dedicated to ZSM-5 and
Beta zeolites [110, 140-146].
Effective mesopore creation has been reported even over highly siliceous MFI zeolites, which
expanded the composition range of zeolites susceptible to mesopore development and
highlights that mesopore generation is not fully dependent on the zeolite framework
composition when the PDA is introduced [133, 143]. Interestingly, the use of organic

42
hydroxides during desilication may lead to mesoporous materials already in the protonic form
after calcination, which avoids the need for the general ion-exchange process [94].
To the best of our knowledge, this strategy has not yet been applied to one-dimensional
zeolites and will be investigated in this thesis (Paper II).
3.3. Effect of acid treatments
A mild acid treatment is usually combined with desilication strategies in order to alleviate
accessibility problems created by amorphous species extracted during desilication. This
strategy is mostly carried out for medium size one-dimensional zeolites (TON, MTT, EUO),
as can be seen in Table 3.1, and results in hierarchical structures with preserved crystallinity
and increased microporosity and surface area. The removal of the EFAl species caused
increased Si/Al ratios closer to the ones of the starting zeolite. The Brønsted acidity can be
partially restored or even increased. Verboekend et al. [127] reported a decrease in Si/Al ratio
and, surprisingly, a reduced density of BAS with respect to the parent zeolite, accompanied by
a partial removal of EFAl species. Very recently, Dyballa et al. performed desilication of
ZSM-22 using both NaOH and KOH and sequential acid leaching and found significant
reduction of the density of acid sites [147]. For the more spacious 12-ring materials, the
micropore volume was not drastically affected upon desilication, meaning that the acid
washing step is generally not needed. Only one study by Chaouati and co-workers reported
acid washing of desilicated MOR zeolite with slightly reduced microporosity [117].
Acid treatments were also carried out to bring the Si/Al of high alumina MOR zeolites to
adequate values for efficient mesopore development [118, 120]. The resulting zeolites showed
an increased number of BAS and stronger acidity. A further acid leaching of the acid-alkaline
treated zeolites did not result in any significant change in textural properties.

43
3.4. Influence on the catalytic properties
Hierarchical zeolites prepared by post-synthetic strategies have been demonstrated to give
superior performance than conventional microporous zeolites in industrially important
catalytic processes [96, 97, 101]. Intuitively, the introduction of mesoporosity lead to superior
catalytic performance for zeolites which are more predisposed to suffer from diffusion
limitations, such as one-dimensional zeolites with medium sized pores. Table 3.1 illustrates
the benefits of one-dimensional hierarchical zeolites in several catalytic processes, including
olefin oligomerization, isomerization and of alkanes, alkenes and xylenes, cracking of high
alkanes, benzene and naphthalene alkylation, cumene disproportionation, LDPE pyrolysis and
MTH reaction.
Form the reported investigations, it appears clear that acidity and porosity cannot be discussed
independently since acidity is useless if not accessible and porosity similarly will not be fully
effective without providing access to the acitve centres. For instance, Verboekend et al. [148,
149] demonstrated the need for an acid leaching step to open the access to the active sites and
increase the performance of alkane isomerization catalysed reactions. Matias et al. [150]
showed an increase in the initial butene isomerization catalyst activity oh H-NU-10, but the
additional mesoporosity did not enhance the stability of the TON catalyst. Martinez et al. [151]
highlighted the need for tuning the micro-mesoporous structure in order to achieve maximum
diesel selectivity over Theta-1 catalyst. Concerning oxygenate to hydrocarbon reactions,
Ahmed and co-workers reported increased conversions for DME to olefins and higher
propylene selectivities for hierarchical H-EU1 [152].
With regard to the MTH reaction, most of the research has been dedicated to achieve
mesoporous H-ZSM-5 catalysts by alkaline treatment [153-157], surfactant-assisted solutions
[135, 158] and TBAOH combined method [159]. The general outcome of the effect of
mesoporosity on MTH catalysts is an increased lifetime attributed to a more efficient use of
the catalyst crystal which results in an increased resistance towards coking or coke species
mainly formed on the external surface of the catalyst. Any modification of the pore size may
modify the shape selective properties of the catalyst. Accordingly, it has been reported a
significant improvement in propene and C5+ hydrocarbons selectivity for mesoporous H-
ZSM-5-based MTO [157] or MTG [153] and also a shift in aromatics distribution towards
heavier aromatic hydrocarbons [153, 154]. The Lewis acidity was suggested to have an

44
influence on the enhanced activity. With respect to one-dimensional zeolites, only a recent
contribution by Dyballa et al. [147] found a two-fold increase in lifetime, accompanied by
enhanced propene selectivities, in MTO conversion over mesoporous H-ZSM-22 catalysts
with optimal BAS density. Furthermore, similar product spectrum was obtained for the purely
microporous and the mesoporous catalyst, suggesting that the 10-ring pore system of H-ZSM-
22 rules the shape-selective properties in MTO.

45
Ta
ble
3.1
Su
mm
ary o
f th
e st
rate
gie
s ca
rrie
d o
ut
to c
reat
e m
eso
po
rous
one-d
imen
sio
nal
zeo
lite
s in
clud
ing p
rop
erti
es o
f th
e p
aren
t m
ater
ial,
po
rosi
ty a
nd
aci
dit
y m
od
ific
atio
ns
and
the
effe
ct
on t
est
reac
tio
ns
em
plo
yed
over
the
hie
rarc
hic
al z
eoli
tes.
Zeo
lite
stru
ctu
re
[Ref
.]
Str
ate
gy
Mic
rop
oro
us
zeoli
te
H
iera
rch
ica
l ze
oli
te
Si/
Al
Sm
all
est
dim
/
morp
holo
gy
Mes
op
ore
s M
icro
poro
sity
A
cid
ity
,
oth
ers
Rea
ctio
n
10
-rin
g T
ON
Th
eta
-1
[15
1]
Des
ilic
atio
n
NaO
H 0
.2M
0.5
h 8
5C
Des
ilic
atio
n +
aci
d
H2C
2O
4 0
.8M
2h 7
0C
50
0.0
4 µ
m
Nan
oro
ds
In
ter
Red
uce
d
Res
tore
d
BA
par
tly r
educe
d
BA
res
tore
d
Incr
ease
d i
nit
ial
acti
vit
y i
n p
rop
ene
oli
go
mer
izat
ion
Hig
her
sta
bil
ity
Imp
roved
sel
ecti
vit
y t
o d
iese
l
ZS
M-2
2
[12
7]
ZS
M-2
2
[14
9]
Des
ilic
atio
n
NaO
H 0
.6M
2h 8
5C
Des
ilic
atio
n +
aci
d
HC
l 0
.1M
6h 6
5C
42
0.0
4 µ
m
Nan
oro
ds
In
ter/
intr
a
Bro
ad d
istr
ibuti
on
Red
uce
d
Par
tly r
esto
red
BA
red
uce
d
LA
incr
ease
d-E
FA
l
BA
par
tly r
esto
red
LA
par
tly r
educe
d
Rem
oval
of
EF
Al
- Hig
her
n-a
lkane
iso
mer
izat
ion
acti
vit
y a
nd
mo
no
bra
nched
sele
ctiv
ity
ZS
M-2
2
[14
8]
Des
ilic
atio
n +
aci
d
NaO
H +
HC
l
38
Nan
oro
ds
In
ter/
intr
a
Bro
ad d
istr
ibuti
on
Par
tly r
educe
d
BA
red
uce
d
EF
Al
Sup
erio
r al
kan
e is
om
eriz
atio
n
per
form
ance
/less
cra
ckin
g
ZS
M-2
2
[14
7]
Des
ilic
atio
n +
aci
d
NaO
H 0
.4M
1h 8
5C
+
HC
l 0
.1M
6h 6
5C
30
< 1
µm
Nee
dle
-lik
e
N
ot
ind
icat
ed
Red
uce
d
Op
tim
al A
SD
Sim
ilar
aci
d s
tren
gth
Def
ects
Incr
ease
d M
TO
lif
etim
e
Incr
ease
d p
rop
ene
sele
ctiv
ity
ZS
M-2
2
[12
8]
Des
ilic
atio
n
NaO
H 0
.3M
0.5
h 8
0C
Rec
ryst
alli
zati
on
NaO
H 0
.15
-0.9
M +
CT
AB
24
h 1
00
-12
0C
32
0
.03
-0.0
5 µ
m
Nee
dle
-lik
e
In
ter
Intr
a (3
-4 n
m)
to M
CM
-41
Red
uce
d
Red
uce
d t
o a
bse
nt
AS
D r
educe
d
Aci
d s
tren
gth
red
uce
d
Def
ects
BA
red
uce
d
LA
incr
ease
d
Rem
oval
of
EF
Al
Incr
ease
d n
-alk
ane
iso
mer
izat
ion
sele
ctiv
ity f
or
com
po
site
mat
eri
als
Bes
t is
om
eriz
atio
n s
elec
tivit
y/l
ow
crac
kin
g a
ctiv
ity f
or
com
po
site
mat
eria
ls

46
Ta
ble
3.1
(co
nti
nu
ed)
Zeo
lite
stru
ctu
re
[Ref
.]
Str
ate
gy
Mic
rop
oro
us
zeoli
te
H
iera
rch
ica
l ze
oli
te
Si/
Al
Sm
all
est
dim
/
morp
holo
gy
Mes
op
ore
s M
icro
poro
sity
A
cid
ity
,
oth
ers
Rea
ctio
n
NU
-10
[1
50
]
Des
ilic
atio
n
NaO
H 0
.4M
0.5
h 8
0C
31
0.0
5 µ
m
Nan
oro
ds
In
ter/
intr
a (2
0 n
m)
Par
tly r
educe
d
BA
red
uce
d
LA
incr
ease
d
EF
Al
Rem
oval
of
def
ects
Hig
her
act
ivit
y i
n 1
-bu
tene
iso
mer
izat
ion
NU
-10
[16
0]
Des
ilic
atio
n
NaO
H 0
.6M
0.5
h 8
0C
33
0.0
8 µ
m
Nee
dle
-lik
e
In
ter/
intr
a (2
0-3
0 n
m)
Unal
tere
d
LA
incr
ease
d
EF
Al,
EF
Si
Ad
sorp
tio
n e
nhance
d
Incr
ease
d a
ctiv
ity i
n o
-xyle
ne
iso
mer
izat
ion
10
-rin
g M
TT
ZS
M-2
3
[16
1]
Des
ilic
atio
n +
aci
d
NaO
H 0
.2M
5m
85
C +
HN
O3 0
.3M
10
m 8
0C
76
0.0
7 µ
m
Nan
oro
ds
In
ter/
intr
a (2
-5 n
m)
Dra
stic
ally
incr
ease
d
BA
par
tly i
ncr
ease
d
Sim
ilar
aci
d s
tren
gth
Rem
oval
of
def
ects
Enhance
d s
tab
ilit
y i
n n
-hex
an
e
crac
kin
g
Hig
her
pro
pyle
ne
sele
ctiv
ity
10
-rin
g E
UO
EU
-1
[12
9]
Des
ilic
atio
n
NaO
H 0
.25
M 1
h 8
0C
25
Nan
oro
ds
In
ter/
intr
a (1
0-2
0 n
m)
Red
uce
d
To
tal
acid
ity u
nal
tere
d
EF
Al
Def
ects
Dec
reas
ed c
onver
sio
n i
n D
ME
to
ole
fin
s
Hig
her
pro
pyle
ne
sele
ctiv
ity
EU
-1
[15
2]
Des
ilic
atio
n +
aci
d
NaO
H 0
.5M
1h 8
0C
+
HN
O3 4
M 0
.5 h
70
C
25
< 0
.5 µ
m
Ag
glo
mer
ates
In
tra
(10
nm
) R
esto
red
T
ota
l ac
idit
y i
ncr
ease
d
Rem
oval
of
EF
Al
Def
ects
Incr
ease
d c
onver
sio
n i
n D
ME
to
ole
fin
s
Hig
her
pro
pyle
ne
sele
ctiv
ity

47
Ta
ble
3.1
(co
nti
nu
ed)
Zeo
lite
stru
ctu
re
[Ref
.]
Str
ate
gy
Mic
rop
oro
us
zeoli
te
H
iera
rch
ica
l ze
oli
te
Si/
Al
Sm
all
est
dim
/
morp
holo
gy
Mes
op
ore
s M
icro
poro
sity
A
cid
ity
,
oth
ers
Rea
ctio
n
12
-rin
g M
OR
Mord
enit
e
[125]
Des
ilic
atio
n
NaO
H 0
.2M
1h 8
5C
45
No
t in
dic
ated
Intr
a U
nal
tere
d
To
tal
acid
ity u
nal
tere
d
Aci
d s
tren
gth
unal
tere
d
-
Mord
enit
e [1
09
]
Des
ilic
atio
n
NaO
H 0
.2M
0.5
h 6
5C
30
2 µ
m
Pla
te-l
ike
In
tra
(10
nm
) U
nal
tere
d
BA
unal
tere
d
Sup
erio
r st
abil
ity i
n b
enze
ne
alk
yla
tio
n/H
igher
eth
ene
sele
cti
vit
y
Mord
enit
e
[16
2]
Des
ilic
atio
n
NaO
H 0
.2M
0.5
h 6
0C
18
-40
Ag
glo
mer
ates
No
t in
dic
ated
P
artl
y r
educe
d
BA
red
uce
d
LA
incr
ease
d
EF
Al
Imp
roved
co
nver
sio
n i
n b
enze
ne
alk
yla
tio
n w
ith 1
-do
dec
ene
Inhib
itio
n o
f 1
-do
dec
ene
iso
mer
izat
ion t
o l
inea
r al
kylb
enze
nes
Mord
enit
e
[12
1]
Des
ilic
atio
n
NaO
H 1
M 1
5m
70
C
5.5
-
10
0.0
4 µ
m
Co
ffin
-shap
ed
In
ter
(35
nm
)/
Intr
a (3
-8 n
m)
Par
tly r
educe
d
BA
par
tly i
ncr
ease
d
Am
orp
ho
us
spec
ies
Hig
her
act
ivit
y i
n b
enze
ne
alk
yla
tio
n
wit
h p
rop
ene
Sim
ilar
sel
ecti
vit
y t
o c
um
ene
Mord
enit
e [1
19
]
Des
ilic
atio
n
NaO
H 0
.2M
2h 8
5C
9.5
A
ggre
gat
es
In
ter/
intr
a (1
0 n
m)
Unal
tere
d
To
tal
acid
ity u
nal
tere
d
Aci
d s
tren
gth
unal
tere
d
EF
Al
-
Mord
enit
e [1
17
]
Des
ilic
atio
n
NaO
H 0
.4M
2h 8
5C
Des
ilic
atio
n +
aci
d
HC
l 0
.5M
10
m 3
0C
10
0.1
µm
Intr
a (3
-7 n
m)
Par
tly r
educe
d
Unal
tere
d
BA
red
uce
d
Aci
d s
tren
gth
incr
ease
d
LA
incr
ease
d
EF
Al
Rem
oval
of
EF
Al
BA
res
tore
d
Incr
ease
d a
ctiv
ity i
n m
-xyle
ne
tran
sfo
rmat
ion
No
rem
arkab
le c
hanges

48
Ta
ble
3.1
(co
nti
nu
ed)
Zeo
lite
stru
ctu
re
[Ref
.]
Str
ate
gy
Mic
rop
oro
us
zeoli
te
H
iera
rch
ica
l ze
oli
te
Si/
Al
Sm
all
est
dim
/
morp
holo
gy
Mes
op
ore
s M
icro
poro
sity
A
cid
ity
,
oth
ers
Rea
ctio
n
Mord
enit
e [1
18
]
Des
ilic
atio
n
NaO
H 0
.2M
0.5
h 6
5C
Aci
d
HN
O3 2
M 4
h 1
00
C
Aci
d +
des
ilic
atio
n
15
25
1
Pla
te-l
ike
L
imit
ed
Lim
ited
Intr
a
Unal
tere
d
Incr
ease
d
Red
uce
d
- BA
red
uce
d
BA
incr
ease
d
Aci
d s
tren
gth
incr
ease
d
Rem
oval
of
EF
Al
Dif
fusi
vit
y e
nhance
d
Lo
w c
on
ver
sio
n i
n b
enze
ne
alk
yla
tio
n
Hig
her
co
nver
sio
n i
n 2
-met
hy
l-2
-
pen
tene
iso
mer
izat
ion
Hig
her
ben
zene
alk
yla
tio
n c
on
ver
sio
n
Imp
roved
per
form
ance
in 2
-met
hyl-
2-p
ente
ne
iso
mer
izati
on
Hig
her
act
ivit
y i
n b
enze
ne
alk
yla
tio
n
Mord
enit
e [1
20
]
Aci
d
HN
O3 3
M 1
h
Des
ilic
atio
n
NaO
H 0
.05
-1M
70
C
Aci
d +
des
ilic
atio
n
Aci
d +
des
ilic
atio
n +
acid
0.1
M 1
5m
50
C
8
30
1
0.1
5 µ
m
Ag
glo
mer
ates
L
imit
ed
Inte
r/in
tra
Intr
a (3
-8,
40
nm
)
Unal
tere
d
Unal
tere
d
Unal
tere
d
BA
S r
educe
d
EF
Al
red
uce
d
LA
S r
educe
d
Aci
d s
tren
gth
incr
ease
d
EF
Al
No
sig
nif
ican
t im
pro
vem
ent
in
ben
zene
alk
yla
tio
n w
ith p
rop
ene
Hig
her
act
ivit
y a
nd
sel
ecti
vit
y t
o
cum
ene
Incr
ease
d a
ctiv
ity
Incr
ease
d s
elec
tivit
y t
o c
um
ene
No
rem
arkab
le c
hange
Mord
enit
e [1
38
]
Rec
ryst
alli
zati
on
NaO
H 0
.4-1
.2M
rT
+
CT
AB
10
0C
48
> 0
.1 µ
m
Pla
te-l
ike
In
tra/
inte
r
to M
CM
-41
Unal
tere
d t
o a
bse
nt
Unal
tere
d t
o d
ecre
ased
AS
D a
nd
aci
d s
tren
gth
LA
S i
ncr
ease
d
Acc
ess
ibil
ity i
ncr
ease
d
Hig
her
act
ivit
y,
stab
ilit
y a
nd
sele
ctiv
ity i
n n
aphth
alene
alk
yla
tio
n
wit
h c
ycl
ohexen
e fo
r co
mp
osi
te
mat
eria
ls

49
Ta
ble
3.1
(co
nti
nu
ed)
Zeo
lite
stru
ctu
re
[Ref
.]
Str
ate
gy
Mic
rop
oro
us
zeoli
te
H
iera
rch
ica
l ze
oli
te
Si/
Al
Sm
all
est
dim
/
morp
holo
gy
Mes
op
ore
s M
icro
poro
sity
A
cid
ity
,
oth
ers
Rea
ctio
n
Mord
enit
e [1
39
]
Des
ilic
atio
n
NaO
H 0
.5M
rT
Rec
ryst
alli
zati
on
NaO
H 0
.5-1
.6M
+
CT
AB
10
0C
48
0.1
µm
Intr
a (5
-50
nm
)
Intr
a (3
-4n
m)/
inte
r
to M
CM
-41
Par
tly d
ecre
ased
Unal
tere
d t
o a
bse
nt
Acc
ess
ibil
ity i
ncr
ease
d
Unal
tere
d t
o d
ecre
ased
AS
D a
nd
aci
d s
tren
gth
Acc
ess
ibil
ity i
ncr
ease
d
Hig
her
act
ivit
y i
n c
um
ene
dis
pro
port
ionat
ion
Bes
t ac
tivit
y a
nd
sta
bil
ity i
n c
um
ene
dis
pro
port
ionat
ion f
or
com
po
site
mat
eria
ls –
co
atin
g p
revents
co
kin
g
12
-rin
g M
TW
ZS
M-1
2
[13
0]
Des
ilic
atio
n
NaO
H 0
.5M
1h 8
5C
45
No
t in
dic
ated
Lim
ited
R
educe
d
BA
unal
tere
d
Aci
d s
tren
gth
incr
ease
d
LA
incr
ease
d
Incr
ease
d a
ctiv
ity i
n α
-pin
ene
iso
mer
izat
ion
ZS
M-1
2
[12
2]
Des
ilic
atio
n
NaO
H 0
.2M
10
m 8
5C
80
0.1
µm
Ag
glo
mer
ates
In
tra
(5-1
5 n
m)
Dra
stic
ally
red
uce
d
To
tal
acid
ity r
educe
d
Aci
d s
tren
gth
red
uce
d
EF
Al/
EF
Si
Hig
her
sel
ecti
vit
y t
o o
lefi
ns
n-
hep
tane
crac
kin
g
ZS
M-1
2
[13
1]
Des
ilic
atio
n
NaO
H 0
.5M
1h 9
0C
Rec
ryst
alli
zati
on
NaO
H/C
TA
B2
4h 1
00
C
40
< 1
µm
Pla
te-l
ike
In
tra
Dra
stic
ally
red
uce
d
EF
Si
Rem
oval
of
def
ects
Hig
her
act
ivit
y s
ele
ctiv
ity i
n α
-pin
ene
iso
mer
izat
ion
Lo
wer
act
ivit
y
12
-rin
g I
FR
ITQ
-4
[13
2]
Des
ilic
atio
n
NaO
H 0
.2M
0.5
h 6
5C
32
0.2
µm
Bea
m-l
ike
In
tra
(3-1
0 n
m)
Dra
stic
ally
red
uce
d
BA
unal
tere
d
BA
mo
re a
cces
sib
le
LA
incr
ease
d
-
ITQ
-4
[16
3]
Des
ilic
atio
n
NaO
H 0
.2M
0.5
h 6
5C
32
0.2
µm
Bea
m-l
ike
In
tra
(3-1
0 n
m)
Red
uce
d
BA
unal
tere
d
Rem
oval
of
def
ects
Dif
fusi
on a
nd
adso
rpti
on e
nhance
d
Imp
roved
act
ivit
y a
nd
per
form
ance
in
LD
PE
pyro
lysi
s
1 S
i/A
l ra
tio
of
the
sam
ple
bef
ore
des
ilic
atio
n (
afte
r fi
rst
dea
lum
inati
on).

50
4. Experimental
general description of the experimental procedures for the preparation of the materials
used in this thesis (Section 4.1 and 4.2) as well as the characterization (Section 4.3 and
4.4) and catalytic testing (Section 4.5) methods are provided in this chapter. Particular
emphasis is given to the characterization by physisorption measurements which are core for
the present work.
4.1. Catalyst synthesis and preparation
Commercially available ZSM-22 (Si/Al = 50) and ZSM-23 (Si/Al = 23) zeolites supplied by
Zeolyst International were employed in this thesis.
In house synthesized ZSM-22 zeolite was also investigated in this work. The synthesis was
carried out under hydrothermal conditions. Before the synthesis, Teflon liners were cleaned in
a 15 % HF solution and extensively rinsed with deionized water. ZSM-22 (Si/Al = 45) was
synthesized following the procedure described elsewhere [36] and summarized:
1.05 g of aluminium sulphate (J. T. Baker) was added to 10.9 g of distilled water
under vigorous stirring. An aqueous solution of 2.4 g of potassium hydroxide (Sigma-
Aldrich) dissolved in 10.89 g distilled water was prepared and mixed with the
previous solution. Another solution of 6.26 g of diaminooctane (DAO from Fluka)
dissolved in 43.6 g of distilled water was added to the first mixture.
To the resulting solution, 28.5 g of Ludox AS-30 colloidal silica (Sigma Aldrich)
diluted with 16.16 g of distilled water was added under vigorous stirring. This final
mixture was stirred for 30 min and aged for 24 h at room temperature.
The gel with composition [8.9 K2O : 1.0 Al2O3 : 90 SiO2 : 3 K2SO4 : 27.3 DAO : 3588
H2O] was transferred into 40 ml Teflon-lined stainless steel autoclaves. Crystallization
was carried out at 160 °C for 72 h in a tumbling oven (37 rpm). Teflon coated magnets
were placed inside the autoclaves to enhance the gel mixing.
A

51
The product was recovered by filtration, extensively washed with deionized water and
dried overnight at 90 °C.
4.1.1. Calcination and ion-exchange
The needle shaped ZSM-22 crystals containing narrow pores require a special calcination to
remove the organic template. The as-synthesized zeolite was calcined under a flow of pure
oxygen at 550 °C for 12 h. The temperature of the oven was increased stepwise, in 100 °C
segments up to 400 °C and 50 °C segments above 400 °C, with a hold time of 30 min between
each temperature increase. The received commercial ZSM-22 and ZSM-23 samples were
calcined following the same procedure to ensure a proper template removal.
The acidic form of the calcined zeolites was produced by three consecutive ion exchanges
with a 1 M NH4NO3 solution using 100 ml per gram of material in a plastic flask at 75 ºC for
2 h and calcined in static air at 550 ºC for 2 h, to remove ammonia.
4.2. Post-synthetic strategies
A series of desilicated ZSM-22 zeolites were prepared from the two (commercial and in house
synthesized) calcined microporous samples by three sequential post-synthetic treatments, i.e.
using NaOH, mixtures of CTAB/NaOH and mixtures of TBAOH/NaOH, followed by acid
leaching. The conditions were selected according to literature [127, 150, 160]. Sample codes
and treatments conditions are presented in the flow diagram in Figure 4.1.
4.2.1. Alkaline desilication
The calcined zeolites were treated with 0.2 M or 0.5 M NaOH aqueous solutions at 80 °C for
2 h, with a solid to liquid ratio of 33 g of zeolite per litter of NaOH solution (-at coded series).
The final suspensions were quenched in ice bath, centrifuged and washed with deionized
water until pH was close to neutral (measured with pH indicator). The samples were dried

52
overnight at 60 °C. A fraction of each desilicated sample was brought to the protonic form as
described in Section 4.1.
4.2.2. Alkaline-surfactant desilication
Desilication of the calcined samples was carried out in a mixture of 0.05 M CTAB and 0.25
M or 0.5 M NaOH at 80 °C for 24 h. 50 g of zeolite was used per litter of CTAB/NaOH
solution (-ats coded series). The final suspensions were quenched in an ice bath, centrifuged
and washed with deionized water until pH was close to neutral. The samples were dried
overnight at 60 °C. To remove all surfactant, the CTAB/NaOH samples were calcined at
550 °C for 15 h under a flow of pure O2, using a heating rate of 1.8 °C/min to reach 550 °C in
a flow of 50 : 50 N2 and O2. A fraction of each sample was brought to the protonic form as
described in Section 4.1.
4.2.3. Alkaline-tetrabutylammonium desilication
The calcined samples were treated with a mixture of 0.08 M TBAOH and 0.12 M NaOH at
65 °C or 80 °C during 0.5 h. 30 g of zeolite was used per litter of TBAOH/NaOH solution (-
tba coded series). The final suspensions were quenched in ice bath, centrifuged and washed
with deionized water until the pH was close to neutral. The TBAOH/NaOH samples were
calcined in the same way as for the CTAB/NaOH samples. A fraction of each sample was
brought to the protonic form as described in Section 4.1.
4.2.4. Acid treatment
A fraction of each desilicated sample was submitted to acid washing in 0.1 M aqueous HCl
solution at 65 °C for 6 h, using 10 g of zeolite per litter of solution. The resulting suspensions
were quenched in ice bath, centrifuged and washed with deionized water until pH was close to
neutral. The samples were dried overnight at 70 °C. For comparative purposes, the parent
zeolite was also treated in HCl using the same conditions. The acid washed samples were
brought to the protonic form as described in Section 4.1.

53
Figure 4.1. Flow diagram of the experimental steps carried out during the preparation of the ZSM-22 samples.
First row corresponds to untreated zeolites, second row to desilicated zeolites and third row to acid-washed
zeolites. Colour codes (green=at series, blue=ats series and red=tba series) are kept along this thesis. “x-” =
commercial (c-ZSM-22-) or in house synthesized (m-ZSM-22-) ZSM-22.
The calcined commercial ZSM-23 zeolite was also submitted to post-synthetic treatments
only using NaOH and mixtures of CTAB/NaOH, followed by acid leaching. Same procedure
as described above was carried for each treatment. Sample codes and treatments conditions
are presented in the flow diagram in Figure 4.2.
Figure 4.2. Flow diagram of the experimental steps carried out during the preparation of the ZSM-23 samples.
First row corresponds to untreated zeolites, second row to desilicated zeolites and third row to acid-washed
zeolites. Colour codes (green=at series, blue=ats series) are kept along this thesis. “y-” = commercial c-ZSM-23.

54
4.3. Ex-situ characterization
The microporous and post-synthetic treated zeolites were characterized by using a variety of
methods prior to being tested in the MTH conversion. The characterization methods are
outlined in this section.
4.3.1. Powder X-Ray Diffraction (PXRD)
PXRD was used to firstly analyse the phase purity of the in house synthesized ZSM-22 zeolite
as well as to check the crystallinity of the commercial ZSM-22 and ZSM-23 samples. Figure
4.3 compares the diffraction pattern of the investigated zeolites with the theoretical TON and
MTT pattern in the powder diffraction file (PDF) database revised by Joint Committee on
Powder Diffraction Standards. Commercial and in house synthesized ZSM-22 samples consist
of a highly crystalline TON structure. The peak observed around 21.5 degrees is ascribed to a
cristobalite impurity which commonly co-exists with ZSM-22 [28, 36]. Commercial ZSM-23
shows a pure MTT structure. PXRD was also used to check the crystallinity of the samples
after the post-synthetic treatments.
The PXRD measurements were performed using a Siemens Bruker D5000 instrument with
Bragg-Brentano geometry and Cu Kα radiation (λ = 1.5406 Å). A small fraction of zeolite
powder was grinded in a mortar and mixed with ethanol before dispersing it on a glass plate
sample holder and allowing ethanol to evaporate.

55
Figure 4.3. PXRD patterns of the (a) theoretical TON structure and commercial and in house synthesized ZSM-
22 zeolites and (b) theoretical MTT structure and commercial ZSM-22 zeolite. Asterisk (*) indicates the position
of cristobalite impurity.
4.3.2. Elemental Analysis
Once the correct phase was verified, elemental analysis was employed to quantify the Si and
Al content in the zeolite and determine the Si/Al ratio. The measurements were performed on
an Agilent Technologies 4100 Microwave Plasma-Atomic Emission Spectrometry (MP-AES)
instrument.
Approximately 50 mg of zeolite was introduced in a Teflon vial. 1 ml of 15 wt% HF (Fluka,
40 %) was added to the vial. The vial was closed, shaken and left for 30 min. In order to
neutralise the excess of HF, 0.15 g of H3BO3 was dissolved in 12.5 ml of H2O in a 50 ml
polypropylene volumetric flask and the dissolved zeolite was transferred into this volumetric
flask and diluted to 50 ml.
56
4.3.3. Scanning Electron Microscopy (SEM)
SEM was used to investigate the crystal size and morphology of the zeolites as well as to
assess the formation of mesopores by examining the roughening of the surface of the zeolite.
SEM micrographs were recorded on a SU8230 FE-SEM instrument working at 5–10 kV,
using beam deceleration mode. The samples were prepared by dispersing a small amount of
powder on a carbon tape on SEM stubs.
4.3.4. Transmission Electron Microscopy (TEM)
TEM was employed to determine the morphology and aspect ratio of isolated (when possible)
zeolite crystallites as well as to investigate the intra-crystalline mesopore formation of the
micro/mesoporous zeolites.
TEM images were recorded using a CM300 FEG-TEM operating at 300 kV (at Haldor
Topsøe AS) and a Philips CM-10 microscope operating at 100 kV (at ITQ-UPV institute). A
small amount of sample was crushed in a mortar and dispersed in ethanol, which was
ultrasonicated for 20 sec to further break up the agglomerates. A few drops of this solution
were placed on a TEM Cu-grid coated with lacey carbon placed on a piece of filter paper. The
ethanol was allowed to evaporate for 10 min before the TEM grid was stored in ambient
conditions.
4.3.5. Physisorption Measurements
N2 physisorption measurements were used to determine the surface area and pore volume of
the zeolites under study. The measurements were carried out on a Belsorp-mini II instrument.
The BET method was used to determine the specific (BET) surface area, the t-plot method
was applied to determine the micropore volume and the external surface area and the BJH
method was used to evaluate the mesopore size distribution.
About 60 mg of zeolite was weighted and measured in a range of relative pressures of p/p0 =
0–0.99 at 77 K. Before each measurement, the samples were outgassed under vacuum at 80 ºC
for 1 h and 4 h at 300 ºC. The porous properties of the deactivated samples were also

57
investigated (Paper I). Coked catalysts were pre-treated under vacuum for 1 h at 80 ºC and 4
h at 150 ºC.
Isotherm type and total pore volume
The isotherms are presented as Va (cm3(STP) g
-1), i.e. the volume of standard state nitrogen
(273.15 K, 101.3 kPa) adsorbed per gram of sample, plotted against p/p0, a dimensionless
quantity which describes the pressure in the sample cell relative to the saturation pressure.
The parent microporous zeolites gave type I adsorption isotherms (Figure 4.4a), whereas the
micro/mesoporous samples showed a combination of type II-IV isotherms, according with the
IUPAC classification [164, 165]. Type II-IV isotherms typically present a hysteresis loop
(Figure 4.4d) associate with capillary condensation occurring in the mesopore, which provides
information about the pore shape and structure [166, 167]. However, the analysis should be
made carefully, since most mesopore systems had a broad variation of shapes and sizes.
Samples with inter-crystalline mesopores generally showed an increase in the N2 uptake at
high partial pressures (Figure 4.4g) ascribed to the space between aggregated nanocrystals of
the zeolite.
The total pore volume Vpore (cm3/g) is determined from the adsorbed volume (Va) at partial
pressures at p/p0 ~ 0.99 from the following equation:
𝑽𝒑𝒐𝒓𝒆 = 𝑷𝑽𝒂𝑽𝑴
𝑹𝑻 (1)
where
- P and T are ambient pressure and temperature, respectively
- R is the universal gas constant
- VM is the molar volume of the liquid adsorbate. VM (N2) = 34.7 cm3/mol

58
Figure 4.4. Nitrogen physisorption isotherms (a, d, g), t-plot (b, e, f) and BJH pore size distribution analysis (c, f,
i) for a microporous zeolite (a – c), for a micro/mesoporous zeolite with intra-crystalline mesopores (d – f) and
for a micro/mesoporous fragmented zeolite with inter-crystalline mesopores (g – i).
Surface area analysis
The BET (Brunauer, Emmett and Teller) method was applied to obtain the specific or BET
surface area, SBET (m2/g). Evaluation of SBET involves two steps. First, the physisorption N2
isotherm is transformed to the so-called BET plot by using the BET equation (2):
𝟏
𝒏[(𝒑𝟎 𝒑⁄ )−𝟏] =
𝟏
𝒏𝒎𝑪 + (𝒑 𝒑𝟎⁄ )
𝑪−𝟏
𝒏𝒎𝑪 (2)
where
- n is the adsorbed amount
- nm is the monolayer capacity (adsorbed amount in one monolayer)
- C is an empirical constant which gives an indication of the order of magnitude of the
attractive adsorbent-adsorbate interactions

59
The linearization of the BET equation allows obtaining the monolayer capacity (nm) from the
slope and the intercept of the linear regression curve.
The specific surface area (SBET) is the calculated from the monolayer capacity (nm) by the
application of the following equation (3):
𝑺𝑩𝑬𝑻 = 𝒏𝒎 ∙ 𝑳 ∙ 𝝈 (3)
where
- L is the Avogadro constant
- σ is the cross-sectional area (average area occupied by each adsorbed molecule in a
complete monolayer). σ (N2) = 0.162 nm2
The BET method is applicable for surface area determination of mesoporous materials, but is
in a strict sense not applicable for microporous materials since they do not fulfil all the
boundary conditions for multilayer adsorption [165]. However, if the BET equation is applied
within its classical range (p/p0 = 0.05–0.3) on adsorption data of a microporous material, a
linear range is difficult to find and the C constant may be negative, with has no physical
meaning. In such case, the BET area depends on the selected data points and the obtained
value is considered an apparent or equivalent SBET [165]. In this respect, Rouquerol et al. [168]
suggested a consistency criteria for the determination of the correct linear range. The first
consistency criterion states that the entire p/p0 range used for the BET analysis must be lower
than the value from which the Va(1 – p/p0) curve starts to decrease. The second criterion states
that the value for 𝟏
√𝑪+𝟏 must be equal to 0.087 within the chosen p/p0 range. The value of the
C constant must be positive to fulfil the third criterion.
The use of the standard nitrogen cross-sectional area (assuming spheres) results in
overestimated SBET values, since the quadrupole moment of nitrogen leads to specific
interactions with polar groups of the zeolite surface (hydroxyl groups, silanols, defects).
Consequently, the effective cross-sectional area of adsorbed nitrogen might be smaller than
the usual value [166].

60
Micropore volume and external surface area
The t-plot method developed by Lippens and de Boer [169, 170] was used to determine the
micropore volume and external surface area (the surface area of all the pores larger than
micropores) of the zeolites. This method is based on a comparison plot constructed from a
standard isotherm. The standard isotherm is the adsorption isotherm of a nonporous adsorbent.
It is ideally best to use a standard isotherm of a nonporous material with surface chemical
properties equal to those of the sample under study. Therefore, the best is to select a standard
isotherm with similar C constant to the sample isotherm, but this is difficult to achieve.
Instead, the BEL Japan software employs the standard isotherm of de Boer, which is an
average value calculated from various reference isotherms and give acceptable results.
The t-plot is constructed by plotting the statistical thickness t (nm) of the adsorbed layer, i.e.
the adsorbed volume for unit surface, against the adsorbed amount, Va (cm3/g). First, the
adsorbed amount (Va) of the standard isotherm is converted to the statistical thickness (t) with
equation (4).
𝒕 = 𝑽𝒂
𝑽𝒎𝝈𝒕 (4)
where
- σt is the thickness of a single adsorbed layer. σt (N2) = 0.354 nm assuming hexagonal
arrangement of N2 molecules
- Vm is the volume adsorbed in one monolayer
Then, p/p0 is transformed into t, so the abscissa of the t-plot is expressed by t instead of p/p0.
For a nonporous adsorbent isotherm described by multilayer adsorption (type II according to
IUPAC classification), the t-plot is a straight line passing through the origin and with the
slope directly proportional to the surface area of the material. Zeolites as microporous
adsorbents show a deviation from the linearity. Different deviation gives information on the
type of pores, pore volume and specific surface areas. After the complete filling of the
micropores, a straight line with the slope corresponding to the external surface area, Sext (m2/g)
is obtained. The extrapolation of the linear region gives a positive intercept corresponding to
the adsorbed volume employed to fill the micropores, so the micropore volume, Vmicro (cm3/g)
(Figure 4.4b, e, h). For mesoporous zeolites with intra-particle mesopores, an upward

61
deviation from the linearity due to capillary condensation is expected. After the filling of the
mesopores a second straight line with the slope corresponding to the lower external or
mesopore surface area and intercept corresponding to the mesopore plus micropore volume
has to be expected. If the crystallite size remains the same during the formation of mesopores
the difference between the external surface areas of the parent and the treated zeolite is the
surface area of the mesopores created. However, for most of the micro/mesoporous zeolites
investigated in this work this second linear range was too short (Figure 4.4e) and did not
allow the proper analysis. Besides, a number of treatments resulted in variation of the crystal
morphology showing practically no hysteresis loop and limited upward deviation from the
linear curve, as seen with the sample in Figure 4.4h. Bearing that in mind, the textural
properties of the zeolites were determined as:
Vext (cm3/g) = Vpore (from the adsorbed volume at p/p0 ~ 0.99) – Vmicro(from the 1
st linear t-plot)
Smicro (m2/g) = SBET – Sext(from the 1
st linear t-plot)
Along this thesis, Sext and Vext will be used to refer to the surface area or volume of the pores
larger than the micropore size (> 2 nm).
Pore size distribution (PSD) analysis
The size of the mesopores was evaluated with the Barett-Joyner-Halenda (BJH) method [171].
This method is based on the Kelvin equation to describe the multilayer adsorption/capillary
condensation process occurring in the mesopores. The Kelvin equation correlates the pore
condensation pressure with the meniscus and pore radius at the liquid-gas interphase in
narrow pores (Figure 4.5). For cylindrical pores, the modified Kelvin equation (5) is:
𝒍𝒏𝒑
𝒑𝟎 =
−𝟐𝜸𝒄𝒐𝒔𝜽
𝑹𝑻∆𝝆 𝒓𝒌 (5.1)
𝒍𝒏𝒑
𝒑𝟎 (𝜽 = 𝟎) =
−𝟐𝜸𝑽𝑴
𝑹𝑻 𝒓𝒌 (5.2)
where
Adapted from [165].
- γ is the surface tension of the bulk N2
Figure 4.5. Meniscus at the L-G interphase
in cylindrical narrow pore.

62
- ϴ is the contact angle of the liquid meniscus against the pore wall. ϴ = 0o (complete
wetting of the wall) is usually assumed
- Δρ is the difference between the coexistent liquid (ρl) and gas (ρg)
- rk = (rp – tc) is the Kelvin radius: radius of curvature of the meniscus formed in the
pore; rp is the pore radius; tc is the thickness of an adsorbed multilayer film formed
prior to pore condensation
During capillary condensation the gas phase nitrogen molecules increased the number of van
der Waals interactions between each other and condense to a liquid-like phase. This results in
increased adsorbed volume at lower pressures than the saturation pressure of nitrogen. During
evaporation, capillary forces must be overcome and nitrogen gas leaves the pore at lower
pressure than it entered. The different mechanisms of adsorption desorption results in the
formation of the hysteresis loop. The Kelvin equation predicts that condensation in the narrow
pore shifts to a higher relative pressure with increasing pore diameter. Therefore, from this
equation and the results provided by the sorption methods it is possible to estimate the PSD of
the mesoporous zeolite. First, the pore radius (rp) is obtained from the Kelvin radius (rk) plus
the multilayer thickness (tc), often obtained from BET method results. Once the pore radius is
calculated, the change in volume per change in pore radius (dVp / drp) is plotted against rp
(Figure 4.4c, f, i). The dVp / drp represents the slope of the change in volume of adsorbate for
the corresponding pore with radius rp.
The assumptions of the BJH method (regular pore shape, complete wetting, filling/emptying
independent of the position, adsorption in pore walls similar to open surface) are often not
fully validated. In addition, the Kelvin equation fails to describe correctly the behaviour of
critical regions and confinement effects in the pores. Indeed, the method may underestimate
the pore size by a factor up to 20–30 % for pores smaller than 15 nm, due to the fact that the
assessment of the statistical thickness becomes problematic when the pore diameter decreases
[166]. Therefore, the BJH method should be taken as estimation of the PSD.
Additionally, the analysis should be made carefully as often there are misinterpretations in the
mesopore size distribution derived from nitrogen adsorption measurements using the BJH
method. For instance, the area between 2 and 4 nm is prone to errors if a hysteresis loop with
a forced closure is present [172, 173]. In this case, a large amount of nitrogen is released at
once between p/p0 of 0.38-0.44, which is visible as the closing of the hysteresis loop. The

63
BJH analysis correlates then the volume of the released N2 to pores of 2-4 nm via the Kelvin
equation, but this is not always correct. Real mesopores should lead to reversibility for both
the adsorption and desorption branches. The sample c-ZSM-22, with nitrogen isotherm and
BJH plot showed in Figure 4.4a and c, serves as an example. In this case, the sharp peak at 2
nm observed in the BJH mesopore size distribution calculated with the desorption branch is
not present when using the adsorption branch and, hence, does not indicate real mesoporosity.
Additionally, inkbottle pores with pore necks smaller than 4 nm might release nitrogen
between relative pressures of 0.38-0.44. The determination of the mesopore size distribution
should be accompanied with TEM images to avoid misinterpretations.
Furthermore, zig-zag curves observed in the large pore region of the BJH plot (Figure 4.4i) do
not represent true mesoporosity but is considered an artifact of the analysis. As mentioned, the
BJH pore size distribution is the first derivative of the accumulative volume. Then, a very
small jump in the isotherm could give a sharp increase in the BJH but without any
significance when it occurs between 2 consecutive points.
4.3.6. Infrared Spectroscopy (IR)
Nature and concentration of acid sites
The nature and concentration of the acid sites in the protonated zeolites was investigated
using Fourier Transformed Infra-red (FTIR) spectroscopy. The interaction of the active sites
with probe molecules such as CO and pyridine was studied to determine the type, strength and
concentration of the active site.
FTIR spectra were collected on a Bruker Vertex 80 instrument with MCT detector, working at
2 cm-1
resolution and a number of 32 or 64 scans. An in-house designed quartz sample cell
with KBr windows was employed for the measurements.
Zeolite powder was pressed into self-supporting wafers, put in a golden envelope and placed
in the measuring cell. Samples were pre-treated under vacuum for 3h: at 150 °C for 1 h, at
300 °C for 1 h and at 450 °C for 1 h. CO was adsorbed on the sample at liquid nitrogen
temperature (77 K). After dosing, CO was gradually pumped out of the cell while spectra
were recorded at regular intervals. The spectra were normalized to the overtone modes at
wavenumber 1750–2000 cm-1
. Quantification of the acid sites was performed by adsorption of

64
pyridine at room temperature, followed desorption and evacuation in-situ at 200 °C for 2 h
under vacuum, in order to remove the physisorbed species. All spectra were corrected for
water and CO2 present in the sample compartment.
The absorbance for IR radiation was checked for all the activated samples to ensure the
absence of water, which should be seen as a flat curve in the 3300-2500 cm-1
frequency range
(Figure 4.6). Typically, two features are distinguished in the OH stretching region of the
activated zeolite: an asymmetric band at 3745 cm-1
and a broader band centered at 3600 cm-1
,
corresponding to the mode of isolated external silanols and BAS, respectively [12, 174, 175]
(Figure 4.6 top inset). The band associated with the isolated silanols generally exhibits a tail
on the lower frequency side, indicating the existence of silanol groups in different framework
environments (internal and perturbed) [14, 175].
Adsorption of CO at 77 K reveals the existence of different types of acid sites. The interaction
of CO with the bridging hydroxyl results in a decrease in the intensity at 3600 cm-1
concomitant of the appearance of broad band at 3280 cm-1
(Figure 4.6 top insets). This shift
can be considered as an estimation of the acid strength of zeolite. Upon increasing CO dosage,
the band associated with isolated silanols also shifts to lower wavenumbers (Figure 4.6 top
insets). Upon CO dosage, bands at 2174 cm-1
and at 2160 cm-1
in the CO stretching region
(Figure 4.6 bottom insets), corresponding to CO interacting with the BAS and with silanol
groups, respectively, are typically observed. The sharp band at 2138 cm-1
is assigned to
liquid-like CO phase condensed into the zeolite pores [12].

65
Figure 4.6. FTIR spectra of a H-ZSM-22 zeolite interacting with CO. Spectra after activation at 450 oC (red line)
at RT and after maximum CO dosage (blue line) at liquid nitrogen T. The insets shows FTIR spectra in the
hydroxyl (top) and CO (bottom) stretching region collected while outgassing CO from maximum (blue line) to
minimum coverage at liquid nitrogen T; grey lines correspond to intermediate CO coverages.
The concentration and accessibility of Brønsted and Lewis acid sites was determined by
pyridine adsorption monitored by FTIR. Complete consumption of the BAS band at 3600
cm-1
(Figure 4.7) is expected when all the BAS are accessible to pyridine. The concentration
of Brønsted and Lewis acid sites was obtained by the integration of the bands at 1545 cm-1
and 1455 cm-1
(Figure 4.7a) [176], respectively, and from the values of the extinction
coefficients using equations (6) and (7).
[𝑩𝑨𝑺] (𝒎𝒎𝒐𝒍
𝒈) =
𝑰𝑨𝟏𝟓𝟒𝟒 ∙ 𝑨𝒓𝒆𝒂𝒘𝒂𝒇𝒆𝒓 (𝒄𝒎𝟐)
𝜺𝑩𝑨𝑺(𝟎.𝟕𝟑) ∙ 𝑴𝒂𝒔𝒔𝒘𝒂𝒇𝒆𝒓(𝒎𝒈) (6)
[𝑳𝑨𝑺] (𝒎𝒎𝒐𝒍
𝒈) =
𝑰𝑨𝟏𝟒𝟓𝟐 ∙ 𝑨𝒓𝒆𝒂𝒘𝒂𝒇𝒆𝒓 (𝒄𝒎𝟐)
𝜺𝑳𝑨𝑺(𝟎.𝟔𝟒) ∙ 𝑴𝒂𝒔𝒔𝒘𝒂𝒇𝒆𝒓(𝒎𝒈) (7)
Pyridine adsorption analysis may underestimate the acid site density. This is due to the fact
that the diffusion of pyridine (5.7 Å) within the zeolite pores might be sterically limited, since
it is similar to the maximum channel opening of ZSM-22 and ZM-23 (Section 1.3).

66
Accessibility and diffusion
The accessibility and diffusion properties of the zeolites were investigated with time-
dependent uptake of toluene monitored by IR.
The measurements were carried out in a flow-through transmission cell connected to the
feeding system. The IT cell allowed continuous heating and cooling of the sample. The IR
measurements were performed on a Bruker Vertex 70 instrument with MCT detector.
The sample was pressed into a self-supporting wafer and placed on the sample holder inside
the transmission cell. Before the experiments, evacuation of the cell and activation the sample
was performed overnight at 450 oC using a nitrogen flow of 10 mL/min. The temperature was
lowered to 100 oC keeping the pure nitrogen stream. The partial pressure of toluene in
nitrogen was adjusted to 0.1 mbar. The uptake of toluene was monitored by collecting the IR
spectra with a time resolution of 2 sec.
The intensity of the IR band at 1495 cm-1
corresponding to the interaction with toluene
(Figure 4.7b) was used to quantify the amount of toluene adsorbed per mass of zeolite catalyst.
Figure 4.7. FTIR spectra of a H-ZSM-22 zeolite interacting with pyridine (a) and toluene (b). (a) Spectra after
activation at 450 oC (red line) and after pyridine adsorption (blue line) at rT. The inset shows FTIR spectra in the
pyridine region at maximum pyridine coverage. (b) Spectra after activation (red line) and after maximum toluene
uptake (blue line) at 100 oC and 0.1 mbar. The insets shows FTIR spectra in the toluene region collected while
dosing toluene up to a maximum (blue line); grey lines correspond to intermediate coverages.

67
4.3.7. Additional characterization
Temperature Programmed Desorption (TPD)
TPD of n-propylamine was used to determine the number of acid sites on c-ZSM-22 and c-
ZSM-22-ats1-HCl catalysts (only in Paper I). The Si/Al ratio was estimated assuming that
one propylamine molecule interacts with Al substitution to produce ammonia and propene
[177]. However, propylamine cannot read Al atoms that not incorporated in the zeolite lattice.
15 mg of catalyst were place in an 11 mm glass reactor and pretreated in a flow of oxygen at
550 oC for 1 h, before cooling to 150
oC. A stream of 50 ml/min of nitrogen bubbled through
n-propylamine at room temperature was then fed over the catalyst for 30 min in order to
adsorb the amine at 150 oC. After this, the catalyst was left at 150
oC for 4 h in a stream of 80
ml/min nitrogen to desorb the excess of amine. The temperature was then increased up to 550
oC with a heating ramp of 20
oC/min and kept at this temperature for 30 min. The amount of
propene desorbed was quantified using an on-line Pfeiffer Omnistar quadrupole mass
spectrometer.
Thermogravimetric Analysis (TGA)
TGA was used to determine the amount and stability of the oxidable coked species retained in
the pores of the relevant deactivated catalysts investigated in Paper I and Paper III. The
thermogravimetric measurements were carried out using a Stanton Redcroft TGA-DSC
instrument.
Approximately 15-20 mg of coked sample was loaded in a Pt crucible. The sample was heated
from room temperature up to 800 oC at a rate of 5
oC/min. Then the temperature was kept at
800 oC for 40 min. The measurements were performed under a constant and simultaneous
flow of 20 mL/min nitrogen and 5 mL/min oxygen while the mass loss was being acquired.

68
4.4. Operando High Energy XRD (HXRD)
Time- and space-resolved HXRD patterns were acquired at real time (operando) reaction
conditions. The method was used to investigate the unit cell variations of the catalyst during
the MTH reaction over H-ZSM-22 catalyst in different conditions (Paper I). Operando X-
Ray synchrotron radiation based powder diffraction patterns (PDP) were collected on BM01A
of the Swiss-Norwegian Beam Line (SNBL) at the European Synchrotron Radiation Facility
(ESRF).
All the PXRD data were acquired and processed by David Wragg and Wojciech A. Slawinski.
The PXRD data was acquired by a Pilatus 2M detector and integrated into a 1D powder
diffraction pattern. The wavelength used was 0.69811 A. The scattering vector length Q,
covered by the experiment was 0.43 Å-1
< Q < 4.50 Å-1
. During data collection the reactor
was moved back and forth through the beam. Individual PDPs were measured in 10-13
positions of the reactor with a time resolution of approximately 180 sec. The reactor was then
moved back with no data collection. The observed Bragg reflections showed significant
broadening due to the large dimension of the reactor bed. The experimental setup used at the
ESRF is schematically presented in Figure 4.8.
Figure 4.8. Scheme of the process for simultaneous acquisition of HXRD and catalytic data at synchrotron
facilities.

69
A separate experiment for the precise calculation of the unit cell temperature dependence was
performed in a 0.6 mm quartz capillary with standard hot air blower. The data collected with
this experiment assessed whether the unit cell variation was due to a thermal expansion or to
an accumulation of HCP species during the MTH reaction.
The PXRD structure refinement was done by David Wragg and Wojciech A. Slawinski. The
collected PDPs were analysed using Rietveld method implemented in FullProf program. For
each individual position of the reactor bed we refined PDPs in sequential mode. The crystal
structure of H-ZSM-22 samples was described in Cmcm space group. The a, b and c unit cell
parameters, common isotropic temperature factor for Si and O atoms were refined. The
observed peak shape was described using Pseudo-Voigt function and for peak width angular
dependence the Caliotti formula was used. We also used peak asymmetry correction below 8
deg. All atomic positions were fixed. In case of the analysis of the small capillary experiment
(thermal expansion of the unit cells) also atomic positions were refined.
4.5. Catalytic testing
4.5.1. Catalytic testing at home laboratory
All MTH catalytic tests were performed over acidic ZSM-22 and ZSM-23 catalysts at 400 oC
and WHSV ≈ 2 gg-1
h-1
, except for the catalytic tests performed at similar conditions (375 oC
and WHSV ≈ 2 gg-1
h-1
) to those used at the ESRF. These tests were performed to confirm the
differences in catalytic performance observed for the catalysts under operando conditions
(370-385 oC) than those observed at 400
oC. Most of the experiments in this thesis involve
only methanol as a reactant, whereas experiments carried out in Paper I also involve the co-
conversion of methanol and isopropanol. The experiments were performed using a reactor
system schematically presented in Figure 4.9.
The reactor system is equipped with five supply lines: Line 1 to 5. Lines 1 to 4 are connected
to helium and line 5 is connected to oxygen. Lines 1 and 2 were fitted with saturation
evaporators allowing the feeding of the liquid reactants. Saturator connected to line 1 was
filled with methanol (BDH Laboratory Supplies, >99.8 %) and saturator connected to line 2
was filled with isopropanol (Sigma Aldrich, >99.8 %). Helium from line 3 was used during
heating and cooling cycles. The flow of gases was regulated by Porter P-150 ball flowmeters

70
and measured using ADM2000 Universal flowmeter (Agilent Technologies). Desired reactant
flow rates (WHSV) were established by adjusting the carrier gas flow and temperature of the
water bath surrounding the saturators. The temperature of the oven was monitored using a
thermocouple fixed inside the oven.
Figure 4.9. Schematic representation of the reactor system for catalytic experiments carried out at home
laboratory.
Catalytic testing experiments were performed at ambient pressure using 50 mg of sample in a
fixed-bed quartz reactor with 10 mm diameter. The protonated zeolite was pressed into wafers,
crushed and sieved to obtain particles in the 250-420 µm range before transferring it to the
reactor. Before each catalytic experiment the samples were calcined in situ in a flow of pure
oxygen at 550 ºC for 1 hour in order to remove species adsorbed during catalyst handling and
storage. Methanol was fed by passing helium through a saturation evaporator kept at 20 oC
(pMeOH = 130 mbar) to the inlet of the reactor. The temperature of the reaction was monitored
using a thermocouple with a quartz thin cover inserted at the bottom of the catalyst bed. The
product stream was analysed online using an automatic injection Gas Chromatograph (GC)
connected to the reactor outlet by a heated transfer line. An Agilent 6890N GC with FID,

71
equipped with a HP-PLOTQ capillary column (15 m, 0.320 mm i.d. film thickness 20 µm)
was used for the analysis. The temperature of the GC oven was programmed between 90 and
270 oC with a heating rate of 20
oC/min (hold time of 5 min at 90
oC and at 220
oC and 9 min
at 270 oC).
For the co-feeding experiments isopropanol was used as a precursor for propene. The
reactants were fed from two different saturators at 20 oC each containing methanol or
isopropanol, using He as carrier gas. The partial pressure of the reactants was pMeOH = 130
mbar and pi-PrOH = 13 mbar and the total He flow 10 ml/min.
Methanol conversion (X), product selectivity (S) and product yield (Y) were calculated from
GC-FID areas, following the equations (8)-(10) shown below. Methanol and dimethyl ether
(DME) were considered as reactants, while all effluent non-oxygen hydrocarbons were
considered reaction products. Appropriate response factors were used for the integrated peak
areas for methanol (0.776) and DME (0.598). No correction was employed for the integrated
peak areas of the hydrocarbons.
𝑋𝑖(%) =𝑎𝑟𝑒𝑎 𝑜𝑓 𝐻𝐶 𝑝𝑟𝑜𝑑𝑢𝑐𝑡 𝑝𝑒𝑎𝑘𝑠
𝑡𝑜𝑡𝑎𝑙 𝑝𝑒𝑎𝑘 𝑎𝑟𝑒𝑎 × 100 (8)
𝑆𝑖(%) =𝑎𝑟𝑒𝑎 𝑜𝑓 𝐻𝐶 𝑝𝑟𝑜𝑑𝑢𝑐𝑡 𝑝𝑒𝑎𝑘 𝑖
𝑎𝑟𝑒𝑎 𝑜𝑓 𝐻𝐶 𝑝𝑟𝑜𝑑𝑢𝑐𝑡 𝑝𝑒𝑎𝑘𝑠 × 100 (9)
𝑌𝑖(%) =𝑎𝑟𝑒𝑎 𝑜𝑓 𝐻𝐶 𝑝𝑟𝑜𝑑𝑢𝑐𝑡 𝑝𝑒𝑎𝑘 𝑖
𝑡𝑜𝑡𝑎𝑙 𝑝𝑒𝑎𝑘 𝑎𝑟𝑒𝑎 × 100 (10)
For the reaction involving co-conversion of methanol and isopropanol, product molecules
cannot be used for the calculation of conversion due to the presence of reactants in both
reactant and product streams. The area of oxygenates (methanol and DME) over the fully
deactivated catalyst was used as a reference area (𝐴𝑟𝑒𝑓). The conversion is then calculated as
follows.
𝑋 (%) = 100 −𝑐𝑜𝑟𝑟𝑒𝑐𝑡𝑒𝑑 𝑝𝑒𝑎𝑘 𝑎𝑟𝑒𝑎 (𝑀𝑒𝑂𝐻 𝑎𝑛𝑑 𝐷𝑀𝐸)
𝐴𝑟𝑒𝑓 × 100 (11)

72
Note that this procedure implies an increasing uncertainty in the calculated conversion at
decreasing conversions. The distributions of hydrocarbon products in the effluent were
reported as reactor outlet composition in C%, due to the complications caused by the presence
of alkenes in both the reactant and the product streams.
4.5.2. Catalytic testing at ESRF
The catalytic setup constructed at the SNBL at ESRF (Figure 4.8) allowed to simultaneously
monitor the catalyst activity and unit cell volume variations by time- and space-resolved
HXRD in operando conditions.
The ESRF laboratories were equipped with a gas panel, which allowed using different lines
and reaction gases from the SNBL gas mixing system. The testing conditions were adjusted to
be the same as the ones described for the experiments at our home laboratories with some
distinctions that are now described. Catalyst sieved powder samples (50 mg) were placed
between two layers of quartz wool in a specially prepared quartz cylindrical reactor with a
diameter of 10 mm. Reaction gases (helium, oxygen diluted in helium or helium bubbled
through methanol or isopropanol saturators at 20 oC with a temperature difference of 1
oC)
with the desired flow rate were fed to the reactor. The reactor was mounted horizontally on a
Huber stage capable of translations in the flow direction. The setup was connected on one side
(inlet) with a T-connection (allowing feed of the reactants) to a Huber goniometer head used
for alignment, and on the other side (outlet) to a locally heated transfer line connected to a
Pfeiffer Omnistar MS. The reactor zone was heated with a Leister LE mini heating gun fitted
with heat spreader to keep the temperature at 370-385 oC. The temperature along the
horizontal catalytic bed was measured by inserting a thermocouple into the center of the
sample and varied in a range of 15 oC between the extremes and center of the reaction zone.
When the experiments were carried out only with methanol, a flow rate of 10 ml/min was
used. For the co-feed experiments the flow rate of methanol and isopropanol were adjusted to
10 and 3 ml/min, respectively, to reach a total WHSV of 2 gg-1
h-1
. After the reaction, the
deactivated samples were gently divided in 3 segments (inlet-middle-outlet) and collected to
further analysis. For the reactions involving only methanol, the conversion was calculated
from the methanol signal in the MS normalized by the helium signal as follows:

73
𝑋 (%) = 100 −𝑀𝑒𝑂𝐻𝑡−𝑀𝑒𝑂𝐻𝑚𝑖𝑛
𝑀𝑒𝑂𝐻𝑚𝑎𝑥−𝑀𝑒𝑂𝐻𝑚𝑖𝑛 × 100% (12)
The signal-to-noise ratio of the MS data was rather high. Therefore, selected data points
representative of the deactivation trend were chosen and the resulting curve was smoothed to
facilitate interpretation.
For the reaction involving co-conversion of methanol and isopropanol, the conversion was
calculated in the same way from the methanol signal, since calculations using 𝐴𝑟𝑒𝑓 from MS
data gave too low signal-to-noise ratios.
4.5.3. Analysis of the retained species
The identity and distribution of the hydrocarbon species retained in the catalyst pores after
reaction was carried out by dissolving the coked catalyst and analysing it on an offline Gas
Chromatography-Mass Spectrometer (GC-MS).
Retained hydrocarbons were investigated by dissolution experiments. Approximately 15 mg
of coked zeolite was dissolved in a small capped Teflon vial with 1 ml 15 wt% HF (Fluka,
40 %). Addition of 1 ml of dichloromethane (Merck, > 99 %) with o-chlorotoluene as internal
standard allowed the extraction of the organic phase for further analysis by GC-MS. An
Agilent 7890A GC connected to an Agilent 5975C mass-selective detector with a HP-5MS
column (60 m, 0.25 mm i.d., stationary phase thickness 0.25 µm) was used for the analysis.
The temperature of the oven was programmed between 50 and 300 oC with a heating rate of
10 oC/min (hold time of 3 min at 50
oC and 15 min at 300
oC). The mass spectral library of the
NIST98 database was used for identification of the retained species.

74
5. Summary of Results
s stated in the Scope, this chapter summarizes the main results obtained during this
Ph.D. work. Rather than presenting the papers in chronological order, the results are
presented in the most natural order to allow a consistent follow-up of the work. Furthermore,
this chapter briefly presents results that have not been submitted to publication, but contribute
to the rest of the work. Detailed discussion of the results and additional graphs are provided in
the papers attached as an appendix to the Thesis. The chapter is divided into four sections.
Section 5.1 provides the principal results from the extensive investigation of the preparation
of a large body of desilicated ZSM-22 zeolites and their characterization (reported in Paper
II). The properties of the zeolites were studied using two different parameters: the features of
the starting zeolite (commercial or in house synthesized) and the desilication method
employed for the creation of mesopores (NaOH, mixtures of CTAB/NaOH and mixtures of
TBAOH/NaOH), followed by acid washing. The composition, morphology, textural and
acidity modifications are investigated with particular emphasis in the mesopore development.
In Section 5.2, the performance of the mesoporous H-ZSM-22 materials as improved catalysts
for the MTG conversion is investigated. An attempt is made to correlate the catalytic
performance to the characterization data from Section 5.1 and also to diffusion and
accessibility features based on additional spectroscopic methods. The influence of the post-
synthetic treatments on the catalytic lifetime and total conversion capacity, as well as on the
product distribution and mechanisms of the MTH reaction is examined. Paper III forms the
basis of this section. In addition, the main results from the structure-deactivation relations
obtained by time- and space-resolved operando HXRD studies over commercial H-ZSM-22
catalysts and the effect of surfactant-assisted desilication and acid washing as well as the
effect of product co-feed are presented as a summary of the work carried out in Paper I. The
effect of internal silanol defects on the catalytic performance is also investigated.
The main body of this work comprises the studies on ZSM-22 zeolites. In Section 5.3 the
preparation, characterization and catalytic investigations are extended to the also
unidimensional ZSM-23 zeolite with MTT topology.
A

75
5.1. Effect of the post-synthetic modifications on the
catalyst properties
5.1.1. Relevance of the starting material on the mesopore
generation
As mentioned in Chapter 3, the composition and crystal morphology of the starting zeolites
may strongly influence the extent of crystal dissolution upon desilication and the resulting
pore structures. Two parent ZSM-22 zeolites, the commercial c-ZSM-22 and the in house
prepared m-ZSM-22, are the starting materials for this study. In Section 4.3 it was confirmed
that both samples consist of a highly crystalline TON structure.
Both c-ZSM-22 (Si/Al = 49) and m-ZSM-22 (Si/Al = 38) zeolites displays a Si/Al ratio within
the optimum for efficient desilication (25–50) as found by Groen and co-workers for MFI
zeolites [114]. This implies that the composition of the starting zeolite should not represent an
impediment for efficient mesopore formation. As discussed in Section 3.1, the location of
gradients in Al concentration in the zeolite crystal may also influence the mechanism of
mesopore generation, since mesopores will be preferentially developed from low Al
framework environments. However, none of the characterization techniques used in this work
was appropriate to identify areas with higher or lower Al concentration within the zeolite
particle, and the possible effect, if any, will need to be speculated from the morphology of the
already desilicated crystals.
The yields of the desilication treatments (defined as 100 – weight loss % after desilication) are
reported in Table A.1 of the Appendix. In principle, the m-ZSM-22 zeolite with lower Si/Al
ratio is expected to be more difficult to desilicate than c-ZSM-22, due to the aforementioned
protective effect given by the Al. However, a similar extent of crystal dissolution was
obtained independently of the starting material. Overall, the same desilication approach led to
similar yields for both the commercial and the in house prepared samples.
With respect to the morphology, differences are found between the two starting ZSM-22
samples. SEM micrographs for the commercial and in house prepared ZSM-22 zeolites are
shown in Figure 5.1a and b, respectively. TEM images of the parent zeolites (together with
the desilicated samples) are displayed in Figure 5.2. The c-ZSM-22 zeolite shows a complex

76
morphology. The rod-like particles of dimensions of about 2–4 x 0.5 μm appear to be an
agglomeration of more defined nanorods with lengths from 600 nm and up to 200 nm in width.
These nanorods can be interpreted as the primary particles which are aligned into the rod-like
bigger crystals, thus following the mode of crystallization previously described by Hayasaka
et al. [178]. The m-ZSM-22 zeolite displays more defined needle-shaped crystals with a broad
distribution of lengths but with regular thickness of about 30–60 nm.
Figure 5.1. SEM images for the commercial c-ZSM-22 (a) and in house prepared (b) parent zeolites.
As one of the main findings of this work, the morphology of the starting zeolite crystal was
found to be the dominant parameter which influences the mesopore generation. TEM images
of the desilicated zeolites clearly reveal that different zones of the crystal were preferentially
dissolved during desilication depending on the starting material. The inner zones of the rod-
like c-ZSM-22 crystals were the most affected, resulting in the creation of intra-crystalline
mesopores. In contrast, the thinner dimensions of the needle-shaped m-ZSM-22 particles
represent an obstacle for intra-mesopore creation. Instead, the external surfaces of the needle
crystals were preferentially affected, resulting in eroded nanoparticles with high exposed
surface area. This was obvious when the parent zeolite was treated with CTAB at lower
alkaline concentrations (m-ZSM-22-ats2). Furthermore, the mode of crystal dissolution might
also be influenced by an uneven distribution of the Al: a lower Al concentration on the
external surface of the m-ZSM-22 crystal may result in a lower protective effect against the Si
extraction in this zone, as proposed by Dessau et al. [115]. The c-ZSM-22-ats2 sample
(treated with CTAB/NaOH at high concentration) shows the most clear intra-crystalline
mesopores, which are most likely created via selective dissolution of siliceous zones from the
bulk crystal. For the rest of the desilicated commercial zeolites, mesopore formation by
preferential dissolution along boundaries and framework defects within the crystal, as
discussed in Section 3.1, cannot be dismissed.

77
Figure 5.2. TEM images for the parent and desilicated commercial (left) and in house prepared (right) zeolites.
Framework defects can be identified from the FTIR spectra of the activated zeolite. Previous
spectroscopic studies using pyridine and bulky 2,4,6-collidine as probe molecules for
determining the location of silanol groups in ZSM-5 [175], concluded that the frequency
bands at 3700-3735 cm-1
in the activated FTIR spectra are associated with the presence of OH
groups interacting weakly with Si in different environments inside the zeolite framework,

78
which might be present as internal framework defects. Figure 5.3 shows the FTIR spectra of
the protonated c-ZSM-22 and m-ZSM-22 zeolites, together with one sample of each post-
synthetic approach activated at 450 °C. The absorbance seen at wavenumbers ranging from
3650 cm-1
to 3735 cm-1
varies with respect to the starting material. The commercial material
has a substantially higher absorbance in this region relative to the in house prepared material,
indicating a larger contribution of internal silanols and thus higher amount of defects. Such
defects, hence, might initiate the mesopore generation from the commercial ZSM-22 crystal
as proposed by Ogura et al. [123] and Svelle et al. [124], confirming the observations derived
from the TEM investigations. Further, the raised baseline seen for the in house prepared
zeolite in this region is no longer noticeable for the desilicated samples. Conversely, the
intensity was not noticeably reduced, or even increased, after the desilication treatments of the
commercial zeolite. A rationalization of this behaviour might be found in the TEM analysis.
The shrinking of the thinner, aggregated crystals of the m-ZSM-22 zeolite after desilication
might also have cleaned up the defects in the micropores near external crystal zones. On the
other hand, desilication of the larger c-ZSM-22 crystals did not remove the weaker silanols,
but resulted in a larger contribution of defects, which might be located on the created
mesopore surface inside the zeolite crystal.
Figure 5.3. FTIR spectra of the parent and post-synthetic treated commercial (a) and in house prepared (b)
ZSM-22 zeolites activated at 450 °C in the hydroxyl stretching region.

79
As expected for the m-ZSM-22, having a lower Si/Al ratio, the intensity of the 3600 cm-1
band, associated with the BAS, is larger compared to the c-ZSM-22. However, the
concentration of Brønsted sites, as determined by IR spectroscopy of adsorbed pyridine
(Table A.2 of the Appendix), is the same for both samples. This is a result of the inaccessible
microporosity of the m-ZSM-22 sample, which might be caused by the presence of stacking
faults or MTT/TON intergrowths [179], preventing the diffusion of the probe molecule
through the unidirectional channel system. The low micropore volume of the m-ZSM-22
sample (Table A.1 of the Appendix) could be also responsible of the lack of intra-crystalline
mesoporosity formation upon the treatments, because bases and/or silicates species cannot
diffuse freely through the unidirectional channel system.
5.1.2. Effect of the desilication and acid treatments
The PXRD diffractograms (Figure A.1 of the Appendix) confirmed that the crystallinity of the
starting zeolites was maintained after the post-synthetic treatments. Some of the XRD patterns
show loss of crystallinity. The XRD peak intensities of reflections at 25o diminish in samples
c/m-ZSM-22-tba1-HCl, c/m-ZSM-22-tba2-HCl, m-ZSM-22-ats2, m-ZSM-22-ats2-HCl. Full
plate was not used, so the intensities are not fully comparable. As expected, the solid yield
was reduced with the severity of the treatment for each desilication series (Table A.1), i.e. the
more severe treatments led to more extensive crystal dissolution (see References in Table 3.1).
Figure 5.4a presents the variation of the Si/Al ratio as a function of the NaOH molarity for the
desilicated samples. The numerical values are reported in Table A.1 of the Appendix. The
dashed (reference) curve indicates the Si/Al ratio variation when only NaOH was used as
desilication agent. As expected from the similar dissolution rates, also similar reduction of the
Si/Al ratio is systematically observed for the commercial and in house prepared materials with
increased NaOH concentration. After a drastic reduction of the initial Si/Al ratio upon the
mild treatment, the severe NaOH solution reduced the Si/Al to a lesser extent, suggesting an
upper limit for Si extraction given by the less severe NaOH concentration. Slightly less
pronounced reduction is observed for the in house prepared zeolites, which is an indication of
the (little) protective effect of Al in m-ZSM-22 against Si-O bond breaking. When CTAB or
TBAOH were added to the alkaline solution, the Si/Al ratios deviate from the reference curve,
but similar trends are obtained with the commercial or in house prepared samples. The low

80
concentrated surfactant-assisted approach (ats1) leads to Si/Al ratios above the reference
curve. Together with the lower yield, this indicates that the crystals were less dissolved upon
this treatment, confirming that the surfactant protects the zeolite structure against the attack of
the OH-, as anticipated in Section 3.2. On the other hand, the lower Si/Al ratio achieved at the
higher CTAB concentration (ats2) compared to the NaOH treatment suggests that the OH-
attack prevails at higher concentrations, and the protective effect of the surfactant is lost. In
this case, the dissolved silica aggregates might also be stabilized which in turn shift the
equilibrium to further dissolution. With respect to the tba treatment, the reduced Si/Al ratio
and the highest yields are indicative of a more selective Si removal. The increase of the
temperature of the treatment had little impact beyond slightly more Si extraction.
Figure 5.4. (a) Si/Al ratio as a function of NaOH molar concentration for the commercial and in house prepared
desilicated samples (dashed red curve shows the reference effect of the only alkaline treatment); and Si/Al ratio
for the parent, desilicated and acid-washed commercial (b) and in house prepared (c) zeolites.
Detailed examination of the TEM micrographs shows that the different desilication methods
differently influence the mesopore creation for the c-ZSM-22 zeolite. The conventional
NaOH treatment resulted in both roughening of the crystal surface and creation of non-
uniform mesopores (Figure 5.2b), whereas when CTAB (Figure 5.2c) or TBAOH (Figure
5.2d) agent was added to the alkaline solution, well-defined intra-crystalline mesopores were
obtained. The crystal edges appear to be less affected in this case, confirming that the addition
of PDA provides better control of the mesopore generation, as cited in Section 3.2. TEM
observations are supported by the nitrogen sorption measurements. The nitrogen
physisorption isotherms and the BJH pore size distribution plots of the parent and post-
synthetic treated samples are shown in Figure 5.5 and Figure 5.6, respectively. As seen from

81
Figure 5.5.a-c, the desilication treatments over the commercial ZSM-22 zeolite led to the
transformation of the microporous type I isotherm into type II-IV isotherms with hysteresis
loop at higher partial pressures, characteristic of mesoporous materials, and this remains for
the acid-washed counterparts (Figure 5.5d-f). The non-uniform distribution of mesopores
observed for the commercial samples treated with NaOH (Figure 5.6a) supported in this case
that the zeolite crystal was irregularly dissolved. For the commercial samples treated with
CTAB/NaOH, the BJH analysis (Figure 5.6b) clearly revealed defined mesopores of 2-3 nm
in size, thus verifying the small mesopores seen by TEM. As a technical point, the size of the
mesopores fall within the smaller range typically found for mesopores obtained by the use of
CTAB as surfactant (3-10 nm), as indicated in Section 3.2. The voids observed by TEM of the
TBAOH/NaOH treated commercial samples appear to be larger than the ones generated by
the surfactant-aided method. This is confirmed by the larger mesopores of 2-10 nm in size
evidenced in the BJH plot (Figure 5.6c). These mesopores are still small enough to be
accommodated within the ZSM-22 particles. With respect to the in house prepared ZSM-22
zeolites, the same shape of the parent m-ZSM-22 isotherm holds for the treated samples
(Figure 5.5g-i and j-l), with absence of hysteresis loop. Together with the absence of defined
mesopores in the BJH pore size distribution (Figure 5.6d-f), this confirms the microscopy
observations: the m-ZSM-22 crystals with size of ~50 nm does not provide enough room for
making large pores. Indeed, pores of 10 nm represent 20 % of the total thickness. As
anticipated in Section 3.1 the formation of inter-crystalline mesopores by roughening of the
crystal surface is favoured in this case.
The numerical results from the nitrogen adsorption experiments are listed in Table A.1 of the
Appendix. Contrary to most desilication studies over unidimensional 10-ring zeolites (see
Table 3.1 in Section 3), the microporosity of the c-ZSM-22 sample was generally unaffected
by the desilication treatments, as also indicated by the similar uptake at low partial pressures
of the isotherm. Only the c-ZSM-22-tba2 sample shows a ~ 38 % loss in micropore volume,
also seen in the reduced uptake (Figure 5.5c). The microporosity of the m-ZSM-22 was
drastically reduced after the surfactant-assisted and the high temperature TBAOH/NaOH
treatment, whereas the rest of the treatments resulted in an increased micropore volume. As
the crystallinity was intact, this reduction is most likely caused by extra-framework species
re-deposited on the pore entrances (see below). A reduction of the total surface area (SBET) is
observed for the samples with reduced microporosity. Micropore volume and SBET follow
each other quite closely (R2 = 0.87, 27 data points), as shown in Figure A.2a of the Appendix.

82
Figure 5.5. Nitrogen adsorption-desorption isotherms for the parent, desilicated and acid washed ZSM-22
samples (a-c): commercial desilicated, (d-f) commercial acid-washed; (g-i): in house desilicated, (j-l) in house
acid washed). The insets highlight particular regions of each plot.

83
Figure 5.6. Effect of the post-synthetic treatments on the BJH mesopore size distribution (calculated from the
adsorption branch of the isotherm) for the commercial (a-c) and in house prepared (d-f) ZSM-22 samples.
As introduced in Section 3.3, the acid washing was expected to have a marked influence on
the porosity of the samples for which micropore volume was reduced upon desilication.
Indeed, the microporosity of the samples treated with the high temperature TBAOH/NaOH
solution was restored both in commercial and in house prepared materials (Table A.1 of the
Appendix), also seen in the increase in N2 uptake (insets in Figure 5.5e, l). This suggests that
the acid treatment successfully removed the re-deposited extra-framework species. However,
the micropore volume of the surfactant treated in house prepared samples was not affected by
the acid treatment (Table A.1), indicating that the acid leaching was not sufficient to remove
the blocking species in this case, most likely because the ellipsoidal unidirectional channels of
ZSM-22 prevents these species to diffuse out of the framework.

84
The external surface area (Sext) and external pore volume (Vext) are generally correlated, but
with substantial spread (linear regression of the entire dataset gives a positive slope, but a
quite poor value R2 = 0.14 in Figure A.2b of the Appendix). As a general observation, Sext and
Vext were intact or substantially increased for the samples after the various treatments.
Particularly, the high temperature TBAOH/NaOH treatment over the m-ZSM-22 sample
resulted in an increase of the Sext, whereas the Vext was reduced, suggesting a larger
dissolution of the outer crystal surface. The presence of extra-framework species, apart from
blocking the micropores, might inhibit the creation of mesopores in this case. The actual
mesoporosity seen by TEM and BJH analysis for the commercial treated zeolites should also
be reflected as increased Sext or Vext. However, Sext and Vext of the cited samples do not stand
out from the rest of samples, suggesting a minor influence of the actual mesoporosity in the
external properties. Only the sample treated with the severe surfactant-assisted method (c-
ZSM-22-ats2) showed a marked increase in Sext as a consequence of the created mesopores.
As seen in Table A.1 of the Appendix and from the similar shapes of the nitrogen isotherms,
the acid washing affected the Sext and Vext of the desilicated samples to a lesser extent.
Noteworthy, the acid washing of the commercial sample treated with low NaOH
concentration (c-ZSM-22-at1-HCl) caused a remarkable increase of the Vext compared to the
rest of acid washed samples. For the in house prepared series, the main finding was a
significant reduction of the Vext after the acid washing of the surfactant treated samples.
Furthermore, the acid washing of the fresh ZSM-22 commercial sample (c-ZSM-22-HCl) did
not have any remarkable influence on the textural properties (Table A.1).
5.1.3. Composition – porosity – acidity interdependence
During the post-synthetic treatments several parameters are simultaneously varied. As
indicated in Chapter 3, desilication not only causes the dissolution of the crystal upon Si
removal, but also a reorganization of the Al species in the framework. Therefore, the
observations herein cannot be understood without assuming a combined effect of the
composition (Si/Al), porosity and acidity modifications during the process.
The discrepancies observed between the extent of dissolution (or yield) and the resulting
decrease of the Si/Al ratio suggest that apart from Si, Al is extracted upon desilication. This
Al can be either redistributed as EFAl species, or extracted from the crystal, or both [13], as

85
discussed along Section 3. Indeed, Figure 5.4b and c shows that the acid treatment returned
the Si/Al ratio of the desilicated samples to the original value of ~49 for the commercial
zeolites and ~38 for the in house prepared materials. These results strongly support the idea of
the extraction of framework Al and redeposition as EFAl species upon desilication. This EFAl
species are then removed with the acid leaching, causing the rise of the Si/Al ratio. As an
exception, the Si/Al ratio of the m-ZSM-22-ats2 sample did not vary after the acid treatment,
suggesting that either no EFAl species were generated, or that the acid was not capable of
washing them out.
As seen from Figure 5.3, the band associated with the BAS at 3600 cm-1
is slightly reduced,
whereas the isolated silanol band at 3745 cm-1
is significantly increased after the desilication
treatments over the commercial zeolite. These effects were more pronounced when the
surfactant-assisted method was employed (c-ZSM-22-ats1). The results indicate that the
concentration of Brønsted sites do not substantially change upon desilication, in contrast with
the general findings reported for one-dimensional zeolites (see Table 3.1), but in agreement
with studies of desilicated MFI zeolites [143]. However, the Si/Al ratio decreased upon
desilication (Figure 5.4). Then, desilicated samples must give higher acid site concentration if
Al remained the same. This again indicates the existence of EFAl species in the desilicated
materials. The larger concentration of external silanol groups is readily associated with the
increment of the exposed external surface [14, 106, 124, 150, 153, 160], where more silanol
groups can be located. Conversely, less mesopore-generated surface can be linked to a lower
contribution of external silanol groups. Focusing on the desilicated in house prepared zeolites,
a general reduction of the intensity of the 3600 cm-1
band is evidenced, indicating that the
desilication process also removed Al from framework Si(OH)Al positions. Together with the
microscopy, the results suggest that most of the Al is extracted from external acidic positions,
reducing the protecting effect on neighboring Si atoms and thus promoting the desilication in
external surface areas. Noteworthy, the surfactant treatment resulted in a narrower and more
intense band at 3745 cm-1
, as a result of larger contribution of silanols located at the created
external surface on the more dissolved crystal boundaries of this sample.
Figure 5.3 shows that the distribution of surface sites (BAS, SiOH) of the desilicated samples
was barely affected by the acid washing, which indicates that removal of the redeposited
EFAl species occur without a marked alteration of the strong Brønsted acidity. The band
associated with the isolated silanol groups at 3745 cm-1
increased significantly after the acid
washing of the commercial alkaline treated sample (c-ZSM-22-at1-HCl) in Figure 5.3a,

86
suggesting that the acid washing contributes to clean up not only the strong acid sites, but also
to some extent the silanol defects. By using CO as a probe molecule, it was shown that the
acid strength of the BAS is practically unaltered by the post-synthetic treatments.
For a detailed study of the simultaneous variation of the zeolite properties upon desilication, a
correlation between the amount of acid sites, as calculated from pyridine adsorption
measurements (equations 6 and 7 in Section 4.3), and the Al concentration is established.
Table A.2 of the Appendix presents the BAS, LAS and BAS+LAS concentration, together
with the total amount of Al as calculated from elemental analysis. Pyridine adsorption
experiments also provide information of the accessibility to the acid sites. Figure 5.7a shows
that the Brønsted acid site band at 3600 cm-1
of the parent m-ZSM-22 zeolite after pyridine
dosing is not completely eroded, indicating that BAS are not fully accessible to pyridine, in
accordance with the inaccessible microporosity. Clearly, the access to the BAS was
drastically hampered for the m-ZSM-22-ats1 sample Figure 5.7d and this is due to the
micropore blockage already seen for this sample. Also, a small fraction of BAS does not seem
to be accessible to pyridine for m-ZSM-22-at1 and m-ZSM-22-tba1 samples. The erosion of
the BAS band of the m-ZSM-22-at1-HCl sample (Figure 5.7c) implies that the Brønsted sites
of the desilicated counterpart are accessible after the acid washing. On the other hand, BAS
were still inaccessible after the acid washing of the m-ZSM-22-ats1 sample (Figure 5.7e), in
line with the reduced micropore volume observed for this sample. The same analysis
demonstrated the absence of accessibility limitations for the commercial samples,
demonstrating that pyridine can reach acidic sites in the micropores.
The data from Table A.2 is graphically represented in Figure 5.8a. The dotted line represents
the situation where all the Al atoms form acidic sites. The deviation of the parent c-ZSM-22
zeolite from the dotted line together with the low contribution of Lewis acidity seen in Figure
5.8b (ratio BAS:LAS of 8:1 as seen in Table A.2), suggests that non-acidic Al species are
already present in the starting material. The m-ZSM-22 parent material deviates more from
the reference line. However, together with the presence of Al in non-acidic positions, the
limited access to the BAS also contributes to the deviation in this case.

87
Figure 5.7. FTIR spectra of the parent (a), desilicated (b, d and f) and acid washed (c, e and g) in house prepared
ZSM-22 zeolites in the hydroxyl stretching region activated at 450 oC (red line) and after pyridine adsorption
(blue line).

88
Two different features are readily observed for the treated samples. On one hand, the
concentration of acid sites is generally lower than the total Al concentration for the
desilicated samples (solid points in Figure 5.8a), but higher of that of the starting materials.
The m-ZSM-22-ats1 sample (red point) shows a marked low contribution of acid sites, as a
result of the hindered access of pyridine to the acidic sites. Figure 5.8b (and Table A.2)
shows that desilication lead to approximately a fourfold increase of LAS concentration
relative to the corresponding parent material, with the exception of two samples: for m-ZSM-
22-tba1 the contribution of LAS was doubled and no remarkable increase was observed for
the for m-ZSM-22-ats1 sample. As aforementioned, LAS are associated with EFAl species.
The rather low contribution of LAS for both surfactant- and acid-treated samples suggests
that other extra-framework species than Al3+
(Lewis sites) cause the hindrance effect. On the
other hand, the acid washed samples follow closely the dotted line (open symbols in Figure
5.8a), indicating a very similar concentration of acidic sites and total Al. The m-ZSM-22-
ats1-HCl sample clearly deviates from this behavior. However, the general trend is that the
acidity is recovered after acid washing. At the same time, the Lewis acidity is reduced with
respect to the desilicated analogues (open symbols in Figure 5.8b), supporting the notion of
the removal of EFAl species by the acid leaching and linking EFAl species to LAS.
Figure 5.8. (a) Correlation between total Al concentration and concentration of acidic sites (BAS + LAS) and (b)
interdependence between Lewis acidity and external surface area for the parent and selected treated zeolites.

89
It is generally accepted that the LAS associated with EFAl species are redeposited on the
external zeolite surface after desilication [14, 106, 127]. In the present study, Lewis species
can be assumed to be redeposited on the external surface of the in house prepared crystals or
on the mesopore surface created for the commercial samples, before being washed out by the
acid. As seen from Figure 5.8b, the amount of LAS of the desilicated samples reached a level
where any further increment in Sext does not imply a further gain in Lewis sites. This suggests
that the formation of LAS is limited by another parameter, such as the initial number Al
species in non-framework positions.
The origin of the EFAl species generated and redistributed upon desilication is discussed now.
As mentioned, BAS concentration should increase since Si/Al decreases upon desilication.
However, the process over the commercial sample occurs without a pronounced alteration of
the Brønsted acidity, which suggests a transformation of Brønsted to Lewis acid sites. As
aforementioned, there is a fraction of non-acidic species already present in the starting
material. It is speculated that these species remain after desilication, and that part of them also
generate Lewis acid sites. The extra-framework species, including a substantial part of Lewis
groups, are eventually removed by acid washing. Regarding the in house prepared series, both
contributions of framework Al in Si(OH)Al groups and non-acidic species present in the
starting material could contribute to the formation of Lewis species.
5.2. Assessing the catalytic consequences
5.2.1. Improvement of the MTH performance
Among the extensive amount of samples prepared and characterized, the catalytic
performance of one sample from each post-synthetic approach over the two microporous
ZSM-22 zeolites is investigated in this Section. These samples showed generally higher
surface area, micropore and external volume and enhanced accessibility to the acid sites than
the parent zeolites.
The methanol conversion versus time on stream plots at 400 oC and WHSV of 2 h
-1 are
presented in Figure 5.9a, b for the commercial and in house prepared treated catalysts,
respectively. The total methanol conversion capacity, calculated as the total grams of

90
methanol converted per gram of catalyst, was used to quantitatively study the capacity of the
catalysts for converting methanol into hydrocarbon products until complete loss of activity
(Figure 5.9c, d). The microporous catalysts (c-ZSM-22 and m-ZMS-22) showed a lifetime of
nearly 3 h until complete deactivation, which is shorter than the maximum lifetime previously
reported [79]. The suggested stacking faults and the low micropore volume of the m-ZSM-22
catalyst may be the cause of the rapid deactivation since the diffusion of reacting molecules
through the pores may be slower causing an easier build-up of coke species.
Figure 5.9. Methanol conversion versus time on stream (top panels) and total methanol conversion capacity
(bottom panels) for the parent and treated commercial (a and c) and in house prepared (b and d) ZSM-22
catalysts, at WHSV = 2 h-1
and T = 400 oC. t1/2 indicates the time at which the conversion decreased by 50%.
Insets show the performance during the first 90 minutes on stream.

91
The hierarchical catalysts show enhanced initial activity and longer lifetime with respect to
the microporous H-ZSM-22 catalysts, also reflected in analogous increased conversion
capacities. The surfactant treated catalyst (c-ZSM-22-ats1-HCl) showed the longest lifetime
and exceptional enhancement of the total conversion capacity up to 30 g g-1
, which represent a
10-fold increase from the parent c-ZSM-22 catalyst. The NaOH treated catalyst (c-ZSM-22-
at1-HCl) displayed a notable increase in lifetime and conversion capacity, analogous to the
high concentrated surfactant treated catalyst (c-ZSM-22-ats2-HCl). The TBAOH treatment
(c-ZSM-22-tba2-HCl) had a modest influence in lifetime and conversion capacity, with an
increase up to 8 g g-1
, which is roughly a three-fold increase from that of c-ZMS-22. The only
acid washing (c-ZSM-22-HCl) had no evident influence on the conversion capacity, that
highlights that sequential desilication and acid leaching is necessary to improve the catalytic
performance of the microporous catalyst. With respect to the in house prepared series, the best
increase of more than 17 times in conversion capacity, up to 30 g g-1
, was evidenced for the
NaOH treated catalyst (m-ZSM-22-at1-HCl). An 8-fold increase is achieved for the catalyst
treated with TBAOH (m-ZSM-22-tba1-HCl), whereas the surfactant treated catalyst (m-ZSM-
22-ats1-HCl) showed a minor variation. The trends in increased performance are somehow
opposite for the two parent H-ZSM-22 catalysts, suggesting that the influence of the starting
material on the change in the catalyst properties is also reflected in the catalytic behaviour.
As mentioned in Section 2.5, the potential of ZSM-22 as MTH catalyst resides in their ability
to produce environmental friendly gasoline product precursors. Apart from prolonging the
lifetime, one of the main goals of this work was to maintain the H-ZSM-22 yield towards
aromatic-free C5+ alkenes [25, 77, 79] after the post-synthetic treatments. This involves that
the micropore topology should not be altered upon the treatments. Previous MTH studies
conducted over a range of residence times, concluded that the ZSM-22 shape selectivity was
independent of the degree of coking and may be described solely as function of conversion
[78]. Accordingly, differences in product distribution for the catalysts will be examined over
the full range of conversion.
Figure 5.10 shows that the product yield is very similar for all the catalysts, showing the
highest initial contribution of C5+ olefins (all > 42 %). The main by-products were C3 and C4
alkenes and very low amount (< 5 %) of C2 (mainly ethene) was obtained. The C5+
hydrocarbon yield increased up to the maximum at around 90 % conversion, corresponding to
selectivities between 45 to 65 %, while C3 and C4 yield decreased for all the catalysts with
decreasing conversion. Clearly, the two microporous catalysts showed the lower C5+ yield

92
(black stars), whereas the hierarchical materials yielded the highest C5+ fraction. The results
correlate with the increased trends seen in lifetime for these catalysts. A maximum C5+ yield
of 58 and 55 % were observed for the c-ZSM-22-ats1-HCl and m-ZSM-22-at1-HCl catalysts,
respectively, which showed the longest lifetime. Notably, the highest C5+ yield (58 %)
improved the one previously reported for one-dimensional medium pore size zeolites under
the same conditions [41, 78] by ~ 5 % percentage points.
Figure 5.10. Product yield as a function of methanol conversion for the parent and treated commercial (a) and in
house prepared (b) H-ZSM-22 catalysts, at WHSV = 2 h-1
and T = 400 oC. c- and m-ZSM-22-at1-HCl are
shown in green, c- and m-ZSM-22-ats1-HCl in blue and c-ZSM-22-ats2-HCl in light blue, c-ZSM-22-tba2-HCl
and m-ZSM-22-HCl in red. Parent catalysts are shown in black.
The C5+ fraction is examined more rigorously in Figure 5.11. The C5 products are the most
abundant between 90-100% conversions, followed by C6+ alkenes. With increasing
deactivation, there is a marked increase of the C6+ products at the expense of the C5 fraction.
As expected, the selectivity towards aromatic hydrocarbons was inferior to 5 % at all
conversions for all the catalysts. The results suggest that the cracking activity of long alkenes
is reduced with deactivation.
The similar product distribution of the microporous and hierarchical catalysts indicates that
the product shape selectivity of the H-ZSM-22 catalysts in the MTH reaction is governed by
the micropore system inherent of the TON topology, regardless of the introduction of
mesopores, in agreement with Dyballa et al. [147]. Furthermore, we can assume that reactions
on acid sites at the external surface are not relevant, since they would not be affected by steric
restrictions and would result in different product distribution. Overall, the hierarchical H-

93
ZSM-22 catalysts resulted in a remarkable increase of the lifetime while maintaining the
desired selectivity towards aromatic-free C5+ alkene fraction, thus reaching the primarily goal
of the present work.
Figure 5.11. Composition of the C5+ fraction as a function of methanol conversion for the parent and treated
commercial (a) and in house prepared (b) H-ZSM-22 catalysts, at WHSV = 2 h-1
and T = 400 oC. Same colour
codes as in Figure 5.10 are used.
Mechanistic information can be extracted from the analysis of the C3/C2 and ethene/2-methyl-
2-butene (2M2B) ratios, shown in Figure 5.12, together with the shape of the deactivation
curves. In Section 2.3 it was mentioned that the ratio between ethene and 2M2B can be used
to describe the relative propagation of the alkene or aromatic cycle in MTH [80], assuming
that ethene originates mainly from aromatics and 2M2B (and propene) are to a large extent
formed from the alkene methylation/cracking reactions from the olefin MTH cycle. It should
be recalled that the alkene-based cycle dominates over the aromatic cycle in the TON
topology [25, 77]. Therefore, low ethene/2M2B ratios and high C3/C2 ratios are expected.
As seen from Figure 5.12, ethene formation is more significant for the catalysts which
deactivated rapidly (c-ZSM-22, m-ZSM-22 and m-ZSM-22-ats1-HCl), whereas the most
stable catalysts (c-ZSM-22-ats1-HCl and m-ZSM-22-at1-HCl) show a lower relative
production of ethene and a higher contribution of propene and 2M2B products, resulting in
greater increase in the C3/C2 ratio and sharper drop in the ethene/2M2B ratio.

94
Figure 5.12. C3/C2 (top panels) and ethene/2-methyl-2-butene (bottom panels) yield ratio as a function of
methanol conversion over the parent and treated commercial (a and c) and in house prepared (b and d) H-ZSM-
22 catalysts, at WHSV = 2 h-1
and T = 400 oC.
With this information it can be hypothesized a different degree of progression of alkene
methylation/cracking reactions over the H-ZSM-22 catalyst. The more stable catalysts allow a
longer operation of the olefin cycle, leading to propene and higher alkenes production for
longer times. With increasing deactivation, the propagation of the alkene cycle is not
increased anymore and a progressive drop in activity is observed until complete deactivation.
The higher formation of ethene is associated with a higher participation of the aromatic cycle
already from short reaction times (m-ZSM-22 and m-ZSM-22-ats1-HCl) or after a short initial
or induction period of olefin cycle progression (m-ZSM-22-tba1-HCl), causing faster coke
formation. Together with the lower C5+ contribution and the higher C4-hydrogen transfer
index (HTI is defined as the combined yields of isobutene and n-butane divided by the total

95
yield of C4 alkanes and alkenes and constitutes a measure of the hydrogen transfer activity
towards more cyclization and aromatization reactions), the results suggest that product
molecules cannot easily diffuse out of the unidirectional microporous catalyst topology in
these cases, and will be involved in aromatization and cyclization reactions leading to
deactivation.
For the rest of post-synthetic treated zeolites from Section 5.1, only the total methanol
conversion capacity was calculated (Table A.3 of the Appendix). Even though some of them
show higher methanol conversion capacity than the microporous ZSM-22 catalysts, their
MTH performance was not as promising as for the hierarchical catalysts investigated.
5.2.2. Correlation with catalyst features
The post-synthetic modifications affected the MTH activity and stability in an interdependent
manner for the H-ZSM-22 tested catalysts. All the commercial catalysts had very similar
Si/Al ratios of 47-50, and all the in house prepared catalysts showed Si/Al ratios of 34-39. All
the catalysts showed also similar acid strength. This implies that that the variations seen in
catalytic conversion are too large to be caused by a minor modification of the composition or
acid strength for each series.
For the c-ZSM-22 with 200 nm crystals, the most beneficial treatment was the combined
alkaline and surfactant and acid washing, which leads to 2 nm mesopores, whereas for thinner
50 nm particles of m-ZSM-22, the NaOH treatment and acid leaching, which caused the
highest increase in external surface and microporous volume, gave the greatest catalytic
performance. The very different effects depending on the individual treatments highlight
again the importance of the physico-chemical properties of the starting material. As
introduced in Section 3.4, porosity and acidic properties cannot be discussed independently
since acidity is useless if not accessible and porosity, similarly, will not be fully effective if
access to reactive centers is not provided.
Concentrating first on the textural properties, Figure 5.13a shows that both c-ZSM-22 and m-
ZSM-22 microporous catalysts displayed the lowest external surface area. For the commercial
hierarchical catalysts (open points), a rather linear correlation of the total conversion capacity
with Sext is observed, indicating that the increased catalytic performance is associated with the
created intra-crystalline mesoporosity in this case. Surprisingly, the sample with the highest
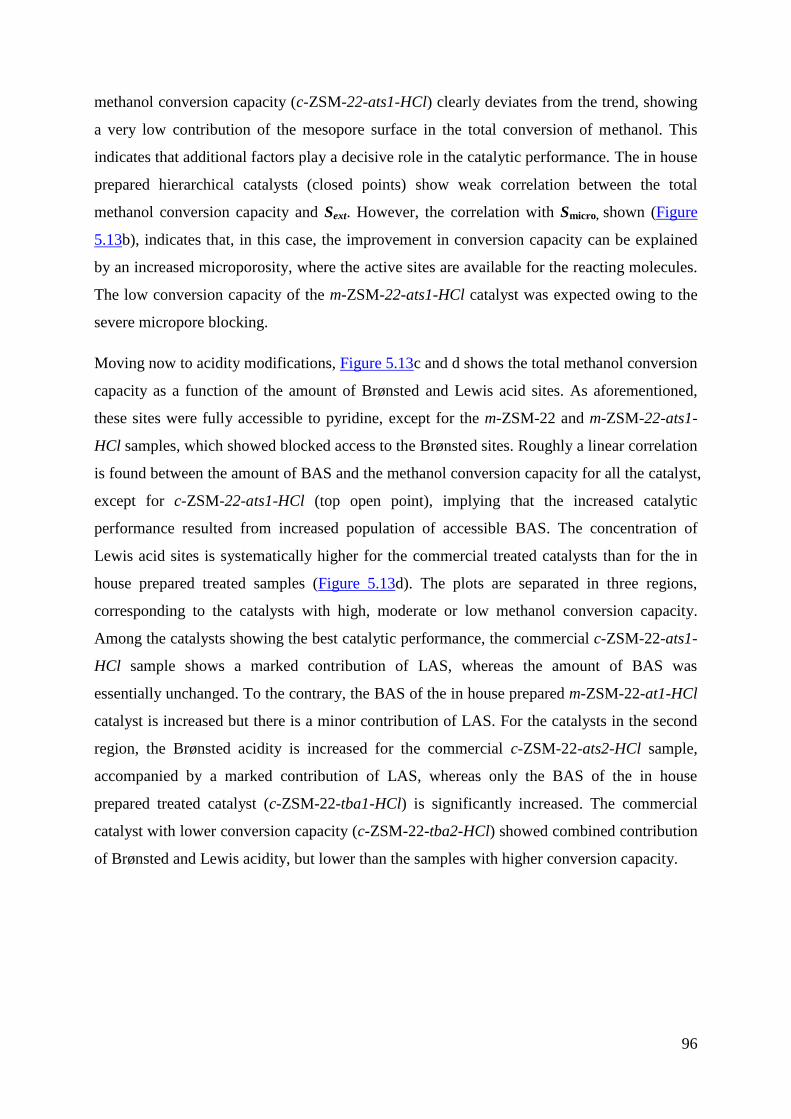
96
methanol conversion capacity (c-ZSM-22-ats1-HCl) clearly deviates from the trend, showing
a very low contribution of the mesopore surface in the total conversion of methanol. This
indicates that additional factors play a decisive role in the catalytic performance. The in house
prepared hierarchical catalysts (closed points) show weak correlation between the total
methanol conversion capacity and Sext. However, the correlation with Smicro, shown (Figure
5.13b), indicates that, in this case, the improvement in conversion capacity can be explained
by an increased microporosity, where the active sites are available for the reacting molecules.
The low conversion capacity of the m-ZSM-22-ats1-HCl catalyst was expected owing to the
severe micropore blocking.
Moving now to acidity modifications, Figure 5.13c and d shows the total methanol conversion
capacity as a function of the amount of Brønsted and Lewis acid sites. As aforementioned,
these sites were fully accessible to pyridine, except for the m-ZSM-22 and m-ZSM-22-ats1-
HCl samples, which showed blocked access to the Brønsted sites. Roughly a linear correlation
is found between the amount of BAS and the methanol conversion capacity for all the catalyst,
except for c-ZSM-22-ats1-HCl (top open point), implying that the increased catalytic
performance resulted from increased population of accessible BAS. The concentration of
Lewis acid sites is systematically higher for the commercial treated catalysts than for the in
house prepared treated samples (Figure 5.13d). The plots are separated in three regions,
corresponding to the catalysts with high, moderate or low methanol conversion capacity.
Among the catalysts showing the best catalytic performance, the commercial c-ZSM-22-ats1-
HCl sample shows a marked contribution of LAS, whereas the amount of BAS was
essentially unchanged. To the contrary, the BAS of the in house prepared m-ZSM-22-at1-HCl
catalyst is increased but there is a minor contribution of LAS. For the catalysts in the second
region, the Brønsted acidity is increased for the commercial c-ZSM-22-ats2-HCl sample,
accompanied by a marked contribution of LAS, whereas only the BAS of the in house
prepared treated catalyst (c-ZSM-22-tba1-HCl) is significantly increased. The commercial
catalyst with lower conversion capacity (c-ZSM-22-tba2-HCl) showed combined contribution
of Brønsted and Lewis acidity, but lower than the samples with higher conversion capacity.

97
Figure 5.13. Correlation of total methanol conversion capacity with the (a) external surface area (Sext), (b)
microporous surface area (Smicro), (c) amount of accessible Brønsted acid sites (cBAS) and (d) Lewis acid sites
(cLAS), for the studied catalysts.
With these results it is proposed that the accessible BAS of the microporous c-ZSM-22
catalyst allow the initiation of the olefin cycle. A higher diffusion of the higher alkenes
caused by increased porous properties and accessibility to BAS favours alkene
methylation/cracking reactions, resulting in increased MTH catalytic performance.
Furthermore, it appears that the larger contribution of LAS favours the olefin cycle to operate
longer and thus increase the catalytic performance. On the other hand, the restricted
micropores of the m-ZSM-22 resulted in limited activity in the MTH conversion, but the
increased micropore access and the resulting accessible BAS allow the propagation of the
olefin cycle for the in house prepared catalysts.

98
Even though the effect of LAS on the zeolite catalytic activity is not completely understood,
some contributions proposed a synergistic effect between Lewis and nearby Brønsted acid
sites to enhance the activity of acid zeolite catalysed reactions [17, 18]. Increased MTH
activity has also been reported for desilicated MFI catalysts samples with high Lewis acidity
[153]. It has been proposed that LAS may promote hydrogen transfer reactions leading to the
formation of formaldehyde from methanol, which further reacts with alkenes at BAS to
produce coke over ZSM-5 catalyst [14, 180]. Conversely, it has been reported that the
incorporation of Ca into ZSM-5 leads to CaOCaOH+ species with Lewis character that
weaken the acid strength and cause the reduction of hydride transfer reaction rate and
consequently the suppression of the aromatic cycle and increased light olefin selectivity [181].
The results presented in this work agree better with the latter observation, since the interaction
of a bridging OH group and a Lewis site seems to promote the alkene cracking/methylation
reactions possibly because LAS are more prone to accept coking species leaving the Brønsted
sites ready for operating the alkene cycle.
The accessibility and internal diffusion was examined by measuring the uptake of toluene at
100 oC and 0.1 mbar. These conditions are far from the reaction temperature (400
oC), at
which the diffusion of toluene will be improved. Therefore, it is difficult to confidently assess
the real diffusion effect by this technique. In-situ experiments will be needed for a successful
assessment of the diffusion properties at relevant reaction conditions. Apart from the two
parent catalysts, two representative samples were measured: c-ZSM-22-ats2-HCl and c-ZMS-
22-tba2-HCl for the commercial series and m-ZSM-22-at1-HCl and m-ZSM-22-tba1-HCl for
the in house prepared set. In principle, toluene molecule (6.1 Å) would have difficulties in
diffusing through the micropores of the H-ZSM-22 zeolite framework (see Section 1.3). This
anticipates that the diffusion of toluene might be limited for the samples with low micropore
volume. Figure 5.14 shows a higher adsorption capacity for all the hierarchical catalysts as
compared with the commercial microporous material. Besides, the adsorption of toluene was
slightly faster for the hierarchical samples at shorter times, since the same uptake is reached at
shorter times. These results indicate increased diffusivity in the hierarchical catalyst crystals.
Since the microporosity of the catalysts was practically unaffected (Table A.1), the intrinsic
diffusivity throughout the catalyst micropores is considered to be very similar. Therefore, the
higher adsorption capacity may be attributed to an improved accessibility and/or shorter
diffusion path length for the mesoporous crystals. The toluene uptake of the in house prepared
hierarchical catalysts (Figure 5.14b) correlates with the increased total conversion capacity,

99
suggesting that the created microporosity is fully accessible. The diffusivity of the in house
prepared treated catalyst was barely increased by the post-synthetic treatments at shorter times,
but it was increased at longer times.
Figure 5.14. Normalized toluene uptake curves of the selected parent and hierarchical commercial (a) and in
house prepared (b) ZSM-22 catalysts.
5.2.3. Structure-deactivation investigations
As stated above, the main issue of H-ZSM-22 as MTH catalyst is the low lifetime. Therefore,
understanding of the causes of the rapid deactivation and providing insight into the time-on-
stream behaviour of H-ZSM-22 catalysts were of particular interest in the present work. In
this regard, the catalytic behaviour of H-ZSM-22 under three different conditions and the
crystallographic changes during testing were studied by operando time- and space-resolved
HXRD. The performance of the commercial c-ZSM-22 catalyst was compared before and
after surfactant and acid treatment, and with and without propanol co-feed. The surfactant-
assisted and acid washing method has already been proved to enhance the methanol
conversion capacity for c-ZSM-22-ats1-HCl at 400 oC and WHSV of 2 h
-1. The high critical
contact time showed for H-ZSM-22 (Section 2.5) strongly suggest that the conversion
capacity can be increased if the autocatalytic reaction is forced to start at the beginning of the

100
catalyst bed, in other words, if the induction period is reduced leading to a larger active
fraction of the bed. This was reached by co-feeding experiments, explained in Paper IV. Co-
feeding a methanol:propanol ~ 50:1 mixture over H-ZSM-22 at 400 oC and WHSV of 2 h
-1
gave 4 times higher methanol conversion capacity compared to feeding methanol alone, as a
result of a more effective utilization of the catalyst and/or a reduced tendency for coking
reactions [182].
The catalytic setup described in Section 4.4 allowed to simultaneously measure the catalyst
activity and unit cell volume variations with TOS. Figure 5.15 shows the MS intensities of the
key species (top plots) and ZSM-22 unit cell volume variations (bottom plots) for the three
different systems. It can be observed that the increasing of the cell volume (Å3), interpreted as
the expansion of the unit cell, at different positions in the catalytic bed and final flattering
matched nicely with the catalytic activity gradients, suggesting that the expansion was mainly
caused by deposition of deactivating coke species. Red, blue and open symbols in Figure 5.15
represent first, middle and last segments of the catalytic bed, respectively. Noteworthy,
thermal expansion experiments performed by a capillary confirmed that the initial expansion
(0.5-1 Å3) at very low TOS might correspond to a local temperature increase of about 13
oC
caused by the released heat due to the exothermic nature of the MTH reaction, whereas the
total lattice expansion of about 3.5 Å3, which represents a 0.28% increase of the initial free
unit cell, is not likely to be caused by an increase in temperature but due to the accumulation
of coke species in the catalyst framework.
Figure 5.15a shows that when feeding methanol alone over c-ZSM-22, all the positions of the
catalytic bed showed basically the same unit cell expansion with TOS until the cell volume
remains constant at around 40 min. This indicates that coke formation occurs over all the
catalytic bed. The deactivation curve from the MS plot follows the observed expansion,
showing a very rapid methanol/DME breakthrough and fast deactivation, suggesting that the
conversion of oxygenates to alkenes is very fast so is the transition from methanol to coke.
This is schematically depicted in step 1 to 2 in the bottom panel in Figure 5.15a. The
accumulation of aromatic of polyaromatic coke species eventually block the access (by the
rare ends of the ZSM-22 crystal) to the acid sites leading to a deactivated state (step 3).

101
Figure 5.15. MS intensities versus TOS (top), unit cell volume versus TOS (middle) and schematic
representation of the accumulation of deactivating species along the catalyst bed (bottom) for the three different
systems studied: (a) c-ZSM-22 fed with methanol, (b) c-ZSM-22-ats1-HCl fed with methanol and (c) c-ZSM-22
co-fed with methanol and isopropanol. The distance from the reactor inlet increases from 1 (red) to 12/8 (white).
The effect of the post-synthetic modifications on the activity in the MTH process is
investigated in Figure 5.15b. The characterization studies of the c-ZSM-22-ats1-HCl sample
showed that the number of accessible acid sites increased after the surfactant-acid treatment,
which is supported by the increase from 0.29 to 0.32 mmol/g in acid site density from the
propyl-amine TPD experiments. Figure 5.15b shows that the total expansion was very similar
also in this case. However, the expansion of the middle and especially the last zones of the
catalyst bed were slower than for the first layers. This pattern matched very well the MS
deactivation curve. This implies that the long-lived c-ZSM-22-ats1-HCl catalyst has a
different deactivation mechanism with respect to the untreated c-ZSM-22. In this case, after a
very rapid transition from the full catalytic bed active for methanol conversion into alkenes
(step 1 in Figure 5.15b bottom panel), methanol is being converted to coke species in the first
zones of the bed, which deactivate rapidly, whereas the rest of the bed remains still active for
the autocatalytic MTH conversion (step 2). The results indicate that the higher number of acid
sites accessible enhanced the reaction rate by allowing the hydrocarbon production to
continue despite the first layers of the bed being deactivated, in accordance with the
promotion of the olefin cycle proposed above. These results suggest that methanol is the main

102
source of deactivating coke formation, in agreement with previous studies over H-ZSM-22
[86, 87, 89], while products alone do not contribute significantly to coke formation.
Ultimately, both methanol direct conversion into coke and reactions of oxygenates with
alkene products produce aromatics that deactivate the remaining areas of the catalytic bed.
The co-feed process (Figure 5.15c) shows remarkable differences with respect to the two
previous scenarios. Propanol dehydrated fast initially to form propene in this case. A similar
fast expansion of the first segments of the catalytic bed as that for the normal MTH reaction is
observed. The same coking rates for all the length of the reactor when methanol was fed alone,
as well as in the first segments of the bed in the co-feed case again suggest that methanol is a
major source of deactivating coke, regardless the presence of hydrocarbons and water. The
similar expansion rate of the first and the very last layers of the bed at short TOS can be
explained by the mentioned local temperature increase. A noticeable double curve shape
between the first and last section of the catalytic bed is evidenced in the unit cell volume
diffractograms, which also matched the MS curve. The data suggest that after a very short
initial period when methanol is being converted to alkenes (step 1 in Figure 5.15c bottom
panel), it is converted into coke species at the inlet of the reaction bed, while a rapid
conversion of methanol also to products let the rest of the catalyst bed active (step 2) with
slow unit cell expansion, resulting in longer lifetime. The aromatic production gradually
progressed towards the last segments of the bed (step 3) as suggests the same expansion rate
with TOS, until the whole bed was deactivated (step 4). The autocatalytic nature of the MTH
reaction implies that the products formed in the first few layers of the bed accelerate product
formation in subsequent sections. The improved catalytic performance may be explained by
methylation of the co-fed alcohol, which induces activation in the very beginning of the
catalyst bed, compared to the reaction involving neat methanol [183, 184].
In the three studied cases, coke formation seemed to be unaffected by the co-presence of
reaction products over ZSM-22. This finding differs from previous observations over MFI
catalyst [90, 185], where the presence of hydrocarbon products was suggested to prevent coke
formation from methanol. The lesser expansion of the unit cell towards the end of the
catalytic bed when propene is co-feed over the catalyst at 350-400 oC and WHSV of 2 h
-1
supports the notion mentioned in Section 2.5, i.e.; the critical contact time represents a
significant fraction of the total contact time for H-ZSM-22 catalysts [86, 87]. On the other
hand, no initial active zone was found when converting methanol over the untreated catalyst.

103
The technique employed allows to follow the accumulation of only internal coking species but
does not allow to track the deactivation by coke deposition on the external surface of the
zeolite particles, which might also block the unidirectional ZSM-22 channels. Nevertheless,
taking into consideration the deactivation study by Rojo et al. [87], coke species formed from
methanol are considered to be accumulated in the micropores. In order to clarify the relative
contribution of internal or external coking, the ZSM-22 catalytic performance was correlated
with the intensity ratio of the IR absorption bands at 3735 and 3745 cm-1
(I3735/I3745),
corresponding to internal and external silanol groups, respectively [12]. While external
silanols can be formed as natural terminations of the zeolite crystal structure, internal silanols
represent defects in the bulk zeolite crystal. Previous investigations on a series of H-ZSM-5
[175] revealed that deactivation is governed by internal framework defects, which do not
depend on the acid site density. Catalysts with high internal silanol density or low external
surface area showed faster deactivation in MTH, since internal silanols may interact with the
hydrocarbons resulting in a slower diffusion and faster deactivation. Figure 5.16 shows a
weak correlation (R2 = 0.6, 8 data points) between the I3726/I3745 ratio and the total methanol
conversion capacity, indicating that framework defects had a minor effect on the catalytic
performance of the studied ZSM-22 catalysts. This was expected, since the increasing of Sext
of the treated commercial samples was also accompanied by a substantial contribution of
defects, and the removal of defects after the treatment of the in house prepared samples
occurred with a lesser modification of the external silanols contribution (Section 5.1). The
point depicted in red corresponds to the m-ZSM-22-ats1-HCl, with lower conversion capacity
due to the hampered access to the acid sites.
Figure 5.16. Correlation between the total methanol conversion capacity and the IR intensity ratio (I3735/I3745) for
the H-ZSM-22 catalysts studied in this work. IR data from activation at 450 oC have been used.

104
5.3. Extension to other one-dimensional 10-ring structures
Desilication and sequential acid washing have been demonstrated to improve the MTH
performance of one-dimensional H-ZSM-22 catalyst. Similar strategies were also applied to
the H-ZSM-23 zeolite, which possess MTT topology with also unidirectional 10-ring
channels, but small side pockets and slightly different channel dimensions (see Section 1.3).
The Si/Al ratio of the commercial c-ZSM-23 zeolite (24) falls slightly outside the range for an
efficient desilication of MFI zeolites [114], which might represent an impediment for efficient
mesopore generation. As with the ZSM-22 zeolite, ZSM-23 crystallizes forming needles
(Figure 5.17), with the unidirectional channels running in the direction of the needle.
Particularly, c-ZSM-23 also possess a very low micropore volume, as can be seen in the low
adsorbed volume in the nitrogen isotherm (Figure 5.18a). The relatively high external surface
area (Table A.4) should be related to the space created between the aggregated particles. This
obviously resulted in a very low stability against deactivation in the methanol conversion.
Figure 5.19a shows that c-ZSM-23 catalyst deactivates completely at 3 hours on stream.
Figure 5.17. SEM micrograph of the parent c-ZSM-23 zeolite.
The parent c-ZSM-23 sample was selected in order to evaluate the effect of the post-synthetic
strategies on a sample with poor catalyst properties. One sample from each post-synthetic
treatment is selected as representative: c-ZSM-23-at1-HCl, c-ZSM-23-ats1-HCl and c-ZSM-
23-HCl. The numerical values of the different composition, textural and catalytic properties
for all the samples are presented in the Table A.4 of the Appendix. Figure A.3 shows that the
crystallinity of the samples was generally maintained after the treatments. However, a severe

105
loss of the crystallinity is evidenced for some of the samples. The XRD peak intensities
generally diminish for the samples treated with NaOH (and sequential acid washing). In
addition, for the samples c-ZSM-23-ats2 and c-ZSM-23-HCl, there is a broadening of the
peak of reflection at 11.4o, which may reveal some imperfections of the crystals of these
samples. Table A.4 shows that the Si/Al ratio is reduced upon alkaline treatment, but it is
returned to the initial value after the acid washing. This implies that the EFAl species have
been generated and redistributed during desilication are eventually removed upon the acid
leaching.
From Figure 5.18a, it can be observed that the nitrogen adsorbed volume at low partial
pressures is significantly increased for the selected samples, and this is reflected on an
increase in micropore volume and in total surface area (SBET). The external surface area was
also increased, as indicated in the increase in the adsorbed volume at high partial pressures.
The BJH mesopore size distribution showed in Figure 5.18b indicates no evident appearance
of defined mesopores within the crystal after the treatments. As it was with the m-ZSM-22
zeolite, the low microporosity and the thinner dimensions of the needles of the parent c-ZSM-
23 sample (~ 100 nm) are very likely responsible of the lack of intra-crystalline mesoporosity
formation upon the treatments. The blocking species were still present after desilication, but
they are removed upon the acid washing.
Figure 5.18. Nitrogen adsorption-desorption isotherms (a) and BJH mesopore size distribution (calculated from
the adsorption branch of the isotherm) (b) for the parent and treated selected ZSM-23 samples.

106
Figure 5.19a presents the conversion versus TOS curves for the parent and treated H-ZSM-23
catalysts. The yield, C3/C2 and ethene/2M2B ratios are shown in Figure 5.19b, c and d,
respectively. As expected, the enhancement of the microporosity directly causes the
improvement of the catalytic performance. The lifetime is consequently increased, as well as
the initial activity and the total C5+ yield, again demonstrating the benefits of the post-
synthetic strategies to obtain improved catalysts for the production of aromatic-free gasoline
precursors. The expected product distribution for the unidirectional zeolite catalysts (Section
2.5) is obtained for all the samples. Interestingly, the only acid washed sample resulted in an
increasing of the lifetime. All the desilicated H-ZSM-23 show a marked decrease in methanol
conversion capacity with respect to the untreated material (Table A.4). On the other hand, the
conversion capacity is increased after the acid leaching. The results indicate that, for one-
dimensional catalysts with limited microporosity, the acid washing may be sufficient to clean
the structure from defects, resulting in more accessible acid sites and open channels. With
respect to the product distribution, the c-ZSM-23-ats1-HCl sample shows the highest C5+
yield. As it was observed for the H-ZSM-22 catalysts, Figure 5.19c, d show that ethene is
significantly formed relative to higher alkenes for the samples which deactivate faster. The
catalysts with longer lifetime show a higher production of propene and 2M2B. The results
suggest a longer propagation of the alkene methylation/cracking reactions of the alkene-based
MTH cycle also with the MTT treated catalysts.
Figure 5.19. (a) Methanol conversion versus time on stream. Inset shows the lifetime during the first 90 minutes
on stream. Product yield (b), C3/C2 (c) and ethene/2M2B yield ratio (d) for the parent and treated selected ZSM-
23 samples.

107
Despite the promising results, the correlation with the catalyst features of the parent and
treated H-ZSM-23 was not obvious, owing to the very peculiar properties of the starting
ZSM-23 material, and additional advanced characterization was not accomplished.

108
5.4. Main conclusions
The crystal morphology of the starting ZSM-22 zeolite is the dominant parameter which
influences the mesopore formation.
- Desilication of the commercial rod-like crystals of 200 nm in with resulted in the
creation of intra-crystalline mesopores, whereas the thinner dimensions and low
micropore volume of the in house prepared needle-shaped crystals (~50 nm) represent an
obstacle for intra-mesopore creation. Instead, the boundaries of the crystals were
preferentially affected, resulting in eroded nanoparticles with higher external surface area.
- Mesopores created from framework defects, however, cannot be dismissed.
The different desilication approaches resulted in mesopores with different shape and size
from the commercial zeolite.
- The conventional alkaline treatment with NaOH resulted in both roughening of the
crystal surface and creation of non-uniform mesopores, whereas when CTAB or TBAOH
agent was added, a defined mesopore size distribution is obtained. The surfactant-assisted
treatment led to the formation of smaller mesopores of 2 nm in size, while larger pores of
about 3-8 nm in size are generated when TBAOH is added to the alkaline solution.
- The protecting effect of the surfactant over the zeolite structure is only evidenced at
low concentrations of base.
Desilication led to a reduction of the Si/Al ratio. The acid washing returned the values to
the original values, indicating that extra-framework alumina species were generated
during and redistributed upon desilication.
- The process occurs without a marked modification of the Brønsted acidity, suggesting
a transformation of Brønsted to Lewis acid sites upon desilication.
- The extra-framework species, including a substantial part of Lewis groups, are
eventually removed by the acid treatment
- Non-acidic Al species already present in the starting commercial zeolite may also
contribute to formation of both Lewis and extra-framework species.
109
The sequential acid washing recovered the acidity of the desilicated zeolites and
generally resulted in increased surface area and micropore and external volume. The
exclusive acid washing of the fresh ZSM-22 zeolite did not affect the textural properties.
A significant enhancement of the H-ZSM-22 MTH catalytic lifetime was obtained after
the desilication and acid washing of the zeolites.
- The methanol conversion capacity was increased at most by a factor of 10 after the
surfactant-assisted method followed by acid washing over the commercial material, as a
result of a combined effect of mesopore formation, enhanced accessibility to the acid
sites and increased transport properties.
- A 17-fold increase was achieved for the in house prepared catalyst treated with NaOH
and sequentially acid washed, due to increased microporosity and enhanced accessibility
to the Brønsted sites.
The high selectivity towards the desired aromatic-free C5+ alkene fraction was further
optimized after the post-synthetic treatments, thus reaching the goal of obtaining
improved catalysts for the process of producing environmental friendly gasoline.
The presence of Lewis acidity is proposed to have a beneficial effect by allowing a longer
operation of the olefin MTH cycle, thus resulting in improved catalytic performance.
The deposition of deactivating species during the MTH reaction causes the expansion of
the unit cell of the H-ZSM-22 catalyst.
Methanol appears to be the major source of coke and coke formation from products alone
is not significant in the TON topology.
The formation of deactivating species from methanol is independent of the co-presence of
products in the TON topology under the conditions employed in this study.
Isopropanol co-feed improved the methanol conversion capacity of H-ZSM-22 by forcing
the autocatalytic reaction to start earlier in the catalyst bed.

110
The beneficial effects of the post-synthetic treatments on the MTH performance were
extended to unidirectional 10-ring zeolite structure: ZSM-23 with MTT topology. The
improvement in methanol conversion capacity is mainly caused by increased
microporosity.

111
6. Suggestions for Further Work
he main goal of improving the lifetime of the catalysts for the production of an
aromatic-free product has been reached in this work. However, despite the large body of
samples investigated, we do not succeed in arriving at a predictable procedure for mesopore
introduction, and general trends are always accompanied by inexplicable deviations.
Assessing the causes of variations on the catalytic performance and addressing single-
parameter activity/deactivation dependencies was not straightforward, owing to the
interdependence between composition, textural properties, morphology and acidity features.
Thus, further work could be directed to:
A better knowledge of the complex transformations involved during the desilication
process in order to provide rational tools for a better control of the desilication with, for
instance, in-situ spectroscopic techniques to study both the desilication physical process
and the reaction with a time- (and space-) resolved tool. This constitutes a particular
challenge for one-dimensional systems such as ZSM-22 zeolite, which are very prone to
pore blocking.
Validate the results by repeating the synthesis of the zeolites, or employ more starting
materials, and the preparation of the post-synthetic catalysts, in order to validate the
reproducibility of the characterization methods, treatments and synthesis parameters.
A systematic analysis of all the numerical values with statistical or numerical methods
with the aim to develop a method to screen properties and find descriptor able to describe
the catalytic performance in terms of a set of physically meaningful parameters, which
ultimately would be used to predict the desired catalytic selectivity.
Furthermore, detailed NMR studies to accurately identify the position of Lewis and Brønsted
acid sites in the framework environment would serve to rationalize the contribution of these
sites in the propagation of the MTH catalytic cycle.
The use of bulky molecules that cannot enter the medium sized pores of the studied zeolites,
such as collidine would be particularly beneficial to distinguish between internal and external
acid sites and their implication in the MTH reaction over on-dimensional catalysts.
T

112
Isotopic labelling experiments could be performed in order to investigate the intrinsic activity
of simpler model reactions, such as cracking of long alkenes (C5+) for the parent and treated
catalysts.
Advanced diffusion tools can be used to study the diffusivity of reliable hydrocarbon
molecules, such as propene, butenes and C5+ alkenes. Uptake experiments with linear and
mono/di-branched alkenes and gravimetric gas sorption analysis are of particular interest.
Finally, the strategies carried out in this work can also be extended to other one-dimensional
10-ring topologies. For instance, the influence of side pockets or slight variations in channel
dimensions on unidirectional frameworks could be explored by using EUO or MRE structures,
respectively.

113
References
[1] J. Berzelius, Considerations respecting a new power which acts in the formation of
organic bodies, Edinburgh New Philos. J., 21 (1836) 223-228.
[2] I. Chorkendorff, J. Niemantsverdriet, Concepts of modern catalysis and kinetics, 2nd
ed.,
Wiley-VCH Verlag GmbH & Co. KGaA, Weinheim, 2003.
[3] I. Fechete, Y. Wang, J.C. Vedrine, The past, present and future of heterogeneous catalysis,
Catal. Today, 189 (2012) 2-27.
[4] J.M. Thomas, Turning points in catalysis, Angew. Chem. Int. Ed., 33 (1994) 913-937.
[5] A. Dyer, An introduction to zeolite molecular sieves, 1st ed., John Wiley & Sons,
Chichester, 1988.
[6] S.M. Auerbach, K.A. Carrado, P.K. Dutta, Handbook of zeolite science and technology,
Marcel Dekker, Inc., 2003.
[7] C. Baerlocher, L.B. McCusker, D.H. Olson, Atlas of zeolite framework types, 6th
ed.,
Elsevier, amsterdam, 2007.
[8] J. Weitkamp, Zeolites and catalysis, Solid State Ionics, 131 (2000) 175-188.
[9] C.S. Cundy, P.A. Cox, The hydrothermal synthesis of zeolites: Precursors, intermediates
and reaction mechanism, Microporous and Mesoporous Mater., 82 (2005) 1-78.
[10] H. Robson, Verified synthesis of zeolitic materials, 2nd
ed., Elsevier, 2001.
[11] A. Corma, Inorganic solid acids and their use in acid-catalyzed hydrocarbon reactions,
Chem. Rev., 95 (1995) 559-614.
[12] S. Bordiga, C. Lamberti, F. Bonino, A. Travert, F. Thibault-Starzyk, Probing zeolites by
vibrational spectroscopies, Chem. Soc. Rev., 44 (2015) 7262-7341.
[13] M.-C. Silaghi, C. Chizallet, P. Raybaud, Challenges on molecular aspects of
dealumination and desilication of zeolites, Microporous Mesoporous Mater., 191 (2014) 82-
96.
[14] M.S. Holm, S. Svelle, F. Joensen, P. Beato, C.H. Christensen, S. Bordiga, M. Bjorgen,
Assessing the acid properties of desilicated ZSM-5 by FTIR using CO and 2,4,6-
trimethylpyridine (collidine) as molecular probes, Appl. Catal., A, 356 (2009) 23-30.
[15] W. Lutz, C.H. Ruscher, D. Heidemann, Determination of the framework and non-
framework [SiO2] and [AlO2] species of steamed and leached faujasite type zeolites:
calibration of IR, NMR, and XRD data by chemical methods, Microporous Mesoporous
Mater., 55 (2002) 193-202.
[16] R.D. Shannon, K.H. Gardner, R.H. Staley, G. Bergeret, P. Gallezot, A. Auroux, The
nature of the nonframework aluminum species formed during the dehydroxylation of H-Y, J.
Phys. Chem., 89 (1985) 4778-4788.
[17] S. Li, A. Zheng, Y. Su, H. Zhang, L. Chen, J. Yang, C. Ye, F. Deng, Bronsted/Lewis acid
synergy in dealuminated HY zeolite: A combined solid-state NMR and theoretical calculation
study, J. Am. Chem. Soc., 129 (2007) 11161-11171.

114
[18] C.J.A. Mota, D.L. Bhering, N. Rosenbach, Jr., A DFT study of the acidity of ultrastable
Y zeolite: Where is the Bronsted/Lewis acid synergism?, Angew. Chem., Int. Ed., 43 (2004)
3050-3053.
[19] S. Bordiga, I. Roggero, P. Ugliengo, A. Zecchina, V. Bolis, G. Artioli, R. Buzzoni, G.
Marra, F. Rivetti, G. Spanò, Characterisation of defective silicalites, J. Chem. Soc., Dalton
Transactions (2000) 3921-3929.
[20] R.F. Lobo, Introduction to the structural chemistry of zeolites, Marcel Dekker, Inc. (2003)
65-89.
[21] S.M. Csicsery, Catalysis by shape selective zeolites - science and technology, Pure Appl.
Chem., 58 (1986) 841-856.
[22] B. Smit, T.L.M. Maesen, Towards a molecular understanding of shape selectivity, Nature,
451 (2008) 671-678.
[23] A. Corma, State of the art and future challenges of zeolites as catalysts, J. Catal., 216
(2003) 298-312.
[24] M. Stocker, Methanol-to-hydrocarbons: catalytic materials and their behavior,
Microporous Mesoporous Mater., 29 (1999) 3-48.
[25] U. Olsbye, S. Svelle, M. Bjorgen, P. Beato, T.V.W. Janssens, F. Joensen, S. Bordiga, K.P.
Lillerud, Conversion of methanol to hydrocarbons: How zeolite cavity and pore size controls
product selectivity, Angew. Chem., Int. Ed., 51 (2012) 5810-5831.
[26] M.E. Davis, Ordered porous materials for emerging applications, Nature, 417 (2002)
813-821.
[27] R.E. Morris, P.S. Wheatley, Gas storage in nanoporous materials, Angew. Chem. Int. Ed.,
47 (2008) 4966-4981.
[28] G.T. Kokotailo, J.L. Schlenker, F.G. Dwyer, E.W. Valyocsik, The framework topology
of ZSM-22: a high-silica zeolite, Zeolites, 5 (1985) 349-351.
[29] B. Marler, Silica-ZSM-22: synthesis and single crystal structure refinement, Zeolites, 7
(1987) 393-397.
[30] B. Marler, C. Deroche, H. Gies, C.A. Fyfe, H. Groundey, G.T. Kokotailo, Y. Feng, S.
Ernst, J. Weitkamp, D.E. Cox, The structure of zeolite ZSM-23 (MTT) refined from
synchrotron x-ray powder data, J. Appl. Crystallogr., 26 (1993) 636-644.
[31] J.M. Thomas, G.R. Millward, D. White, S. Ramdas, Direct evidence to support the
proposal that ZSM-23 is a recurrently twinned variant of zeolite Theta-1, J. Chem. Soc. (1988)
434-436.
[32] P.A. Wright, J.M. Thomas, G.R. Millward, S. Ramdas, S.A.I. Barri, ZSM-23: a
suggested structure, J. Chem. Soc. (1985) 1117-1119.
[33] A.C. Rohrman, Jr., R.B. LaPierre, J.L. Schlenker, J.D. Wood, E.W. Valyocsik, M.K.
Rubin, J.B. Higgins, W.J. Rohrbaugh, The framework topology of ZSM-23: a high silica
zeolite, Zeolites, 5 (1985) 352-354.
[34] S. Ernst, R. Kumar, J. Weitkamp, Studies on the Kinetics of ZSM-23 Crystallization,
American Chem. Soc. (1989) 560-573.
[35] S.-H. Lee, C.-H. Shin, D.-K. Yang, S.-D. Ahn, I.-S. Nam, S.B. Hong, Reinvestigation
into the synthesis of zeolites using diquaternary alkylammonium ions as structure-directing
agents, Microporous and Mesoporous Mater., 68 (2004) 97-104.

115
[36] D. Masih, T. Kobayashi, T. Baba, Hydrothermal synthesis of pure ZSM-22 under mild
conditions, Chem. Commun. (2007) 3303-3305.
[37] S. Ernst, J. Weitkamp, J.A. Martens, P.A. Jacobs, Synthesis and shape-selective
properties of ZSM-22, Appl. Catal., 48 (1989) 137-148.
[38] BP Statistical Review of World Energy, to be found under
http://www.bp.com/statisticalreview. [accessed 2016/06/15].
[39] G.A. Olah, Beyond oil and gas: The methanol economy, Angew. Chem. Int. Ed., 44
(2005) 2636-2639.
[40] N.A. Owen, O.R. Inderwildi, D.A. King, The status of conventional world oil reserves-
Hype or cause for concern?, Energy Policy, 38 (2010) 4743-4749.
[41] M.W. Erichsen, J.S. Martinez-Espin, F. Joensen, S. Teketel, P. del Campo Huertas, K.P.
Lillerud, S. Svelle, P. Beato, U. Olsbye, Syngas to liquids via oxygenates, small-scale gas to
liquid fuel synthesis (2015) 441.
[42] C.D. Chang, A.J. Silvestri, The conversion of methanol and other O-compounds to
hydrocarbons over zeolite catalysts, J. Catal., 47 (1977) 249-259.
[43] C.D. Chang, The New Zealand gas-to-gasoline plant: An engineering tour de force, Catal.
Today, 13 (1992) 103-111.
[44] J. Topp-Jørgensen, Topsøe integrated gasoline synthesis–The TIGAS process, Stud. Surf.
Sci. Catal., 36 (1988) 293-305.
[45] J.Q. Chen, A. Bozzano, B. Glover, T. Fuglerud, S. Kvisle, Recent advancements in
ethylene and propylene production using the UOP/Hydro MTO process, Catal. Today, 106
(2005) 103-107.
[46] H. Koempel, W. Liebner, Lurgi's methanol to propylene (MTP). Report on a successful
commercialisation, Stud. Surf. Sci. Catal., Elsevier (2007) 261-267.
[47] R. Khare, D. Millar, A. Bhan, A mechanistic basis for the effects of crystallite size on
light olefin selectivity in methanol-to-hydrocarbons conversion on MFI, J. Catal., 321 (2015)
23-31.
[48] N.Y. Chen, W.J. Reagan, Evidence of autocatalysis in methanol to hydrocarbon reactions
over zeolite catalysts, J. Catal., 59 (1979) 123-129.
[49] R.M. Dessau, R.B. LaPierre, On the mechanism of methanol conversion to hydrocarbons
over HZSM-5, J. Catal., 78 (1982) 136-141.
[50] R.M. Dessau, On the H-ZSM-5 catalyzed formation of ethylene from methanol or higher
olefins, J. Catal., 99 (1986) 111-116.
[51] B.E. Langner, Reactions of methanol on zeolites with different pore structures, Appl.
Catal., 2 (1982) 289-302.
[52] T. Mole, G. Bett, D. Seddon, Conversion of methanol to hydrocarbons over ZSM-5
zeolite: An examination of the role of aromatic hydrocarbons using 13carbon- and deuterium-
labeled feeds, J. Catal., 84 (1983) 435-445.
[53] T. Mole, J.A. Whiteside, D. Seddon, Aromatic co-catalysis of methanol conversion over
zeolite catalysts, J. of Catal., 82 (1983) 261-266.
[54] I.M. Dahl, S. Kolboe, On the reaction mechanism for propene formation in the MTO
reaction over SAPO-34, Catal. Lett., 20 (1993) 329-336.

116
[55] I.M. Dahl, S. Kolboe, On the reaction mechanism for hydrocarbon formation from
methanol over SAPO-34. 1. Isotopic labeling studies of the reaction of ethene with methanol,
J. Catal., 149 (1994) 458-464.
[56] I.M. Dahl, S. Kolboe, On the reaction mechanism for hydrocarbon formation from
methanol over SAPO-34, J. Catal., 161 (1996) 304-309.
[57] B. Arstad, S. Kolboe, Methanol-to-hydrocarbons reaction over SAPO-34. Molecules
confined in the catalyst cavities at short time on stream, Catal. Lett., 71 (2001) 209-212.
[58] B. Arstad, S. Kolboe, The reactivity of molecules trapped within the SAPO-34 cavities in
the methanol-to-hydrocarbons reaction, J. Am. Chem. Soc., 123 (2001) 8137-8138.
[59] W. Song, J.F. Haw, J.B. Nicholas, C.S. Heneghan, Methylbenzenes are the organic
reaction centers for methanol-to-olefin catalysis on HSAPO-34, J. Am. Chem. Soc., 122
(2000) 10726-10727.
[60] M. Bjorgen, U. Olsbye, D. Petersen, S. Kolboe, The methanol-to-hydrocarbons reaction:
insight into the reaction mechanism from [12C]benzene and [13C]methanol coreactions over
zeolite H-beta, J. Catal., 221 (2004) 1-10.
[61] A. Sassi, M.A. Wildman, H.J. Ahn, P. Prasad, J.B. Nicholas, J.F. Haw, Methylbenzene
chemistry on zeolite HBeta: Multiple insights into methanol-to-olefin catalysis, J. Phys. Chem.
B, 106 (2002) 2294-2303.
[62] M. Hunger, M. Seiler, A. Buchholz, In situ MAS NMR spectroscopic investigation of the
conversion of methanol to olefins on silicoaluminophosphates SAPO-34 and SAPO-18 under
continuous flow conditions, Catal. Lett., 74 (2001) 61-68.
[63] M. Seiler, U. Schenk, M. Hunger, Conversion of methanol to hydrocarbons on zeolite
HZSM-5 investigated by in situ MAS NMR spectroscopy under flow conditions and online
gas chromatography, Catal. Lett., 62 (1999) 139-145.
[64] M. Seiler, W. Wang, A. Buchholz, M. Hunger, Direct evidence for a catalytically active
role of the hydrocarbon pool formed on zeolite H-ZSM-5 during the methanol-to-olefin
conversion, Catal. Lett., 88 (2003) 187-191.
[65] M. Bjorgen, S. Svelle, F. Joensen, J. Nerlov, S. Kolboe, F. Bonino, L. Palumbo, S.
Bordiga, U. Olsbye, Conversion of methanol to hydrocarbons over zeolite H-ZSM-5: On the
origin of the olefinic species, J. Catal., 249 (2007) 195-207.
[66] S. Svelle, F. Joensen, J. Nerlov, U. Olsbye, K.-P. Lillerud, S. Kolboe, M. Bjorgen,
Conversion of methanol into hydrocarbons over zeolite H-ZSM-5: Ethene formation is
mechanistically separated from the formation of higher alkenes, J. Am. Chem. Soc., 128
(2006) 14770-14771.
[67] M. Westgaard Erichsen, S. Svelle, U. Olsbye, The influence of catalyst acid strength on
the methanol to hydrocarbons (MTH) reaction, Catal. Today, 215 (2013) 216-223.
[68] M. Bjoergen, F. Joensen, K.-P. Lillerud, U. Olsbye, S. Svelle, The mechanisms of ethene
and propene formation from methanol over high silica H-ZSM-5 and H-beta, Catal. Today,
142 (2009) 90-97.
[69] M. Bjorgen, S. Akyalcin, U. Olsbye, S. Benard, S. Kolboe, S. Svelle, Methanol to
hydrocarbons over large cavity zeolites: Towards a unified description of catalyst deactivation
and the reaction mechanism, J. Catal., 275 (2010) 170-180.

117
[70] B.P.C. Hereijgers, F. Bleken, M.H. Nilsen, S. Svelle, K.-P. Lillerud, M. Bjorgen, B.M.
Weckhuysen, U. Olsbye, Product shape selectivity dominates the Methanol-to-Olefins (MTO)
reaction over H-SAPO-34 catalysts, J. Catal., 264 (2009) 77-87.
[71] S. Svelle, U. Olsbye, F. Joensen, M. Bjorgen, Conversion of methanol to alkenes over
medium- and large-pore acidic zeolites: steric manipulation of the reaction intermediates
governs the ethene/propene product selectivity, J. Phys. Chem. C, 111 (2007) 17981-17984.
[72] W. Song, H. Fu, J.F. Haw, Supramolecular origins of product selectivity for methanol-to-
olefin catalysis on HSAPO-34, J. Am. Chem. Soc., 123 (2001) 4749-4754.
[73] J.H. Ahn, B. Temel, E. Iglesia, Selective homologation routes to 2,2,3-trimethylbutane
on solid acids, Angew. Chem. Int. Ed., 48 (2009) 3814-3816.
[74] D.A. Simonetti, J.H. Ahn, E. Iglesia, Mechanistic details of acid-catalyzed reactions and
their role in the selective synthesis of triptane and isobutane from dimethyl ether, J. Catal.,
277 (2011) 173-195.
[75] M. Westgård Erichsen, S. Svelle, U. Olsbye, H-SAPO-5 as methanol-to-olefins (MTO)
model catalyst: Towards elucidating the effects of acid strength, J. Catal., 298 (2013) 94-101.
[76] S. Teketel, M.W. Erichsen, F.L. Bleken, S.S.K.P. Lillerud, U. Olsbye, Shape selectivity
in zeolite catalysis. The methanol to hydrocarbons (MTH) reaction, Catalysis, 26 (2014) 179-
217.
[77] S. Teketel, U. Olsbye, K.-P. Lillerud, P. Beato, S. Svelle, Selectivity control through
fundamental mechanistic insight in the conversion of methanol to hydrocarbons over zeolites,
Microporous Mesoporous Mater., 136 (2010) 33-41.
[78] S. Teketel, W. Skistad, S. Benard, U. Olsbye, K.P. Lillerud, P. Beato, S. Svelle, Shape
selectivity in the conversion of methanol to hydrocarbons: The catalytic performance of one-
dimensional 10-ring zeolites: ZSM-22, ZSM-23, ZSM-48, and EU-1, ACS Catal., 2 (2012)
26-37.
[79] S. Teketel, S. Svelle, K.-P. Lillerud, U. Olsbye, Shape-selective conversion of methanol
to hydrocarbons over 10-ring unidirectional-channel acidic H-ZSM-22, ChemCatChem, 1
(2009) 78-81.
[80] S. Ilias, R. Khare, A. Malek, A. Bhan, A descriptor for the relative propagation of the
aromatic- and olefin-based cycles in methanol-to-hydrocarbons conversion on H-ZSM-5, J.
Catal., 303 (2013) 135-140.
[81] R. Khare, A. Bhan, Mechanistic studies of methanol-to-hydrocarbons conversion on
diffusion-free MFI samples, J. Catal., 329 (2015) 218-228.
[82] B.-M. Kim, E.k. Park, S.-Y. LeeAn, M. Ha, E.-J. Kim, H. Kwon, Y.-C. Hong, W.-C.
Jeong, J. Hur, H.-K. Cheong, J. Yi, J.H. Kim, B.-E. Lee, J.-H. Seo, M.-H. Chang, E.-H. Ha,
BTEX exposure and its health effects in pregnant women following the Hebei Spirit oil spill,
J. Prev. Med. Public Health, 42 (2009) 96-103.
[83] U. Olsbye, S. Svelle, K.P. Lillerud, Z.H. Wei, Y.Y. Chen, J.F. Li, J.G. Wang, W.B. Fan,
The formation and degradation of active species during methanol conversion over protonated
zeotype catalysts, Chem. Soc. Rev., (2015) DOI 10.1039/c5cs00304k.
[84] J. Li, Y. Wei, G. Liu, Y. Qi, P. Tian, B. Li, Y. He, Z. Liu, Comparative study of MTO
conversion over SAPO-34, H-ZSM-5 and H-ZSM-22: Correlating catalytic performance and
reaction mechanism to zeolite topology, Catal. Today, 171 (2011) 221-228.

118
[85] J. Li, Y. Wei, Y. Qi, P. Tian, B. Li, Y. He, F. Chang, X. Sun, Z. Liu, Conversion of
methanol over H-ZSM-22: The reaction mechanism and deactivation, Catal. Today, 164
(2011) 288-292.
[86] T.V.W. Janssens, S. Svelle, U. Olsbye, Kinetic modeling of deactivation profiles in the
methanol-to-hydrocarbons (MTH) reaction: A combined autocatalytic-hydrocarbon pool
approach, J. Catal., 308 (2013) 122-130.
[87] D. Rojo-Gama, S. Etemadi, E. Kirby, K.P. Lillerud, P. Beato, S. Svelle, U. Olsbye,
Time- and space-resolved study of the Methanol to Hydrocarbons (MTH) reaction - influence
of zeolite topology on deactivation patterns, Faraday Discuss., (2016). DOI
10.1039/C6FD00187D.
[88] F. Bleken, M. Bjorgen, L. Palumbo, S. Bordiga, S. Svelle, K.-P. Lillerud, U. Olsbye, The
effect of acid strength on the conversion of methanol to olefins over acidic microporous
catalysts with the CHA topology, Top. Catal., 52 (2009) 218-228.
[89] T.V.W. Janssens, A new approach to the modeling of deactivation in the conversion of
methanol on zeolite catalysts, J. Catal., 264 (2009) 130-137.
[90] S. Mueller, Y. Liu, M. Vishnuvarthan, X. Sun, A.C. van Veen, G.L. Haller, M. Sanchez-
Sanchez, J.A. Lercher, Coke formation and deactivation pathways on H-ZSM-5 in the
conversion of methanol to olefins, J. Catal., 325 (2015) 48-59.
[91] M. Guisnet, L. Costa, F.R. Ribeiro, Prevention of zeolite deactivation by coking, J. Mol.
Catal. A: Chem., 305 (2009) 69-83.
[92] J.W. Park, S.J. Kim, M. Seo, S.Y. Kim, Y. Sugi, G. Seo, Product selectivity and catalytic
deactivation of MOR zeolites with different acid site densities in methanol-to-olefin (MTO)
reactions, Appl. Catal., A, 349 (2008) 76-85.
[93] A. Corma, From microporous to mesoporous molecular sieve materials and their use in
catalysis, Chem. Rev., 97 (1997) 2373-2420.
[94] R. Chal, C. Gerardin, M. Bulut, D.S. van, Overview and industrial assessment of
synthesis strategies towards zeolites with mesopores, ChemCatChem, 3 (2011) 67-81.
[95] M. Hartmann, Hierarchical zeolites: A proven strategy to combine shape selectivity with
efficient mass transport, Angew. Chem., Int. Ed., 43 (2004) 5880-5882.
[96] M. Hartmann, A.G. Machoke, W. Schwieger, Catalytic test reactions for the evaluation
of hierarchical zeolites, Chem. Soc. Rev., 45 (2016) 3313-3330.
[97] M.S. Holm, E. Taarning, K. Egeblad, C.H. Christensen, Catalysis with hierarchical
zeolites, Catalysis Today, 168 (2011) 3-16.
[98] K. Li, J. Valla, J. Garcia‐Martinez, Realizing the commercial potential of hierarchical
zeolites: new opportunities in catalytic cracking, ChemCatChem, 6 (2014) 46-66.
[99] S. Mitchell, A.B. Pinar, J. Kenvin, P. Crivelli, J. Karger, J. Perez-Ramirez, Structural
analysis of hierarchically organized zeolites, Nat. Commun., 6 (2015) 8633.
[100] K. Moller, T. Bein, Mesoporosity-a new dimension for zeolites, Chem Soc Rev, 42
(2013) 3689-3707.
[101] K. Na, G. Somorjai, Hierarchically nanoporous zeolites and their heterogeneous
catalysis: Current status and future perspectives, Catal. Lett., 145 (2015) 193-213.

119
[102] J. Perez-Ramirez, C.H. Christensen, K. Egeblad, C.H. Christensen, J.C. Groen,
Hierarchical zeolites: enhanced utilisation of microporous crystals in catalysis by advances in
materials design, Chem. Soc. Rev., 37 (2008) 2530-2542.
[103] D.P. Serrano, J.M. Escola, P. Pizarro, Synthesis strategies in the search for hierarchical
zeolites, Chem. Soc. Rev., 42 (2013) 4004-4035.
[104] J. Shi, Y. Wang, W. Yang, Y. Tang, Z. Xie, Recent advances of pore system
construction in zeolite-catalyzed chemical industry processes, Chem. Soc. Rev., 44 (2015)
8877-8903.
[105] V. Valtchev, G. Majano, S. Mintova, J. Pérez-Ramírez, Tailored crystalline
microporous materials by post-synthesis modification, Chem. Soc. Rev., 42 (2013) 263-290.
[106] D. Verboekend, J. Perez-Ramirez, Design of hierarchical zeolite catalysts by
desilication, Catal. Sci. Technol., 1 (2011) 879-890.
[107] D. Schneider, D. Mehlhorn, P. Zeigermann, J. Kärger, R. Valiullin, Transport properties
of hierarchical micro–mesoporous materials, Chem. Soc. Rev., 45 (2016) 3439-3467.
[108] K. Möller, T. Bein, Crystallization and porosity of ZSM-23, Microporous and
Mesoporous Mater., 143 (2011) 253-262.
[109] J.C. Groen, T. Sano, J.A. Moulijn, J. Pérez-Ramírez, Alkaline-mediated mesoporous
mordenite zeolites for acid-catalyzed conversions, J. Catal., 251 (2007) 21-27.
[110] J. Perez-Ramirez, S. Abello, A. Bonilla, J.C. Groen, Tailored mesoporosity
development in zeolite crystals by partial detemplation and desilication, Adv. Funct. Mater.,
19 (2009) 164-172.
[111] A. Čimek, B. Subotić, I. Šmit, A. Tonejc, R. Aiello, F. Crea, A. Nastro, Dissolution of
high-silica zeolites in alkaline solutions II. Dissolution of ‘activated’silicalite-1 and ZSM-5
with different aluminum content, Microporous Materm, 8 (1997) 159-169.
[112] R.M. Dessau, E.W. Valyocsik, N.H. Goeke, Aluminum zoning in ZSM 5 as revealed by
selective silica removal, Zeolites, 12 (1992) 776-779.
[113] J.C. Groen, T. Bach, U. Ziese, A.M. Paulaime van Donk, K.P. de Jong, J.A. Moulijn, J.
Perez-Ramirez, Creation of hollow zeolite architectures by controlled desilication of Al-zoned
ZSM-5 crystals, J. Am. Chem. Soc., 127 (2005) 10792-10793.
[114] J.C. Groen, J.C. Jansen, J.A. Moulijn, J. Perez-Ramirez, Optimal Aluminum-assisted
mesoporosity development in MFI zeolites by desilication, J. Phys. Chem. B, 108 (2004)
13062-13065.
[115] R. Dessau, E. Valyocsik, N. Goeke, Aluminum zoning in ZSM-5 as revealed by
selective silica removal, Zeolites, 12 (1992) 776-779.
[116] J.C. Groen, W. Zhu, S. Brouwer, S.J. Huynink, F. Kapteijn, J.A. Moulijn, J. Perez-
Ramirez, Direct demonstration of enhanced diffusion in mesoporous ZSM-5 zeolite obtained
via controlled desilication, J. Am. Chem. Soc., 129 (2007) 355-360.
[117] N. Chaouati, A. Soualah, I. Hussein, J. Comparot, L. Pinard, Formation of weak and
strong Brønsted acid sites during alkaline treatment on MOR zeolite, Appl. Catal. A: General,
526 (2016) 95-104.
[118] X. Li, R. Prins, J.A. van Bokhoven, Synthesis and characterization of mesoporous
mordenite, J. Catal., 262 (2009) 257-265.

120
[119] V. Paixão, A.P. Carvalho, J. Rocha, A. Fernandes, A. Martins, Modification of MOR by
desilication treatments: structural, textural and acidic characterization, Microporous and
Mesoporous Mater., 131 (2010) 350-357.
[120] A.N.C. van Laak, S.L. Sagala, J. Zečević, H. Friedrich, P.E. de Jongh, K.P. de Jong,
Mesoporous mordenites obtained by sequential acid and alkaline treatments – Catalysts for
cumene production with enhanced accessibility, J. Catal., 276 (2010) 170-180.
[121] A.N.C. van laak, R.W. Gosselink, S.L. Sagala, J.D. Meeldijk, P.E. de Jongh, K.P. de
Jong, Alkaline treatment on commercially available aluminum rich mordenite, Appl. Catal., A,
382 (2010) 65-72.
[122] O. Muraza, M.A. Sanhoob, M.A.B. Siddiqui, Fabrication of desilicated MTW zeolite
and its application in catalytic cracking of n-heptane, Adv. Powder Technology, 27 (2016)
372-378.
[123] M. Ogura, E. Kikuchi, M. Matsukata, MFI zeolite with uniform mesopores created by
alkali treatment, Stud. Surf. Sci. Catal., 135 (2001) 1820-1827.
[124] S. Svelle, L. Sommer, K. Barbera, P.N.R. Vennestrom, U. Olsbye, K.P. Lillerud, S.
Bordiga, Y.-H. Pan, P. Beato, How defects and crystal morphology control the effects of
desilication, Catal. Today, 168 (2011) 38-47.
[125] J.C. Groen, L.A.A. Peffer, J.A. Moulijn, J. Perez-Ramirez, On the introduction of
intracrystalline mesoporosity in zeolites upon desilication in alkaline medium, Microporous
Mesoporous Mater., 69 (2004) 29-34.
[126] D. Verboekend, S. Mitchell, J. Perez-Ramirez, Hierarchical zeolites overcome all
obstacles: next stop industrial implementation, Chimia, 67 (2013) 327-332.
[127] D. Verboekend, A.M. Chabaneix, K. Thomas, J.-P. Gilson, J. Perez-Ramirez,
Mesoporous ZSM-22 zeolite obtained by desilication: peculiarities associated with crystal
morphology and aluminum distribution, CrystEngComm, 13 (2011) 3408-3416.
[128] S. Liu, J. Ren, H. Zhang, E. Lv, Y. Yang, Y.-W. Li, Synthesis, characterization and
isomerization performance of micro/mesoporous materials based on H-ZSM-22 zeolite, J.
Catal., 335 (2016) 11-23.
[129] M.H.M. Ahmed, O. Muraza, A.M. Al Amer, Y. Sugiura, N. Nishiyama, Development
of desilicated EU-1 zeolite and its application in conversion of dimethyl ether to olefins,
Microporous Mesoporous Mater., 207 (2015) 9-16.
[130] B. Gil, L. Mokrzycki, B. Sulikowski, Z. Olejniczak, S. Walas, Desilication of ZSM-5
and ZSM-12 zeolites: Impact on textural, acidic and catalytic properties, Catal. Today, 152
(2010) 24-32.
[131] Ł. Mokrzycki, B. Sulikowski, Z. Olejniczak, Properties of desilicated ZSM-5, ZSM-12,
MCM-22 and ZSM-12/MCM-41 derivatives in isomerization of α-pinene, Catal. Lett., 127
(2009) 296-303.
[132] D. Verboekend, L.A. Villaescusa, K. Thomas, I. Stan, J. Perez-Ramirez, Acidity and
accessibility studies on mesoporous ITQ-4 zeolite, Catal. Today, 152 (2010) 11-16.
[133] D. Verboekend, J. Perez-Ramirez, Desilication mechanism revisited: Highly
mesoporous all-silica zeolites enabled through pore-directing agents, Chem. Eur. J., 17 (2011)
1137-1147.

121
[134] I.I. Ivanova, I.A. Kasyanov, A.A. Maerle, V.I. Zaikovskii, Mechanistic study of zeolites
recrystallization into micro-mesoporous materials, Microporous and Mesoporous Mater., 189
(2014) 163-172.
[135] F. Schmidt, M.R. Lohe, B. Buechner, F. Giordanino, F. Bonino, S. Kaskel, Improved
catalytic performance of hierarchical ZSM-5 synthesized by desilication with surfactants,
Microporous Mesoporous Mater., 165 (2013) 148-157.
[136] W.C. Yoo, X. Zhang, M. Tsapatsis, A. Stein, Synthesis of mesoporous ZSM-5 zeolites
through desilication and re-assembly processes, Microporous Mesoporous Mater., 149 (2012)
147-157.
[137] I.I. Ivanova, E.E. Knyazeva, Micro–mesoporous materials obtained by zeolite
recrystallization: synthesis, characterization and catalytic applications, Chem. Soc. Rev., 42
(2013) 3671-3688.
[138] I.I. Ivanova, A.S. Kuznetsov, E.E. Knyazeva, F. Fajula, F. Thibault-Starzyk, C.
Fernandez, J.P. Gilson, Design of hierarchically structured catalysts by mordenites
recrystallization: Application in naphthalene alkylation, Catal. Today, 168 (2011) 133-139.
[139] V. Ordomsky, I. Ivanova, E. Knyazeva, V. Yuschenko, V. Zaikovskii, Cumene
disproportionation over micro/mesoporous catalysts obtained by recrystallization of
mordenite, J. Catal., 295 (2012) 207-216.
[140] S. Abello, A. Bonilla, J. Perez-Ramirez, Mesoporous ZSM-5 zeolite catalysts prepared
by desilication with organic hydroxides and comparison with NaOH leaching, Appl. Catal., A,
364 (2009) 191-198.
[141] J. Perez-Ramirez, D. Verboekend, A. Bonilla, S. Abello, Zeolite catalysts with tunable
hierarchy factor by pore-growth moderators, Adv. Funct. Mater., 19 (2009) 3972-3979.
[142] K. Mlekodaj, K. Tarach, J. Datka, K. Gora-Marek, W. Makowski, Porosity and
accessibility of acid sites in desilicated ZSM-5 zeolites studied using adsorption of probe
molecules, Microporous Mesoporous Mater., 183 (2014) 54-61.
[143] K. Sadowska, K. Gora-Marek, M. Drozdek, P. Kustrowski, J. Datka, J. Martinez
Triguero, F. Rey, Desilication of highly siliceous zeolite ZSM-5 with NaOH and
NaOH/tetrabutylamine hydroxide, Microporous Mesoporous Mater., 168 (2013) 195-205.
[144] K. Sadowska, A. Wach, Z. Olejniczak, P. Kustrowski, J. Datka, Hierarchic zeolites:
Zeolite ZSM-5 desilicated with NaOH and NaOH/tetrabutylamine hydroxide, Microporous
Mesoporous Mater., 167 (2013) 82-88.
[145] D. Verboekend, M. Milina, S. Mitchell, J. Perez-Ramirez, Hierarchical zeolites by
desilication: Occurrence and catalytic impact of recrystallization and restructuring, Cryst.
Growth Des., 13 (2013) 5025-5035.
[146] K. Tarach, K. Gora-Marek, J. Tekla, K. Brylewska, J. Datka, K. Mlekodaj, W.
Makowski, M.C. Igualada Lopez, J. Martinez Triguero, F. Rey, Catalytic cracking
performance of alkaline-treated zeolite Beta in the terms of acid sites properties and their
accessibility, J. Catal., 312 (2014) 46-57.
[147] M. Dyballa, U. Obenaus, M. Rosenberger, A. Fischer, H. Jakob, E. Klemm, M. Hunger,
Post-synthetic improvement of H-ZSM-22 zeolites for the methanol-to-olefin conversion,
Microporous Mesoporous Mater., 233 (2016) 26-30.

122
[148] J.A. Martens, D. Verboekend, K. Thomas, G. Vanbutsele, J. Perez-Ramirez, J.-P.
Gilson, Hydroisomerization and hydrocracking of linear and multibranched long model
alkanes on hierarchical Pt/ZSM-22 zeolite, Catal. Today, 218 (2013) 135-142.
[149] D. Verboekend, K. Thomas, M. Milina, S. Mitchell, J. Perez-Ramirez, J.-P. Gilson,
Towards more efficient monodimensional zeolite catalysts: n-alkane hydro-isomerisation on
hierarchical ZSM-22, Catal. Sci. Technol., 1 (2011) 1331-1335.
[150] P. Matias, C.C. Sa, I. Graca, J.M. Lopes, A.P. Carvalho, R.F. Ramoa, M. Guisnet,
Desilication of a TON zeolite with NaOH: Influence on porosity, acidity and catalytic
properties, Appl. Catal., A, 399 (2011) 100-109.
[151] C. Martinez, E.J. Doskocil, A. Corma, Improved THETA-1 for light olefins
oligomerization to diesel: influence of textural and acidic properties, Top. Catal., 57 (2014)
668-682.
[152] M.H.M. Ahmed, O. Muraza, A.M. Al Amer, K. Miyake, N. Nishiyama, Development
of hierarchical EU-1 zeolite by sequential alkaline and acid treatments for selective dimethyl
ether to propylene (DTP), Appl. Catal., A, 497 (2015) 127-134.
[153] M. Bjoergen, F. Joensen, H.M. Spangsberg, U. Olsbye, K.-P. Lillerud, S. Svelle,
Methanol to gasoline over zeolite H-ZSM-5: Improved catalyst performance by treatment
with NaOH, Appl. Catal., A, 345 (2008) 43-50.
[154] F.L. Bleken, K. Barbera, F. Bonino, U. Olsbye, K.P. Lillerud, S. Bordiga, P. Beato,
T.V.W. Janssens, S. Svelle, Catalyst deactivation by coke formation in microporous and
desilicated zeolite H-ZSM-5 during the conversion of methanol to hydrocarbons, J. Catal.,
307 (2013) 62-73.
[155] S. Fathi, M. Sohrabi, C. Falamaki, Improvement of HZSM-5 performance by alkaline
treatments: Comparative catalytic study in the MTG reactions, Fuel, 116 (2014) 529-537.
[156] J. Kim, M. Choi, R. Ryoo, Effect of mesoporosity against the deactivation of MFI
zeolite catalyst during the methanol-to-hydrocarbon conversion process, J. Catal., 269 (2010)
219-228.
[157] C. Mei, P. Wen, Z. Liu, H. Liu, Y. Wang, W. Yang, Z. Xie, W. Hua, Z. Gao, Selective
production of propylene from methanol: Mesoporosity development in high silica HZSM-5, J.
Catal., 258 (2008) 243-249.
[158] F. Schmidt, C. Hoffmann, F. Giordanino, S. Bordiga, P. Simon, W. Carrillo-Cabrera, S.
Kaskel, Coke location in microporous and hierarchical ZSM-5 and the impact on the MTH
reaction, J. Catal., 307 (2013) 238-245.
[159] M. Milina, S. Mitchell, P. Crivelli, D. Cooke, J. Pérez-Ramírez, Mesopore quality
determines the lifetime of hierarchically structured zeolite catalysts, Nature Commun., 5
(2014) 3922.
[160] C. Sá Couto, P. Matias, E.T. Santos, A. Fernandes, I. Graça, J.M. Lopes, M.F. Ribeiro,
Towards a deep desilication/dealumination of NU-10 zeolite: Shape-selectivity regulation,
Eur. J. Inorg. Chem., 2012 (2012) 4190-4199.
[161] O. Muraza, I.A. Bakare, T. Tago, H. Konno, A.-l. Adedigba, A.M. Al-Amer, Z.H.
Yamani, T. Masuda, Controlled and rapid growth of MTT zeolite crystals with low-aspect-
ratio in a microwave reactor, Chem. Eng. Journal, 226 (2013) 367-376.

123
[162] W. Aslam, M.A.B. Siddiqui, B. Rabindran Jermy, A. Aitani, J. Cejka, S. Al-Khattaf,
Selective synthesis of linear alkylbenzene by alkylation of benzene with 1-dodecene over
desilicated zeolites, Catal. Today, 227 (2014) 187-197.
[163] D. Verboekend, J.C. Groen, J. Perez-Ramirez, Interplay of properties and functions
upon introduction of mesoporosity in ITQ-4 zeolite, Adv. Funct. Mater., 20 (2010) 1441-1450.
[164] S.J.S.K.S.W. Gregg, Adsorption, surface area and porosity, Academic Press, London,
1982.
[165] J. Rouquerol, F. Rouquerol, P. Llewellyn, G. Maurin, K.S. Sing, Adsorption by
powders and porous solids: principles, methodology and applications, Academic press, 2013.
[166] M. Thommes, Physical adsorption characterization of ordered and amorphous
mesoporous materials, Ser. Chem. Eng., 4 (2004) 317-364.
[167] G. Leofanti, M. Padovan, G. Tozzola, B. Venturelli, Surface area and pore texture of
catalysts, Catal. Today, 41 (1998) 207-219.
[168] J. Rouquerol, P. Llewellyn, F. Rouquerol, Is the bet equation applicable to microporous
adsorbents?, Stud. Surf. Sci. Catal., 160 (2007) 49-56.
[169] B.C. Lippens, J.H. de Boer, Pore systems in catalysts. V. The t-method, J. Catal., 4
(1965) 319-323.
[170] B.C. Lippens, B.G. Linsen, J.H. de Boer, Pore systems in catalysts. I. Adsorption of
nitrogen; apparatus and calculation, J. Catal., 3 (1964) 32-37.
[171] E.P. Barrett, L.G. Joyner, P.P. Halenda, The determination of pore volume and area
distributions in porous substances. I. Computations from nitrogen isotherms, J. Am. Chem.
Soc., 73 (1951) 373-380.
[172] J.C. Groen, L.A.A. Peffer, J. Perez-Ramirez, Pore size determination in modified micro-
and mesoporous materials. Pitfalls and limitations in gas adsorption data analysis,
Microporous Mesoporous Mater., 60 (2003) 1-17.
[173] J.C. Groen, J. Perez-Ramirez, Critical appraisal of mesopore characterization by
adsorption analysis, Appl. Catal., A, 268 (2004) 121-125.
[174] F. Geobaldo, S. Fiorilli, B. Onida, G. Giordano, A. Katovic, E. Garrone, An FTIR study
of zeolite Theta-1, J. Phys. Chem. B, 107 (2003) 1258-1262.
[175] K. Barbera, F. Bonino, S. Bordiga, T.V.W. Janssens, P. Beato, Structure-deactivation
relationship for ZSM-5 catalysts governed by framework defects, J. Catal., 280 (2011) 196-
205.
[176] C. Emeis, Determination of integrated molar extinction coefficients for infrared
absorption bands of pyridine adsorbed on solid acid catalysts, J. Catal., 141 (1993) 347-354.
[177] C. Pereira, R.J. Gorte, Method for distinguishing Brønsted-acid sites in mixtures of H-
ZSM-5, H-Y and silica-alumina, Appl. Catal. A, General, 90 (1992) 145-157.
[178] K. Hayasaka, D. Liang, W. Huybrechts, B.R. De Waele, K.J. Houthoofd, P. Eloy, E.M.
Gaigneaux, G. van Tendeloo, J.W. Thybaut, G.B. Marin, J.F.M. Denayer, G.V. Baron, P.A.
Jacobs, C.E.A. Kirschhock, J.A. Martens, Formation of ZSM-22 zeolite catalytic particles by
fusion of elementary nanorods, Chem. Eur. J., 13 (2007) 10070-10077.
[179] A.W. Burton, S.I. Zones, T. Rea, I.Y. Chan, Preparation and characterization of SSZ-54:
A family of MTT/TON intergrowth materials, Microporous and Mesoporous Mater., 132
(2010) 54-59.

124
[180] S. Müller, Y. Liu, F.M. Kirchberger, M. Tonigold, M. Sanchez-Sanchez, J.A. Lercher,
Hydrogen transfer pathways during zeolite catalyzed methanol conversion to hydrocarbons, J.
Am. Chem. Soc., 138 (2016) 15994-16003.
[181] I. Yarulina, S. Bailleul, A. Pustovarenko, J.R. Martinez, K.D. Wispelaere, J. Hajek,
B.M. Weckhuysen, K. Houben, M. Baldus, V. Van Speybroeck, Suppression of the aromatic
cycle in methanol-to-olefins reaction over ZSM-5 by post-synthetic modification using
Calcium, ChemCatChem, 8 (2016) 3057-3063.
[182] S. Teketel, U. Olsbye, K.P. Lillerud, P. Beato, S. Svelle, Co-conversion of methanol
and light alkenes over acidic zeolite catalyst H-ZSM-22: Simulated recycle of non-gasoline
range products, Appl. Catal., A, 494 (2015) 68-76.
[183] Z.-M. Cui, Q. Liu, Z. Ma, S.-W. Bian, W.-G. Song, Direct observation of olefin
homologations on zeolite ZSM-22 and its implications to methanol to olefin conversion, J.
Catal., 258 (2008) 83-86.
[184] J. Li, Y. Qi, Z. Liu, G. Liu, D. Zhang, Co-reaction of ethene and methylation agents
over SAPO-34 and ZSM-22, Catal. Lett., 121 (2008) 303-310.
[185] S. Muller, Y. Liu, M. Sanchez-Sanchez, J.A. Lercher, Deactivation pathways during
methanol to propylene (MTP) conversion over ZSM-5 catalysts, Am. Chem. Soc., 248 (2014).

125
Appendix
A.1. Additional results

126
Table A.1
Yield, composition and textural properties for the ZSM-22 investigated samples.
Sample Yield
a Si/Al ratio
b
(mol mol-1
)
Pore volume (cm3 g
-1)
Surface area (m
2 g
-1)
(%) Vtotalc Vmicro
d Vext
e SBET Sext
d
c-ZSM-22 - 49 0.15 0.08 0.07 232 33
c-ZSM-22-at1 60 35 0.30 0.08 0.22 257 65
c-ZSM-22-at2 46 31 0.53 0.08 0.45 247 60
c-ZSM-22-at1-HCl - 48 0.56 0.08 0.48 276 82
c-ZSM-22-at2-HCl - 46 0.53 0.07 0.46 251 68
c-ZSM-22-ats1 82 40 0.26 0.07 0.19 233 61
c-ZSM-22-ats2 51 29 0.48 0.06 0.42 263 118
c-ZSM-22-ats1-HCl - 50 0.29 0.08 0.21 257 58
c-ZSM-22-ats2-HCl - 48 0.52 0.07 0.45 296 114
c-ZSM-22-tba1 88 33 0.23 0.08 0.14 232 43
c-ZSM-22-tba2 75 32 0.21 0.05 0.16 171 35
c-ZSM-22-tba1-HCl - 54 0.26 0.09 0.17 257 49
c-ZSM-22-tba2-HCl - 47 0.29 0.09 0.20 272 44
c-ZSM-22-HCl - 52 0.14 0.08 0.06 214 21
m-ZSM-22 - 38 0.39 0.05 0.34 163 26
m-ZSM-22-at1 60 29 0.57 0.07 0.50 216 40
m-ZSM-22-at2 48 25 0.53 0.07 0.47 202 38
m-ZSM-22-at1-HCl - 36 0.56 0.08 0.48 236 39
m-ZSM-22-at2-HCl - 37 0.59 0.08 0.51 257 45
m-ZSM-22-ats1 83 30 0.44 0.02 0.42 88 35
m-ZSM-22-ats2 58 22 0.34 0.01 0.33 47 23
m-ZSM-22-ats1-HCl - 34 0.23 0.03 0.20 108 29
m-ZSM-22-ats2-HCl - 21 0.14 0.01 0.13 47 21
m-ZSM-22-tba1 90 28 0.39 0.06 0.33 178 22
m-ZSM-22-tba2 82 26 0.17 0.01 0.16 73 43
m-ZSM-22-tba1-HCl - 39 0.42 0.08 0.34 213 21
m-ZSM-22-tba2-HCl - 39 0.31 0.07 0.24 211 32
a100 – weight loss (%) after desilication.
b Determined by MP-AES.
c Volume adsorbed at p/p0 = 0.99.
d t-plot method. Vext and Sext represent the pore volume and surface area for all the pores except the micropores.
e Vtotal – Vmicro.

127
Table A.2
Acidic properties for selected ZSM-22 protonated zeolites.
Sample cBAS
a
(µmol g-1
)
cLASa
(µmol g-1
)
cBAS + cLAS
(µmol g-1
)
cAlb
(µmol g-1
)
Acidic sitesc
(%)
c-ZSM-22 240 30 270 340 79
c-ZSM-22-at1 240 130 370 476 78
c-ZSM-22-at1-HCl - - - 347 -
c-ZSM-22-ats1 210 130 340 417 82
c-ZSM-22-ats1-HCl 220 100 320 333 96
c-ZSM-22-tba2 330 120 450 521 86
c-ZSM-22-tba2-HCl 280 70 350 355 98
m-ZSM-22 240 30 270 439 62
m-ZSM-22-at1 440 130 570 575 99
m-ZSM-22-at1-HCl 380 50 430 463 93
m-ZSM-22-ats1 150 40 190 556 34
m-ZSM-22-ats1-HCl 210 50 260 490 53
m-ZSM-22-tba1 460 70 530 595 89
m-ZSM-22-tba1-HCl 370 40 410 427 96
aAmount of Brønsted or Lewis acid sites determined by IR spectroscopy of adsorbed pyridine.
bTotal Al concentration calculated from elemental analysis.
cTotal acid sites reached by pyridine (cBAS + cLAS) / total Al concentration (cAl) in %.
Figure A.1. PXRD patterns of parent and post-synthetic treated commercial (left) and in house prepared (right)
ZSM-22 samples. (*) and (#) indicate the position of a cristobalite or undefined impurity, respectively.

128
Figure A.2. Correlations between (a) total surface area (SBET) and micropore volume (Vmicro) and (b) external
surface area (Sext) and external volume (Vext) for the treated samples.
Table A.3
Si/Al ratio and total methanol conversion capacity of the H-ZSM-22 and H-ZSM-23 catalyst not present in 5.2.
Catalyst Si/Ala
Methanol conversion
capacityb (gMeOH g
-1catalyst)
c-ZSM-22-at1 35 5.9
c-ZSM-22-at2 31 2.9
c-ZSM-22-at2-HCl 46 10.9
c-ZSM-22-ats1 40 8.2
c-ZSM-22-ats2 29 5.9
c-ZSM-22-tba1 33 4.5
c-ZSM-22-tba1-HCl 54 5.4
c-ZSM-22-tba2 32 2.7
m-ZSM-22-at1 29 4.8
m-ZSM-22-ats1 30 1.4
m-ZSM-22-tba1 28 7.2
aFrom MP-AES.
bTotal grams of methanol converted per gram of catalyst before
complete deactivation.

129
Table A.4
Methanol conversion capacity, composition and textural properties for the ZSM-23 samples.
Sample MeOH conv capacity Si/Al ratio
a
(mol mol-1
)
Pore volume (cm3 g
-1)
Surface area (m
2 g
-1)
(g g-1
) Vtotalb Vmicro
c Vext
d SBET Sext
c
c-ZSM-23 2.7 24 0.31 0.02 0.29 103 50
c-ZSM-23-at1 1.9 19 0.72 0.03 0.69 153 76
c-ZSM-23-at2 0.7 13 0.64 0.03 0.61 146 82
c-ZSM-23-at1-HCl 11.8 25 0.47 0.06 0.41 216 63
c-ZSM-23-at2-HCl 8.9 26 0.89 0.06 0.83 253 107
c-ZSM-23-ats1 - - 0.77 0.02 0.74 101 65
c-ZSM-23-ats2 - - 0.71 0.004 0.706 79 70
c-ZSM-23-ats1-HCl 9.3 - 0.76 0.03 0.73 152 93
c-ZSM-23-ats2-HCl - - 0.71 0.01 0.70 95 63
c-ZSM-23-HCl 5.6 - 0.57 0.05 0.52 200 76
a Determined by MP-AES.
b Volume adsorbed at p/p0 = 0.99.
c t-plot method. Vext and Sext represent the pore volume and surface area for all the pores except the micropores.
d Vtotal – Vmicro.
Figure A.3. PXRD patterns of parent and post-synthetic treated commercial ZSM-23 samples.


130
A.2. Papers I-IV