Improvement of submerged culture conditions to produce … · 2014-10-03 · Improvement of...
12
Improvement of submerged culture conditions to produce colorants by Penicillium purpurogenum Valéria Carvalho Santos-Ebinuma 1,4 , Inês Conceição Roberto 2 , Maria Francisca Simas Teixeira 3 , Adalberto Pessoa Jr. 1 1 Departmento de Tecnologia Bioquímico-Farmacêutica, Universidade de São Paulo, São Paulo, SP, Brazil 2 Departmento de Biotecnologia, Escola de Engenharia de Lorena, Universidade de São Paulo, Lorena, SP, Brazil. 3 Coleção de Cultura DPUA/UFAM, Universidade Federal do Amazonas, Manaus, AM, Brazil. 4 Departamento de Bioprocessos e Biotecnologia, Faculdade de Ciências Farmacêuticas, Universidade Estadual Paulista-UNESP, Araraquara, SP, Brazil. Submitted: November 6, 2012; Approved: September 9, 2013. Abstract Safety issues related to the employment of synthetic colorants in different industrial segments have increased the interest in the production of colorants from natural sources, such as microorganisms. Improved cultivation technologies have allowed the use of microorganisms as an alternative source of natural colorants. The objective of this work was to evaluate the influence of some factors on natu- ral colorants production by a recently isolated from Amazon Forest, Penicillium purpurogenum DPUA 1275 employing statistical tools. To this purpose the following variables: orbital stirring speed, pH, temperature, sucrose and yeast extract concentrations and incubation time were studied through two fractional factorial, one full factorial and a central composite factorial designs. The re- gression analysis pointed out that sucrose and yeast extract concentrations were the variables that in- fluenced more in colorants production. Under the best conditions (yeast extract concentration around 10 g/L and sucrose concentration of 50 g/L) an increase of 10, 33 and 23% respectively to yellow, or- ange and red colorants absorbance was achieved. These results show that P. purpurogenum is an al- ternative colorants producer and the production of these biocompounds can be improved employing statistical tool. Key words: natural colorants; filamentous fungi; optimization; submerged culture. Introduction In the industries of food, cosmetic and pharmaceuti- cal both natural and synthetic colorants are used exten- sively (Mapari et al., 2005; Hailei et al., 2011). But, some characteristics of synthetic colorants such as detrimental ef- fects on environment (Shahid et al., 2013), the develop- ment of mental illness, allergies and diverse type of cancers associate with the use of artificial colorants (Ruiz-Ruiz et al., 2013) reduced the number of synthetic colorants ap- proved by federal regulatory agencies (Santos-Ebinuma et al., 2013a). Furthermore, there is a growing demand for ecofriendly/non-toxic colorants, specifically for health sensitive applications, such as the coloration of food and dyeing of children’s fabrics and leather garments (Santos- Ebinuma et al., 2013b). Natural colorants have been ex- tracted from natural sources, such as plant and insect tissues (Unagul et al., 2005; Boo et al., 2012; Deveoglu et al., 2012), but also these compounds can be produced by mi- croorganisms (Cho et al., 2002; Jiang et al., 2005; Yang et al., 2007; Méndez et al., 2011). The production by the latter is very interesting to industries because microorganisms can grow rapidly and achieve high productivity with a product available throughout the year (Jiang et al., 2005; Brazilian Journal of Microbiology 45, 2, 731-742 (2014) Copyright © 2014, Sociedade Brasileira de Microbiologia ISSN 1678-4405 www.sbmicrobiologia.org.br Send correspondence to V.C. Santos-Ebinuma. Departamento de Bioprocessos e Biotecnologia, Faculdade de Ciências Farmacêuticas, Universidade Estadual Paulista-UNESP, Araraquara, SP, Brasil. Rodovia Araraquara-Jaú/ km 01, 14801-902, Araraquara, SP, Brazil; E-mail: [email protected]. Research Paper
Transcript of Improvement of submerged culture conditions to produce … · 2014-10-03 · Improvement of...

Improvement of submerged culture conditions to produce colorants
by Penicillium purpurogenum
Valéria Carvalho Santos-Ebinuma1,4, Inês Conceição Roberto2,
Maria Francisca Simas Teixeira3, Adalberto Pessoa Jr.1
1Departmento de Tecnologia Bioquímico-Farmacêutica, Universidade de São Paulo,
São Paulo, SP, Brazil2Departmento de Biotecnologia, Escola de Engenharia de Lorena, Universidade de São Paulo, Lorena,
SP, Brazil.3Coleção de Cultura DPUA/UFAM, Universidade Federal do Amazonas, Manaus, AM, Brazil.
4Departamento de Bioprocessos e Biotecnologia, Faculdade de Ciências Farmacêuticas, Universidade
Estadual Paulista-UNESP, Araraquara, SP, Brazil.
Submitted: November 6, 2012; Approved: September 9, 2013.
Abstract
Safety issues related to the employment of synthetic colorants in different industrial segments have
increased the interest in the production of colorants from natural sources, such as microorganisms.
Improved cultivation technologies have allowed the use of microorganisms as an alternative source
of natural colorants. The objective of this work was to evaluate the influence of some factors on natu-
ral colorants production by a recently isolated from Amazon Forest, Penicillium purpurogenum
DPUA 1275 employing statistical tools. To this purpose the following variables: orbital stirring
speed, pH, temperature, sucrose and yeast extract concentrations and incubation time were studied
through two fractional factorial, one full factorial and a central composite factorial designs. The re-
gression analysis pointed out that sucrose and yeast extract concentrations were the variables that in-
fluenced more in colorants production. Under the best conditions (yeast extract concentration around
10 g/L and sucrose concentration of 50 g/L) an increase of 10, 33 and 23% respectively to yellow, or-
ange and red colorants absorbance was achieved. These results show that P. purpurogenum is an al-
ternative colorants producer and the production of these biocompounds can be improved employing
statistical tool.
Key words: natural colorants; filamentous fungi; optimization; submerged culture.
Introduction
In the industries of food, cosmetic and pharmaceuti-
cal both natural and synthetic colorants are used exten-
sively (Mapari et al., 2005; Hailei et al., 2011). But, some
characteristics of synthetic colorants such as detrimental ef-
fects on environment (Shahid et al., 2013), the develop-
ment of mental illness, allergies and diverse type of cancers
associate with the use of artificial colorants (Ruiz-Ruiz et
al., 2013) reduced the number of synthetic colorants ap-
proved by federal regulatory agencies (Santos-Ebinuma et
al., 2013a). Furthermore, there is a growing demand for
ecofriendly/non-toxic colorants, specifically for health
sensitive applications, such as the coloration of food and
dyeing of children’s fabrics and leather garments (Santos-
Ebinuma et al., 2013b). Natural colorants have been ex-
tracted from natural sources, such as plant and insect tissues
(Unagul et al., 2005; Boo et al., 2012; Deveoglu et al.,
2012), but also these compounds can be produced by mi-
croorganisms (Cho et al., 2002; Jiang et al., 2005; Yang et
al., 2007; Méndez et al., 2011). The production by the latter
is very interesting to industries because microorganisms
can grow rapidly and achieve high productivity with a
product available throughout the year (Jiang et al., 2005;
Brazilian Journal of Microbiology 45, 2, 731-742 (2014) Copyright © 2014, Sociedade Brasileira de Microbiologia
ISSN 1678-4405 www.sbmicrobiologia.org.br
Send correspondence to V.C. Santos-Ebinuma. Departamento de Bioprocessos e Biotecnologia, Faculdade de Ciências Farmacêuticas, Universidade
Estadual Paulista-UNESP, Araraquara, SP, Brasil. Rodovia Araraquara-Jaú/ km 01, 14801-902, Araraquara, SP, Brazil; E-mail: [email protected].
Research Paper

Méndez et al., 2011). Furthermore, microbial colorants are
often more stable and soluble than those produced by plants
or animal (Gunasekaran and Poorniammal, 2008).
Many ascomycetous fungi naturally synthesize and
secrete natural colorants with improved functionalities
(Dubois et al., 1956; Mapari et al., 2009). The diversity of
fungal colorants is not only found in their chemical struc-
tures, but also in the color range of these compounds
(Mapari et al., 2009). As most of the studies found in the lit-
erature about fungal colorants were performed with
Monascus species and there is a large number of other fungi
to be explored, it is of interest to search for alternative
colorant-producing organisms (Hailei et al., 2011).
It has recently been reported in the literature (Mapari
et al., 2008; Hailei et al., 2011; Méndez et al., 2011) that
Penicillium strains are potential producers of natural
colorants, which have chromophore similar to Monascus
colorants (Mapari et al., 2008). Among Penicillium spe-
cies, P. purpurogenum can produce colorants not only in
solid medium but also in liquid media (Méndez et al.,
2011). In studies performed by our research group (Tei-
xeira et al., 2012), P. purpurogenum DPUA 1275 showed
potential to produce natural colorants with significant
antimicrobial activities and total absence of toxicity against
Artemia salina.
According to Meinicke et al. (2012), different factors
can influence the production of secondary metabolites. So,
the optimization of operating conditions such as pH, tem-
perature and orbital stirring speed and nutritional factors
for maximum colorants production is an essential step
(Mukherjee and Singh, 2011). Comparing statistical meth-
ods and classic ones for the optimization of processes, the
first represent a safe and reliable alternative because they
are based on the study of only one independent variable at a
time, while all of the other factors are maintained at a fixed
level (Gonçalves et al., 2012). Furthermore, classical ap-
proaches are intrinsically more complicated to pinpoint in-
teractions among processing parameters (Queiroga et al.,
2012).
Response surface methodology (RSM) is frequently
used to optimize a process using statistic tool. The response
surface methodology (RSM) model is usually constructed
for the defined medium factors by quadratic polynomial
equation to depict the interaction effect among the vari-
ables and is then used to optimize the bioprocess (Zafar et
al., 2012). The aim of this set of statistics techniques is to
execute the experimental planning by building empirical
models and evaluating the effect of independent variables
on the desired variable response (Box and Wilson, 1951;
Gonçalves et al., 2012). It can reduce the number of experi-
mental runs and provide sufficient information for a statis-
tically acceptable result (Guo et al., 2012). In this way,
response surface analysis and orthogonal experimental de-
sign are commonly used approaches which are useful in
fermentative process optimization (Gösungur et al., 2011;
Yu et al., 2012).
In this study, the influence of six independent vari-
ables (sucrose and yeast extraction concentrations, pH,
temperature, orbital stirring speed and incubation time) on
the production of yellow, orange and red colorants by sub-
merged culture of P. purpurogenum DPUA 1275 was eval-
uated employing statistical designs aiming to increase the
production of natural colorants by P. purpurogenum.
Materials and Methods
Chemicals
Sucrose and Yeast extract were purchased respec-
tively from Synth (São Paulo, Brazil) and Acumedia (Lan-
sing, Michigan, USA). All the other reagents were of analy-
tical grade and were used as received.
Microorganism
Penicillium purpurogenum DPUA 1275 was pro-
vided by the Culture Collection by Federal University of
Amazon (DPUA), AM, Brazil. The stock culture was main-
tained on Czapeck Yeast Extract Agar (CYA) tubes. Tubes
and plates were inoculated at 30 °C for 7 days and subse-
quently stored at 4 °C.
Culture medium and inoculum preparation
CYA medium was used as the growth medium. This
medium had the following composition (g/L in deionized
water): K2HPO4 (1.0), yeast extract (5.0), sucrose (30.0),
Agar (15.0) and 10 mL/L of concentrated Czapeck. Con-
centrated Czapeck, which is a salt solution, had the follow-
ing composition (g/100 mL of deionized water): NaNO3
(30.0), KCl (5.0), MgSO4.7H2O (5.0), FeSO4.7H2O (0.1)
(Pitt, 1985). The composition of the production medium
was similar to the one used for the inoculum, except for the
sucrose and yeast extract concentrations, which was varied
according to the selected experimental design.
For production experiments, 125 mL-Erlenmeyer
flasks (Vidrolabor - ISO 1773) containing 25 mL of re-
quired medium were inoculated with 5 mycelial agar discs
punched out with a sterilized self-designed cutter (8 mm di-
ameter) from a stock culture grown at CYA medium in
Petri plates during 7 days at 30 °C. The Erlenmeyer flasks
were closed using cotton plug. The pH values and other ex-
perimental conditions varied according to the factorial de-
sign. All experiments were performed in orbital shaker. At
the end of submerged culture, which varied according fac-
torial design, samples were collected and assayed for pH
and yellow, orange and red colorants production.
Analytical methods
The fermented broth was filtrated (Whatman N° 1 fil-
ter paper, Whatman, England), and the resulting super-
natant was filtered through a Millipore filter (0.45 �m). The
732 Santos-Ebinuma et al.

concentration of fungal biomass was determined by dry
weight. The filtrate was used to measure the sucrose con-
sumption, pH and colorants production. Sucrose concentra-
tion was determined according to Dubois et al. (1956) and
the pH was measured using pHmeter.
The concentration of extracellular colorants was esti-
mated by measuring the absorbance of filtrates. Wave-
length of each colorant was scanned at 350-600 nm. The
supernatant was read at 400, 470 and 490 nm (a wavelength
which represents the absorption maxima for yellow, orange
and red colorants, respectively), using the spectro-
photometer model UV-1650PC (Shimadzu, Kyoto, Japan)
and taking the dilution factor of each sample into consider-
ation. The results were expressed in Units of Absorbance
(UA). The absorption maxima got to each colorant is in
agreement with Johns and Stuart (1991).
Statistical design
Initially, a selection of variables that influence the
production of yellow, orange and red colorants by P.
purpurogenum was carried out using three different facto-
rial design, as follows: first a 26-2 fractional factorial statis-
tical design (20 experiments), second a 24-1 fractional
factorial statistical design (12 experiments) and third a 23
full factorial design (12 experiments). After each experi-
ment, some variables were kept constant. In this way, after
the first factorial design, the temperature and fermentation
time were kept at 30 °C and 336 h, respectively. In the sec-
ond and third factorial design, the pH chosen was 4.5 and
the orbital stirring speed, 150 rpm. The variables range and
levels of the components under study to each factorial de-
sign are given in Table 1.
In the second stage, the influence of the independent
variables, specifically sucrose and yeast extract concentra-
tions, on the responses yellow, orange and red colorants
production was investigated using a 22 central composite
designs. A set of 12 experiments which contained a facto-
rial or fractional factorial matrix with center points and star
points to allow estimation of the curvature (Mokhtarani et
al., 2008; Viana Marques et al., 2011) was performed. The
range and levels of the components under study are given in
Table 2.
For statistical elaboration, the actual values of each
independent variable (Xi) were coded, to give coded levels,
according to the equation:
xX X
Xi
i o
i
��
�(1)
where xi represents the corresponding coded values, Xo, the
actual values at the central point, and �Xi, the step change
value.
To identify the best conditions for yellow, orange and
red colorants production, a quadratic model expressed by
the Eq. (2) was used:
�y b b x b x b x xi i i i i ij i j� � � �� ��0
2 (2)
where �yi are the predicted values for each response, bo and
bi the intercept and linear and quadratic coefficients, re-
spectively, and bij the interaction ones.
The “Statistica” Version 7.0 (Statsoft, Tulsa, OK,
USA) software was used for regression and graphical anal-
ysis of data. The statistical significance of the regression
Natural colorants production 733
Table 1 - Variables and factor levels used in the 26-2, 24-1 and 23 design for
studying yellow, orange and red colorants production by P.
purpurogenum DPUA 1275.
Factors Levels
Lower (+1) Center (0) Higher (-1)
26-2 design
Orbital stirring speed (rpm) 120 150 180
pH 4.5 6.0 7.5
Temperature (°C) 25 30 35
Sucrose (g/L) 10 30 50
Yeast extract (g/L) 3 5 7
Incubation time (h) 144 240 336
24-1 design
Orbital stirring speed (rpm) 120 150 180
pH 4.0 4.5 5.0
Sucrose (g/L) 50 60 70
Yeast extract (g/L) 6.0 7.0 8.0
23 design
Orbital stirring speed (rpm) 150 180 250
Sucrose (g/L) 45 50 55
Yeast extract (g/L) 7.0 8.0 9.0
Table 2 - Factor levels used in the 22 central composite design for studying yellow, orange and red colorants production by P. purpurogenum DPUA
1275.
Factors Levels
Axial (- 1.41) Lower (-1) Center (0) Higher (1) Axial (+ 1.41)
22 design
Sucrose (g/L) 48 50 55 60 62
Yeast Extract (g/L) 7.6 8.0 9.0 10.0 10.4

coefficients was determined by the Fischer’s test for analy-
sis of variance (ANOVA) at a significance level (p) � 0.05,
and the extent of variance explained by each model was
given by the determination coefficient R2. To minimize the
error of ANOVA, the tests corresponding to the central
point were repeated four times. The experimental and pre-
dicted values were compared in order to determine the va-
lidity of the models.
Results and Discussion
Experimental designs to produce natural colorants
It is known that metabolite production by microor-
ganisms is largely influenced by the medium compounds,
such as carbon and nitrogen sources, physicochemical fac-
tors, such as pH, temperature, inoculum size, stirring inten-
sity and incubation time (Oh et al., 2000; Celik and Calik,
2004; Mapari et al., 2005). In previous work (Santos-
Ebinuma et al., 2013b) different carbon (glucose, fructose,
sucrose, maltose and starch) and nitrogen (malt extract, am-
monium sulfate, peptone, yeast extract and tryptone)
sources was evaluated in order to produce natural colorants
by submerged culture of P. purpurogenum and sucrose and
yeast extract were the more suitable sources. In this way,
the effect of different independent variables, specifically
orbital stirring speed, pH, temperature, incubation time and
sucrose and yeast extract concentrations on the yellow, or-
ange and red natural colorants production by P.
purpurogenum DPUA 1275 were evaluated by using statis-
tical tools. The experimental design methodology is very
important because it allows reducing the number of experi-
ments as well as identifying both the independent variables
with statistical significance for the process and their signifi-
cant interactions (Santos et al., 2011).
First fractional factorial design to produce naturalcolorants
Initially, a 26-2 fractional factorial design, which is a
resolution IV screening design, was performed. Its analysis
is very interesting for an initial investigation, since it de-
creases the number of experiments, in comparison to the
full factorial design with six variables. This statistical de-
sign is not completely saturated, meaning it does not mix
the main effects with the first order (interaction), which se-
cures the calculation of the variable effects in the responses
studied, without losing the statistic quality of the informa-
tion. This strategy is well suitable to an initial results
screening, once it enables the evaluation of the main effects
and, from such, deciding the strategy for the following de-
sign to obtain an optimized condition (Rodrigues and Iem-
ma, 2005). It is natural, therefore, to assume that third-order
terms are much less important than first-order ones, and, at
least at a first approach, maybe neglected (Cavalcanti et al.,
2006; Lima et al., 2009). In this way, the third-order inter-
actions in the present work are negligible. The main results
of natural colorants production by submerged culture of P.
purpurogenum according to the 26-2 fractional factorial de-
sign are shown in Table 3.
It can be observed that among the 20 runs performed,
the yellow colorants production varied from 0.110 to 2.803
UA400nm, while the orange and red ones varied from 0.016
to 1.875 UA470nm and 0.018 to 1.660 UA490nm, respectively.
However, while the highest yellow and red colorants pro-
duction was obtained in run 10, it occurred in run 9 for the
orange production. These runs have four variables in com-
mon: pH (4.5), temperature (25 °C), sucrose concentration
(50 g/L) and incubation time (336 h).
The Pareto chart to all responses is shown in Figure 1.
This chart represents the estimated effects of the variables,
and their interactions on the responses variables in decreas-
ing the order of magnitude. The length of each bar is pro-
portional to the standardized effect. The vertical line can be
used to judge which effects are statistically significant.
Bars extending beyond this line correspond to the statisti-
cally significant effects at a confidence level of 95% (Zea et
al., 2004).
It can be seen from Figure 1A that all independent
variables had a significant effect under the response yellow
colorants production. However, for the orange colorants
(Figure 1B), the temperature did not show a significant ef-
fect and, for the red ones, not only the temperature, but also
the orbital stirring speed did not have a significant effect.
In this way, the main independent variables that
showed a significant effect to all responses were incubation
time, pH and yeast extract and sucrose concentrations. In-
cubation time was the main significant effect, with a posi-
tive one, which means that an increase of this parameter can
improve the results. As it is known that natural colorants
are, generally, secondary metabolites and a modification in
the nutritional components concentration in the culture me-
dium can promote changes not only in microorganism
growth, but also in their metabolism, different incubation
times were studied. However, the highest colorants produc-
tion was achieved with 336 h of incubation time. According
to previous results obtained by our research group
(Santos-Ebinuma et al., 2013b) an, an incubation time
higher than 336 h promoted a decrease on colorants produc-
tion. In this way, this variable was not included in the next
factorial designs and it was kept at a highest level (336 h).
Regarding pH, the analysis indicated that low levels
of this parameter can promote the highest results for
colorant production. On the other hand, the variables yeast
extract and sucrose concentrations showed a positive ef-
fect, and higher concentrations of both sources would im-
prove the results. As the most part of the articles found in
the literature about colorants production by Penicillium
strain is using CYA medium (30 g/L of sucrose and 5 g/L of
yeast extract) and this is the first attempt to optimize their
production using P. purpurogenum, there is not a concen-
tration of both nutrients source to follow. It is known from
734 Santos-Ebinuma et al.

the literature that it is required not only to supplement the
culture medium but also to control the components in order
to achieve an efficient and fast conversion of carbon source
in the desired product with the highest possible productiv-
ity. Furthermore, once the nutritional needs are supplied,
most of the fungi grow under pH values from 4.0 to 7.0
(Carlile and Watkinson, 1996).
The orbital stirring speed [1] showed a significant ef-
fect when interacting with pH [1*5], sucrose [1*2] and
yeast extract [1*4]. The interaction between pH and incu-
bation time [2*6] also showed a significant effect under all
responses. The interaction 1*5 was significant in the high-
est level [+]. As independent variable, the yeast extract con-
centration was significant in the highest level. Thus, to keep
the interactions with this nitrogen source in the highest
level, the orbital stirring speed has to be kept in the same
level. For interaction 1*4, the same argument used for in-
teraction 1*5 can be applied, and the orbital stirring speed
level has to be used in the highest level. For interaction 1*2,
the factorial design showed that working with interactions
in the highest level is more favorable. As for variable pH,
the factorial design showed that the lowest level was better
to obtain the highest level among the interactions, and the
orbital stirring speed has to be used in the highest level.
As the temperature was significant only for yellow
colorants, in the next factorial design this variable will be
kept at 30 °C, which was the central point used in this facto-
rial design. It is known that many fungi usually require long
periods to grow by submerged culture, and are exposed to
contamination risk; this temperature is considered favor-
able to keep the physiological properties of the microorgan-
isms (Gunasekaran and Poorniammal, 2008).
To all answers evaluated the error pure was lower
than 0.006 and the determination coefficient for the yellow,
orange and red colorants was 96.51, 91.64 and 97.34. Ac-
cording to Silva et al. (2009) values of R2 > 90% are very
good in the experimental design of bioprocesses.
Even though the orbital stirring speed as main vari-
able did not have a significant effect on all responses, its in-
teraction with many independent variables was significant.
This fact is probably related to microorganism metabolism.
As the microorganism used in this work is a filamentous
fungus, it can grown in the form of a pellet, increasing the
medium viscosity and promoting problems in mass trans-
Natural colorants production 735
Table 3 - Matrix of the 26-2 fractional factorial design with the real variables and results of the selected responses (yellow, orange and red colorants pro-
duction).
Run Orbital stirring
speed (rpm)
pH Temperature
(°C)
Sucrose
(g/L)
Yeast extract
(g/L)
Incubation time
(h)
Yellow
Colorants
(UA400nm)
Orange
Colorants
(UA470nm)
Red Colorants
(UA490nm)
1 120 4.5 25 10 3 144 0.11 0.02 0.02
2 180 4.5 25 10 7 144 0.60 0.24 0.16
3 120 7.5 25 10 7 336 0.75 0.30 0.19
4 180 7.5 25 10 3 336 0.59 0.22 0.14
5 120 4.5 37 10 7 336 2.61 1.73 1.00
6 180 4.5 37 10 3 336 0.85 0.45 0.34
7 120 7.5 37 10 3 144 0.66 0.28 0.22
8 180 7.5 37 10 7 144 0.72 0.38 0.28
9 120 4.5 25 50 3 336 2.62 1.88 1.17
10 180 4.5 25 50 7 336 2.80 1.33 1.66
11 120 7.5 25 50 7 144 0.71 0.04 0.02
12 180 7.5 25 50 3 144 0.30 0.10 0.07
13 120 4.5 37 50 7 144 0.91 0.29 0.18
14 180 4.5 37 50 3 144 0.37 0.14 0.09
15 120 7.5 37 50 3 336 1.45 0.40 0.25
16 180 7.5 37 50 7 336 2.24 1.07 0.98
17 (C) 150 6.0 30 30 5 240 1.25 0.66 0.45
18 (C) 150 6.0 30 30 5 240 1.12 0.78 0.56
19 (C) 150 6.0 30 30 5 240 1.24 0.80 0.58
20 (C) 150 6.0 30 30 5 240 1.11 0.67 0.59
C - Central points.

fer, which results in lower productivity. It is known from
the literature that for each culture, the optimum conditions
of stirring intensity will partially depend on hyphae resis-
tance to mechanic force and to its physiologic study, as well
(Papagianni, 2004). Thus, finding the best orbital stirring
speed is essential for improving the production and this
variable was included in the next factorial design in the
same range previously studied.
Figure 2 shows the results about biomass, sucrose
consumption and pH in each run carried out according to a
26-2 fractional factorial design.
It was expected that the runs 1, 2, 7 and 8, which
ended up with 240 h of incubation time, showed higher bio-
mass concentration as compared with the other runs be-
cause this time is located in the exponential phase of cell
growth (Santos-Ebinuma et al., 2013b); however, these re-
sults were not achieved. This behavior probably occurred
due the low sucrose concentration (10 g/L) in these runs.
Comparing these results with the ones obtained in the runs
with initial sucrose concentration of 50 g/L at the same in-
cubation time the hypothesis cited before can be confirmed
since the biomass concentration obtained in this condition
was higher than the others. According to Santos-Ebinuma
et al. (2013b), the orange and red colorants production in-
creases after 168 h of incubation, which means that these
metabolites have characteristics to be secondary ones, since
their formation started to be more significant in the moment
that the main carbon source had been almost completely
consumed and the microorganism was in the decline phase.
Regarding sucrose consumption, the runs 3, 4, 5 and 6
promoted the maximum consumption of sucrose leading
the lowest final sucrose concentration. In these runs, the
initial sucrose concentration was 10 g/L, which can be the
responsible for the microorganism sucrose consumption
until exhaustion. In the other runs, the sucrose consumption
occurred as expected.
Based on the analyzed results, four variables - yeast
extract and sucrose concentrations, pH and orbital stirring
speed - were selected to be evaluated by a 24-1 fractional
factorial design. The other variables were fixed at 336-h in-
cubation period and 30 °C of temperature.
Second Fractional Factorial design to producenatural colorants
The fractional factorial design 24-1 is an useful
method to evaluate the impact of the variables under the re-
sponses and to define the conditions of the following facto-
736 Santos-Ebinuma et al.
Figure 1 - Pareto chart for the effects of variables orbital stirring speed
(1), pH (2), temperature (3), sucrose (4), yeast extract (5) and incubation
time (6) on yellow (A), orange (B) and red (C) natural colorants produc-
tion according to a 26-2 fractional factorial design.
Figure 2 - Biomass (gray bars), sucrose consumption and pH (striped
bars) in the runs performed according to a 26-2 fractional factorial design.
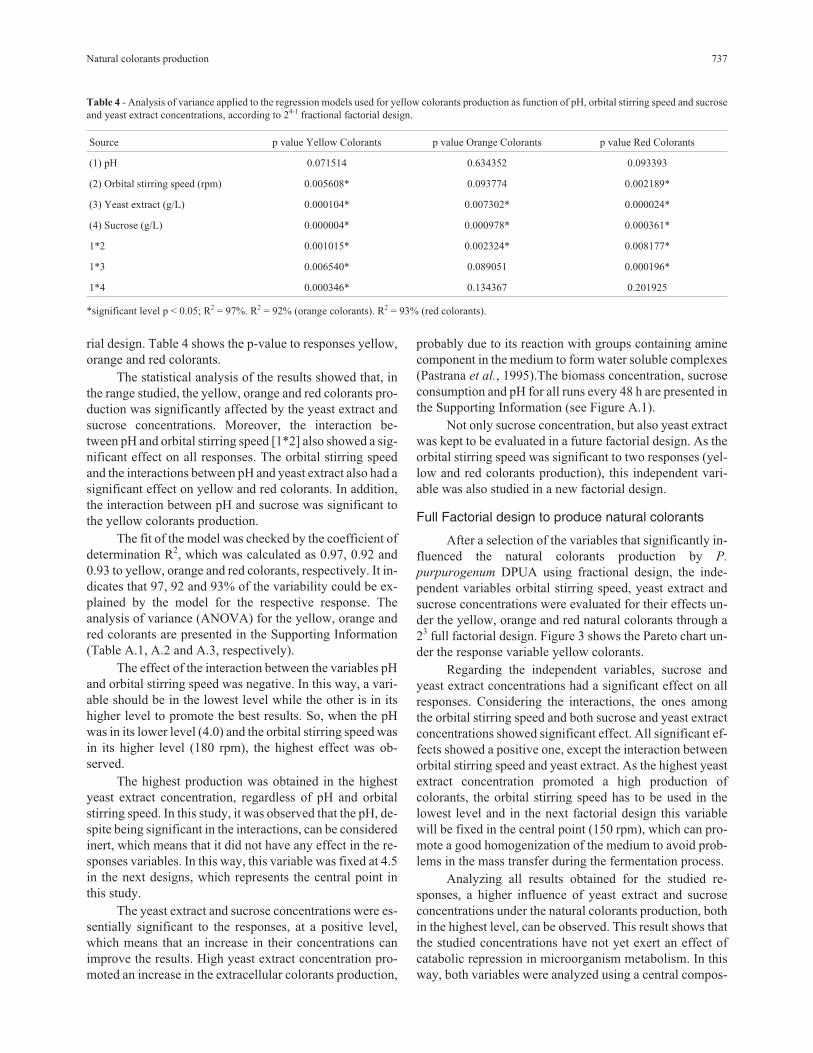
rial design. Table 4 shows the p-value to responses yellow,
orange and red colorants.
The statistical analysis of the results showed that, in
the range studied, the yellow, orange and red colorants pro-
duction was significantly affected by the yeast extract and
sucrose concentrations. Moreover, the interaction be-
tween pH and orbital stirring speed [1*2] also showed a sig-
nificant effect on all responses. The orbital stirring speed
and the interactions between pH and yeast extract also had a
significant effect on yellow and red colorants. In addition,
the interaction between pH and sucrose was significant to
the yellow colorants production.
The fit of the model was checked by the coefficient of
determination R2, which was calculated as 0.97, 0.92 and
0.93 to yellow, orange and red colorants, respectively. It in-
dicates that 97, 92 and 93% of the variability could be ex-
plained by the model for the respective response. The
analysis of variance (ANOVA) for the yellow, orange and
red colorants are presented in the Supporting Information
(Table A.1, A.2 and A.3, respectively).
The effect of the interaction between the variables pH
and orbital stirring speed was negative. In this way, a vari-
able should be in the lowest level while the other is in its
higher level to promote the best results. So, when the pH
was in its lower level (4.0) and the orbital stirring speed was
in its higher level (180 rpm), the highest effect was ob-
served.
The highest production was obtained in the highest
yeast extract concentration, regardless of pH and orbital
stirring speed. In this study, it was observed that the pH, de-
spite being significant in the interactions, can be considered
inert, which means that it did not have any effect in the re-
sponses variables. In this way, this variable was fixed at 4.5
in the next designs, which represents the central point in
this study.
The yeast extract and sucrose concentrations were es-
sentially significant to the responses, at a positive level,
which means that an increase in their concentrations can
improve the results. High yeast extract concentration pro-
moted an increase in the extracellular colorants production,
probably due to its reaction with groups containing amine
component in the medium to form water soluble complexes
(Pastrana et al., 1995).The biomass concentration, sucrose
consumption and pH for all runs every 48 h are presented in
the Supporting Information (see Figure A.1).
Not only sucrose concentration, but also yeast extract
was kept to be evaluated in a future factorial design. As the
orbital stirring speed was significant to two responses (yel-
low and red colorants production), this independent vari-
able was also studied in a new factorial design.
Full Factorial design to produce natural colorants
After a selection of the variables that significantly in-
fluenced the natural colorants production by P.
purpurogenum DPUA using fractional design, the inde-
pendent variables orbital stirring speed, yeast extract and
sucrose concentrations were evaluated for their effects un-
der the yellow, orange and red natural colorants through a
23 full factorial design. Figure 3 shows the Pareto chart un-
der the response variable yellow colorants.
Regarding the independent variables, sucrose and
yeast extract concentrations had a significant effect on all
responses. Considering the interactions, the ones among
the orbital stirring speed and both sucrose and yeast extract
concentrations showed significant effect. All significant ef-
fects showed a positive one, except the interaction between
orbital stirring speed and yeast extract. As the highest yeast
extract concentration promoted a high production of
colorants, the orbital stirring speed has to be used in the
lowest level and in the next factorial design this variable
will be fixed in the central point (150 rpm), which can pro-
mote a good homogenization of the medium to avoid prob-
lems in the mass transfer during the fermentation process.
Analyzing all results obtained for the studied re-
sponses, a higher influence of yeast extract and sucrose
concentrations under the natural colorants production, both
in the highest level, can be observed. This result shows that
the studied concentrations have not yet exert an effect of
catabolic repression in microorganism metabolism. In this
way, both variables were analyzed using a central compos-
Natural colorants production 737
Table 4 - Analysis of variance applied to the regression models used for yellow colorants production as function of pH, orbital stirring speed and sucrose
and yeast extract concentrations, according to 24-1 fractional factorial design.
Source p value Yellow Colorants p value Orange Colorants p value Red Colorants
(1) pH 0.071514 0.634352 0.093393
(2) Orbital stirring speed (rpm) 0.005608* 0.093774 0.002189*
(3) Yeast extract (g/L) 0.000104* 0.007302* 0.000024*
(4) Sucrose (g/L) 0.000004* 0.000978* 0.000361*
1*2 0.001015* 0.002324* 0.008177*
1*3 0.006540* 0.089051 0.000196*
1*4 0.000346* 0.134367 0.201925
*significant level p < 0.05; R2 = 97%. R2 = 92% (orange colorants). R2 = 93% (red colorants).

ite design. The biomass concentration, sucrose consump-
tion and pH for all runs every 48 h are presented in the
Supporting Information (see Figure A.2).
Central composite factorial design to producenatural colorants
From the factorial designs showed above, sucrose and
yeast extract concentrations were the most significant vari-
ables in the production of natural colorants by P.
purpurogenum DPUA 1275. These variables were, there-
fore, analyzed by a central composite factorial design with
4 replications in the central point, with the purpose of opti-
mizing the production of these metabolites. The results
from these runs are showed at Table 5.
From Table 5, it can be observed that the yellow
colorants production varied from 1.79 to 3.14 UA400nm, the
orange colorants varied from 1.20 to 2.50 UA470nm and the
red colorants, from 1.10 to 2.04 UA490nm. For the yellow
colorants, the highest result was obtained in run 8, in which
the yeast extract and sucrose concentrations were 10.4 and
55 g/L, respectively. For the orange and red colorants, the
highest production occurred in run 2 (50 g/L of sucrose and
10 g/L of yeast extract concentrations). The results ob-
tained in this factorial design are higher than the ones ob-
tained in the factorial designs above, which shows the
conduction of a factorial design to an increase in the pro-
duction of natural colorants. The central composite facto-
rial design for the yellow, orange and red colorants did not
show lack of fit (see Table A.4, Table A.5 and Table A.6
from Supporting Information).
Figure 4 shows the response surface indicating the si-
multaneous effects of the independent variables under the
response variables yellow, orange and red colorants. It can
be observed that, to all responses studies, there is a possibil-
ity to improve the colorants production by varying the con-
ditions of the fermentative process. The surface response
indicates that the best results would be possible if higher
concentrations of yeast extract were used. Table 6 shows
the probability values (p) for the yellow, orange and red
colorants. From the p value, it is possible to determine
which variables were significant to the process. Since in
this work a confidence level of 95% was considered, the in-
dependent variables with p values lower than 0.05 are con-
sidered significant.
Through the results of the statistical analysis for the
responses yellow, orange and red colorants, it was observed
that the yeast extract in the linear and quadratic terms had a
significant effect. Furthermore, the interaction between the
linear terms of the variables also showed significant effects
to the responses orange and red colorants. The biomass
concentration, sucrose consumption and pH for all runs ev-
ery 48 h are presented in the Supporting Information (see
Figure A.3).
On the basis of the results of the complete regres-
sions, the following models were determined to sucrose
(x1) and yeast extract (x2) under the production of yellow
(y1), orange (y2) and red (y3) colorants, as described by the
following equations:
y1 = 2.10 - 0.05x1 - 0.04x12 + 0.31x2 + 0.32x2
2 -
0.28x1x2 (3)
738 Santos-Ebinuma et al.
Figure 3 - Pareto chart for the effects of variables orbital stirring speed
(1), pH (2), temperature (3), sucrose (4), yeast extract (5) and incubation
time (6) on yellow (A), orange (B) and red (C) natural colorants produc-
tion according to a 23 full factorial design.

y2 = 1.44 +0.07x1 +0.03x12 + 0.27x2 +0.35x2
2
-0.23x1x2 (4)
y3 = 1.33 +0.09x1 +0.02x12 + 0.20x2 +0.28x2
2
-0.20x1x2 (5)
So, according to convenience different conditions can
be profitably exploited to maximize the production of yel-
low, orange and red colorants. However, the run 2 (50 g/L
of sucrose and 10 g/L of yeast extract) can be selected as the
best ones for the colorants production, being able to ensure ,
at the same time, satisfactory results of yellow, orange and
red colorants production. A comparison between the best
results presented in the in the first experimental design (Ta-
ble 3) and the ones achieved in the run 2 shows that an in-
crease of 10, 33 and 23% was achieved to yellow, orange
and red colorants, respectively.
According the results obtained through all designs, it
is very important the control of the sucrose and yeast ex-
tract concentrations during the colorants process by P.
purpurogenum, an alternative colorant producer. More-
over, from the economic/industrial point of view, the use of
a cheap carbon source such as sucrose is interesting. Fur-
Natural colorants production 739
Figure 4 - Response surface showing the simultaneous effects of sucrose and yeast extract concentrations on the yellow (A), orange (B) and red (C)
colorants by submerged culture of P. purpurogenum DPUA 1275.

ther investigation to improve the colorants production in a
bench-scale fermenter is a future effort aiming the scale-up
for an industrial application.
Conclusions
The results obtained from the factorial designs, which
analyzed the independent variables incubation period, or-
bital stirring speed, pH, temperature, sucrose and yeast ex-
tract concentrations under the production of yellow, orange
and red colorants, suggested that sucrose and yeast extract
concentrations are the most significant variables to the pro-
cess of obtaining natural colorants by submerged culture of
P. purpurogenum DPUA 1275, and the ideal concentra-
tions of these subtract are values close to 50 and 10 g/L, re-
spectively. Furthermore, the new strain showed potential
to be used as a new source of natural colorants.
Acknowledgments
Financial support is gratefully acknowledged from
FAPESP (Fundação de Amparo à Pesquisa do Estado de
São Paulo, São Paulo, Brazil) in the form of scholarships to
V.C. Santos-Ebinuma, from CNPq (National Council for
Scientific and Technological Development, Brasília,
Brazil) and CAPES (Coordenação de Aperfeiçoamento de
Pessoal de Nível Superior).
References
Boo HO, Hwang SJ, Bae CS, Park SH, Heo BG, Gorinstein S
(2012) Extraction and characterization of some natural plant
pigments Ind Crop Prod 40:129-135.
Box GEP, Wilson KB (1951) On the experimental attainment of
optimum conditions J R Stat Soc Ser B, 13: 1-45.
Carlile JM, Watkinson SC (1996) Genetic variation and evolution
The fungi United Kingdom, Academic Press.
Cavalcanti MTH, Porto TS, Barros Neto B, Lima-Filho JL, Porto
ALF, Pessoa Jr A (2006) Aqueous two-phase systems ex-
740 Santos-Ebinuma et al.
Table 5 - Matrix of 22 central composite factorial design to responses yellow (UA400nm), orange (UA470nm) and red colorants (UA490nm).
Run Sucrose (g/L) Yeast Extract
(g/L)
Yellow Colorants (UA400nm) Orange Colorants (UA470nm) Red Colorants (UA490nm)
1 50 8 1.79 1.20 1.01
2 50 10 3.10 2.50 2.04
3 60 8 2.16 1.67 1.57
4 60 10 2.34 2.04 1.79
5 48 9 2.07 1.27 1.26
6 62 9 2.05 1.68 1.56
7 55 7.6 2.42 1.92 1.80
8 55 10.4 3.14 2.25 2.03
9 (C) 55 9 2.20 1.35 1.17
10 (C) 55 9 1.97 1.57 1.44
11 (C) 55 9 2.07 1.38 1.30
12 (C) 55 9 2.15 1.47 1.42
C - Central points.
Table 6 - p-values to the independent variables sucrose and yeast extract in the production of yellow, orange and red colorants by submerged culture of P.
purpurogenum DPUA 1275.
Source p value Yellow Colorants p value Orange Colorants p value Red Colorants
(1) Sucrose (g/L) (L) 0.243554 0.133879 0.129119
Sucrose (g/L) (Q) 0.374487 0.486239 0.698317
(2) Yeast extract (g/L) (L) 0.002839* 0.005012* 0.021401*
Yeast extract (g/L) (Q) 0.003586* 0.003417* 0.011214*
1L*2L 0.010056 0.019799* 0.047279*
*significant level p < 0.05; L = Linear terms; Q = Quadratic terms.

traction of toxin from Clostridium perfringers type A. J
Chromatogr 833:135-140.
Celik E, Calik P (2004) Bioprocess parameters and oxygen trans-
fer characteristics in beta-lactamase production by Bacillus
species. Biotechnol Progr 20:491-499.
Cho YJ, Park JP, Hwang HJ, Kim SW, Choi JW, Yun J W (2002)
Production of red pigment by submerged culture of
Paecilomyces sinclairii. Lett Appl Microbiol 35:195-202.
Deveoglu O, Cakmakcy E, Taskopru T, Torgan E, Karadag R
(2012) Identification by RP-HPLC-DAD FTIR TGA and
FESEM-EDAX of natural pigments prepared from Datisca
cannabina L Dyes Pigments 94:437-442.
Dubois M, Gilles KA, Hamilton JK, Rebers PA, Smith F (1956)
Colorimetric Method for determination of sugars and relate
compounds. Anal Chem 28:350-356.
Duran N, Teixeira MFS, de Conti R, Esposito E (2002) Ecologi-
cal-friendly pigments from fungi. Crit Rev Food Sci Nutr
42:53-66.
Gonçalves DB, Teixeira JA, Bazzolli DMS, Queiroz MV, Araújo
EF (2012) Use of response surface methodology to optimize
production of pectinases by recombinant Penicillium
griseoroseum T20. Biocatal Agric Biotechnol 1:140-146.
Gösungur Y, Uzunogullarí P, Dagbaglí S (2011) Optimization of
pullulan production from hydrolysed potato starch waste by
response surface methodology. Carbohyd Polym
83:1330-1337.
Gunasekaran S, Poorniammal R (2008) Optimization of fermenta-
tion conditions for red pigment production from Penicillium
sp under submerged cultivation. Afr J Biot 7:1894-1898.
Guo J, Zhuang Y, Chen L, Liu J, Li D,Ye N (2012) Process opti-
mization for microwave-assisted direct liquefaction of
Sargassum polycystum CAgardh using response surface
methodology. Bioresource Technol 120:19-25.
Hailei W, Zhifang R, Ping L, Yanchang G, Guosheng L, Jianming
Y (2011) Improvement of the production of a red pigment in
Penicillium sp HSD07B synthesized during co-culture with
Candida tropicalis. Bioresource Technol 102:6082-6087.
Jiang Y, Li HB, Chen F, Hyde KD (2005) Production potential of
water-soluble Monascus red pigment by a newly isolated
Penicillium sp. J Agric Technol 1:113-126.
Johns MR, Stuart DM (1991) Production of pigments by
Monascus purpureus in solid culture. J Ind Microbiol
8:23-38.
Kongruang S (2011) Growth kinetics of biopigment production
by Thai isolated Monascus purpureus in a stirred tank
bioreactor. J Ind Microbiol Biot 38:93-99.
Lima AC, Rodrigues PMB , Porto TS, Viana DA, Lima-Filho JL,
Porto ALF, Cunha MGC (2009) Production of a collagenase
from Candida albicans URM3622. Biochem Eng J 43:315-
320.
Mapari SAS, Nielsen KF, Larsen TO, Frisvad JC, Meyer AS,
Thrane U (2005) Exploring fungal biodiversity for the pro-
duction of water-soluble pigments as potential natural food
colorants. Curr Opin Biotechnol 16:231-238.
Mapari SAS, Hansen ME, Meyer AS, Thrane U (2008) Comput-
erized screening for novel producers of Monascus-like food
pigments in Penicillium species. J Agric Food Chem
56:9981-9989.
Mapari SAS, Meyer AS, Thrane U, Frisvad JC (2009) Identifica-
tion of potentially safe promising fungal cell factories for the
production of polyketide natural food colorants using
chemotaxonomic rationale. Microb Cell Fact 8:24.
Meinicke RM, Vendruscolo F, Moritz DE, de Oliveira D,
Schmidell W, Samohyl RW, Ninow JL (2012) Potential use
of glycerol as substrate for the production of red pigments by
Monascus ruber in submerged fermentation. Biocatal Agri
Biotechnol 1:238-242.
Méndez A, Pérez C, Montañéz JC, Martínez G, Aguilar CN
(2011) Red pigment production by Penicillium
purpurogenum GH2 is influenced by pH and temperature.
Journal of Zhejiang Univ-SCI B (Biomed & Biotechnol)
12:961-968.
Mokhtarani B, Karimzadeh R, Amini MH, SManesh D (2008)
Partitioning of Ciprofloxacin in aqueous two-phase system
of poly(-ethylene glycol) and sodium sulphate. Biochem
Eng J 38:241-247.
Mukherjee G, Singh SK (2011) Purification and characterization
of a new red pigment from Monascus purpureus in sub-
merged fermentation. Process Biochem 46:188-192.
Oh YS, Shih IL, Tzeng YM, Wang SL (2000) Protease produced
by Pseudomonas aeruginosa K-187 and its application in
the deproteinization of shrimp and crab Shell wastes. En-
zyme Microb Tech 27:3-10.
Papagianni M (2004) Fungal morphology and metabolite produc-
tion in submerged mycelial processes. Biotechnol Adv
22:189-259.
Pastrana L, Blanc PJ, Santerre AL, Loret M, Goma G (1995) Pro-
duction of Red Pigments by Monascus mber in Synthetic
Media with a Strictly Controlled Nitrogen Source. Process
Biochem 30:333-341.
Pitt J (1985) A laboratory guide to Common Penicillium species
CSIRO Australia.
Queiroga AC, Pintado ME, Malcata FX (2012) Use of response
surface methodoly to optimize protease synthesis by a novel
strain of Bacillus sp Isolated from Portuguese sheep wool. J
Appl Microbiol 113:36-43.
Rodrigues MI, Iemma AF (2005) Planejamento de Experimentos
e Otimização de Processos Uma estratégia sequencial de
planejamentos. Casa do Pão Editora, Campinas.
Santos-Ebinuma VC, Roberto IC, Teixeira MFS, Pessoa Jr A
(2013a) Improving of Red Colorants Production by a New
Penicillium purpurogenum Strain in Submerged Culture and
the Effect of Different Parameters in Their Stability.
Biotechnol Prog 29:778-785.
Santos-Ebinuma VC, Teixeira MFS, Pessoa Jr A (2013b) Sub-
merged culture conditions for the production of alternative
natural colorants by a newly isolated Penicillium
purpurogenum DPUA 1275. J Microbiol Biotechn
23:802-810.
Santos VC, Hasmann FA, Converti A, Pessoa Jr A (2011) Liq-
uid-liquid extraction by mixed micellar systems: A new ap-
proach for clavulanic acid recovery from fermented broth.
Bioch Eng J 56:75-83.
Silva CS, Bovarotti E, Rodrigues M I, Hokka C O, Barboza M
(2009) Evaluation of the effects of the parameters involved
in the purification of clavulanic acid from fermentation
broth by aqueous two-phase systems. Bioprocess Biosyst
Eng 29:325-632.
Teixeira MFS, Martins MS, Da Silva J, Kirsch LS, Fernandes
OCC, Carneiro ALB, De Conti R, Durán N (2012) Amazo-
nian Biodiversity: Pigments from Aspergillus and
Natural colorants production 741

Penicillium-Characterizations antibacterial activities and
their toxicities. Curr Trends Biotechnol Pharm 6:300-311.
Unagul P, Wongsa P, Kittakoop P, Intamas S, Srikitikulchai P
(2005) Production of red pigments by the insect pathogenic
fungus Cordyceps unilateralis BCC 1869. J Ind Microbiol
Biot 32:135-140.
Viana Marques DA, Pessoa Junior A, Lima-Filho JL, Converti
A, Perego P, Porto ALF (2011) Extractive Fermentation
of Clavulanic Acid by Streptomyces DAUFPE 3060
Using Aqueous Two-Phase System. Biotechnol Prog
27:95-103.
Yang LH, Xiong H, Lee OO, Qi SH, Qian PY (2007) Effect of agi-
tation on violacein production in Pseudoalteromonas
luteoviolacea isolated from a marine sponge. Lett Appl
Microbiol 44:625-630.
Yu X, Wang Y, Wei G, Dong Y (2012) Media optimization for el-
evated molecular weight and mass production of pigment
free pullulan. Carbohyd Polym 89:928-934.
Zafar M, Kumar S, Dhiman AK (2012) Optimization of poly-
hydroxybutyrate (PHB) production by Azohydromonas lata
MTCC 2311 by using genetic algorithm based on artificial
neural network and response surface methodology. Biocatal
Agric Biotechnol 1:70-79.
Zea DVL, Mayerhoff A, Roberto IC, Franco TT (2004) Purifica-
tion of xylose reduxtase from Candida mogii in aqueous
two-phase systems. Bioch Eng J 18:217-223.
All the content of the journal, except where otherwise noted, is licensed under a
Creative Commons License CC BY-NC.
742 Santos-Ebinuma et al.