Improved Traffic Control Measures to Prevent Incorrect ... · Improved Traffic Control Measures to...
88
Improved Traffic Control Measures to Prevent Incorrect Turns at Highway-Rail Grade Crossings November 2013 PROJECT NO. FDOT BDK85 Task Work Order #977-45 PREPARED FOR Florida Department of Transportation
Transcript of Improved Traffic Control Measures to Prevent Incorrect ... · Improved Traffic Control Measures to...

Improved Traffic Control Measures to Prevent Incorrect Turns at Highway-Rail Grade Crossings
November 2013
PROJECT NO.
FDOT BDK85 Task Work Order #977-45
PREPARED FOR
Florida Department of Transportation

Improved Traffic Control Measures to Prevent Incorrect Turns at Highway-Rail Grade Crossings
FDOT BDK85 Task Work Order #977-45
Final Report
Prepared for:
Florida Department of Transportation
Ed Bryant, P.E., PTOE, Project Manager Rail Capacity Production Engineer
Florida Department of Transportation 605 Suwannee Street, MS-25 Tallahassee, FL 32399-0450
Prepared by:
USF Center for Urban Transportation Research
Pei-Sung Lin, Ph.D., P.E., PTOE, FITE, Principal Investigator Program Director, ITS, Traffic Operations and Safety
Center for Urban Transportation Research (CUTR) University of South Florida
4202 E. Fowler Ave., CUT100 Tampa FL 33620-5375
November 2013

ii
Disclaimer
The contents of this report reflect the views of the authors, who are responsible for the facts and the accuracy of the information presented herein. This document is disseminated under the sponsorship of the Department of Transportation, University Transportation Centers Program and the Florida Department of Transportation, in the interest of information exchange. The U.S. Government and the Florida Department of Transportation assume no liability for the contents or use thereof.
The opinions, findings, and conclusions expressed in this publication are those of the authors and not necessarily those of the State of Florida Department of Transportation.

iii
Technical Report Documentation 1. Report No.
2. Government Accession No.
3. Recipient's Catalog No.
4. Title and Subtitle Improved Traffic Control Measures to Prevent Incorrect Turns at Highway-Rail Grade Crossings
5. Report Date November 2013
6. Performing Organization Code 7. Author(s) Pei-Sung Lin, Aldo Fabregas, Achilleas Kourtellis, Sherrell Lall, Michael Bato
8. Performing Organization Report No.
9. Performing Organization Name and Address National Center for Transit Research Center for Urban Transportation Research (CUTR) University of South Florida 4202 E. Fowler Ave., CUT100 Tampa, FL 33620-5375
10. Work Unit No. (TRAIS)
11. Contract or Grant No. BDK85 977-45 12. Sponsoring Agency Name and Address Florida Department of Transportation Research Center 605 Suwannee Street, MS 30 Tallahassee, FL 32399-0450
Research and Innovative Technology Administration U.S. Department of Transportation Mail Code RDT-30, 1200 New Jersey Ave SE, Room E33 Washington, DC 20590-0001
13. Type of Report and Period Covered Final Report, 8/10/2012–12/3/2013
14. Sponsoring Agency Code 15. Supplementary Notes 16. Abstract A number of injuries and fatal collisions have occurred at certain highway-rail grade crossings that are located immediately adjacent to highway intersections, driveways or interstate ramps. Some guide signage, pavement markings, and other traffic control devices present near or at the crossings in the past may have confused drivers and caused them to turn onto the railroad tracks, rather than at the nearby intersections, driveways or ramps. This research found the major contributing causes of incorrect turns onto railroad tracks includes (1) confusing signs and pavement markings near highway-rail crossings, (2) darkness and low visibility near or at highway-rail crossings, (3) following turn instructions from a GPS device onto railroad tracks, (4) skewed highway-rail grade crossings, and (5) driver distraction. Based on the findings from intensive literature review, historical crash data analysis, and field observations, a set of practical countermeasures was developed to prevent incorrect turns onto railroad tracks. The major recommended treatments for upstream of a highway-rail grade crossing include advance direction signage and striping. The recommended downstream treatments also consist of guide signs and striping. For the critical zone, treatments such as striping or dynamic envelope pavement markings, pavement gate markings, bollards, and illumination are recommended. Adequate illumination is essential for reducing the number of rail-vehicle crashes and stuck vehicle incidents due to incorrect turns at night. Finally, this research developed a simple and effective method to help quantify potential drivers that experience confusion or hesitation when they approach a highway-rail grade crossing. It provided a cost-effective method to evaluate the effectiveness of any implemented treatments to prevent incorrect turns onto railroad tracks.
17. Key Words Traffic control device, Incorrect turns, Railroad tracks, Highway-rail grade crossings, Prevention, Countermeasures
18. Distribution Statement No restrictions
19. Security Classification (of this report) Unclassified
20. Security Classification (of this page) Unclassified
21. No. of Pages 87
22. Price

iv
Metric Conversion
SYMBOL WHEN YOU KNOW MULTIPLY BY TO FIND SYMBOL
LENGTH
in inches 25.4 millimeters mm
ft feet 0.305 meters m
yd yards 0.914 meters m
mi miles 1.61 kilometers km
VOLUME
fl oz fluid ounces 29.57 milliliters mL
gal gallons 3.785 liters L
ft3 cubic feet 0.028 cubic meters m3
yd3 cubic yards 0.765 cubic meters m3
NOTE: volumes greater than 1000 L shall be shown in m3
MASS
oz ounces 28.35 grams g
lb pounds 0.454 kilograms kg
T short tons (2000 lb) 0.907 megagrams (or "metric ton") Mg (or "t")
TEMPERATURE (exact degrees)
oF Fahrenheit 5 (F-32)/9 or (F-32)/1.8 Celsius oC

v
Acknowledgments
The authors would like to sincerely thank the FDOT Project Manager, Mr. Ed Bryant, for his full support, constant guidance, and valuable feedback during the execution of the study. Special thanks go to Ms. Annette Lapkowski for providing numerous incident reports on vehicles stuck on rail tracks and technical feedback on progress reports. The authors would like to express their gratitude to the FDOT project panel—Mr. Hector Hartmann, Mr. Anthony Nosse, and Jim Ganey—for their valuable technical input and feedback throughout the project period. The authors greatly appreciate the full support and encouragement from the FDOT Research Center Manager, Mr. Darryll Dockstader. The CUTR research team would also like to express its appreciation to Mr. John Marquette for providing train-related information along the Florida East Coast (FEC) corridor in Broward County for this research project. Finally, the authors would like to thank Dr. Zhenyu Wang from CUTR for assisting a week-long field data collection effort to make this research project successful.

vi
Executive Summary
A number of injuries and fatal collisions have occurred at certain highway-rail grade crossings that are located immediately adjacent to highway intersections, driveways or interstate ramps. Some guide signage, pavement markings, and other traffic control devices present near or at the crossings in the past may have confused drivers and caused them to turn onto the railroad tracks, rather than at the nearby intersections, driveways or interstate ramps. Preventing incorrect turns at highway-rail grade crossings has received considerable attention to help to decrease fatalities and injuries for both road users and rail users/operators.
To contribute to the mitigation of incorrect turns at highway-rail grade crossings, this research project identified critical features and prevailing conditions influencing the incorrect turning behavior of vehicles in the proximity of a rail crossing, and developed a set of countermeasures aimed at improving incorrect turns at these crossings. Based on intensive literature review and field observations, this research found the major contributing causes of incorrect turns onto railroad tracks includes (1) confusing signs and pavement markings near highway-rail crossings, (2) darkness and low visibility near or at highway-rail crossings, (3) following turn instructions from a GPS device onto railroad tracks, (4) skewed highway-rail grade crossings, and (5) driver distraction.
The major recommended treatments for upstream of a highway-rail grade crossing include advance direction signage and striping. The recommended downstream treatments also consist of guide signs and striping. For the critical zone, treatments such as striping or dynamic envelope pavement markings, pavement gate markings, bollards, and illumination are recommended. Adequate illumination is essential for reducing the number of rail-vehicle crashes and stuck vehicle incidents due to incorrect turns at night. The use of bollards as side and median barriers at the highway-rail grade crossings could also be helpful during the night time hours with a reflective paint. However, the use of bollards at the highway-rail grade crossings as a countermeasure to prevent incorrect turns of vehicles onto railroad tracks is still in an experimental stage. It is not authorized in most cases in the U.S.
To quantify potential drivers that experience confusion or hesitation when they approach a highway-rail grade crossing, an effective methodology was developed via this research project to determine driver hesitation rate through the analysis of approaching speeds at the crossing. It provided a cost-effective method to evaluate the effectiveness of any implemented treatments to prevent incorrect turns onto railroad tracks. In addition to the speed data, illumination level data at five candidate railroad crossings for pilot studies were also collected for the analysis.
In summary, this research project provided insight on contributing causes for incorrect turns onto highway-rail grade crossings, recommended practical upstream, critical zone and downstream treatments to prevent incorrect turns onto railroad tracks, and develop a simple and effective method to help quantify potential drivers that experience confusion or hesitation when they approach a highway-rail grade crossing.

vii
Table of Contents
Technical Report Documentation ................................................................................. iii Metric Conversion...................................................................................................... iv Acknowledgments ...................................................................................................... v Executive Summary ................................................................................................... vi Table of Contents ..................................................................................................... vii List of Tables ............................................................................................................ ix List of Figures ............................................................................................................ x Chapter 1 Introduction ................................................................................................ 1 Chapter 2 Literature Review ........................................................................................ 6
Problem Description .............................................................................................. 6 Taxonomy of Countermeasures to Prevent Incorrect Turns onto Railroad Tracks ...... 7 Four Major Scenarios of Incorrect Turns onto Railroad Track .................................. 9 Approach to Review of Countermeasures Based on Locations ............................... 11
Review of Countermeasures ................................................................................. 12 Upstream Treatments ..................................................................................... 13 Critical Zone .................................................................................................. 21 Downstream .................................................................................................. 30 Discussion ..................................................................................................... 31
Chapter 3 Historical Data Analysis and Contributing Causes for Incorrect Turns onto Railroad Tracks ........................................................................................ 32
Historical Data Compilation ................................................................................... 32 Historical Data Analysis ........................................................................................ 33 Selection of Preliminary Candidate Pilot Sites for Study ............................................ 34 Potential Contributing Causes for Incorrect Turns onto Railroad Tracks ...................... 36
Confusing Signs and Pavement Markings near Highway-Rail Crossings .................. 37 Darkness and Low Visibility ............................................................................. 39 Following Turn Instructions from a GPS Device onto Railroad Tracks ..................... 41 Skewed Highway-Rail Grade Crossings .............................................................. 42 Driver Distraction ........................................................................................... 43
Chapter 4 Development of Countermeasures for Preliminary Candidate Pilot Sites ............ 44 Site 1: W Hallandale Beach Blvd and SW 30th Ave, Pembroke Park ........................... 44 Site 2: W Commercial Blvd near I-95, Oakland Park ................................................ 46 Site 3: Forest Hills Blvd near I-95, Lake Clarke Shore .............................................. 47 Site 5: W. Pembroke Rd near I-95, Hollywood ........................................................ 50 Site 6: Hollywood Blvd near I-95, Hollywood .......................................................... 52 Site 7: W Sample Rd near I-95, Pompano Beach ..................................................... 53 Site 8: Washington Ave and Orange Ave, Orlando ................................................... 55 Site 9: Magnolia Ave and N Orange Ave, Orlando .................................................... 56 Site 10: International Speedway Blvd and South Charles St, Daytona Beach .............. 58 Site 11: Miner Rd and S Federal Hwy, Hypoluxo ...................................................... 59
Chapter 5 Baseline Data Collection and Analysis for Final Candidate Sites for Pilot Study .. 61 Selection of Final Candidate Sites for Pilot Study ..................................................... 61 Baseline Data Collection Schedule ......................................................................... 63
viii
Process and Methodology for Speed Data Collection................................................. 63 Speed Data Analysis for Final Candidate Sites ......................................................... 64
Site 1: W Hallandale Beach Blvd & SW 30th St, Pembroke Park ........................... 64 Site 2: W Commercial Blvd & I-95, Oakland Park ............................................... 64 Site 9: Magnolia Ave & Orange N Ave, Orlando .................................................. 64 Site 10: International Speedway Blvd & South Charles St, Daytona Beach ............ 68 Site 11: Miner Rd & South Federal Hwy, Hypoluxo .............................................. 69
Lighting Data Collection and Analysis ..................................................................... 70 Chapter 6 Summary of Research ................................................................................ 74 References ............................................................................................................. 75

ix
List of Tables
Table 3-1: Eleven Preliminary Candidate Pilot Sites...................................................... 35 Table 3-2: Summary of Train-Vehicle Crashes and Reported Incidents for Selected 11
Candidate Pilot Sites ................................................................................ 36 Table 3-3: FDOT Conventional Roadway Lighting Requirements .................................... 39 Table 5-1: Final Candidate Sites for Pilot Study ........................................................... 61 Table 5-2: Hesitation Driver Rate during Daytime ........................................................ 70 Table 5-3: Hesitation Driver Rate during Night Time .................................................... 70

x
List of Figures
Figure 1-1: Railroad Crossings in Florida by County. ..................................................... 2 Figure 1-2: Railroad Crashes in Florida during 2011 by County. ..................................... 2 Figure 1-3: Daytime Train Frequency in Florida. ........................................................... 3 Figure 1-4: Night Time Train Frequency in Florida. ....................................................... 4 Figure 1-5: Task Flow of Proposed Research Approach. ................................................. 5 Figure 2-1: Sketch of Incorrect Turning Maneuver Near an Interstate Ramp. ................... 7 Figure 2-2: Factors Affecting Incorrect Turns onto Railroad Tracks. ................................ 8 Figure 2-3: Naming Convention for Destination Lanes on Intersections Near Railroad
Crossings. .............................................................................................. 9 Figure 2-4: Scenario A, Turning onto Nearside-Adjacent Lane. ..................................... 10 Figure 2-5: Scenario B, Turning onto Nearside-Oblique Lane. ...................................... 10 Figure 2-6: Scenario C, Turning onto Farside-Adjacent Lane. ....................................... 11 Figure 2-7: Countermeasure Locations. ..................................................................... 12 Figure 2-8: Taxonomy of Countermeasures to Reduce Incorrect Turns onto Railroad
Tracks. ................................................................................................. 13 Figure 2-9: Pavement Markings in St Augustine, FL. ................................................... 14 Figure 2-10: Yellow Striping Box in England. ............................................................... 15 Figure 2-11: Yellow Striping Box Specifications in Australia. .......................................... 15 Figure 2-12: White Striping in Arlington, Illinois. .......................................................... 16 Figure 2-13: White Striping Specifications in Texas. ..................................................... 16 Figure 2-14: Examples of LED and Non-LED Raised Pavement Markings. ........................ 17 Figure 2-15: Example of Potential Application of Delineation Devices. ............................. 18 Figure 2-16: Vehicle-Activated Strobe Lights at Railroad Crossings................................. 18 Figure 2-17: Flashing Strobe Lights in Europe. ............................................................ 19 Figure 2-18: Active Internally-Illuminated Sign. ........................................................... 20 Figure 2-19: Advance Warning Sign Used in Hallandale Beach, Florida. ........................... 20 Figure 2-20: Dimensions of Advance Warning Signs. .................................................... 21 Figure 2-21: Example of Inactive Four-Quadrant Gates. ............................................... 21 Figure 2-22: Sidewalk Gates in the U.S. (left) and Europe (right). .................................. 22 Figure 2-23: Proposed Use of Side Barriers (Bollards). .................................................. 23 Figure 2-24: Median Barriers at Railroad Crossings in Illinois. ........................................ 23 Figure 2-25: Median Barriers at a Railroad Crossing. .................................................... 24 Figure 2-26: Cattle-Cum-Trespass Guards in Europe. ................................................... 25 Figure 2-27: Types of Object Markers. ........................................................................ 26 Figure 2-28: Gated Railway Level Crossing in Europe. .................................................. 27 Figure 2-29: BODAN Level Crossing System at Night. ................................................... 28 Figure 2-30: Proposed Pavement Gate Marking. .......................................................... 29 Figure 2-31: Proposed Side Gore Striping. .................................................................. 29 Figure 2-32: Dynamic Envelope Pavement Markings. .................................................... 30 Figure 2-33: Example of Application of Treatments for a Site with a Curve to Prevent
Incorrect Turns. .................................................................................... 31 Figure 2-34: Example of Application of Multiple Treatments to Prevent Incorrect Turns. ... 31 Figure 3-1: Data Filtering Process. ........................................................................... 33

xi
Figure 3-2: Correlation between Time of Day, Weather, and Occurring Incidents. ........... 34 Figure 3-3: Distribution of All Incorrect Turning Incidents in Florida. ............................. 35 Figure 3-4: Confusing Signs and Pavement Markings near Railroad Crossings. ............... 37 Figure 3-5: Confusing Right-Turn Sign and Pavement Marking on Commercial Blvd in
Oakland Park, Florida. ............................................................................ 38 Figure 3-6: Confusing Left- and Right-Turn Pavement Markings on Magnolia Ave in
Orlando, Florida. ................................................................................... 38 Figure 3-7: Confusing Right-Turn Pavement Marking on Hollywood Blvd in Hollywood,
Florida. ................................................................................................ 39 Figure 3-8: Darkness of Railroad Crossing on Commercial Blvd in Oakland Park, Florida
near I-95.............................................................................................. 40 Figure 3-9: Darkness of the Railroad Crossing on Washington Ave in Orlando, Florida
near I-4. .............................................................................................. 40 Figure 3-10: Examples of GPS Navigators Showing Turning Indications. ......................... 41 Figure 3-11: Skewed Highway-Rail Crossing on Tampa Rd Adjacent to State St in
Oldsmar, Florida. ................................................................................... 42 Figure 3-12: Skewed Highway-Rail Crossing on N Andrews Ave Adjacent to NW 7th St
in Fort Lauderdale, Florida. ..................................................................... 42 Figure 3-13: Skewed Highway-Rail Crossing on NE 3rd Ave Adjacent to Progresso Dr in
Fort Lauderdale, Florida. ........................................................................ 43 Figure 4-1: Aerial, Street Views, and Map of Site at Hallandale Beach Blvd. ................... 45 Figure 4-2: Possible Countermeasures for Site at Pembroke Park. ................................ 45 Figure 4-3: Aerial, Street Views, and Map of Site at Commercial Blvd. .......................... 46 Figure 4-4: Possible Countermeasures for Site at Commercial Blvd. .............................. 47 Figure 4-5: Aerial, Street Views, and Map of Site at Forest Hills Blvd. ........................... 48 Figure 4-6: Possible Countermeasures for Site at Forest Hills Blvd. ............................... 48 Figure 4-7: Aerial, Street Views, and Map of Site at Tampa Rd..................................... 49 Figure 4-8: Possible Countermeasures for Site at Tampa Rd. ....................................... 50 Figure 4-9: Aerial, Street Views, and Map of Site at Pembroke Rd. ............................... 51 Figure 4-10: Possible Countermeasures for Site at Pembroke Rd.................................... 51 Figure 4-11: Aerial, Street Views, and Map of Site at Hollywood Blvd. ............................ 52 Figure 4-12: Possible Countermeasures for Site at Hollywood Blvd. ................................ 53 Figure 4-13: Aerial, Street Views, and Map of Site at Sample Rd. ................................... 54 Figure 4-14: Possible Countermeasures for Site at Sample Rd. ...................................... 54 Figure 4-15: Aerial, Street Views, and Map of Site at Washington Ave. ........................... 55 Figure 4-16: Possible Countermeasures for Site at Washington Ave................................ 56 Figure 4-17: Aerial, Street Views, and Map of Site at Magnolia Ave. ............................... 57 Figure 4-18: Possible Countermeasures for Site at Magnolia Ave.................................... 57 Figure 4-19: Aerial, Street Views, and Map of Site at International Speedway Blvd. ......... 58 Figure 4-20: Possible Countermeasures for Site at International Speedway Blvd. ............. 59 Figure 4-21: Aerial, Street Views, and Map of Site at Miner Rd. ..................................... 60 Figure 4-22: Possible Countermeasures for Site at Miner Rd. ......................................... 60 Figure 5-1: Location of Five Selected Final Candidate Sites for Pilot Study. .................... 62 Figure 5-2: Example of Potential Vehicle Experiencing Hesitation. ................................ 64 Figure 5-3: Daytime Speed Profile for Pembroke Park Site (1). .................................... 65 Figure 5-4: Night Time Speed Profile for Pembroke Park Site (1). ................................. 65
xii
Figure 5-5: Daytime Speed Profile for Oakland Park Site (2). ....................................... 66 Figure 5-6: Night Time Speed Profile for Oakland Park Site (2). ................................... 66 Figure 5-7: Daytime Speed Profile for Orlando Site (9). .............................................. 67 Figure 5-8: Night Time Speed Profile for Orlando Site (9). ........................................... 67 Figure 5-9: Daytime Speed Profile for Daytona Beach Site (10). .................................. 68 Figure 5-10: Night Time Speed Profile for Daytona Beach Site (10). ............................... 68 Figure 5-11: Daytime Speed Profile for Hypoluxo Site (11). ........................................... 69 Figure 5-12: Night Time Speed Profile for Hypoluxo Site (11). ....................................... 69 Figure 5-13: Illumination Levels for Pembroke Park Site (1). ......................................... 71 Figure 5-14: Illumination Levels for Oakland Park Site (2). ........................................... 71 Figure 5-15: Illumination Levels for Orlando Site (9). ................................................... 72 Figure 5-16: Illumination Levels for Daytona Beach Site (10). ....................................... 72 Figure 5-17: Illumination Levels for Hypoluxo Site (11). ............................................... 73

1
Chapter 1 Introduction
A number of injuries and fatal collisions have occurred at certain highway-rail grade crossings that are located immediately adjacent to highway intersections, driveways or interstate ramps. Some guide signage, pavement markings, and other traffic control devices present near or at the crossings in the past may have confused drivers and caused them to turn onto the railroad tracks, rather than at the nearby intersections, driveways or ramps. The Commercial Blvd (SR 870) crossing with the state-owned Tri-Rail/CSX railroad in Broward County is one example of a crossing that has had this type of occurrence recently, resulting in 10 injured passengers (out of a potential 275) on a Tri-Rail train and disruptions in rail service for days afterward.
The purpose of this project was to identify a range of low- to high-cost solutions to the ongoing issue of vehicles turning onto the tracks at highway-rail grade crossings. Drivers are often confused by guide signage, pavement markings, and other traffic control devices present at the crossing. This safety issue is known to have occurred at a number of crossings in the state. A major task of this project was to identify these locations, conduct field visits to these locations, and research effective traffic control measures that have helped alleviate this problem elsewhere. Pilot testing of these measures at selected locations and reporting the effectiveness of the measures will occur in a future project. The selection of pilot testing measures will depend on the results of this study and future available funding for implementation testing.
In Florida, rail transit is currently available in Miami, Jacksonville, and Tampa. New passenger rail lines are in the advanced stages of planning/construction, such as SunRail, which connects Orange, Seminole, Volusia, and Osceola counties. There is also the possibility that private rail passenger service will be established from Orlando to Miami by the Florida East Coast (FEC) Railroad by 2016. In addition, Amtrak provides service in different parts of the state. Passenger rail lines are commonly built in urban areas requiring multiple highway-rail grade crossings.
Although collision frequency is low, the potential injuries, property damages, and lost time caused by minor incidents are magnified due to the passenger volumes that this transit service handles (e.g., Tri-rail ridership is 14,500+ people daily). In addition to injured passengers, societal losses due to disruption in service are increased. Most often, trains cannot avoid collisions with vehicles at crossings due to the extensive stopping distance required. Crashes may have the potential to affect the safety of tens to hundreds of passengers and nearby residents.
The Florida Department of Transportation (FDOT) and the National Center for Transit Research (NCTR) at the University of South Florida’s Center for Urban Transportation Research (CUTR) took a proactive role in enhancing the safety at highway-rail grade crossings by sponsoring research aimed at designing and evaluating countermeasures for preventing incorrect turns at highway-rail grade crossings near highway intersections.
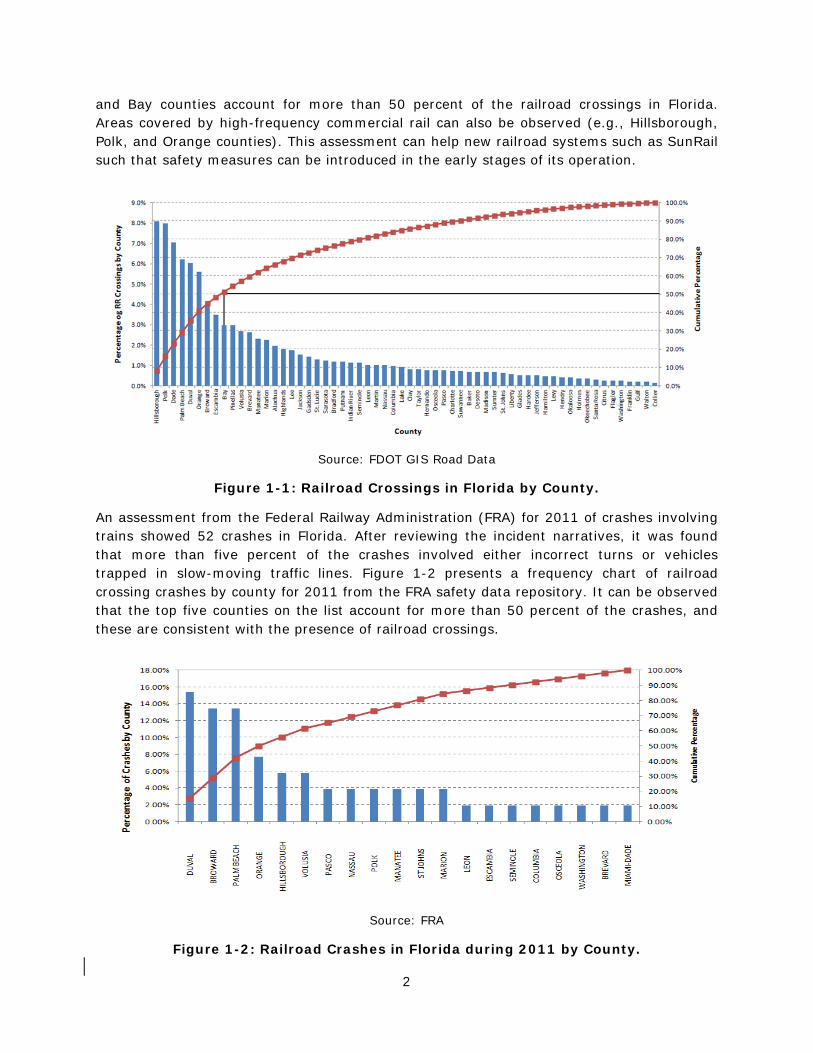
An initial assessment of the research scope was performed by the CUTR team by collecting GIS data on the number of railroad crossings by county, as shown in Figure 1-1. It was found that Hillsborough, Polk, Miami-Dade, Palm Beach, Duval, Orange, Broward, Escambia,
2
and Bay counties account for more than 50 percent of the railroad crossings in Florida. Areas covered by high-frequency commercial rail can also be observed (e.g., Hillsborough, Polk, and Orange counties). This assessment can help new railroad systems such as SunRail such that safety measures can be introduced in the early stages of its operation.
Source: FDOT GIS Road Data
Figure 1-1: Railroad Crossings in Florida by County.
An assessment from the Federal Railway Administration (FRA) for 2011 of crashes involving trains showed 52 crashes in Florida. After reviewing the incident narratives, it was found that more than five percent of the crashes involved either incorrect turns or vehicles trapped in slow-moving traffic lines. Figure 1-2 presents a frequency chart of railroad crossing crashes by county for 2011 from the FRA safety data repository. It can be observed that the top five counties on the list account for more than 50 percent of the crashes, and these are consistent with the presence of railroad crossings.
Source: FRA
Figure 1-2: Railroad Crashes in Florida during 2011 by County.
3
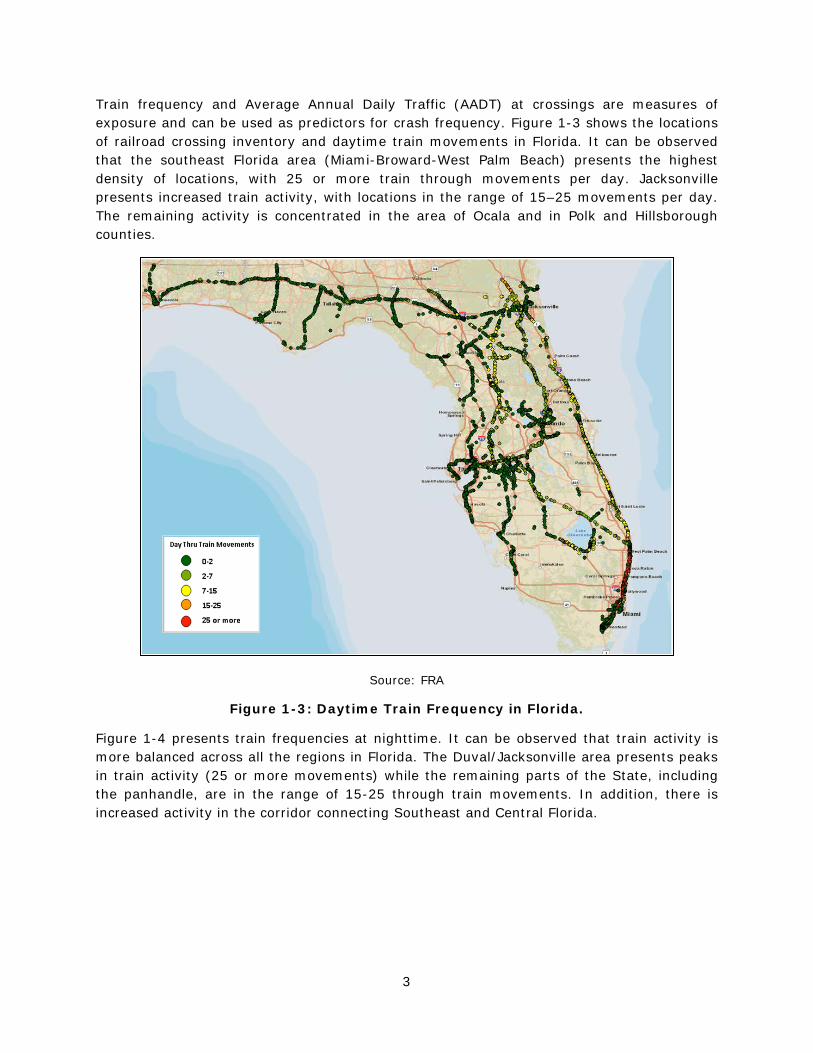
Train frequency and Average Annual Daily Traffic (AADT) at crossings are measures of exposure and can be used as predictors for crash frequency. Figure 1-3 shows the locations of railroad crossing inventory and daytime train movements in Florida. It can be observed that the southeast Florida area (Miami-Broward-West Palm Beach) presents the highest density of locations, with 25 or more train through movements per day. Jacksonville presents increased train activity, with locations in the range of 15–25 movements per day. The remaining activity is concentrated in the area of Ocala and in Polk and Hillsborough counties.
Source: FRA
Figure 1-3: Daytime Train Frequency in Florida.
Figure 1-4 presents train frequencies at nighttime. It can be observed that train activity is more balanced across all the regions in Florida. The Duval/Jacksonville area presents peaks in train activity (25 or more movements) while the remaining parts of the State, including the panhandle, are in the range of 15-25 through train movements. In addition, there is increased activity in the corridor connecting Southeast and Central Florida.

4
Source: FRA
Figure 1-4: Night Time Train Frequency in Florida.
Objectives and Supporting Tasks
Preventing incorrect turns at highway-rail grade crossings can help to decrease fatalities and injuries for both road users and rail users/operators. In addition, other societal benefits such as passenger lost time, increased congestion, freight delays, and infrastructure repairs can be reduced by minimizing the risk at highway-rail grade crossings. To contribute to the mitigation of incorrect turns at highway-rail grade crossings, this project focused on the following objectives:
• Identify critical features and prevailing conditions influencing the incorrect turning behavior of vehicles in the proximity of a rail crossing.
• Design a set of countermeasures aimed at improving incorrect turns at highway-rail grade crossings.
• Produce quantitative data that estimate the potential benefits of safety improvements at highway-rail grade crossings.
The research project is divided in two major phases. The first phase deals with the assessment of current conditions, a literature review on countermeasures to prevent incorrect turns onto railroad tracks, identification of candidate sites for pilot studies, design
5
of candidate countermeasures for the candidate sites, and baseline data collection. The main outcomes of the first phase are candidate pilot sites, associated countermeasures for the pilot studies, and baseline data collection for the selected candidate pilot sites.
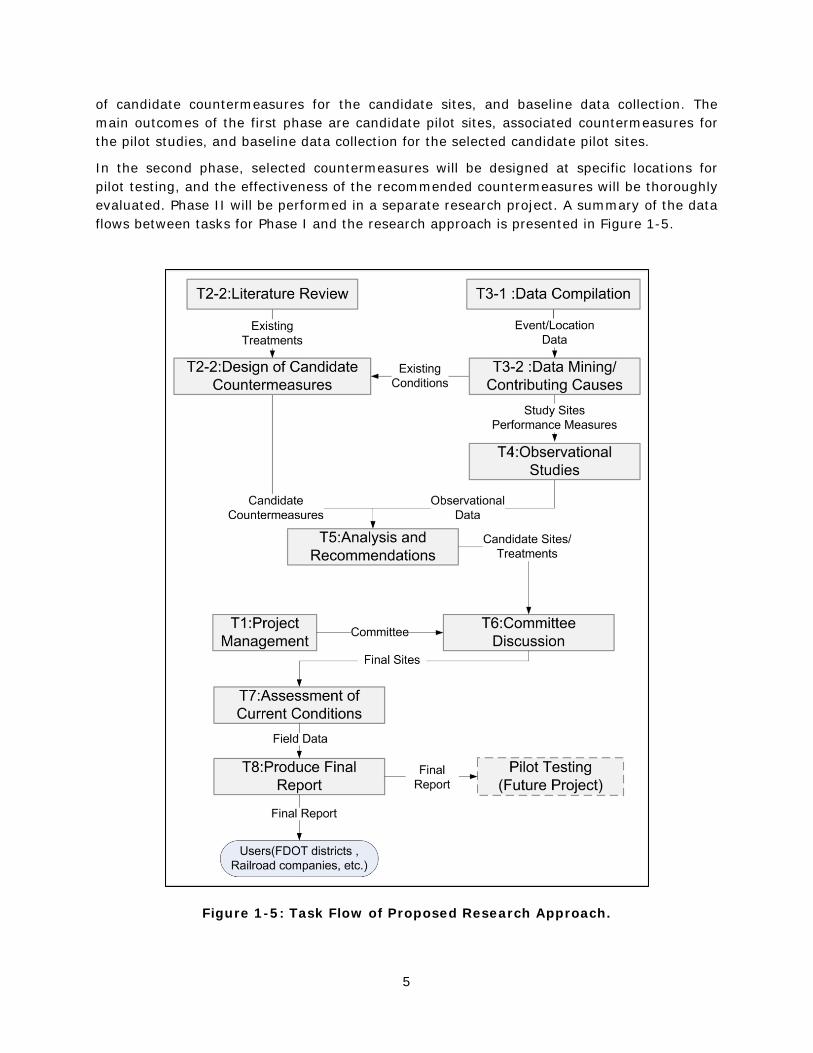
In the second phase, selected countermeasures will be designed at specific locations for pilot testing, and the effectiveness of the recommended countermeasures will be thoroughly evaluated. Phase II will be performed in a separate research project. A summary of the data flows between tasks for Phase I and the research approach is presented in Figure 1-5.
Figure 1-5: Task Flow of Proposed Research Approach.

6
Chapter 2 Literature Review
A number of injury and fatal collisions have occurred at certain highway-rail grade crossings that are located immediately adjacent to highway intersections, driveways or interstate ramps. Guide signage, pavement markings, and other traffic control devices present at the crossing may have confused drivers and caused them to turn onto the railroad tracks rather than at nearby intersections, driveways or ramps. Among the increasing number of highway-rail grade crossing crashes in the United States, the problem of incorrect turns at highway-rail grade crossings has recently started to receive significant attention.
Due to limited research in this new area of prevention of incorrect turns at highway-rail grade crossings, the literature review presented in this chapter seeks to identify available sources of information and best practices throughout the world for innovative and cost-effective treatments for future pilot testing and evaluation. This literature review includes two major sections: a problem description and a review of countermeasures. The main contributing factors affecting incorrect turns onto railroad tracks are presented first. To address the criticality of incorrect turns at highway-rail grade crossings, four major scenarios of incorrect turns are introduced. The approach used for developing countermeasures to prevent incorrect turns based on the locations of a vehicle relative to a highway-rail grade crossing is illustrated.
Countermeasures or best practices to prevent incorrect turns at a highway-rail grade crossing are reviewed based on the location upstream at the critical zone (railroad crossing area) and downstream of the railroad crossing. The countermeasure review provides a complete picture of how the reviewed countermeasures can be used to reduce or prevent incorrect turns onto railroad tracks.
Problem Description
Events involving drivers turning incorrectly on railroad tracks are being reported with increased frequency. This situation is observed primarily at highway-rail crossings adjacent to traffic intersections where turning movements are required (e.g., intersections, driveways, ramps, etc.). Guide signage and other traffic control devices are present in the surroundings of the crossings. However, drivers may get confused and perform incorrect turning maneuvers, leading to a potentially dangerous situation.
Figure 2-1 presents an example of a scenario involving an incorrect turn onto railroad tracks near an on-ramp. Drivers unfamiliar with the area or who are distracted may enter the turning lane and make a wrong decision at the apparent turning point. Once the driver passes the shoulder and the lateral concrete slab, the vehicle will likely get stuck on the railroad tracks, leading to a hazardous situation.

7
Figure 2-1: Sketch of Incorrect Turning Maneuver Near an Interstate Ramp.
In some cases, it has been reported that drivers have turned onto railroad tracks due to GPS turning indications (Berger, 2008). A review of the narrative of FRA data from 2010–2012 on crashes at railroad crossings revealed one occurrence of an incorrect turn due to a GPS indication in San Francisco in 2012.
The main elements that contribute to incorrect turns onto railroad tracks generally include driver factors, traffic infrastructure factors, and environmental factors. Figure 2-2 presents a conceptual overview of the factors affecting incorrect turns onto railroad tracks. The framework was adapted from the behavioral framework for speeding proposed by Campbell et al. (2008) in NCHRP Report 600, Human Factors Guidelines for Road Systems. This FDOT research project focused on traffic infrastructure and environmental factors that can be modified with countermeasure elements to provide an improved driving environment on roadways adjacent to highway-rail grade crossings near intersections or turning points.
It is important to highlight that driver-related factors play an important role in the occurrence of incorrect turns. However, little data are available to produce an adequate assessment of the effect and countermeasures of such factors. Driver factors such as distracted driving or driving under the influence were not considered the focus of this research. Countermeasure elements addressing specific driving actions (incorrect turns) and environmental factors (dark conditions) were the focus of this study.
Taxonomy of Countermeasures to Prevent Incorrect Turns onto Railroad Tracks Prevention of incorrect turns onto railroad tracks can benefit both transportation agencies and railroad companies. Safety and reliability of travel are increased for transportation agencies. For railroad companies, this can translate into savings due to fewer interruptions and decreased property damage. For passenger rail, the safety and reliability of the system can be improved if incorrect turns on rail tracks are mitigated.

8
Figure 2-2: Factors Affecting Incorrect Turns onto Railroad Tracks.
To address the topic of incorrect turns onto railroad tracks and associated countermeasures, it was necessary to establish a systematic characterization approach. For this problem to be observed, it was necessary to have a railroad track (railroad crossing), a roadway intersection (turning point) in close proximity, and a vehicle. The intersection provides a chance for vehicles to change directions by turning onto the desired destination lanes. At the same time, the intersection centerline serves as a reference to divide the highway-rail intersection system into two halves, one of them containing the railroad tracks (nearside). The half that does not contain the railroad track is denoted as rail track farside (see Figure 2-3).

9
Figure 2-3: Naming Convention for Destination Lanes on Intersections Near Railroad Crossings.
The most common intersection is the four-leg intersection containing four destination lanes. In general, it is expected that one destination lane will be immediately adjacent to the railroad track (nearside-adjacent in Figure 2-3). The direction of the nearside-adjacent lane may be parallel with the railroad track or may form a small skew angle. The destination lane nearside-oblique (Figure 2-3) is on the rail-track side of the intersection but forms a skew angle close to 90o (above or below). The destination lane farside-adjacent (Figure 2-3) may run close to parallel to the railroad track but is not immediately adjacent because it has an intersection approach lane in between. The last destination lane is the farside-oblique (Figure 2-3), which forms an angle with the railroad crossing but is located past the intersection centerline on the distant side from the rail tracks. This naming convention is used to explain the different turning scenarios.
Four Major Scenarios of Incorrect Turns onto Railroad Track Several turning scenarios were analyzed. The most critical destination lane is the nearside-adjacent. Scenario A, as shown in Figure 2-4, is turning nearside-adjacent lane. This scenario is considered the most critical because the change in direction required to reach the destination lane is very similar to that for reaching the rail tracks (e.g., 90o turn).
Scenario B in Figure 2-5 represents the case of turns onto the nearside-oblique lane. This scenario is second in criticality since only the left-turn movement may have the chance to get onto the rail track (turn less than 90o). The right-turn movement needs a 180o turn (U-turn) in order to access the rail tracks.

10
Figure 2-4: Scenario A, Turning onto Nearside-Adjacent Lane.
Figure 2-5: Scenario B, Turning onto Nearside-Oblique Lane.

11
Figure 2-6 presents scenario C, turning onto the farside-adjacent destination lane. It can be observed that such a lane is easily reached by the right turn movement. Left turns, depending on the geometry and median configuration, may present a chance to generate incorrect turns onto railroad tracks.
Figure 2-6: Scenario C, Turning onto Farside-Adjacent Lane.
Based on the preceding analysis, it was important to pay special attention to the nearside-adjacent destination lane scenario for turning movements since it has the most potential to generate incorrect turns onto railroad tracks.
Approach to Review of Countermeasures Based on Locations Another important aspect of the problem of incorrect turns onto railroad tracks is the location and action of the countermeasure. Based on a systematic analysis of the turning maneuvers, the location of the countermeasures were divided with respect to the critical point, which, in this case, is the railroad track.
The recommended classification of the countermeasures based on location is upstream of the railroad crossing, at the critical zone, and downstream of the railroad crossing, as shown in Figure 2-7. The critical zone is the area of the road where drivers may have a chance to correct their trajectory if provided with appropriate indications. The critical zone may vary depending on the geometry and the scenario being treated. The countermeasures can be classified, based on the type of action, as those promoting correct path usage and those discouraging incorrect turns.

12
Figure 2-7: Countermeasure Locations.
Countermeasures located upstream of the railroad crossing are oriented to provide advance indications of the upcoming risk of maneuvering onto the railroad tracks or promoting a safe trajectory for the vehicle. Other possible locations for countermeasures are at the critical zone. Another location for countermeasure placement is downstream or past the railroad crossing. Countermeasures implemented downstream should be visually appealing to provide guidance to follow the correct trajectory or path to the destination lane. Countermeasures upstream and downstream of the railroad, in most cases, are within the jurisdiction of transportation agencies. Most countermeasures in the critical zone are in the jurisdiction of the railroad company, and others are in the jurisdiction of the transportation agency. In cases of shared responsibilities, communication between the parties plays an important role in the success of the countermeasure.
Review of Countermeasures
The countermeasures for reducing incorrect turns on highway-rail grade crossings are presented in this section. These countermeasures were classified with respect to upstream treatments, critical zone treatments, and downstream treatments (see Figure 2-8). The treatments can be further classified based on their focus. Some treatments are aimed at promoting path continuation across the railroad crossings, other treatment groups explicitly focus on discouraging incorrect turns, and a third group includes physical improvements such as geometric changes to the railroad crossing.

13
Figure 2-8: Taxonomy of Countermeasures to Reduce Incorrect Turns onto Railroad Tracks.
Upstream Treatments Upstream treatments focus on warning drivers about the upcoming railroad crossing. These treatments also include indications for turning and lane assignments (e.g., turning lanes, ramps, etc.). Upstream treatments include a combination of regulatory warning signs located in advance of the railroad crossing. These treatments are installed and maintained by the transportation agency since the treatments are installed outside of the right-of-way of the rail tracks. The transportation agency may be the City, County, or State, depending on the ownership of the roadway that crosses the railroad tracks.
Pavement Markings Pavement markings are very informative and can be used as preventive measures to inform drivers. They give advanced indications and aim to prevent confusion so that the number of incorrect turns can be effectively reduced on the highway-rail grade tracks. Pavement markings communicate to drivers where to position their vehicles, warn about upcoming conditions, and indicate where passing is allowed. Glass beads are normally used in pavement markings to reflect light back to the driver from headlights. They work well when the road surface is dry, but when the surface is wet, the water can act like a mirror, reflecting light in a different direction, which often creates glare (Minnesota Department of Transportation, 2012).
To improve upon visibility when wet, innovative new pavement markings are being developed, including glass beads and ceramic elements. These new pavement markings reflect light back toward motorists to help them determine the location of driving lanes, edge lines, and merge indicators, whether they are dry or covered by a thin film of water. When wet-reflective pavement markings are grooved into the pavement, it promises better

14
visibility when the roadway gets wet. There are stipulations surrounding the fact that when these markings are wet, they are less skid resistant, especially to motorcycles. Due to the new makeup of the materials for these new pavement markings, they are currently undergoing further testing in certain areas around the country (Little Canada, MN; Vadnais Heights, MN; and Ft. Lauderdale, FL).
Pavement markings are an extremely visible method of warning drivers to be aware of upcoming tracks and promoting correct path continuation across the tracks, especially in the proximity of interstate ramps with turning lanes extending through a railroad crossing. They are a low-cost option and require minimal maintenance. The only maintenance cost associated with pavement markings is the cost to repair damage incurred by normal wear and tear on the road surface. Pavement markings at railroad crossings can be executed as follows:
• Reduce pavement markings upstream of railroad crossing to avoid information overload.
• Add pavement markings before and after the railroad crossing to form a consistent pattern promoting path continuation.
• Add pavement markings with additional guidance, such as interstate signs (see Figure 2-9).
Figure 2-9: Pavement Markings in St Augustine, FL.
Striping Ground striping while approaching the railroad tracks is a low-cost countermeasure option. In the U.S., Illinois and North Dakota use white striping, whereas in Europe and Australia, yellow striping is placed on the ground before the railroad tracks, as seen in Figure 2-10. Ground striping gives advance indication to the drivers by bringing awareness to the upcoming railroad tracks and, consequently, will reduce confusion of drivers because they will already be on the alert.

15
Figure 2-10: Yellow Striping Box in England.
An example of the dimensions for a yellow striping box in Australia is presented Figure 2-11.
Figure 2-11: Yellow Striping Box Specifications in Australia.
Source: Department of Planning, Transport and Infrastructure, 2012
Pavement striping is very visible and promotes correct path continuation across the tracks. It is a low-cost option and requires minimal maintenance. The only maintenance cost associated with pavement stripes is the cost to repair damage incurred by normal fading, which is expected on the road surface. Figure 2-12 shows the white striping used in Illinois. Figure 2-13 shows the specifications for white striping at railroad crossings in Texas.

16
Figure 2-12: White Striping in Arlington, Illinois.
Figure 2-13: White Striping Specifications in Texas.
Speed Reduction A simple countermeasure that causes drivers to be more aware of their surroundings is travel speed reduction around rail tracks especially for skewed highway-rail grade crossings. This enables them to realize their correct path and follow it accordingly. It also improves sight distance ability by slowing down drivers so they can see ahead more clearly. This countermeasure is implemented and maintained by a transportation agency at little cost.

17
Delineation Devices The use of delineation devices, such as reflectors and raised pavement markers, can also be used as an upstream countermeasure. Delineation devices include pavement markings, guideposts, and raised pavement markers used on and adjacent to the roadway to define vehicular travel paths. In terms of this project, drivers seemed to get confused by the curve when railroad tracks are not at a 90˚ angle. This can cause the driver to go off the road and onto the railroad tracks. Placing delineation devices upstream will encourage drivers to follow the designated path to prevent these incorrect turns. It will also improve the ability of drivers to follow the correct path by providing them with a visual of their travel path. Figure 2-14 shows how a delineation device can be used to promote the correct passageway to drivers and enhance operations in dark conditions. It provides drivers with a means to visualize what path needs to be taken across the railroad tracks.
Figure 2-14: Examples of LED and Non-LED Raised Pavement Markings.
Delineation can be in the form of conventional retro-reflective studs. This can help drivers to maneuver at railroad crossings in the proximity of an intersection. Figure 2-15 shows an example of a potential application of delineation devices to guide drivers to the correct receiving lane after a left turn from the southbound of Dixie Highway to eastbound of Copans Road.

18
Figure 2-15: Example of Potential Application of Delineation Devices.
Vehicle-Activated Strobe Lights Vehicle-activated strobe lights attract motorist attention by setting off a strobe light when a vehicle passes over detectors placed on the roadway, as shown in Figure 2-16. Studies conducted by the Texas Transportation Institute positioned a strobe light on top of a standard railroad advance warning sign and a vehicle detector approximately 8 seconds before the advance warning sign (Fambro and Noyce, 1997). The strobe light flashed 3–5 times to direct the driver's attention toward the advance warning sign and stopped flashing 2–3 seconds before the driver reached the sign to allow time to read the sign. Florida has a number of locations with beacons on advance warning signs. Most of these beacons are not activated by vehicles but, rather, by trains. It may be effective to make this countermeasure activated by vehicles, especially at night, to promote proper path continuation. Florida also has a number of beacon locations on R8-8 (“Do Not Stop on Tracks”) signs that are activated by vehicles.
Figure 2-16: Vehicle-Activated Strobe Lights at Railroad Crossings.

19
The results of the Fambro and Noyce (1997) study concluded that a vehicle-activated strobe light device is an “effective traffic control device and can improve roadway safety at passive highway-rail grade crossings.” The device is most effective at reducing average speeds at night. When surveyed, drivers responded positively to an advance warning sign, and a favorable number were able to recall the exact wording imprinted on it. The vehicle-activated strobe signing system was concluded to increase driver awareness at the crossing and caused drivers to approach the crossing with caution (Fambro and Noyce, 1997). This device can serve a great purpose at both active and passive crossings to increase awareness during both daylight and night time hours.
The vehicle-activated strobe light is also similar to another device used in Europe called the flashing strobe light. They both work essentially the same way, but instead of a constant flashing beacon of light, this countermeasure flashes different colored lights, indicating the area to be dangerous. As shown in Figure 2-17, this design is implemented to caution road users that there are tracks ahead.
Figure 2-17: Flashing Strobe Lights in Europe.
Active Internally-Illuminated Signs The use of active internally-illuminated signs for parallel traffic turning can also be implemented as a low-cost countermeasure. This device helps with illumination deficiencies at night. Placing an illuminated sign that clearly tells the driver not to turn is extremely beneficial. It indicates the correct path for the driver to take and provides some sort of light that will cause the driver to focus when approaching a critical zone. Figure 2-18 shows examples of sign design that could be used.

20
Figure 2-18: Active Internally-Illuminated Sign.
Source: U.S. Department of Transportation, 2007
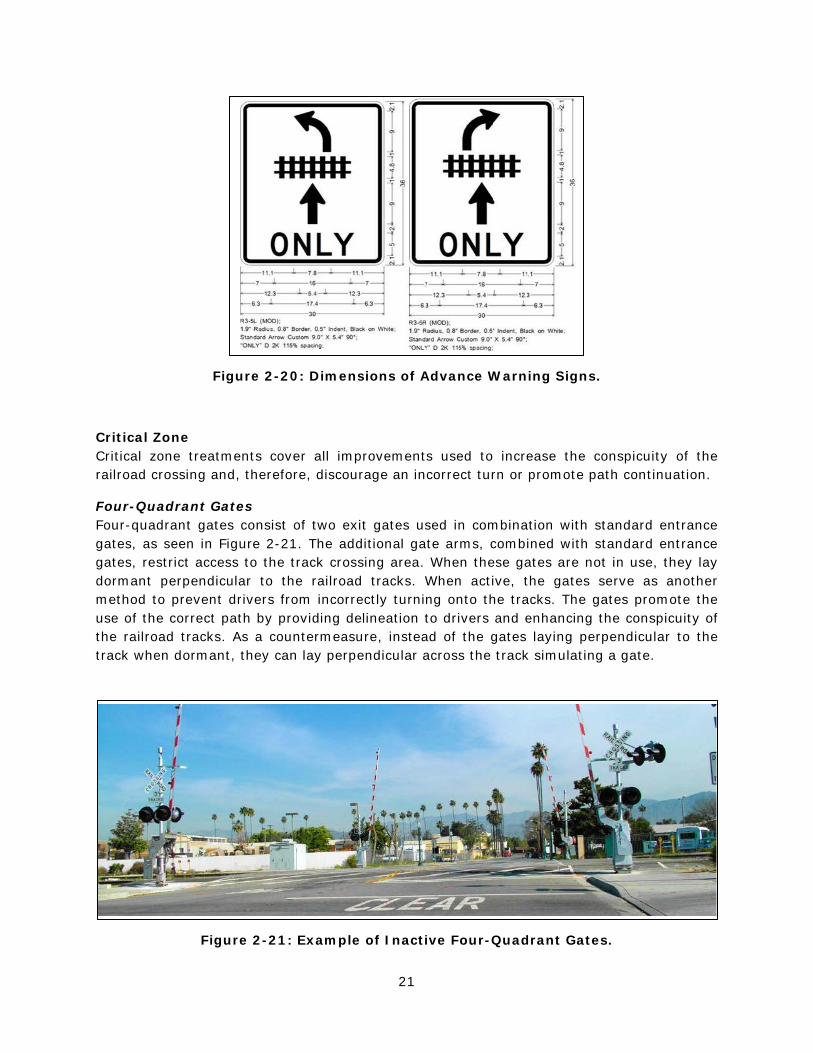
Advance Direction Signs Advance direction signs, as shown in Figure 2-29, are currently being tested in the Hallandale Beach area on Dixie Boulevard. The dimensions of these 30×36-in. black & white reflective signs are shown in Figure 2-20. The signs consist of directional arrows that show the approaching driver where to turn and also warn them that there is a railroad track before the actual turn. The signs give advance indications and aim to prevent confusion so that the number of incorrect turns can be reduced on the highway-rail grade tracks.
Figure 2-19: Advance Warning Sign Used in Hallandale Beach, Florida.
The use of advance warning signs is applicable in locations where the roadway is parallel to the railroad tracks with minimal separation. As shown in Figure 2-20, the signs notify drivers that railroad tracks are ahead and to turn only after crossing the tracks. These sign are easy to maintain and also very cost effective, requiring negligible maintenance fees after installation. These signs are considered low tier on the countermeasure cost scale.
21
Figure 2-20: Dimensions of Advance Warning Signs.
Critical Zone Critical zone treatments cover all improvements used to increase the conspicuity of the railroad crossing and, therefore, discourage an incorrect turn or promote path continuation.
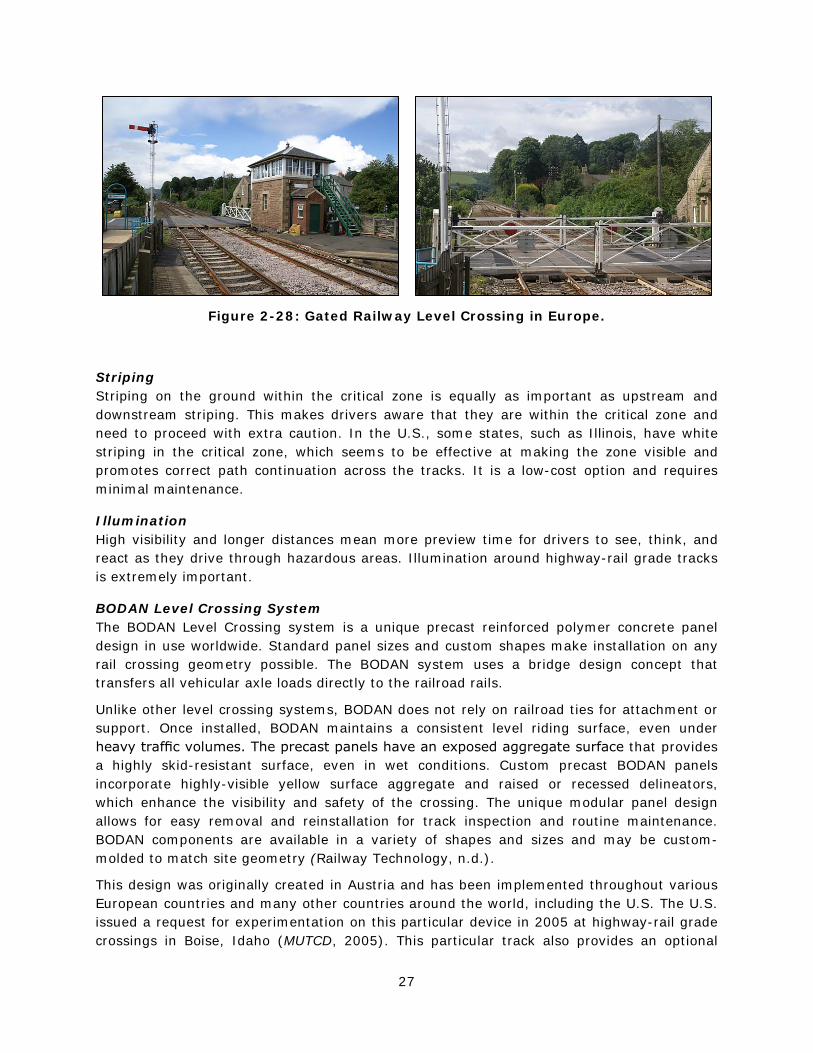
Four-Quadrant Gates Four-quadrant gates consist of two exit gates used in combination with standard entrance gates, as seen in Figure 2-21. The additional gate arms, combined with standard entrance gates, restrict access to the track crossing area. When these gates are not in use, they lay dormant perpendicular to the railroad tracks. When active, the gates serve as another method to prevent drivers from incorrectly turning onto the tracks. The gates promote the use of the correct path by providing delineation to drivers and enhancing the conspicuity of the railroad tracks. As a countermeasure, instead of the gates laying perpendicular to the track when dormant, they can lay perpendicular across the track simulating a gate.
Figure 2-21: Example of Inactive Four-Quadrant Gates.

22
Sidewalk Gates The use of sidewalk gates potentially can stop drivers from incorrectly turning onto the railroad tracks. These devices are used to warn pedestrians and also may result in drawing attention of drivers to the location of railroad crossings. This system can also be used in an alternate manner by placing the sidewalk gates perpendicular across the train tracks at the edge of the road to provide a delineation device for drivers. As a train approaches, the gated system can be activated so that the gates will open and allow the train to pass through without incident. This system promotes correct path continuation and delineation. It also brings driver attention to the fact that there are tracks ahead so that turning is discouraged (see Figure 2-22).
Figure 2-22: Sidewalk Gates in the U.S. (left) and Europe (right).
Bollards Median and side barriers are commonly used on roadways to effectively separate motorists traveling in opposing lanes, while also considering the safety of the occupants of errant vehicles (FHWA, 2013). The concept can also be applied to use bollards as side and median barriers to prevent drivers from making incorrect turns onto railroad tracks. Figure 2-23 shows one way that the bollards can be used to prevent drivers from incorrectly turning onto railroad tracks. With a system similar to this, roadway engineers can help promote the correct pathway to reduce driver confusion. Bollards are typically made of plastic to give way or break-away when struck by a vehicle.
Another way this system can be configured is already being implemented in Illinois. In Figure 2-24, it can be seen that the bollards are used as a delineation device to promote the correct passageway and also gives an idea of what colors can be used when implementing this countermeasure. This figure was captured at two different locations in Illinois. The left shows a location at Three Oaks Drive of Union Pacific Railroad’s tracks in Cary, McHenry County, Illinois; the right shows the location at the Monroe Street highway-rail crossing of the BNSF Railway’s tracks in the Village of Hinsdale, DuPage County. On the left, white bollards with grey reflective striping were implemented; on the right red bollards with white reflective striping were implemented. In Florida, red bollards are being proposed. Both solutions were deemed acceptable for the scope of this project.

23
Figure 2-23: Proposed Use of Side Barriers (Bollards).
Figure 2-24: Median Barriers at Railroad Crossings in Illinois.
However, the use of bollards at the highway-rail grade crossings as a countermeasure to prevent incorrect turns of vehicles onto railroad tracks is still in an experimental stage. it is not authorized in most cases in the U.S.
Figure 2-25 shows the use of a median barrier as a type of channelization device, warning drivers that they are approaching railroad tracks and that they should not turn at this point. Median barriers, along with quadrant gates, are an obvious indication to drivers that they should not turn at that moment. This device is used so drivers do not impact the warning device. An additional benefit from this is deterring drivers from turning onto the tracks.

24
Figure 2-25: Median Barriers at a Railroad Crossing.
Pavement Markings Similar to upstream treatments, pavement markings promote the correct path for drivers. As drivers approach the critical zone, they will be able to see the route clearly and follow according to the layout. These markings help drivers maintain the correct path and discourage incorrect turns.
Speed Reduction A countermeasure that can be maintained within the critical zone is speed reduction around the rail tracks especially for skewed highway-rail grade crossings. This helps guide drivers across the tracks and also helps them see the correct path ahead.
Delineation Devices The use of delineation devices, such as reflectors and raised pavement markers, can also be used within the critical zone as countermeasures. Delineation helps promote a safe pathway for drivers by showing them the correct travel path, even at night.
A delineation device called cattle-cum-trespass guards can be installed within the critical zone. These guards, shown in Figure 2-26, are placed adjacent to the road at level crossings in Europe. They are used to deter animals from straying and pedestrians from trespassing. They can also be used to inform drivers with visual and audible affects when they try to turn onto the tracks. This countermeasure produces a tactile vibration that is transmitted through the wheels into the car body and comes in two forms. Shown on the left of Figure 2-26 are the traditional guards that are placed at the railroad tracks, which are metal. On the right is shown a newly-developed design that incorporates reclaimed rubber. This method can be used to inform drivers of the correct driving passage along railroad tracks and can be installed on either side of the tracks so that drivers can be aware that they are not traveling along the right path.

25
Figure 2-26: Cattle-Cum-Trespass Guards in Europe.
For installation, these panels come with recycled plastic planks measuring 38mm × 80mm × 140mm and cadmium-plated, rust-resistant, self-tapping screws. The planks are inserted perpendicular and underneath the rail at each end of the panel. The panel is then screwed to the plank with the self-tapping screws. With the other half of the plank now sitting on the other side of the rail, the adjoining panel is attached to this with screws. The panels that are next to the previously-laid panels attach to the remaining half of the exposed plank so that it is perpendicular to the track (HoldFast Level Crossings Limited, 2009). This countermeasure could be incorporated by a transportation agency in cooperation with a railroad company because it requires extended right-of-way and coordination of train flagging for installation and maintenance.
Object Markers Object markers are considered to be low-cost countermeasures. They can be placed in the critical zone area, similar to the median barriers, to discourage incorrect turns and promote the correct pathway. Figure 2-27 provides examples of different types of object markers available for placement in the critical zone. There are different types of markers that can be used for different types of railroad tracks.

26
Figure 2-27: Types of Object Markers.
Source: Manual on Uniform Traffic Devices (MUTCD)
Gated Railway Level Crossing A gated railway level crossing design is primarily a British method and is used in Europe to stop people and animals from wandering onto the tracks when a train is approaching. This type of crossing is shown in Figure 2-28. As a train approaches, the gated system is activated by an operator who assures that the gates will block traffic while the train is passing. This method could be used in the U.S. to address the problem of people incorrectly turning onto the railroad tracks. It is feasible to make the gates train-activated where they are down when there is no train approaching and open to allow the train to pass through without incident.
27
Figure 2-28: Gated Railway Level Crossing in Europe.
Striping Striping on the ground within the critical zone is equally as important as upstream and downstream striping. This makes drivers aware that they are within the critical zone and need to proceed with extra caution. In the U.S., some states, such as Illinois, have white striping in the critical zone, which seems to be effective at making the zone visible and promotes correct path continuation across the tracks. It is a low-cost option and requires minimal maintenance.
Illumination High visibility and longer distances mean more preview time for drivers to see, think, and react as they drive through hazardous areas. Illumination around highway-rail grade tracks is extremely important.
BODAN Level Crossing System The BODAN Level Crossing system is a unique precast reinforced polymer concrete panel design in use worldwide. Standard panel sizes and custom shapes make installation on any rail crossing geometry possible. The BODAN system uses a bridge design concept that transfers all vehicular axle loads directly to the railroad rails.
Unlike other level crossing systems, BODAN does not rely on railroad ties for attachment or support. Once installed, BODAN maintains a consistent level riding surface, even under heavy traffic volumes. The precast panels have an exposed aggregate surface that provides a highly skid-resistant surface, even in wet conditions. Custom precast BODAN panels incorporate highly-visible yellow surface aggregate and raised or recessed delineators, which enhance the visibility and safety of the crossing. The unique modular panel design allows for easy removal and reinstallation for track inspection and routine maintenance. BODAN components are available in a variety of shapes and sizes and may be custom-molded to match site geometry (Railway Technology, n.d.).
This design was originally created in Austria and has been implemented throughout various European countries and many other countries around the world, including the U.S. The U.S. issued a request for experimentation on this particular device in 2005 at highway-rail grade crossings in Boise, Idaho (MUTCD, 2005). This particular track also provides an optional

28
safety feature in which LED warning lights are molded into the edge of the beam, which runs parallel to the track on both sides of the crossing. These LED lights, as shown in Figure 2-29, alert approaching vehicles that there is a track ahead. This particular countermeasure promotes correct path continuation for safer conditions on the road. This crossing system without LED lights has been estimated to be significantly more expensive than the cost of other crossing systems, in some cases twice as much. There are some stipulations with this countermeasure, as it requires the railroad company to install and maintain the LED lights.
Figure 2-29: BODAN Level Crossing System at Night.
Pavement Gate Markings and Side Gore Striping Pavement gate markings are a concept that was created by CUTR and require an experimentation request before it can be used. These markings incorporate the red and white reflective striping found on the railroad crossing gates and places it along the side of the road perpendicular to the railroad tracks. As shown in Figure 2-30, this low-cost countermeasure would be easy to implement and would require cooperation from transportation and railroad agencies to put this system into place. This measure would prevent incorrect turns similar to the side markings on a highway by providing separation between moving traffic and the railroad tracks. It also indicates that passing is prohibited and warns the driver from making an incorrect maneuver onto the railroad tracks. Another benefit is that the pavement gate markings can be used to alert users to conditions up ahead causing drivers to slow down and take precaution. A side gore striping (clear zone outside the edge of travel ways) in the vicinity of crossings, similar to the concept of pavement gate marking, is also proposed and illustrated in Figure 2-31.

29
Figure 2-30: Proposed Pavement Gate Marking.
Figure 2-31: Proposed Side Gore Striping.
Dynamic Envelope Pavement Markings A train dynamic envelope is designated as an area extending on both sides of the track for an undimensioned distance and has vertical white pavement markings that are parallel to the track. Figure 2-32 shows the striping extending across the roadway at the edges of the dynamic envelope. The markings are optional and should be 4 inches in width, and the distance between the rail and the dynamic envelope pavement marking should be 6 ft unless otherwise advised by the operating railroad or light rail transit agency.
This particular countermeasure is being pilot tested in FDOT District 4’s Commercial Blvd CSX railroad crossing in Fort Lauderdale and has been chosen as a safety test site for enhanced pavement markings. A bright yellow dynamic envelope outlined by white hash marks has been painted with a high friction surface on the pavement at the crossing. The Commercial Blvd crossing was chosen based on its high vehicle-train crash rate. At this crossing, the envelope covers the entire 150-ft width of roadway and 34-ft depth from the

30
east side of the double tracks to the west side. The goal of this countermeasure is to reduce crashes by preventing drivers from stopping in the painted clear zone.
Figure 2-32: Dynamic Envelope Pavement Markings.
Downstream Downstream treatments are oriented to promote path continuation across the railroad crossing. Guide signs with navigation information such as street names, interstate signs, or warning devices are typically used.
Pavement Markings Similar to the upstream treatment, pavement markings promote the correct path for drivers. As drivers approach the critical zone, they are able to see the downstream route and will follow according to the layout.
Striping Both the U.S. and European types of ground striping are good downstream countermeasures, as described previously.
Delineation Devices Delineation devices such as reflectors and raised pavement markers can also be used as downstream countermeasures. Delineation at this point reinforces that drivers are following along the correct path, making them feel more comfortable on the road.

31
Guide Signs Well-lit guide signs can also help drivers focus their attention on the destination lane and can reduce hesitation in the critical zone. Guide signs may include interstate signs or street name signs.
Discussion Based on the literature review and history of reported incidents of incorrect turns on railroad crossings, these crashes tend to occur at night. For this reason, the majority of the countermeasures listed in this section include increasing railroad crossing conspicuity through delineation and illumination. Several countermeasures can be applied to a single site to achieve the objective of minimizing the potential for incorrect left turns. For example, Figure 2-33 presents a site with a curve that is not delineated and may cause drivers to end up on the rail track or to crash into the gate. By providing illumination, delineation, and median/side barriers, the conspicuity of the crossing is increased. Another example is presented in Figure 2-34, where speed reduction, side barriers, and pavement striping can be used to enhance the railroad crossing, especially in dark conditions.
Figure 2-33: Example of Application of Treatments for a Site with a Curve to Prevent Incorrect Turns.
Figure 2-34: Example of Application of Multiple Treatments to Prevent Incorrect Turns.

32
Chapter 3 Historical Data Analysis and Contributing Causes for Incorrect Turns onto Railroad Tracks
This chapter compiles and analyzes FRA and FDOT crash data as well as reported incidents in Florida to assess the potential contributing causes for vehicles to make incorrect turns onto railroad trucks. Nationwide crash data from FRA and statewide crash data from FDOT were analyzed to gain insight on the occurrence of incidents pertaining to incorrect turns of vehicles onto rail tracks. The time frame for the data analysis was from January 2010 to December 2011. FRA data contain incident reports from railroad agencies across the U.S.
It should be noted that events involving incorrect turns onto railroad track were not easily determined based on the existing fields in the FRA database. When a vehicle is removed from the rail tracks and no damage occurred at the crossing, the incident may not be reported to FRA. Also of note is that the FDOT database provides necessary crash information that is inclusive of both trains and cars in the same event.
Based on historical data analysis and field observations, 11 preliminary candidate sites for the pilot study were selected. Countermeasures for these preliminary candidate pilot sites are discussed in Chapter 4. Based on the historical data compilation and analysis as well as field observations of the 11 preliminary sites, the potential major contributing causes for incorrect turns onto rail tracks are presented at the end of this chapter.
Historical Data Compilation
The filtering process used to obtain a reduced data set of the crash records containing incorrect turns onto rail track is presented in Figure 3-1. The process started by taking all the crashes from the FRA and FDOT databases from 2010–2011 and selecting only those highway-rail grade crossings on public roads (63% of occurrences). To focus on the objective of this study, only crashes involving passenger vehicles, including automobiles, vans, and pick-up trucks, were selected. These crashes accounted for 31 percent of all reported crashes. Based on FRA database fields, an additional filtering criterion for “proximity to intersection” was added. With the intersection proximity criterion, 20 percent of the crashes were selected for the next filtering stage.
An additional filter to select only crashes in urban areas was included. Urban areas present more intersection density and are likely to have cases for railroad crossings near intersections and more traffic activity. Using U.S. Census spatial data, the FRA crashes were filtered by location, and only those inside urban boundaries were selected.
The resulting dataset was the superset containing incorrect turn onto railroad track (ITRR) crashes. The ITRR superset contains crashes on highway-rail grade crossings involving passenger vehicles occurring in the proximity of traffic intersections in urban areas.

33
Figure 3-1: Data Filtering Process.
Historical Data Analysis
From the ITRR superset, the data were broken down based on injury levels, crash time of day, and weather conditions. Figure 3-2 presents the results of this categorization. It can be observed that 30 percent of the crashes in the ITRR superset included fatalities and 21 percent included injuries.
The distribution of the crashes based on time of day showed that 71 percent of incidents occurred during the day, 26 percent occurred at dark, and 3 percent occurred either at dusk or dawn. With respect to weather conditions, the ITRR superset in 79 percent of the cases occurred on a clear day.
To increase the likelihood of finding crashes with vehicles turning incorrectly onto railroad track, additional filtering criteria were added to the ITRR superset. Keywords such as “stuck” and “turn” were included in the filtering criteria to narrow the search. The main assumption for this search was that railroad crossings on public roads are designed to allow safe passing for standard passenger vehicles. It is not likely that vehicles get stuck on tracks unless they veered off the road and drove onto the rail tracks. The term “turn” was included to find crashes in which it was explicitly mentioned that vehicles were turning mistakenly onto rail tracks. Turning onto the railroad tracks is not a listed cause on the FRA or FDOT crash forms or databases. As a result incident reports for this type of crash is described in the narrative and a standard search query can not be used.

34
Figure 3-2: Correlation between Time of Day, Weather, and Occurring Incidents.
Selection of Preliminary Candidate Pilot Sites for Study
To get a better visual on the data analysis, the database sets attained from FRA and FDOT were entered into ArcGIS. This provided a better pictorial view of exactly where the problematic areas were so that the data collection sites could be chosen. Figure 3-3 shows that most of the locations with occurring incidents were mainly in the areas of Broward, Miami-Dade, Hillsborough, Orange, Duval, and Palm Beach counties.
Based on the number of recent train-vehicle crashes, reported incidents due to incorrect turns, geometric characteristics, and engineering assessments of the sites, 11 preliminary candidate pilot sites, as shown in Table 3-1, were selected for observational studies, site investigations, and potential countermeasure developments to reduce incorrect turns onto railroad tracks. The purpose of this initial evaluation of 11 selected sites was to serve as incident investigation/verification and potential countermeasure assessment at each site to help finalize the candidate pilot sites for the detailed baseline data collection.

35
Figure 3-3: Distribution of All Incorrect Turning Incidents in Florida.
Table 3-1: Eleven Preliminary Candidate Pilot Sites
SITE NO.
LOCATION LATITUDE LONGITUDE TOWN/CITYCROSSING
NO.SAFETY INDEX
1 West Hallandale Beach Blvd @ SW 30th Ave 25.98492 -80.16672 PEMBROKE PARK 628290Y 182 W Commercial Blvd @ I-95 26.18831 -80.15285 OAKLAND PARK 628186E 23 Forest Hill Blvd @ I-95 26.6552 -80.07078 LAKE CLARKE SHORE 628139W 334 Tampa Road @ State St. W 28.03853 -82.66285 OLDSMAR 626845A 3965 W Pembroke Road @ I-95 25.99607 -80.16734 HOLLYWOOD 628282G 206 Hollywood Blvd @ I-95 26.01088 -80.16758 HOLLYWOOD 628281A 327 W Sample Road @ NW 8th Ave 26.27487 -80.13437 POMPANO BEACH 628168G 48 Washington Ave @ North Gertrude Ave 28.5438 -81.38083 ORLANDO 622188X 13219 Magnolia Ave @ North Orange Ave 28.559 -81.37692 ORLANDO 622178S 1308
10 Intl Speedway Blvd @ South Charles St 29.20985 -81.02519 DAYTONA BEACH 271938J 35511 Miner Road @ US 1 26.55751 -80.05496 HYPOLUXO 272475S 304

36
The results of the investigation of available train-vehicle crashes from 2010–2011 and reported incidents of vehicles stuck on railroad tracks from May 2012–January 2013 due to incorrect turns are summarized in Table 3-2. For these 11 candidate pilot sites in Florida, it can be observed from Table 3-2 that 67 percent of crashes and incidents occurred at night. Darkness and low visibility seem to contribute significantly to these crashes and incidents because of incorrect turns onto railroad tracks.
Table 3-2: Summary of Train-Vehicle Crashes and Reported Incidents for Selected 11 Candidate Pilot Sites
Potential Contributing Causes for Incorrect Turns onto Railroad Tracks
It is a difficult task to determine the exact causes for incorrect turns onto railroad tracks because of lack of explanation of the causes in the rail-vehicle crash reports and incident reports for stuck vehicles. To understand the potential major contributing causes for the incorrect turns onto railroad tracks, the research team closely examined the following items:
• Potential causes of incorrect turns at highway-rail grade crossings obtained from literature review
• Crash data analysis from FRA and FDOT databases related to incorrect turns onto railroad tracks
• Review of Internet news and articles related to train-vehicle crashes • Review of inventory of roadway features (exclusive turn lanes, signage, proximity to
intersection, volume, illumination levels, curve radius, etc.) for selected 11 candidate pilot locations
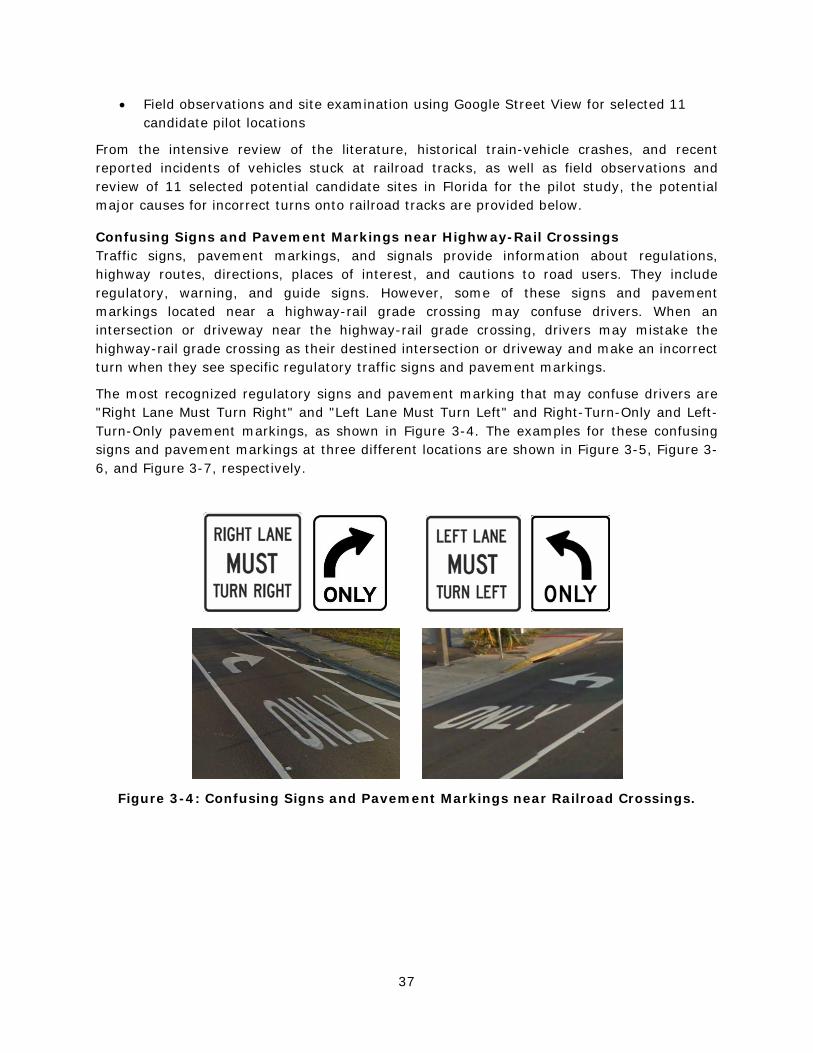
37
• Field observations and site examination using Google Street View for selected 11 candidate pilot locations
From the intensive review of the literature, historical train-vehicle crashes, and recent reported incidents of vehicles stuck at railroad tracks, as well as field observations and review of 11 selected potential candidate sites in Florida for the pilot study, the potential major causes for incorrect turns onto railroad tracks are provided below.
Confusing Signs and Pavement Markings near Highway-Rail Crossings Traffic signs, pavement markings, and signals provide information about regulations, highway routes, directions, places of interest, and cautions to road users. They include regulatory, warning, and guide signs. However, some of these signs and pavement markings located near a highway-rail grade crossing may confuse drivers. When an intersection or driveway near the highway-rail grade crossing, drivers may mistake the highway-rail grade crossing as their destined intersection or driveway and make an incorrect turn when they see specific regulatory traffic signs and pavement markings.
The most recognized regulatory signs and pavement marking that may confuse drivers are "Right Lane Must Turn Right" and "Left Lane Must Turn Left" and Right-Turn-Only and Left-Turn-Only pavement markings, as shown in Figure 3-4. The examples for these confusing signs and pavement markings at three different locations are shown in Figure 3-5, Figure 3-6, and Figure 3-7, respectively.
Figure 3-4: Confusing Signs and Pavement Markings near Railroad Crossings.

38
Figure 3-5: Confusing Right-Turn Sign and Pavement Marking on Commercial Blvd in Oakland Park, Florida.
Figure 3-6: Confusing Left- and Right-Turn Pavement Markings on Magnolia Ave in Orlando, Florida.

39
Figure 3-7: Confusing Right-Turn Pavement Marking on Hollywood Blvd in Hollywood, Florida.
Darkness and Low Visibility To ensure adequate street light illumination levels for different road classifications, FDOT’s Plans Preparation Manual establishes a standard average illumination level, as shown in Table 3-3. The average illumination level of 1.5 footcandles (fc) is required for interstate highways, expressways, and major arterials. The manual also requires a 4:1 or lower uniformity ratio average/minimum and 10:1 or lower uniformity ratio maximum/minimum. For all other roadways, it requires 1.0 fc as the standard average illumination level and requires 2.5 fc as the standard average illumination level for pedestrian walkways and bicycle lanes, with the same uniformity ratio mentioned above.
Table 3-3: FDOT Conventional Roadway Lighting Requirements
Road Classification Illumination Level
Average Initial Horizontal Foot Candle (HFC)
Uniformity Ratios
Avg/ Min Max/Min
Interstates, expressways, freeways, and major arterials 1.5 4:1 or less 10:1 or less
All other roadways 1.0 4:1 or less 10:1 or less Pedestrian ways and bicycle lanes 2.5 4:1 or less 10:1 or less

40
Darkness and low visibility near or at railroad crossing may result from lack of street lighting, incompliance of street light illumination with an established standard, and/or adverse weather conditions such as foggy, smoky, and heavy rain situations. Darkness and low visibility can cause drivers to make incorrect turns because some drivers are unable to clearly recognize the railroad crossings, especially if they are not familiar with their surroundings. Drivers may mistake the railroad crossing as their destined nearby intersections, driveways or ramps, and make incorrect turns. Examples of two locations with darkness or low visibility are shown in Figure 3-8 and Figure 3-9, respectively.
Figure 3-8: Darkness of Railroad Crossing on Commercial Blvd in Oakland Park, Florida near I-95.
Figure 3-9: Darkness of the Railroad Crossing on Washington Ave in Orlando, Florida near I-4.

41
As shown in Table 3-2, there is a very high frequency of highway-rail crashes and stuck vehicle incidents at night and in low-visibility conditions at dusk and dawn. Analysis of historical FRA crash data and FDOT crash and incident reports as well as field observations strongly supports providing adequate lighting illumination levels near and at railroad crossings so drivers can easily recognize the railroad crossings at night or in low-visibility conditions. Street light illumination measurements at railroad crossings are important to verify compliance with the required illumination levels and to enhance the visibility of roadway users.
Following Turn Instructions from a GPS Device onto Railroad Tracks A Global Positioning System (GPS) based navigator is a very common and useful tool to assisting driving from an origin to a destination. Once a driver enters in a destination, the system will plot a route, give spoken turn-by-turn directions, and show the driver’s progress along the route. Although there are many advantages of GPS, it was also blamed in many reports for sending drivers into harm’s way by making incorrect turns. From the review of numerous Internet and newspaper articles, it was found that many drivers blamed their GPS for turning onto railroad tracks.
Following are titles of selected articles from the Internet that blame GPS for incorrect turns onto railroad tracks:
• “Driver blames GPS for putting her on train tracks; She and her kids get out before train hits,” 6/19/2013, universalhub.com
• “Can you blame your GPS?,” 8/7/2012, car insurance.com • “GPS at fault? Trains strikes car after driver turns on track,” 9/29/11, railroad.net • “Trains hits car, and a G.P.S. is blamed,” 9/30/2008, The New York Times • “Driver blames GPS for driving on railroad tracks, getting hit by train,” 1/4/2008,
techdirt.com The examples of GPS navigators showing right-turn and left-turn turning indications are shown in Figure 3-10.
Figure 3-10: Examples of GPS Navigators Showing Turning Indications.

42
Skewed Highway-Rail Grade Crossings When roadways and railroad crossings intersect at skewed angles, the intersections and crossings may experience many potential problems. For example, drivers may have more difficulty aligning their vehicles as they enter the cross-street to make a right or left turn. The larger intersection and railroad crossing areas may confuse drivers or cause them to deviate from the intended path. It becomes more confusing at dark or in low-visibility conditions. Faded longitudinal line pavement markings can also cause confusion for drivers. Three examples of skewed highway-rail grade crossings are shown in Figure 3-11, Figure 3-12, and Figure 3-13, respectively.
Figure 3-11: Skewed Highway-Rail Crossing on Tampa Rd Adjacent to State St in Oldsmar, Florida.
Figure 3-12: Skewed Highway-Rail Crossing on N Andrews Ave Adjacent to NW 7th St in Fort Lauderdale, Florida.

43
Figure 3-13: Skewed Highway-Rail Crossing on NE 3rd Ave Adjacent to Progresso Dr in Fort Lauderdale, Florida.
Driver Distraction According to the National Highway Traffic Safety Administration (NHTSA), distraction is anything that diverts a driver’s attention from the primary tasks of navigating a vehicle and responding to critical events. To put it another way, a distraction is anything that takes a driver’s eyes off the road (visual distraction), his or her mind off the road (cognitive distraction), or his or her hands off the wheel (manual distraction). From the literature review, driver distractions have been cited as one of the major contributing factors for various types of crashes. When the highway-rail crossing is very close to a driver's destined intersection, driver distraction can also contribute to incorrect turns onto railroad tracks.

44
Chapter 4 Development of Countermeasures for Preliminary Candidate Pilot Sites
The major objectives of this Phase I project included the determination of the final candidate pilot sites and development of effective countermeasures to prevent incorrect turns onto railroad tracks for the final candidate pilot sites. These final candidates will be chosen from the 11 preliminary candidate sites. This chapter focuses on the development of countermeasures for each preliminary site based on its unique geometric characteristics, existing traffic control devices, inventory of roadway features, proximity to the nearby intersection, analysis of train-vehicle crashes and stuck vehicle incidents due to incorrect turns, and field observations.
For each candidate site, a set of potential countermeasures was carefully reviewed and selected from the pool of countermeasures, which were obtained and presented in Chapter 2, Literature Review. In this chapter, the aerial view, street views, and location maps for each site are presented first, followed by the recommended countermeasures to prevent incorrect turns onto railroad tracks. The result from this chapter will be used for the selection for final candidate pilot sites and associated detailed baseline data collection in the field. These 11 preliminary candidate sites are as follows:
• Site 1: W Hallandale Beach Blvd and SW 30th Ave, Pembroke Park • Site 2: W Commercial Blvd near I-95, Oakland Park • Site 3: Forest Hills Blvd near I-95, Lake Clarke Shore • Site 4: Tampa Rd and State St W, Oldsmar • Site 5: W Pembroke Rd near I-95, Hollywood • Site 6: Hollywood Blvd near I-95, Hollywood • Site 7: W Sample Rd near I-95, Pompano Beach • Site 8: Washington Ave and Orange Ave, Orlando • Site 9: Magnolia Ave and N Orange Ave, Orlando • Site 10: International Speedway Blvd and South Charles St, Daytona Beach • Site 11: Miner Rd and S Federal Hwy, Hypoluxo
Site 1: W Hallandale Beach Blvd and SW 30th Ave, Pembroke Park
The aerial, street views, and map of the site at Hallandale Beach Blvd and SW 30th Ave at Pembroke Park are shown in Figure 4-1. This site had several crashes in the years 2010 and 2011. There were three crashes (two day, one night). There was one truck vehicle incident that occurred during daylight hours between May 2012 and January 2013.
This location has predominant features such as railroad crossing pavement markings, guide signs, ramp-only pavement markings, and four-quadrant gates. For this location, several treatments were chosen, as can be seen in Figure 4-2. The suggested potential upstream treatments are striping and advanced direction signs. Potential critical zone treatments are side and median barriers, striping, dynamic envelope pavement marking, and pavement gate markings. The downstream treatments consist of guide signs and striping.

45
Figure 4-1: Aerial, Street Views, and Map of Site at Hallandale Beach Blvd.
Figure 4-2: Possible Countermeasures for Site at Pembroke Park.

46
Site 2: W Commercial Blvd near I-95, Oakland Park
The aerial, street views, and map of the site at W Commercial Blvd near I-95 at Oakland Park are shown in Figure 4-3. This site had several crashes occurred between the years 2010 and 2011. There were four crashes, all at night. There was one truck vehicle incident that occurred during daylight hours between May 2012 and January 2013. There were more incorrect turns onto railroad track at night than those during the day for this site.
Current railroad features in this area include railroad crossing pavement markings, turning signs, guide signs, and four-quadrant gates. For the upstream treatments at this site, striping and advanced directional signs are proposed. At the critical zone side and median barriers, striping or dynamic envelope pavement markings, and pavement gate markings seem to be the most beneficial countermeasures. The downstream treatments consist of pavement markings for the I-95. These possible recommended treatments are shown in Figure 4-4.
Figure 4-3: Aerial, Street Views, and Map of Site at Commercial Blvd.
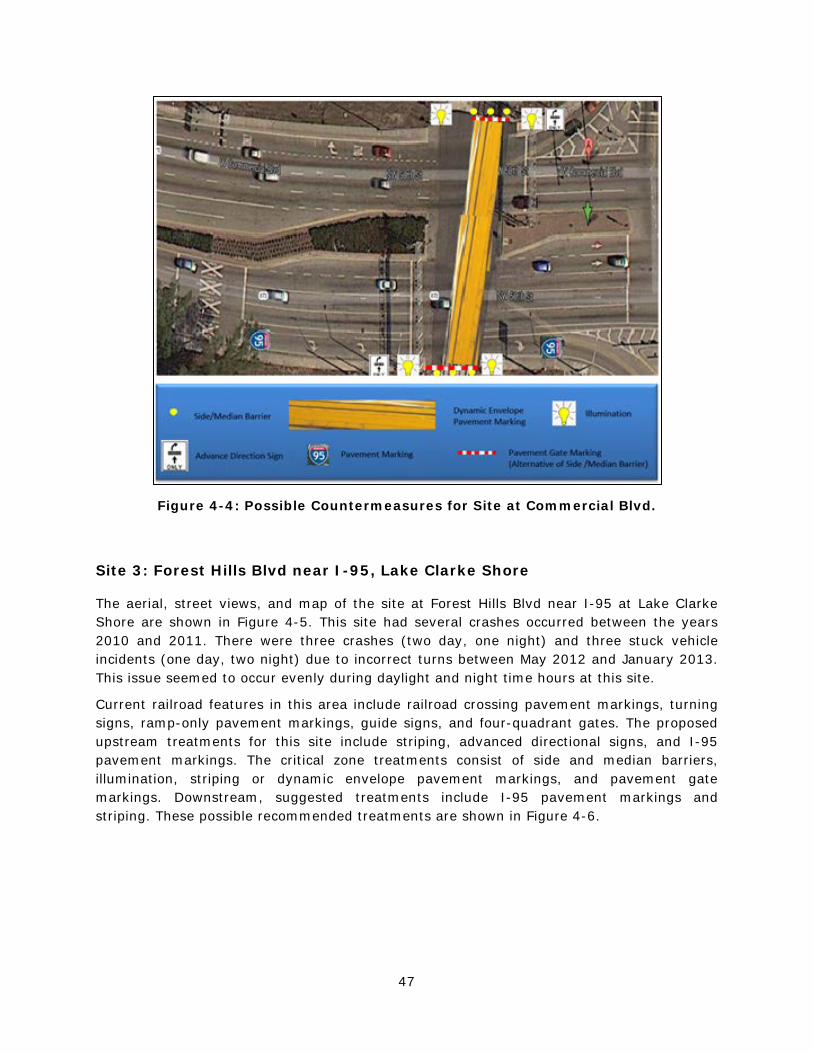
47
Figure 4-4: Possible Countermeasures for Site at Commercial Blvd.
Site 3: Forest Hills Blvd near I-95, Lake Clarke Shore
The aerial, street views, and map of the site at Forest Hills Blvd near I-95 at Lake Clarke Shore are shown in Figure 4-5. This site had several crashes occurred between the years 2010 and 2011. There were three crashes (two day, one night) and three stuck vehicle incidents (one day, two night) due to incorrect turns between May 2012 and January 2013. This issue seemed to occur evenly during daylight and night time hours at this site.
Current railroad features in this area include railroad crossing pavement markings, turning signs, ramp-only pavement markings, guide signs, and four-quadrant gates. The proposed upstream treatments for this site include striping, advanced directional signs, and I-95 pavement markings. The critical zone treatments consist of side and median barriers, illumination, striping or dynamic envelope pavement markings, and pavement gate markings. Downstream, suggested treatments include I-95 pavement markings and striping. These possible recommended treatments are shown in Figure 4-6.

48
Figure 4-5: Aerial, Street Views, and Map of Site at Forest Hills Blvd.
Figure 4-6: Possible Countermeasures for Site at Forest Hills Blvd.
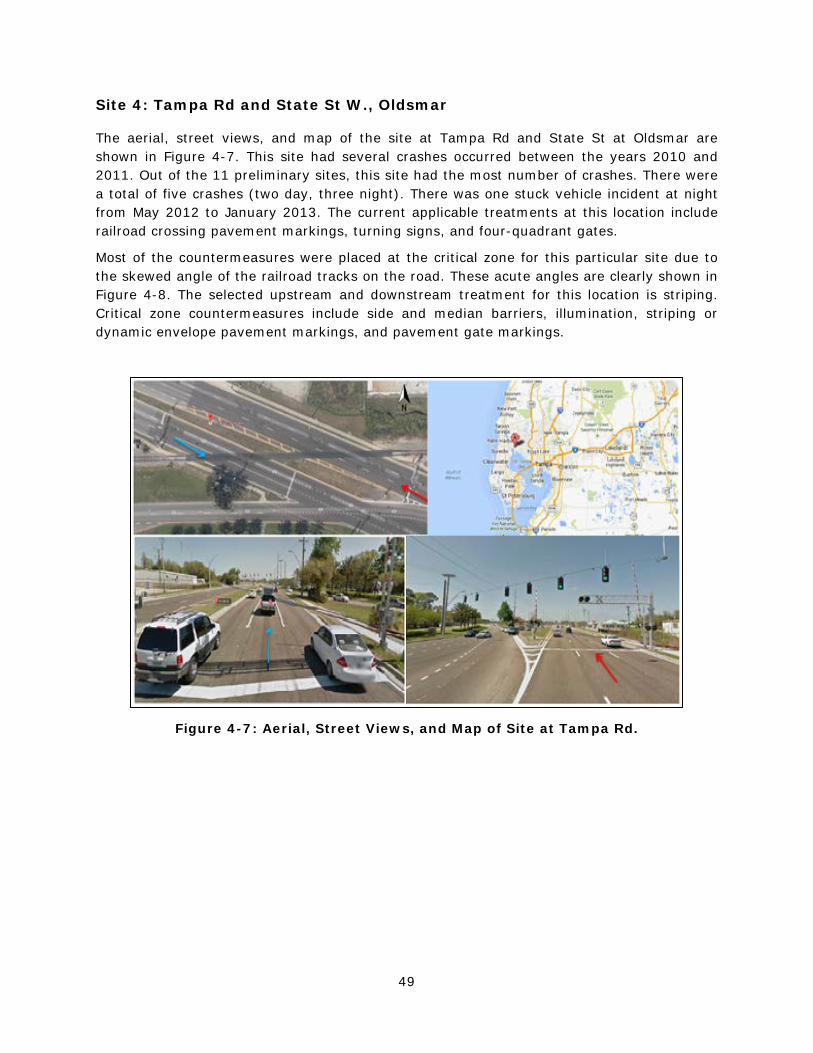
49
Site 4: Tampa Rd and State St W., Oldsmar
The aerial, street views, and map of the site at Tampa Rd and State St at Oldsmar are shown in Figure 4-7. This site had several crashes occurred between the years 2010 and 2011. Out of the 11 preliminary sites, this site had the most number of crashes. There were a total of five crashes (two day, three night). There was one stuck vehicle incident at night from May 2012 to January 2013. The current applicable treatments at this location include railroad crossing pavement markings, turning signs, and four-quadrant gates.
Most of the countermeasures were placed at the critical zone for this particular site due to the skewed angle of the railroad tracks on the road. These acute angles are clearly shown in Figure 4-8. The selected upstream and downstream treatment for this location is striping. Critical zone countermeasures include side and median barriers, illumination, striping or dynamic envelope pavement markings, and pavement gate markings.
Figure 4-7: Aerial, Street Views, and Map of Site at Tampa Rd.

50
0p
Figure 4-8: Possible Countermeasures for Site at Tampa Rd.
Site 5: W. Pembroke Rd near I-95, Hollywood
The aerial, street views, and map of the site at Pembroke Rd near I-95 at Hollywood are shown in Figure 4-9. The site had a significant amount of train-vehicle crashes and stuck vehicle incidents due to incorrect turns. The location is extremely close to the I-95 ramp, which, as shown in several locations before, seems to be a very problematic. Between the years of 2010 to 2011 there were three crashes (two day, one night). There were also three incidents where drivers incorrectly turned onto the rail tracks all occurring at night.
Several treatments are proposed for upstream countermeasures, including striping and advance direction signage. Downstream, typical use of pavement markings and striping are also proposed. In the critical zone area, proposed countermeasures comprise side and median barriers, illumination, striping or dynamic envelope pavement markings, and pavement gate markings. The critical zone in this area is very important due to the number of stuck vehicle incidents that occurred at night. Adequate illumination is especially critical to prevent incorrect turns during night time hours. The recommended treatments for this site are shown in Figure 4-10.

51
Figure 4-9: Aerial, Street Views, and Map of Site at Pembroke Rd.
Figure 4-10: Possible Countermeasures for Site at Pembroke Rd.

52
Site 6: Hollywood Blvd near I-95, Hollywood
The aerial, street views, and map of the site at Hollywood Blvd near I-95 at Hollywood are shown in Figure 4-11. Similar to the other preliminary candidate site in Hollywood, there were a significant amount of train-vehicle crashes and stuck vehicle incidents due to incorrect turns at this location. The same problem seems to be recurring in both locations in Hollywood. At this site, there were six incidents related to drivers incorrectly turning onto the railroad tracks. There were three crashes (two day, one night) between 2010 and 2011. There were also three stuck vehicle incidents where drivers incorrectly turned onto the rail tracks all occurring at night.
The treatments at this location are very similar to the treatments suggested at the Pembroke Rd site. The upstream countermeasures include striping and advance direction signage. For downstream treatments, pavement markings and striping are suggested. The critical zone area countermeasures consist of side and median barriers, illumination, striping or dynamic envelope pavement markings, and pavement gate markings. The recommended treatments for this site are shown in Figure 4-12.
Figure 4-11: Aerial, Street Views, and Map of Site at Hollywood Blvd.

53
Figure 4-12: Possible Countermeasures for Site at Hollywood Blvd.
Site 7: W Sample Rd near I-95, Pompano Beach
The aerial, street views, and map of the site at W. Sample Rd near I-95 at Pompano Beach are shown in Figure 4-13. This site had the most stuck vehicle incidents of any other site. From 2010 to 2011, there were three rail-vehicle crashes (two day, one night). From May 2012 to January 2013, there were four stuck vehicle incidents (one day, three night), all related to drivers incorrectly turning onto the tracks. There were more incorrect turns onto railroad tracks at night than those during the day for this site.
Current features include railroad crossing pavement markings, turning signs, and four- quadrant gates. The countermeasures recommended for upstream include striping and advance direction signage. The downstream treatments are guide signs and striping. For the critical zone, treatments such as side and median barriers, illumination, striping or dynamic envelope pavement markings, and pavement gate markings were chosen based on the needs of the location. Illumination is a major feature due to the number of crashes and incidents that have taken place at night. Side and median barriers will also be helpful during the night time hours with a reflective paint. Figure 4-14 gives an overview of the recommended countermeasures.

54
Figure 4-13: Aerial, Street Views, and Map of Site at Sample Rd.
Figure 4-14: Possible Countermeasures for Site at Sample Rd.

55
Site 8: Washington Ave and Orange Ave, Orlando
The aerial, street views, and map of the site at Washington and Orange Ave at Orlando are shown in Figure 4-15. From 2010 to 2011, there were three rail-vehicle crashes (one day, two night). From May 2012 to January 2013, there were three stuck vehicle incidents (all at night), all related to drivers incorrectly turning onto the railroad tracks at nights. In total, 83 percent of incorrect turns onto railroad tracks occurred during night time hours at this site.
The current existing features are standard to most intersections, including railroad crossing pavement markings and four-quadrant gates. As shown in Figure 4-15, this intersection has a completely different geometry from the rest of the locations. A building prevents the driver from seeing the railroad tracks clearly and can also cause some miscalculation in the right-turn maneuver.
Upstream treatments for this intersection include striping and advance direction signage. The critical zone needs to be defined to bring awareness to this area. The critical zone treatments include side and median barriers, illumination, striping or dynamic envelope pavement markings, and pavement gate markings. Downstream suggested treatments consist of guide signs. The recommended treatments for this site are shown in Figure 4-16.
Figure 4-15: Aerial, Street Views, and Map of Site at Washington Ave.

56
Figure 4-16: Possible Countermeasures for Site at Washington Ave.
Site 9: Magnolia Ave and N Orange Ave, Orlando
The aerial, street views, and map of the site at Washington and Orange Ave at Orlando are shown in Figure 4-17. This second site in Orlando is a one-way, four-lane street with two turn lanes. The existing features on this site are railroad crossing pavement markings, four-quadrant gates, and guide signs. There were several previous rail-vehicle crashes and stuck vehicle incidents at this location that resulted in the selection of this site for study by FDOT.
The countermeasure treatments proposed include striping and advance direction signs upstream of the railroad tracks. Side and median barriers, illumination, striping or dynamic envelope pavement markings, and pavement gate markings could be placed in the critical zone. The critical zone treatments were chosen due to the number of incidents that occur mainly at night. The downstream treatments consist of guide signs and striping. All of these countermeasures are shown in Figure 4-18.

57
Figure 4-17: Aerial, Street Views, and Map of Site at Magnolia Ave.
Figure 4-18: Possible Countermeasures for Site at Magnolia Ave.
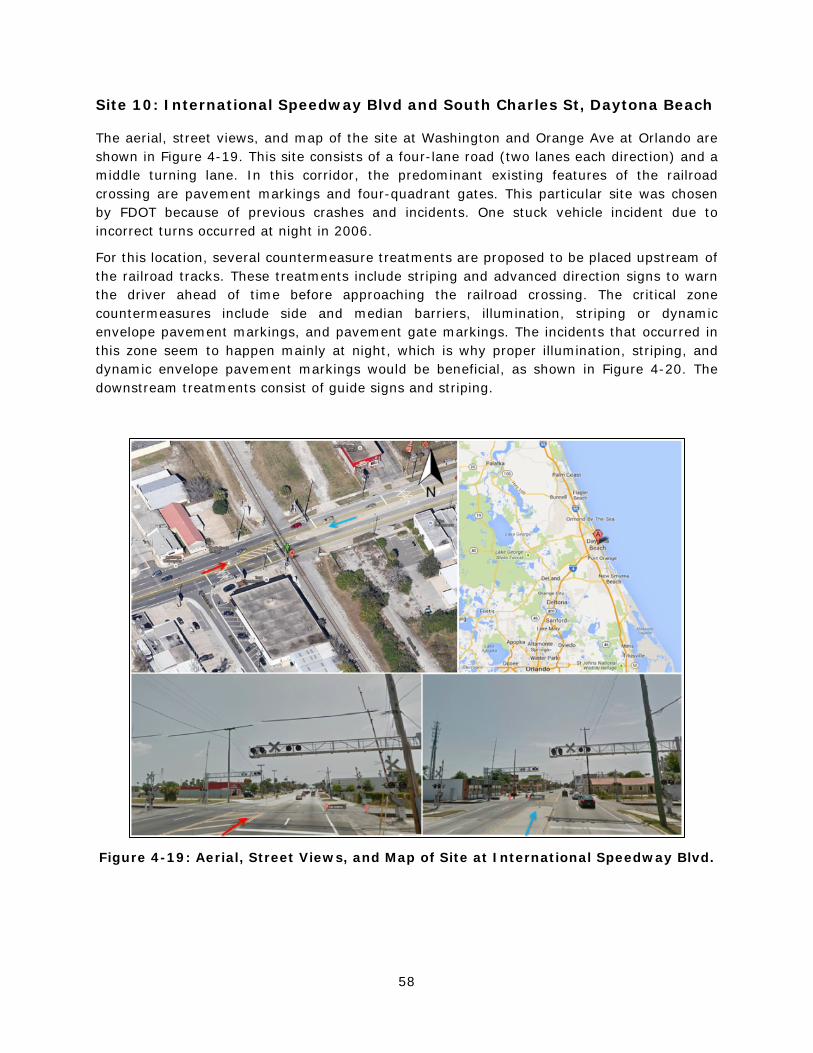
58
Site 10: International Speedway Blvd and South Charles St, Daytona Beach
The aerial, street views, and map of the site at Washington and Orange Ave at Orlando are shown in Figure 4-19. This site consists of a four-lane road (two lanes each direction) and a middle turning lane. In this corridor, the predominant existing features of the railroad crossing are pavement markings and four-quadrant gates. This particular site was chosen by FDOT because of previous crashes and incidents. One stuck vehicle incident due to incorrect turns occurred at night in 2006.
For this location, several countermeasure treatments are proposed to be placed upstream of the railroad tracks. These treatments include striping and advanced direction signs to warn the driver ahead of time before approaching the railroad crossing. The critical zone countermeasures include side and median barriers, illumination, striping or dynamic envelope pavement markings, and pavement gate markings. The incidents that occurred in this zone seem to happen mainly at night, which is why proper illumination, striping, and dynamic envelope pavement markings would be beneficial, as shown in Figure 4-20. The downstream treatments consist of guide signs and striping.
Figure 4-19: Aerial, Street Views, and Map of Site at International Speedway Blvd.

59
Figure 4-20: Possible Countermeasures for Site at International Speedway Blvd.
Site 11: Miner Rd and S Federal Hwy, Hypoluxo
The aerial, street views, and map of the site at Washington and Orange Ave at Orlando are shown in Figure 4-21. The Minor Rd and S Federal Hwy site at Hypoluxo is a T-intersection that has predominant features such as railroad crossing pavement markings and four-quadrant gates. This site was chosen by FDOT because of previous rail-vehicle crashes and stuck vehicle incidents due to incorrect turns.
For this location, several treatments are proposed for upstream and downstream and the critical zone. Within the upstream segment, striping along with advance direction signs would be extremely useful and would reinforce to drivers that there is a railroad crossing ahead and they need to pass that first before making any maneuvers. The critical zone has several features applied to it, including side and median barriers, illumination, striping or dynamic envelope pavement markings, and pavement gate markings. The downstream treatments consist of guide signs and striping. For this site, proper illumination, striping and dynamic envelope pavement markings would be helpful. Figure 4-22 gives an overview of the proposed countermeasures.

60
Figure 4-21: Aerial, Street Views, and Map of Site at Miner Rd.
Figure 4-22: Possible Countermeasures for Site at Miner Rd.

61
Chapter 5 Baseline Data Collection and Analysis for Final Candidate Sites for Pilot Study
This chapter covers the selection of 5 final candidate sites for the pilot study from a list of 11 preliminary sites, determination of baseline data collection, development of methodology for data collection, data collection process, analysis of baseline speed data, and determination of suspected driver hesitation rates for each of final candidate sites. The suspected driver hesitation rates will serve as the baseline before the implementation of proposed countermeasures in Phase II project. The driver hesitation rates after the implementation of the proposed countermeasures will be compared with baseline rates through the Phase II project to determine the effectiveness of implemented countermeasures to prevent incorrect turns at highway-rail grade crossings.
Selection of Final Candidate Sites for Pilot Study
Five final candidate sites for the pilot study were selected, as shown in Table 5-1 and Figure 5-1. They were selected based on several major considerations. All five sites had at least one train-vehicle crash or stuck vehicle incident caused by a driver incorrectly turning onto the railroad tracks. All had a high-enough traffic volume to produce a sufficient sample size for the driver confusion / hesitation analysis.
Diversity in running environments was also important. Geographic diversity was ensured with three sites located in South Florida, one in Central Florida, and one in North Florida. Diversity in the prime contributing factors was also considered, with four of five located in close proximity to a major intersection and one located at a skewed crossing.
Also, three of the five crossings are located on railroads owned by FDOT. This will provide more latitude in deploying pilot corrective measures at the crossings. These two FDOT-owned railroads carry passenger trains and, thus, it is of heighted importance to prevent these types of incidents from occurring.
Table 5-1: Final Candidate Sites for Pilot Study
Site No. Location Railroad Lat Lon Town/
City Crossing
No. 2013 Index
2 W Commercial Blvd @ I-95 CSX 26.18831 -80.15285 Oakland
Park 628186E 2
9 SR 527 / N Magnolia Ave @ Orange Ave CSX 28.55900 -81.37692 Orlando 622178S 1308
10 US 92 / Intl Speedway Blvd @ South Charles St
FEC 29.20985 -81.02519 Daytona Beach 271938J 355
11 Miner Rd @ US 1 FEC 26.55751 -80.05496 Hypoluxo 272475S 304
12 W Hallandale Beach Blvd @ SW 30th CSX 25.98492 -80.16672 Pembroke
Park 628290Y 18

62
Figure 5-1: Location of Five Selected Final Candidate Sites for Pilot Study.

63
Baseline Data Collection Schedule
An observational survey was conducted at each of five sites to get a thorough understanding of existing conditions before recommended treatments are implemented. Data such as speed and lighting illumination level were collected and analyzed to determine the baseline condition. The data collection was conducted from Saturday, October 5, through Wednesday, October 9. For each of the five sites, the data were collected for two time periods, with a total of eight hours. The first period was between 10:00 AM and 2:00 PM and the second period was between 7:00 and 11 PM. The two periods were chosen to be far outside the peak periods, and the second period of data collection was needed because many crashes and incidents happen during night time. Another reason for collecting data during off-peak hours was that when there is a steady stream of vehicles and high volume, drivers do not make mistakes by turning onto the tracks. This usually happens during off-peak hours and at night when it is dark.
Process and Methodology for Speed Data Collection
The speed data collected were primarily the spot speed of vehicles at a specific location downstream of the railroad tracks. This was achieved using a portable Wavetronix SmartSensor that was attached on a telescopic mast. Also, using a probe vehicle, the lowest and highest speed for turning into the tracks was established. This range was used as a relative measure of how slow a vehicle travels just before the railroad tracks and is able to potentially turn into the tracks. To identify the potential drivers that experience confusion and hesitation, the speed data were plotted in 30-minute increments. A driver that experiences potential hesitation is one who has a much lower speed than the previous vehicle and also has a significant headway from the previous vehicle.
An example is shown in Figure 5-2. The first vehicle is traveling at 30.2 MPH passing the sensor. The second vehicle passes the sensor 1 minute and 32 seconds after, with a speed of 9.1 MPH. The second vehicle is either experiencing hesitation or is simply traveling slowly. The red line shows the 15th percentile speed of the sample. This value was used to determine a low threshold. All vehicles experiencing hesitation are generally under this value. The research team recognized that this method is not 100 percent accurate, but the vehicles experiencing hesitation are potentially in this group. Care was taken that vehicles following a slower vehicle were not counted in the calculation.
Also another important consideration was that these vehicles were traveling at a speed that fell into the turning speed range measured earlier. Only slow-enough vehicles were considered, since a vehicle traveling at a high speed cannot turn onto the tracks even if it experiences hesitation.
In reviewing the video data collected with the speed data, it was noted that some vehicles were slowed down to pass the rail tracks at a lower speed. These vehicles obviously were not experiencing hesitation but were included in the calculation, as it was felt that this is not a major issue. Further analysis will determine if these vehicles should be removed from the calculation of the hesitation rate.

64
Figure 5-2: Example of Potential Vehicle Experiencing Hesitation.
Speed Data Analysis for Final Candidate Sites
Site 1: W Hallandale Beach Blvd & SW 30th St, Pembroke Park This rail crossing is on W Hallandale Beach Blvd in Pembroke Park. The posted speed limit is 35 MPH. The observed speed ranged from 2.0–41.0 MPH during the day and 1.3–40.1 MPH during the night. Figure 5-3 shows the speed profile during the day, and Figure 5-4 shows the speed profile during the night.
Site 2: W Commercial Blvd & I-95, Oakland Park This rail crossing is on W Commercial Blvd in Oakland Park. The posted speed limit is 45 MPH. The observed speed ranged from 0.8–44.9 MPH during the day and 0.8–46.5 MPH during the night. Figure 5-5 shows the speed profile during the day, and Figure 5-6 shows the speed profile during the night.
Site 9: Magnolia Ave & Orange N Ave, Orlando This rail crossing is on Magnolia Ave in Orlando. The posted speed limit is 30 MPH. The observed speed ranged from 2.7–47.9 MPH during the day and 6.8–48.5 MPH during the night. Figure 5-7 shows the speed profile during the day, and Figure 5-8 shows the speed profile during the night.
0
5
10
15
20
25
30
35
40
10:4
2:14
PM
10:4
3:41
PM
10:4
5:07
PM
10:4
6:34
PM
10:4
8:00
PM
10:4
9:26
PM
10:5
0:53
PM
10:5
2:19
PM
10:5
3:46
PM
10:5
5:12
PM
Spee
d (m
ph)
Time
Observed Speed
Vehicle potentially experiencing hesitation
Previous vehicle
9.1mph
30.2mph

65
Figure 5-3: Daytime Speed Profile for Pembroke Park Site (1).
Figure 5-4: Night Time Speed Profile for Pembroke Park Site (1).
05
1015202530354045
9:57
:36
AM
10:2
6:24
AM
10:5
5:12
AM
11:2
4:00
AM
11:5
2:48
AM
12:2
1:36
PM
12:5
0:24
PM
1:19
:12
PM
1:48
:00
PM
Spee
d (m
ph)
Time
Pembroke Park - Day
Observed Speed 15th Percentile Possible Hesitation
0
5
10
15
20
25
30
35
40
45
7:12
:00
PM
7:40
:48
PM
8:09
:36
PM
8:38
:24
PM
9:07
:12
PM
9:36
:00
PM
10:0
4:48
PM
10:3
3:36
PM
11:0
2:24
PM
11:3
1:12
PM
Spee
d (m
ph)
Time
Pembroke Park - Night
Observed Speed 15th Percentile Possible Hesitation

66
Figure 5-5: Daytime Speed Profile for Oakland Park Site (2).
Figure 5-6: Night Time Speed Profile for Oakland Park Site (2).
0
5
10
15
20
25
30
35
40
4511
:47:
02 A
M
12:1
5:50
PM
12:4
4:38
PM
1:13
:26
PM
1:42
:14
PM
2:11
:02
PM
2:39
:50
PM
3:08
:38
PM
3:37
:26
PM
Spee
d (m
ph)
Time
Oakland Park - Day
Observed Speed 15th Percentile Possible Hesitation
05
101520253035404550
6:53
:17
PM
7:22
:05
PM
7:50
:53
PM
8:19
:41
PM
8:48
:29
PM
9:17
:17
PM
9:46
:05
PM
10:1
4:53
PM
10:4
3:41
PM
Spee
d (m
ph)
Time
Oakland Park - Night
Observed Speed 15th Percentile Possible Hesitation

67
Figure 5-7: Daytime Speed Profile for Orlando Site (9).
Figure 5-8: Night Time Speed Profile for Orlando Site (9).
05
101520253035404550
9:36
:00
AM
10:0
4:48
AM
10:3
3:36
AM
11:0
2:24
AM
11:3
1:12
AM
12:0
0:00
PM
12:2
8:48
PM
12:5
7:36
PM
1:26
:24
PM
Spee
d (m
ph)
Time
Orlando - Day
Observed Speed 15th Percentile Speed Possible Hesitation
0
5
10
15
20
25
30
35
40
45
6:57
:36
PM
7:26
:24
PM
7:55
:12
PM
8:24
:00
PM
8:52
:48
PM
9:21
:36
PM
9:50
:24
PM
10:1
9:12
PM
10:4
8:00
PM
Spee
d (m
ph)
Time
Orlando - Night
Observed Speed 15th percentile Potential Hesitation

68
Site 10: International Speedway Blvd & South Charles St, Daytona Beach This rail crossing is on International Speedway Blvd in Daytona Beach. The posted speed limit is 35 MPH. The observed speed ranged from 6.5–60.9 MPH during the day and 5.6–50.6 MPH during the night. Figure 5-9 shows the speed profile during the day, and Figure 5-10 shows the speed profile during the night.
Figure 5-9: Daytime Speed Profile for Daytona Beach Site (10).
Figure 5-10: Night Time Speed Profile for Daytona Beach Site (10).
0
10
20
30
40
50
60
8:45
:36
AM
9:14
:24
AM
9:43
:12
AM
10:1
2:00
AM
10:4
0:48
AM
11:0
9:36
AM
11:3
8:24
AM
12:0
7:12
PM
12:3
6:00
PM
1:04
:48
PM
Spee
d (m
ph)
Time
Daytona Beach - Day
Observed Speed 15th Percentile Possible Hesitation
0
10
20
30
40
50
6:47
:31
PM
7:16
:19
PM
7:45
:07
PM
8:13
:55
PM
8:42
:43
PM
9:11
:31
PM
9:40
:19
PM
10:0
9:07
PM
10:3
7:55
PM
Spee
d (m
ph)
Time
Daytona Beach - Night
Observed Speed 15th Percentile Possible Hesitation

69
Site 11: Miner Rd & South Federal Hwy, Hypoluxo This rail crossing is on Miner Rd in Hypoluxo. The posted speed limit is 30 MPH. The observed speed ranged from 1.9–30.3 MPH during the day and 3.3–30.4 MPH during the night. Figure 5-11 shows the speed profile during the day, and Figure 5-12 shows the speed profile during the night.
Figure 5-11: Daytime Speed Profile for Hypoluxo Site (11).
Figure 5-12: Night Time Speed Profile for Hypoluxo Site (11).
0
5
10
15
20
25
30
35
10:1
2:00
AM
10:4
0:48
AM
11:0
9:36
AM
11:3
8:24
AM
12:0
7:12
PM
12:3
6:00
PM
1:04
:48
PM
1:33
:36
PM
2:02
:24
PM
2:31
:12
PM
Spee
d (m
ph)
Time
Hypoluxo - Day
Observed Speed 15th Percentile Possible Hesitation
0
5
10
15
20
25
30
35
7:10
:34
PM
7:39
:22
PM
8:08
:10
PM
8:36
:58
PM
9:05
:46
PM
9:34
:34
PM
10:0
3:22
PM
10:3
2:10
PM
11:0
0:58
PM
Spee
d (m
ph)
Time
Hypoluxo - Night
Observed Speed 15th Percentile Possible Hesitation

70
The results of the analysis are shown in Table 5-2 and Table 5-3. As mentioned earlier, the hesitation rate for day and night was calculated for each site.
Table 5-2: Hesitation Driver Rate during Daytime
# Site ID Period Posted Speed (mph)
Max Observed
Speed (mph)
Min Observed
Speed (mph)
15th Percentile
(mph)
Hesitation Rate
1 Pembroke Park Day 35 41.0 2.0 15.7 2.20% 2 Oakland Park Day 45 44.9 0.8 19.8 1.24% 9 Orlando Day 30 47.9 2.7 20.0 4.25% 10 Daytona Day 35 60.9 6.5 27.0 0.30% 11 Hypoluxo Day 30 30.3 1.9 13.7 1.94%
Table 5-3: Hesitation Driver Rate during Night Time
# Site ID Period Posted Speed (mph)
Max Observed
Speed (mph)
Min Observed
Speed (mph)
15th Percentile
(mph)
Hesitation Rate
1 Pembroke Park Night 35 40.1 1.3 18.0 4.15% 2 Oakland Park Night 45 46.5 0.8 19.8 1.24% 9 Orlando Night 30 48.5 6.8 20.0 2.46% 10 Daytona Night 35 50.6 5.6 27.0 0.30% 11 Hypoluxo Night 30 30.4 3.3 14.5 1.94%
Based on the hesitation calculation, the maximum rate was 4.25 percent at the Orlando site during the day and 2.46 percent at the Orlando site during the night.
Lighting Data Collection and Analysis
In addition to the speed data, it was determined that lighting levels would help determine if the area needed more street lights at night to make the area visible to drivers. A spot measuring sensor was used to collect the lighting level at the five sites. Figure 5-13 through Figure 5-17 show the illumination levels close to the crossing. The illumination scale is in foot-candles.

71
Figure 5-13: Illumination Levels for Pembroke Park Site (1).
Figure 5-14: Illumination Levels for Oakland Park Site (2).

72
Figure 5-15: Illumination Levels for Orlando Site (9).
Figure 5-16: Illumination Levels for Daytona Beach Site (10).

73
Figure 5-17: Illumination Levels for Hypoluxo Site (11).
74
Chapter 6 Summary of Research
A number of injuries and fatal collisions have occurred at certain highway-rail grade crossings that are located immediately adjacent to highway intersections, driveways or interstate ramps. Some guide signage, pavement markings, and other traffic control devices present near or at the crossings in the past may have confused drivers and caused them to turn onto the railroad tracks, rather than at the nearby intersections, driveways or ramps. Preventing incorrect turns at highway-rail grade crossings has received considerable attention to help to decrease fatalities and injuries for both road users and rail users/operators.
To contribute to the mitigation of incorrect turns at highway-rail grade crossings, this research project identified critical features and prevailing conditions influencing the incorrect turning behavior of vehicles in the proximity of a rail crossing, and developed a set of countermeasures aimed at improving incorrect turns at these crossings. Based on intensive literature review and field observations, this research found the major contributing causes of incorrect turns onto railroad tracks includes (1) confusing signs and pavement markings near highway-rail crossings, (2) darkness and low visibility near or at highway-rail crossings, (3) following turn instructions from a GPS device onto railroad tracks, (4) skewed highway-rail grade crossings, and (5) driver distraction.
The major recommended treatments for upstream of a highway-rail grade crossing include advance direction signage and striping. The recommended downstream treatments also consist of guide signs and striping. For the critical zone, treatments such as striping or dynamic envelope pavement markings, pavement gate markings, bollards, and illumination are recommended. Adequate illumination is essential for reducing the number of rail-vehicle crashes and stuck vehicle incidents due to incorrect turns at night. The use of bollards as side and median barriers at the highway-rail grade crossings could also be helpful during the night time hours with a reflective paint. However, the use of bollards at the highway-rail grade crossings as a countermeasure to prevent incorrect turns of vehicles onto railroad tracks is still in an experimental stage. It is not authorized in most cases in the U.S.
To quantify potential drivers that experience confusion or hesitation when they approach a highway-rail grade crossing, an effective methodology was developed via this research project to determine driver hesitation rate through the analysis of approaching speeds at the crossing. It provided a cost-effective method to evaluate the effectiveness of any implemented treatments to prevent incorrect turns onto railroad tracks. In addition to the speed data, illumination level data at five candidate railroad crossings for pilot studies were also collected for the analysis.
In summary, this research project provided insight on contributing causes for incorrect turns onto highway-rail grade crossings, recommended practical upstream, critical zone and downstream treatments to prevent incorrect turns onto railroad tracks, and develop a simple and effective method to help quantify potential drivers that experience confusion or hesitation when they approach a highway-rail grade crossing.
75
References
Berger, J. 2008. Whom do you believe, G.P.S. or your own eyes? The New York Times, February 17.
Campbell, J., Lichty, M., Brown, J., & Richard, C. 2008. NCRP Report 600: Human Factors Guidelines for Road Systems. Washington DC: Transportation Research Board.
Department of Planning, Transport and Infrastructure. 2012. Pavement Marking Manual, Version 3.1. Government of South Australia.
Fambro, D.A., and Noyce, D. B. 1997. Enhanced traffic control devices and railroad operations for for highway-rail grade crossings. Retrieved January 15, 2013, from http://ntl.bts.gov/lib: http://ntl.bts.gov/lib/15000/15800/15817/PB2000101092.pdf.
Federal Highway Administration (FHWA). 2007. Section IV, Identification of Alternatives. Retrieved January 15, 2013, from http://safety.fhwa.dot.gov/xings/com_roaduser/07010/sec04a.htm#c.
FHWA. 2013. Median barriers. Retrieved from http://safety.fhwa.dot.gov/roadway_dept/policy_guide/road_hardware/ctrmeasures/median_barriers/.
HoldFast Level Crossings Limited. 2009. Retrieved April 1, 2013, from http://www.railcrossings.co.uk/.
Minnesota Department of Transportation. 2012. Pavement markings & delineation. Retrieved from http://www.dot.state.mn.us/trafficeng/pavement/index.html.
Manual of Uniform Traffic Control Devices (MUTCD). 2005. Retrieved May 3, 2013, from http://mutcd.fhwa.dot.gov/documents/html/4-289-EX-ID-S-3.htm.
Railway Technology. n.d.. Retrieved May 3, 2013, from http://www.railway-technology.com/contractors/engineering/gmundner.
U.S. Department of Transportation. 2007. Railroad-Highway Grade Crossing Handbook. Washingon DC: FHWA.