Improved Quantitative Susceptibility Mapping (QSM) with HEIDI · Improved Quantitative...
1
Improved Quantitative Susceptibility Mapping (QSM) with HEIDI Ferdinand Schweser 1 , Karsten Sommer 1 , Andreas Deistung 1 , and Jürgen Rainer Reichenbach 1 1 Medical Physics Group, Dept. of Diagnostic and Interventional Radiology I, Jena University Hospital, Jena, Germany INTRODUCTION – Quantitative susceptibility mapping (QSM) is a novel imaging technique that determines tissue magnetic susceptibility from the phase of complex gradient-echo (GRE) data [1]. Due to the ill-posed nature of this inverse problem, regularization strategies are required to reduce streaking artifacts on the computed susceptibility maps. It has, for example, been proposed recently to incorporate edge information from GRE magnitude images into the inversion procedure [2,3]. Wharton and Bowtell [4] have, however, demonstrated that edge information may lead to artificial structures in susceptibility maps. This paper presents an improved QSM algorithm, Homogeneity Enabled Incremental Dipole Inversion (HEIDI), which utilizes a sophisticated problem-specific incremental inversion procedure and a priori information on the homogeneity of the susceptibility distribution rather than on its edges. MATERIALS AND METHODS – A priori information: Extraction of a priori information was based on the assumption that a small gradient of the background-corrected GRE phase images ϕ coincides with a small gradient of the magnetic susceptibility χ : z y x j j j , , , 0 0 = ≈ ∂ ⇒ ≈ ∂ χ ϕ . This assumption allows generating a binary mask M of smooth regions by thresholding the gradient of the phase images. To eliminate errors at locations were the assumption was invalid, the mask M was further refined using measures specific to susceptibility variations, i.e., the Laplacian of the phase ( 0 0 >> ∇ ⇒ >> Δ χ ϕ ) and the gradient of the magnitude m ( 0 0 >> ∂ ⇒ >> ∂ χ j j m ). Incremental Inversion: The Fourier space was divided into three sub-domains (A,B,C): In A inversion is ill-conditioned, in B inversion is well-conditioned, and C represents an interim region. Inversion in A relies exclusively on a priori information because GRE phase does not contain information about χ in these regions. Inversion was performed by solving a special total variation (TV) problem where the norm was weighted (W-TV) with the mask M: TV W − χ r min s.t. int χ χ r r P P = and E < 2 2 χ r . P is a projection operator that restricts the minimization to the sub-domain A, and E is an a priori estimate of the total image energy of the susceptibility map. Sub-domains B and C were reconstructed using a literature algorithm [5; β=0], followed by additional image-domain denoising of sub-domain C. Data Acquisition and Processing: An in vivo reference susceptibility map was obtained from a volunteer (male, 26y) with the COSMOS [6] algorithm (-50°, 0°, and 34° around left-right axis) according to [1] on a 3 T whole-body MRI scanner (Tim Trio, Siemens Medical Solutions, Erlangen, Germany) using a 12-channel receive head-matrix coil, the ToF-SWI sequence [7] (TE 1 /TE 2 =3.38ms/22ms, TR=30ms, FA=20°, 600μm isotropic voxels), and uniform sensitivity reconstruction [8]. In addition, GRE data were acquired from a patient suffering from multiple sclerosis (MS; female, 37 y) on a 1.5 T whole-body MRI scanner (Symphony, Siemens Medical Solutions) using a single-channel Tx/Rx head coil (TE=6.4/18/30/42 ms, TR=49 ms, FA=20°, 0.57 mm×0.57 mm×2 mm voxel size). Finally, HEIDI and the following literature QSM-algorithms were applied to all GRE datasets: Thresholded K-Space Division (TKD; threshold 0.2) [9] and Morphology Enabled Dipole Inversion (MEDI; λ=0.06) [2,3]. RESULTS – Computation time for the susceptibility maps was approximately 10 s with TKD, 30 min with MEDI, and 20 min with HEIDI on a desktop computer. No streaking artifacts were discernable in both MEDI and HEIDI maps. HEIDI reconstructed subtle susceptibility variations in areas such as cortical regions (Fig. 1-right), whereas susceptibility was underestimated in these regions using MEDI (Fig. 1-middle) as reported previously [2,3]. In addition, HEIDI produced significantly more pronounced contrast of phase lesions than MEDI in the MS patient (Fig. 2f). This contrast was not only substantially different from the FLAIR and magnitude images but also different from the phase contrast (red outline and arrows in Fig. 2). Comparison of HEIDI maps of the different head orientations revealed substantial orientation dependence of susceptibility contrast in major fiber tracts (Fig. 3f,g; arrows II and III), consistent with recent findings of anisotropic magnetic susceptibility obtained with susceptibility tensor imaging (STI) [10]. Interestingly, the hitherto supposed gold-standard COSMOS map (Fig. 3a) resembled the average of the single-angle HEIDI maps (Fig. 3e; arrows I), suggesting that multi-angle techniques that do not account for the anisotropy of the susceptibility should not be regarded as gold standard when investigating the accuracy of single-angle susceptibility mapping techniques. DISCUSSION AND CONCLUSIONS – The present study introduced an improved QSM algorithm, HEIDI, which largely overcomes pitfalls of other recently published algorithms including streaking artifacts, severe noise amplification, and excessive smoothing. Depiction of white-matter lesions was substantially different from established MR contrasts, indicating that HEIDI will be instrumental for investigating occurrence and origin of subtle pathological susceptibility variations in the clinical scenario. REFERENCES – [1] Schweser F et al., 2011. NeuroImage. 54:2789-807. [2] Liu T et al., 2011. Magn Reson Med. 66(3):777-83. [3] Liu J et al., 2011. NeuroImage (in press). [4] Wharton SJ and Bowtell R, 2010. NeuroImage. 53(2):515-25. [5] Schweser F et al., 2010. Med Phys. 37(10):5165-5178. [6] Liu T et al. 2009. Magn Reson Med. 61:196-204. [7] Deistung A et al. 2009. J Magn Reson Imaging. 29:1478-84. [8] Ros C et al. 2009. IFMBE Proc. 22:803-6. [9] Shmueli K et al., 2009. Magn Re- son Med. 62:1510-22. [10] Li W et al., 2011. NeuroImage (in press). FIGURE 1. Comparison of in vivo susceptibility maps calculated with TKD, MEDI and HEIDI. The deviation to COSMOS is shown in the bottom row. FIGURE 2. QSM with MEDI and HEIDI, respectively, in a patient suffering from multiple sclerosis. The profile lines (f; dotted white boxes) and arrows I-III illustrate different lesion depiction with MEDI and HEIDI compared to FLAIR (a), magnitude (b), and phase (c). FIGURE 3. Comparison of HEIDI and COSMOS. Individual HEIDI maps of the three different head orientations are shown in (b)-(d) along with their differences in (f) and (g). Orientation dependent susceptibility in major fiber tracts is illustrated by the profile lines in (h) as well as by the arrows II and III. The average of the three HEIDI maps (e) has similar contrast to the COSMOS map (a) as, e.g. marked by arrow I. 2359 Proc. Intl. Soc. Mag. Reson. Med. 20 (2012)
Transcript of Improved Quantitative Susceptibility Mapping (QSM) with HEIDI · Improved Quantitative...
Improved Quantitative Susceptibility Mapping (QSM) with HEIDI Ferdinand Schweser1, Karsten Sommer1, Andreas Deistung1, and Jürgen Rainer Reichenbach1
1Medical Physics Group, Dept. of Diagnostic and Interventional Radiology I, Jena University Hospital, Jena, Germany
INTRODUCTION – Quantitative susceptibility mapping (QSM) is a novel imaging technique that determines tissue magnetic susceptibility from the phase of complex gradient-echo (GRE) data [1]. Due to the ill-posed nature of this inverse problem, regularization strategies are required to reduce streaking artifacts on the computed susceptibility maps. It has, for example, been proposed recently to incorporate edge information from GRE magnitude images into the inversion procedure [2,3]. Wharton and Bowtell [4] have, however, demonstrated that edge information may lead to artificial structures in susceptibility maps. This paper presents an improved QSM algorithm, Homogeneity Enabled Incremental Dipole Inversion (HEIDI), which utilizes a sophisticated problem-specific incremental inversion procedure and a priori information on the homogeneity of the susceptibility distribution rather than on its edges.
MATERIALS AND METHODS – A priori information: Extraction of a priori information was based on the assumption that a small gradient of the background-corrected GRE phase images ϕ
coincides with a small gradient of the magnetic susceptibility χ : zyxjjj ,,,00 =≈∂⇒≈∂ χϕ . This assumption allows generating a binary mask M of
smooth regions by thresholding the gradient of the phase images. To eliminate errors at locations were the assumption was invalid, the mask M was further refined using measures specific to susceptibility variations, i.e., the Laplacian of the phase ( 00 >>∇⇒>>Δ χϕ ) and the gradient of the magnitude m ( 00 >>∂⇒>>∂ χjjm ). Incremental
Inversion: The Fourier space was divided into three sub-domains (A,B,C): In A inversion is ill-conditioned, in B inversion is well-conditioned, and C represents an interim region. Inversion in A relies exclusively on a priori information because GRE phase does not contain information about χ in these regions. Inversion was performed by solving a special total variation (TV) problem where the norm was weighted (W-TV) with the mask M:
TVW −χrmin s.t.
intχχ rr PP = and E<2
2χr . P is a
projection operator that restricts the minimization to the sub-domain A, and E is an a priori estimate of the total image energy of the susceptibility map. Sub-domains B and C were reconstructed using a literature algorithm [5; β=0], followed by additional image-domain denoising of sub-domain C. Data Acquisition and Processing: An in vivo reference susceptibility map was obtained from a volunteer (male, 26y) with the COSMOS [6] algorithm (-50°, 0°, and 34° around left-right axis) according to [1] on a 3 T whole-body MRI scanner (Tim Trio, Siemens Medical Solutions, Erlangen, Germany) using a 12-channel receive head-matrix coil, the ToF-SWI sequence [7] (TE1/TE2=3.38ms/22ms, TR=30ms, FA=20°, 600μm isotropic voxels), and uniform sensitivity reconstruction [8]. In addition, GRE data were acquired from a patient suffering from multiple sclerosis (MS; female, 37 y) on a 1.5 T whole-body MRI scanner (Symphony, Siemens Medical Solutions) using a single-channel Tx/Rx head coil (TE=6.4/18/30/42 ms, TR=49 ms, FA=20°, 0.57 mm×0.57 mm×2 mm voxel size). Finally, HEIDI and the following literature QSM-algorithms were applied to all GRE datasets: Thresholded K-Space Division (TKD; threshold 0.2) [9] and Morphology Enabled Dipole Inversion (MEDI; λ=0.06) [2,3].
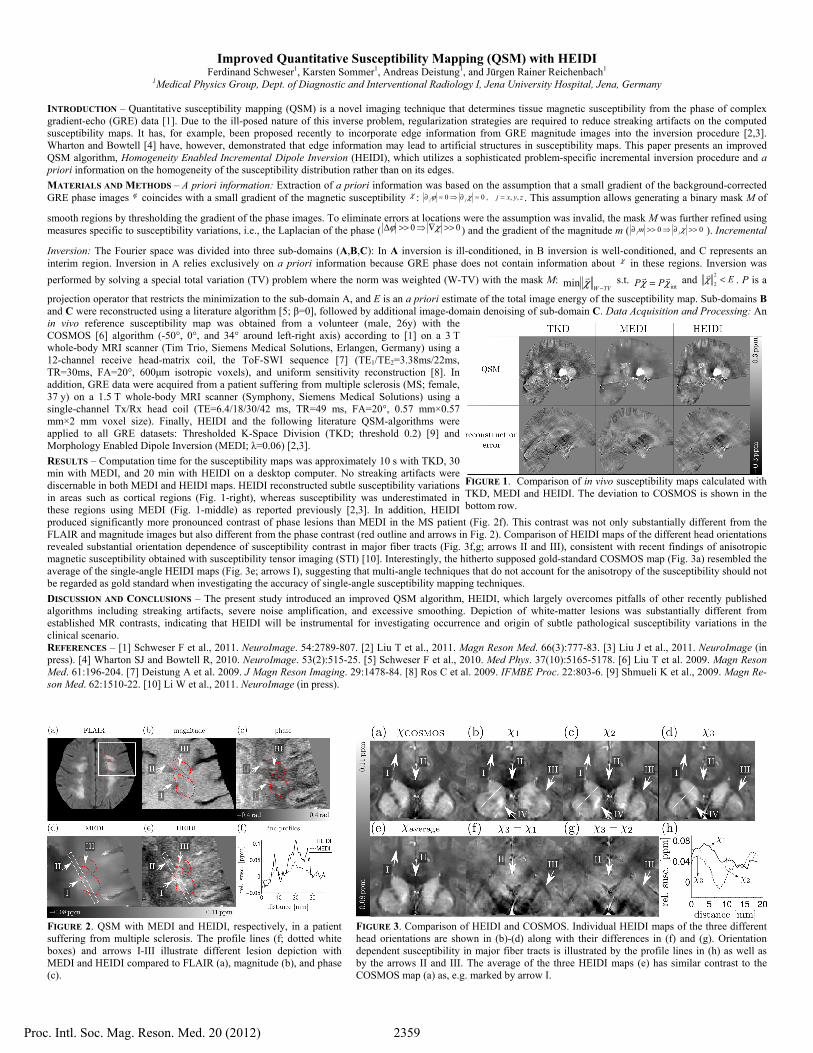
RESULTS – Computation time for the susceptibility maps was approximately 10 s with TKD, 30 min with MEDI, and 20 min with HEIDI on a desktop computer. No streaking artifacts were discernable in both MEDI and HEIDI maps. HEIDI reconstructed subtle susceptibility variations in areas such as cortical regions (Fig. 1-right), whereas susceptibility was underestimated in these regions using MEDI (Fig. 1-middle) as reported previously [2,3]. In addition, HEIDI produced significantly more pronounced contrast of phase lesions than MEDI in the MS patient (Fig. 2f). This contrast was not only substantially different from the FLAIR and magnitude images but also different from the phase contrast (red outline and arrows in Fig. 2). Comparison of HEIDI maps of the different head orientations revealed substantial orientation dependence of susceptibility contrast in major fiber tracts (Fig. 3f,g; arrows II and III), consistent with recent findings of anisotropic magnetic susceptibility obtained with susceptibility tensor imaging (STI) [10]. Interestingly, the hitherto supposed gold-standard COSMOS map (Fig. 3a) resembled the average of the single-angle HEIDI maps (Fig. 3e; arrows I), suggesting that multi-angle techniques that do not account for the anisotropy of the susceptibility should not be regarded as gold standard when investigating the accuracy of single-angle susceptibility mapping techniques.
DISCUSSION AND CONCLUSIONS – The present study introduced an improved QSM algorithm, HEIDI, which largely overcomes pitfalls of other recently published algorithms including streaking artifacts, severe noise amplification, and excessive smoothing. Depiction of white-matter lesions was substantially different from established MR contrasts, indicating that HEIDI will be instrumental for investigating occurrence and origin of subtle pathological susceptibility variations in the clinical scenario.
REFERENCES – [1] Schweser F et al., 2011. NeuroImage. 54:2789-807. [2] Liu T et al., 2011. Magn Reson Med. 66(3):777-83. [3] Liu J et al., 2011. NeuroImage (in press). [4] Wharton SJ and Bowtell R, 2010. NeuroImage. 53(2):515-25. [5] Schweser F et al., 2010. Med Phys. 37(10):5165-5178. [6] Liu T et al. 2009. Magn Reson Med. 61:196-204. [7] Deistung A et al. 2009. J Magn Reson Imaging. 29:1478-84. [8] Ros C et al. 2009. IFMBE Proc. 22:803-6. [9] Shmueli K et al., 2009. Magn Re-son Med. 62:1510-22. [10] Li W et al., 2011. NeuroImage (in press).
FIGURE 1. Comparison of in vivo susceptibility maps calculated with TKD, MEDI and HEIDI. The deviation to COSMOS is shown in the bottom row.
FIGURE 2. QSM with MEDI and HEIDI, respectively, in a patient suffering from multiple sclerosis. The profile lines (f; dotted white boxes) and arrows I-III illustrate different lesion depiction with MEDI and HEIDI compared to FLAIR (a), magnitude (b), and phase (c).
FIGURE 3. Comparison of HEIDI and COSMOS. Individual HEIDI maps of the three different head orientations are shown in (b)-(d) along with their differences in (f) and (g). Orientation dependent susceptibility in major fiber tracts is illustrated by the profile lines in (h) as well as by the arrows II and III. The average of the three HEIDI maps (e) has similar contrast to the COSMOS map (a) as, e.g. marked by arrow I.
2359Proc. Intl. Soc. Mag. Reson. Med. 20 (2012)