Improved method for determining the optical constants of thin films and its application to...
9
Improved method for determining the optical constants of thin films and its application to molecular-beam-deposited polycrystalline layers Paul Meredith, Gerald S. Buller, and Andrew C. Walker Polycrystalline, dielectric thin films are grown by the ultrahigh vacuum technique of molecular-beam deposition. A method of calculating the optical constants of such weakly absorbing, homogeneous layers from spectral transmission information alone, with no prior knowledge of their characteristics, is presented. Initially, the procedure uses transmission turning-point data to estimate refractive index and thickness by an analytical approach. These data are then fitted to a function that undergoes an iterative refinement routine by means of a weighted figure of merit to determine with good accuracy the film parameters as functions of wavelength. In this way the optimum conditions for the deposition of materials such as ZnS, ZnSe, LiF, CaF 2 , and BaF 2 are found. Key words: Thin films, optical constants, spectroscopy,molecular-beam deposition,ultrahigh vacuum, polycrystalline films. 1. Introduction The wide application of optical multilayer coatings has prompted the development of numerous vacuum and nonvacuum techniques for the deposition of thin films. One such approach is that of molecular-beam deposition" 2 (MBD). This exploits the ultrahigh vacuum hardware originally developed for epitaxial growth of semiconductors and permits the deposition of polycrystalline films on a wide range of transparent substrates. As a result of the low base pressure ( < 10-10 Torr) and the collimated K-cell source geom- etry, high structural quality and low impurity levels are achieved. Applications of this technology in- clude high damage threshold laser coatings 3 and fabrication of high-finesse nonlinear interference fil- ter (NLIF) structures for optical switching applica- tions. 4 In the latter example, it has been found that predamage effects, resulting from photostructural changes, are considerably reduced when compared with conventional thermally evaporated devices. 5 We grew the MBD films described in this paper using a VG Semicon V90H system as part of a joint study in collaboration with OCLI Optical Coatings Ltd. The authors are with the Department of Physics, Heriot-Watt University, Riccarton, Edinburgh, EH14 4AS, UK. Received 19 October 1992. 0003-6935/93/285619-09$06.00/0. 3 1993 Optical Society of America. The optimized design of multilayer structures, such as NLIF's, requires detailed knowledge of the optical constants of the constituent materials. It has long been understood that these parameters differ considerably from bulk or single crystal values 6 and are highly dependent on not only the techinque used to produce them, but also on the conditions used during growth. 78 It is therefore necessary, when dealing with a new process such as MBD, to fully characterize the films produced and to study the effect of varying the growth parameters. The determination of optical constants is a subject that has received much attention from the thin-film community over the past 40 years, and consequently there are many methods for this type of analysis, e.g., ellipsometry 9 and interferometry.1 0 However, many of these methods are specific with respect to the type of film that can be treated. Numerous reviews are available in thin-film texts such as those by Heav- ens," Macleod,' 2 Palik,1 3 and Abeles,1 4 which detail the more popular techniques and their associated problems. Traditional photometric methods have generally involved the measurement of normal incidence trans- mission and reflection spectra. The optical con- stants are then isolated by numericall 5 or graphical means.' 2 All these approaches suffer ambiguity be- cause of the existence of multiple solutions. At- tempts have been made by Denton et al.' 6 and Ben- nett and Booty' 7 to find a method for determining the 1 October 1993 / Vol. 32, No. 28 / APPLIED OPTICS 5619
Transcript of Improved method for determining the optical constants of thin films and its application to...

Improved method for determining the opticalconstants of thin films and its application tomolecular-beam-deposited polycrystalline layers
Paul Meredith, Gerald S. Buller, and Andrew C. Walker
Polycrystalline, dielectric thin films are grown by the ultrahigh vacuum technique of molecular-beamdeposition. A method of calculating the optical constants of such weakly absorbing, homogeneous layersfrom spectral transmission information alone, with no prior knowledge of their characteristics, ispresented. Initially, the procedure uses transmission turning-point data to estimate refractive index andthickness by an analytical approach. These data are then fitted to a function that undergoes an iterativerefinement routine by means of a weighted figure of merit to determine with good accuracy the filmparameters as functions of wavelength. In this way the optimum conditions for the deposition ofmaterials such as ZnS, ZnSe, LiF, CaF2, and BaF2 are found.
Key words: Thin films, optical constants, spectroscopy, molecular-beam deposition, ultrahigh vacuum,polycrystalline films.
1. Introduction
The wide application of optical multilayer coatingshas prompted the development of numerous vacuumand nonvacuum techniques for the deposition of thinfilms. One such approach is that of molecular-beamdeposition"2 (MBD). This exploits the ultrahighvacuum hardware originally developed for epitaxialgrowth of semiconductors and permits the depositionof polycrystalline films on a wide range of transparentsubstrates. As a result of the low base pressure( < 10-10 Torr) and the collimated K-cell source geom-etry, high structural quality and low impurity levelsare achieved. Applications of this technology in-clude high damage threshold laser coatings3 andfabrication of high-finesse nonlinear interference fil-ter (NLIF) structures for optical switching applica-tions.4 In the latter example, it has been found thatpredamage effects, resulting from photostructuralchanges, are considerably reduced when comparedwith conventional thermally evaporated devices.5We grew the MBD films described in this paper usinga VG Semicon V90H system as part of a joint study incollaboration with OCLI Optical Coatings Ltd.
The authors are with the Department of Physics, Heriot-WattUniversity, Riccarton, Edinburgh, EH14 4AS, UK.
Received 19 October 1992.0003-6935/93/285619-09$06.00/0.3 1993 Optical Society of America.
The optimized design of multilayer structures,such as NLIF's, requires detailed knowledge of theoptical constants of the constituent materials. Ithas long been understood that these parametersdiffer considerably from bulk or single crystal values6
and are highly dependent on not only the techinqueused to produce them, but also on the conditions usedduring growth.7 8 It is therefore necessary, whendealing with a new process such as MBD, to fullycharacterize the films produced and to study theeffect of varying the growth parameters.
The determination of optical constants is a subjectthat has received much attention from the thin-filmcommunity over the past 40 years, and consequentlythere are many methods for this type of analysis, e.g.,ellipsometry9 and interferometry.10 However, manyof these methods are specific with respect to the typeof film that can be treated. Numerous reviews areavailable in thin-film texts such as those by Heav-ens," Macleod,'2 Palik,13 and Abeles,14 which detailthe more popular techniques and their associatedproblems.
Traditional photometric methods have generallyinvolved the measurement of normal incidence trans-mission and reflection spectra. The optical con-stants are then isolated by numericall5 or graphicalmeans.' 2 All these approaches suffer ambiguity be-cause of the existence of multiple solutions. At-tempts have been made by Denton et al.' 6 and Ben-nett and Booty'7 to find a method for determining the
1 October 1993 / Vol. 32, No. 28 / APPLIED OPTICS 5619

correct solution, but this remains a difficult task,especially in the case of thicker films.
The need to measure normal or near-normal inci-dence reflection spectra over a wide wavelength rangecan be another difficulty when these approaches areadopted. Relection data are often subject to highuncertainty, which can render them unsuitable forthis sort of analysis. For this reason, several proce-dures have been proposed, such as those by Lya-shenko and Miloslavskii,18 Valeev,19 and Manifacier etal.,2 0 which use transmission data only. These typesof procedure can be applied to weakly absorbing,homogeneous films deposited on transparent sub-strates, and to calculate refractive index n, extinctioncoefficient k, and thickness d at the spectral turningpoints. They are essentially analytical methods thatpermit the correct solution to be more easily recog-nized.
The approach developed by Manifacier was adaptedby Swanepoel such that the errors associated with theinitial simplifying assumptions are partially compen-sated for by adjusting the calculated order to a half ora full integer number.2 ' In the routine described inthis paper, Swanepoel's analytical method is used togain an initial estimate of n and d. These values areinserted into one of the turning-point transmissionequations, and an approximate k is isolated numeri-cally. The refractive-index and extinction coefficientdata sets are fitted to suitable functions. An itera-tive refinement technique, involving a weighted fig-ure of merit, is then used to extract more accurateresults.
The theory underlying this approach and an erroranalysis of the improved procedure are presented,together with example results indicating the effect ofthe variation of MBD growth conditions on theoptical constants of certain materials. Commentson the limitations and the range of applicability of themethod are also given.
of quarter wavelengths, as
T-in 16nos(n2 + k2 )aTmin A + Ba 2 - 2COL
16nos(n2 + k2 )aTmaxA + Ba2 - 2Ca
for n > s, (2a)
for n < s. (2b)
In the case of weak absorption, the constants A, B, C,D, and a are given by
A = (n + no)2(n + s)2,
B = (n - no)2(n - S)2,
C = -(n2 - n02)(n2 - s2) + 4nos,
1-4,rrkdXa= exp( A[/d)
where no is the refractive index of the surroundingmedium (usually air). Rearrangement of Eqs. (la)and (2b) [or Eqs. (lb) and (2a)] yields an explicitexpression for n as f(no, s, Tmax, Tmin), which is givenby
n = [N + (N2 - n02 s2 )1/2 ]'/ 2, (3)
where
N = + 2ns Tmax TminN= 2 +2n~s TmaxTmin
N 2 + 2 Tmin -Tmax
N= 2 +2n~s TmaxTmin
for n > s, (4a)
for n < s. (4b)
Similarly, extinction coefficient k can be found from
A[1 - (Tmax/Tmin)1/2 ]
B[1 + (Tm./Tmin)1/2]
A[(Tmax/Tmin) 1 /2 -1]
a- B[(Tm/Tmin)l/2 + 1]
for n > s, (5a)
for n < s. (5b)
Film thickness d must be consistent with the relation2. Theoretical Considerations and MethodDevelopment
The transmission spectrum of a single-layer thin filmof refractive index n, extinction coefficient k, andthickness d, deposited on a thick nonabsorbing sub-strate of refractive index s, can be characterized interms of the maxima and minima transmission val-ues, i.e. the turning points. These can be written,when an optical thickness equal to an even or oddnumber of quarter wavelengths is assumed,2 0 as
16nos(n2 + k2)tTmax = A + Ba2 + 2C
16nos(n2 + k2 )Tmin = T+B 2 + 2Ca
forn > s, (la)
for n < s, (lb)
and for an optical thickness equal to an odd number
X1X22(X 2n, - Xln2 )
(6)
where X1 and 2 are the wavelength positions ofadjacent maxima or minima at which the refractiveindices have the values n1 and n2, respectively.
The functions n(X) and k(A) for a dielectric materialcan be approximated to Cauchy- or Sellmeir-likepolynomial functions15 of the form
n(X), k(A) = a + m ai) (Cauchy), (7)
n 2(X) - 1, k 2(X) - 1 = a + I [ j (Sellmeir),
(8)
where m is typically 3 or 4.
5620 APPLIED OPTICS / Vol. 32, No. 28 / 1 October 1993

The procedure for the calculation of the opticalconstants is summarized in Fig. 1, and the detail is asfollows:
(1) A transmission spectrum of the film/substratecombination is taken with a spectrophotometer.The wavelengths and transmission values (Tmax andTmin) corresponding to all turning points within thespectral region of interest are determined. The enve-lope functions, Tmax(X) and Tmin(X), are then con-structed by linear interpolation in the regions oflow absorption (k < 10-3) and by polynomial in-terpolation in the regions of medium absorption(10-2 > k > 10-3).
(2) Weighting factors are set manually to specifythe more reliable part of the measured spectrum, [seestep (6) below].
(3) Estimates of the refractive index and thick-ness are obtained from Eqs. (3), (4), and (6), by themethod of Swanepoel.21
(4) An approximate extinction coefficient is calcu-lated numerically from Eq. (la) or Eq. (lb). Thisvalue will include losses that are due to scatter as wellas to absorption.
(5) These discrete n and k values are fitted asfunctions of wavelength to polynomials of the form ofEq. (7) or Eq. (8).
(6) A matrix approach12 is then used to calculatethe theoretical optical response of the film/substratecombination at the turning-point wavelengths, giventhe calculated constants. A comparison between thetransmission values generated by the matrix methodand the initial spectral data is made. This deviationbetween the two is quantified by a weighted errorfunction,
p
= J TTmeas(meas)i- c(Tcaic)i ], (9)
where wi is the weighting factor (0 < wi < 1) for theith turning point [as entered in step (2)], which occurs
at a measured wavelength position meas and calcu-lated position \,a,. This comparison is best per-formed at odd-integer quarter-wave positions (Tminfor n > s), since they are most sensitive to changesin n.
(7) The turning points in best agreement areselected, an improved estimate of the thickness isrecalculated for each pair of turning points from Eq.(6), and an average value is taken.
(8) With this revised value for d, the refractiveindex is then re-evaluated consistently for all theturning points, again from Eq. (6). At this point, theprocedure returns to step (4) and iterates until asatisfactory fit is obtained.
(9) The repeated refinement of the n and k valuesstops once the error function w falls below a predeter-mined value. The calculated n(X) and k(X) are thenavailable in tabular form or can be plotted, as re-quired.
This modified routine follows the analytical tech-nique of Swanepoel21 for only the first approximationof n and d[step (3)]. The remainder of the procedureis essentially one of iterative refinement and, in thisrespect, differs from conventional turning-point ap-proaches.
3. Error Analysis
The effect of small uncertainties in the input param-eters will be cumulative. The method has two dis-tinct parts, an initial analytical process followed bythe numerical refinement routine. It is thereforenecessary to perform two error analyses in order toevaluate the ultimate consequence of initial errors.
A. Initial Estimation of n and d
In this section, the errors are derived from step(3). From Eq. (4), it can be seen that N =f(no, s, Tmax, Tmin). When uncorrelated errors are as-sumed, the absolute uncertainty in N is given by
aN 2
AN = dano An +(N 2
ASas
AN 2
+T d~Ax a
(1)
(2)
(3)
(4)
(5)
(6)
|Input Measured Trning-||PointTransmissi n Data.|
I _ ecalculaen
Set Weighted Figure
of Merit Value.
l ~~~~~~~~~~Select Accurate PointsEstimate n & 7d and Reaculate d.
(Swranepoel Calculatlon). 0 N
Calculate kNumerically. 11 Pot
|Least-Square Fit n &k Yes|to Suitable Formulas. ,an
I i Out~~~~~~~~put n,kRegenerate a Theoretical i Over the
Spectrum and Compare Specified
Turning Point Values Region.
With Initial Spectral
Data
(8)
Fig. 1. Method flowchart summarizing the modified turning-point procedure used to evaluate optical constant data.
aN \2- 1/2+ AT \Tmin (10)
where Ano, As, ATmax, and ATmin are the absoluteerrors in no, s, Tmax and Tmin, respectively.
The magnitude of As will be small if a well-characterized substrate is used (e.g., glass). Evaluat-ingthes terminEq. (10) gives AN = 2AS(Tmax - Tmin)/TmaTmin. A relatively large absolute error in s of0.001 will result in an uncertainty of <0.1 in N,although AN starts to rise more rapidly as themodulation depth decreases, i.e., as Tmax/Tmin ap-proaches 1. Glass manufacturers provide index val-ues that, in most cases, are sufficiently accurate topermit this contribution to the total error to beneglected.
If the incident medium is air, so that no = 1.0003,and if accurate substrate data are available, then
1 October 1993 / Vol. 32, No. 28 / APPLIED OPTICS 5621
Ano = As = 0. Also, if an additional assumption ismade that the errors in the determination of Tma, andTmin are approximately equal, i.e., ATmax = Tmin =AT, then
1 1 \1/2AN = 2sATT - +
max min)(11)
From Eq. (3), it can be seen that n = f(N, no, s), and sothe absolute error in n as a function of these variablesis given by
an 2 an \2 an 2 1/2An = I-Ano +- A ANI[ano i as / aN /
If, once again, Ano, As = 0, then Eq. (12) becomes
[1 + N(N2 - S2)-1/2]
2[N + (N2 - s 2 )1/2 ]1/2
Further simplification gives the fractional error interms of AT:
An/n = ATg(Tm., Tmi., s),
9-
._
0L.6U
(12)
1.0 1.2 1.4 1.6 1.8 2.0
Tmax/Tmin (Fringe Contrast)
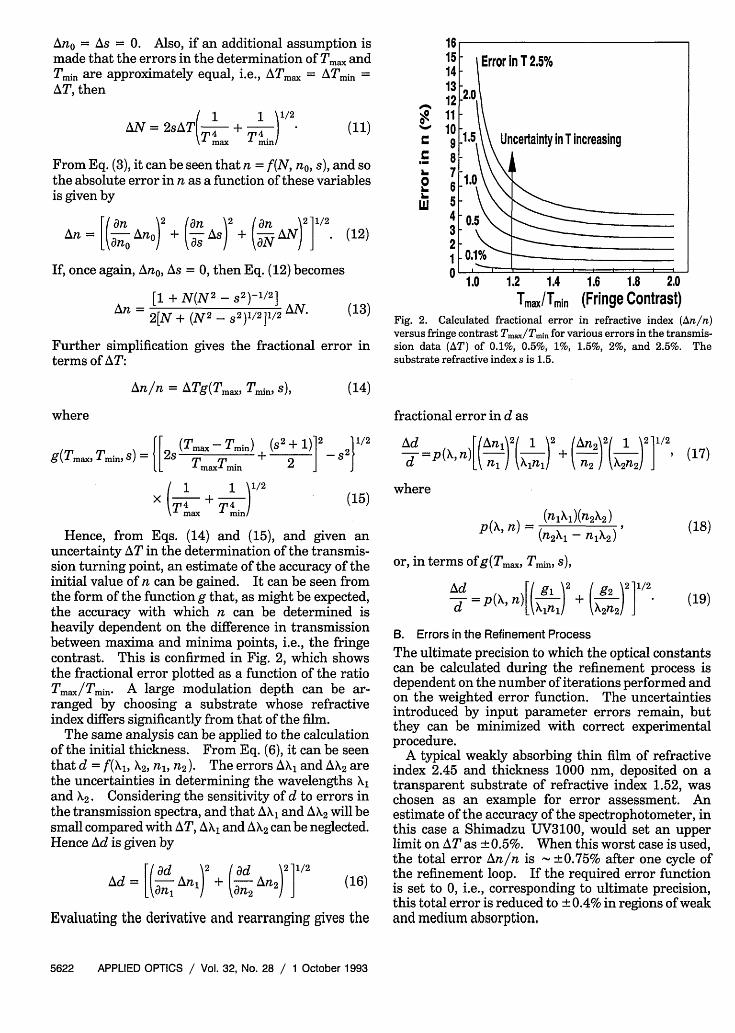
Fig. 2. Calculated fractional error in refractive index (An/n)versus fringe contrast Tmax/Tmin for various errors in the transmis-sion data (AT) of 0.1%, 0.5%, 1%, 1.5%, 2%, and 2.5%. Thesubstrate refractive index s is 1.5.
(13)
(14)
fractional error in d as
g(T. TminS) = [2s (TM.x-Tmin) + (S2 + 1)]2 _S2}1/2g maxi ind -(L Tm:Tmi. 2 J
(15)+ 1)1/24 4Inx mmn
Hence, from Eqs. (14) and (15), and given anuncertainty AT in the determination of the transmis-sion turning point, an estimate of the accuracy of theinitial value of n can be gained. It can be seen fromthe form of the function g that, as might be expected,the accuracy with which n can be determined isheavily dependent on the difference in transmissionbetween maxima and minima points, i.e., the fringecontrast. This is confirmed in Fig. 2, which showsthe fractional error plotted as a function of the ratioTmax/Tmin. A large modulation depth can be ar-ranged by choosing a substrate whose refractiveindex differs significantly from that of the film.
The same analysis can be applied to the calculationof the initial thickness. From Eq. (6), it can be seenthat d = f(X, X2, ni, n2 ). The errors AX, and AX2 arethe uncertainties in determining the wavelengths X,and X2. Considering the sensitivity of d to errors inthe transmission spectra, and that AX, and AX2 will besmall compared with AT, AX1 and AX2 can be neglected.Hence Ad is given by
F/ ad \2 + ad 2 1/2 (16)A d n iAn, +an- An 2 gv (16
Evaluating the derivative and rearranging gives the
Ad F( An, 2 1 )2 An2 \2 1 1 2 1/2-~=p (X, n)I----I +1 II I (17)
dL nj1 \Xn n2 X2n2
where
p(X n) = (nX,)(n 2X2 )(n2 X1 - nlX2 )'
or, in terms of g(TmaX, Tmini s),
Ad Fg_2 9 g2)2]1/2
nJ Xi/n, X2n2 /
(18)
(19)
B. Errors in the Refinement Process
The ultimate precision to which the optical constantscan be calculated during the refinement process isdependent on the number of iterations performed andon the weighted error function. The uncertaintiesintroduced by input parameter errors remain, butthey can be minimized with correct experimentalprocedure.
A typical weakly absorbing thin film of refractiveindex 2.45 and thickness 1000 nm, deposited on atransparent substrate of refractive index 1.52, waschosen as an example for error assessment. Anestimate of the accuracy of the spectrophotometer, inthis case a Shimadzu UV3100, would set an upperlimit on ATas ±0.5%. When this worst case is used,the total error An/n is 0.75% after one cycle ofthe refinement loop. If the required error functionis set to 0, i.e., corresponding to ultimate precision,this total error is reduced to ± 0.4% in regions of weakand medium absorption.
5622 APPLIED OPTICS / Vol. 32, No. 28 / 1 October 1993
where
A similar analysis can be applied to the iterativecalculation of k. The same uncertainty in transmis-sion at both turning points yields, after just one cycleof the refinement loop, an error of ± 125% in k forregions of weak absorption (k < 10-3) and ±8% forregions of medium absorption (10-2 > k > 10-3).If once again the error function is set to 0, Ak/k isunaffected in regions of weak absorption and isreduced to ± 3.5% in regions of medium absorption.These limits have been calculated on the assumptionthat an accurate thickness has already been deter-mined. This is a valid assumption, provided that asufficient number of points were used to calculate anaverage d in the first part of the method.
In summary, for a modest fringe contrast of 1.3(typical of ZnSe on glass), an uncertainty of ± 0.5% inTma. and Tmin will result in an error of An/n ± 1.5%and Ad/d ± ± 0.2% from the first (Swanepoel) part ofthe analysis. This is reduced to An/n ± 0.4% afterthe full refinement process, with no change in Ad/d.In weakly absorbing regions, the precision in k beforeand after the refinement is poor, with Ak/k ± 125%. This follows directly from the insensitivityof transmission levels to k once the absorption-length product (ad) drops below 0.05. In regionsof medium absorption, the modified turning-pointprocedure gives Ak/k 3.5%. By comparison underthe same conditions, it is found that Ak/k greatlyexceeds 100% if the Swanepoel calculation21 alone isused.
C. Comparison between the Analytical and theRefined Method
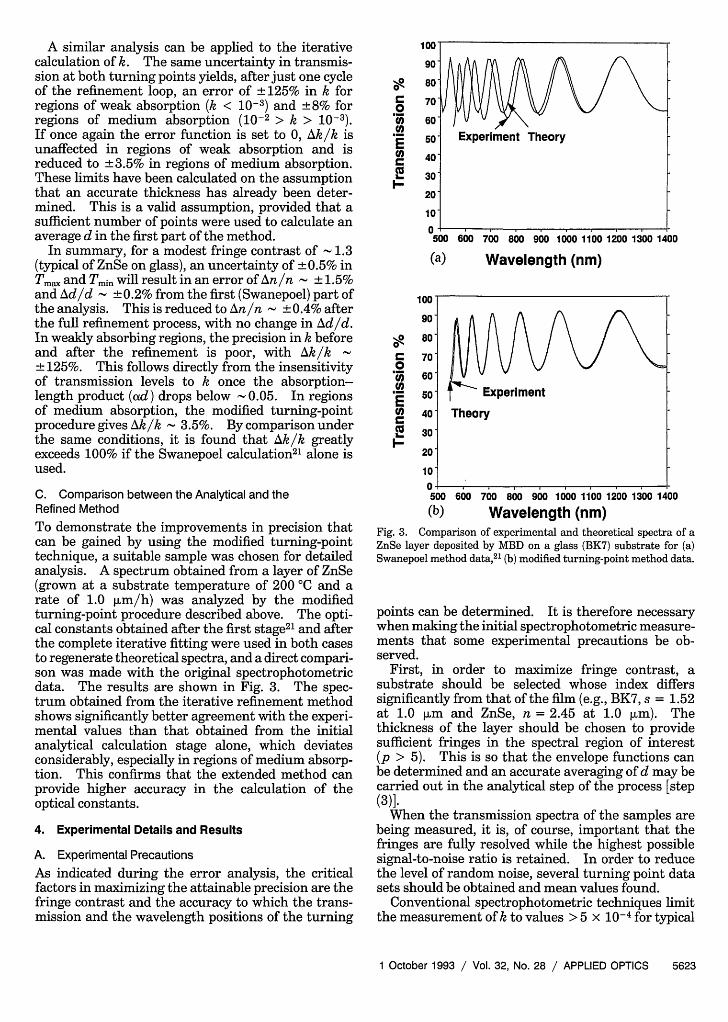
To demonstrate the improvements in precision thatcan be gained by using the modified turning-pointtechnique, a suitable sample was chosen for detailedanalysis. A spectrum obtained from a layer of ZnSe(grown at a substrate temperature of 200 C and arate of 1.0 m/h) was analyzed by the modifiedturning-point procedure described above. The opti-cal constants obtained after the first stage2 ' and afterthe complete iterative fitting were used in both casesto regenerate theoretical spectra, and a direct compari-son was made with the original spectrophotometricdata. The results are shown in Fig. 3. The spec-trum obtained from the iterative refinement methodshows significantly better agreement with the experi-mental values than that obtained from the initialanalytical calculation stage alone, which deviatesconsiderably, especially in regions of medium absorp-tion. This confirms that the extended method canprovide higher accuracy in the calculation of theoptical constants.
4. Experimental Details and Results
A. Experimental Precautions
As indicated during the error analysis, the criticalfactors in maximizing the attainable precision are thefringe contrast and the accuracy to which the trans-mission and the wavelength positions of the turning
.2C
C1!
90
80'
70'
60'
50 Experiment Theory
40
30
20
10
0 I500 600 700 800 900 1000 1100 1200 1300 1400
(a) Wavelength (nm)
sO5.0
ECo
I
500 600 700 800 900 1000 1100 1200 1300 1400
(b) Wavelength (nm)Fig. 3. Comparison of experimental and theoretical spectra of aZnSe layer deposited by MBD on a glass (BK7) substrate for (a)Swanepoel method data,2 ' (b) modified turning-point method data.
points can be determined. It is therefore necessarywhen making the initial spectrophotometric measure-ments that some experimental precautions be ob-served.
First, in order to maximize fringe contrast, asubstrate should be selected whose index differssignificantly from that of the film (e.g., BK7, s = 1.52at 1.0 ,um and ZnSe, n = 2.45 at 1.0 lum). Thethickness of the layer should be chosen to providesufficient fringes in the spectral region of interest(p > 5). This is so that the envelope functions canbe determined and an accurate averaging of d may becarried out in the analytical step of the process [step(3)].
When the transmission spectra of the samples arebeing measured, it is, of course, important that thefringes are fully resolved while the highest possiblesignal-to-noise ratio is retained. In order to reducethe level of random noise, several turning point datasets should be obtained and mean values found.
Conventional spectrophotometric techniques limitthe measurement of k to values > 5 x 10⁻⁴ for typical
1 October 1993 / Vol. 32, No. 28 / APPLIED OPTICS 5623
n 1-

film thicknesses as a consequence of the precisionlimits of even the most accurate instruments.
B. Determination of Optimum Growth Parameters
Thin films of optical coating materials such as ZnSe,ZnS, LiF, CaF2, and BaF2 were deposited on transpar-ent glass substrates by MBD. Ultrahigh vacuumconditions (10-9-10-10 Torr) were employed in theV9OH system during growth. Conventional quartzcrystals were used for thickness control of the layers,and a monitoring ion gauge (MIG) was used forcontrol of the evaporant flux rate. The materialsources were specially developed graphite Knudsencells,2 which permitted the high temperatures re-quired (- 1400 C) for the evaporation of fluorides.A range of conditions were employed during the,growth runs, and the optical constants for the result-ant films were determined for each combination ofsubstrate temperature and flux rate. In this way the
optimum parameters for the production of low-absorption (low-scatter) high-index thin films couldbe determined.
The results of the ZnS investigation are shown inFig. 4(substrate temperature dependence) and Fig. 5(rate dependence), and summarized in Table 1. Itcan be seen from the dispersion curves that thepreferred condition for the growth of high-indexlow-loss material is a rate of 0.2 Vum/h and a substratetemperature of 150 C. Similarly, it was found forZnSe that the parameters yielding films exhibitingoptimum properties were a substrate temperature of
100 C and a growth rate of 0.5 m/h (refer toTable 1).
Low-index films of LiF, CaF2, and BaF2, depositedon high-index SF11 glass (s = 1.7), were also studied.The LiF could be evaporated at 800 'C and soflexibility in growth rate was available. Because ofthe vaporization point of BaF2 and CaF2 ( 1400 C),
0.5 0.7 0.9 1.1 1.3(a) Wavelength (micrometers)
1.5
0.5 0.7 0.9 1.1
(b) Wavelength (micrometers)
2.60
2.55
CXa)
C
a)
1o
0
(U
'e-a)
C
0
00C00
C
2.50 F
2.45
2.40 F
2.35
2.30
2.25
2.20
0.010
0.0091
0.0081
0.0071
0.0061
0.0051
0.0041
0.0031
0.0021
0.0011
1.0 ,um/h
0.5 ..m/h0.5 0.7 0.9 1.1 1.3 1.5
(a) Wavelength (micrometers)
o \\
0.2 pum/h
1.5
Li0
0
F0.5 0.7 0.9 1.1 1.3
(b) Wavelength (Micrometers)
Fig. 4. Optical constant versus wavelength of MBD-grown ZnSdeposited on BK7 glass at substrate temperatures of 150 C,100 C, and room temperature at a growth rate of 0.2 pLm/h. Theoptical constant data was generated by the modified turning-pointmethod. (a) Refractive index n versus wavelength, (b) extinctioncoefficient k versus wavelength.
Fig. 5. Optical constants versus wavelength of MBD-grown ZnSdeposited on BK7 glass at growth rates of 0.2, 0.5, and 1.0 pum/h ata substrate temperature of 100 0C. The optical constant data wasgenerated by the modified turning-point method. (a) Refractiveindex n versus wavelength, (b) extinction coefficient k versuswavelength.
5624 APPLIED OPTICS / Vol. 32, No. 28 / 1 October 1993
2.60
CXa)
laC
0._
a)
2.55
2.50
2.45
2.40
2.35
2.30
2.25
2.20
nn...
150 :c
Room temperature
100 C
II.I.II. I.I.
0.2 pm/h
u.uuu
1 0.0060.I.'C.2 0.0050
r 0.0040a)8 .0030
C 0.0020
o 0.0010C
w 0.0000
Un nnin
4
150 C
Room temp..__ ~ 100 C
.
. . . . .
r
-v.uv * W

Table 1. Refractive Indices and Extinction Coefficients ofMolecular-Beam-Deposited ZnSe and ZnS grown under
Differential Conditionsa
Substrate Growth Wave- ExtinctionTemperature Rate length Refractive Coefficient
Material (IC)b (pm/h) (nm) Index (x 10-3)
ZnSe R. T. 1.0 500 2.72 < 11000 2.48 < 11500 2.44 < 1
ZnSe R. T. 0.5 500 2.70 < 11000 2.46 < 11500 2.44 < 1
ZnSe 150 1.0 500 2.70 9.01000 2.47 5.01500 2.44 4.8
ZnSe 200 1.0 500 2.71 4.51000 2.47 < 11500 2.44 < 1
ZnS 100 1.0 500 2.40 9.51000 2.28 5.21500 2.26 5.0
ZnS 100 0.5 500 2.40 1.51000 2.26 < 11500 2.25 < 1
ZnS 100 0.2 500 2.51 < 11000 2.37 < 11500 2.36 < 1
aCalculated with the modified turning-point procedure.bR. T., room temperature.
the maximum rate was confined to below 0.3 m/hfor these compounds. The results indicated thatboth CaF2 and BaF2 preferred deposition at elevatedsubstrate temperatures ( 300 0C), while the LiFcould be successfully deposited at room temperatureat a rate of 0.5 m/h. Examples of the curves n(X)and k (X) for LiF are shown in Fig. 6, and selectedexamples are shown in Table 2.
C. Comparison With Conventional Thermal Evaporation
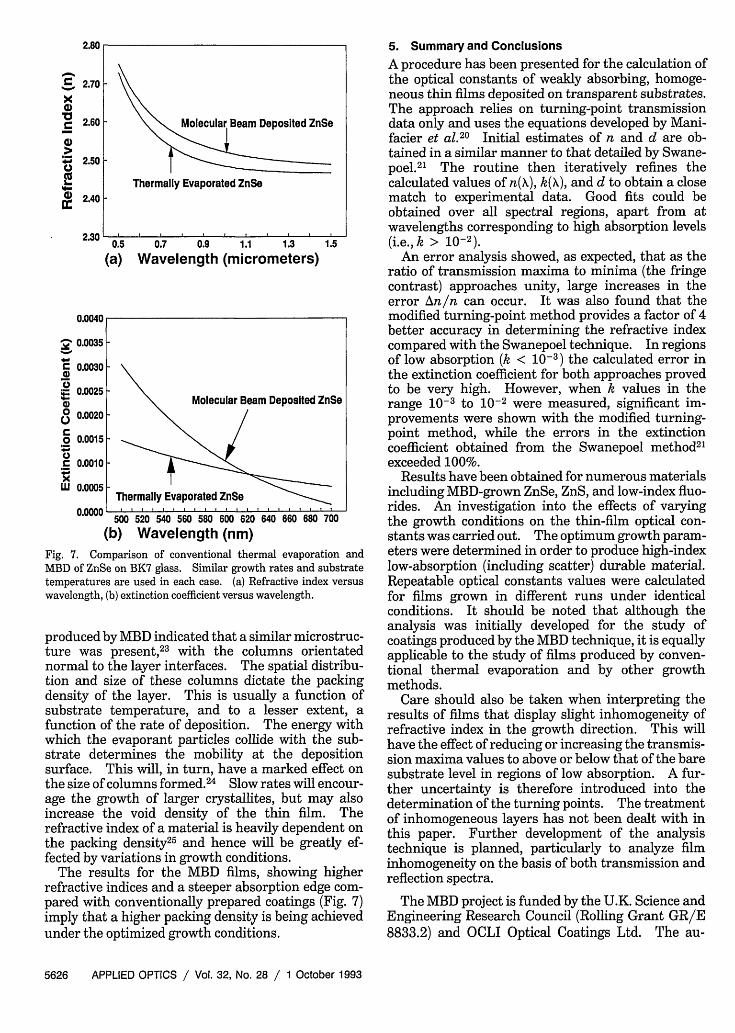
Samples of ZnSe growth by MBD and conventionalthermal evaporation were also analyzed with therefined turning-point method. During deposition,an attempt was made to maintain similar conditionsin both cases, i.e., a growth rate of 1.0 [im/h and asubstrate temperature of 150 0C. A comparison ofthe optical constants obtained is shown in Fig. 7.It can be seen that the MBD film exhibits a higherrefractive index and a sharper absorption edge. Theconventionally evaporated material displays moreresidual absorption in the red part of the spectrum(> 620 nm).
D. Explanation of Results in Terms of Microstructure
These results can be explained in terms of the pro-cesses occuring during the deposition of the material.The structure of the layers is the most significantfactor in determining their optical properties and theway in which these vary with thickness. The exami-nation of coatings by transmission electron micros-copy22 has shown that films invariably possess apronounced columnar structure. A study on films
1.80
-
C
Xa)
a)C
0I.
a)
1.70
1.60
1.50
1.40
1.30
1.20
4.Y
8
.2
0
wC
0.5 0.7 0.9 1.1 1.3
(a) Wavelength (micrometers)
0.5 0.7 0.9 1.1
(b) Wavelength (micrometers)
1.5
1.3
Fig. 6. Optical constants versus wavelength of MBD-grown LiFdeposited on SF11 glass (s 1.7) for substrate temperatures of150 'C and room temperature at a growth rate of 0.5 pum/h. (a)Refractive-index data, (b) extinction coefficient data.
Table 2. Refractive Indices and Coefficients of SelectedMolecular-Beam-Deposited Fluoridesa
Substrate Growth Wave- ExtinctionTemperature Rate length Refractive Coefficient
Material (oC)b (pim/h) (nm) Index (x 10-3)
BaF 2 300 0.2 500 1.48 5.21000 1.45 1.21500 1.43 <1
CaF 2 300 0.2 500 1.55 1.71000 1.54 <11500 1.53 <1
LiF R. T. 0.5 500 1.42 < 11000 1.41 < 11500 1.40 < 1
LiF 150 0.5 500 1.41 1.21000 1.41 < 11500 1.41 < 1
LiF R. T. 0.2 500 1.40 1.21000 1.40 < 11500 1.40 < 1
aCalculated with the modified turning-point procedure.bR. T., room temperature.
1 October 1993 / Vol. 32, No. 28 / APPLIED OPTICS 5625
Room Temperature
150 OC
2.80
C
Xa)
C
a)
0I-I.-
a)
2.70
2.60
2.50
2.40
2.30
u.uuqu -
' 0.0035.'r- 0.0030-
0.0025
8 0.0020
o 0.00150
.C 0.0010
W 0.0005
n nnnn -
0.5 0.7 0.9 1.1 1.3
(a) Wavelength (micrometers)1.5
500 520 540 560 580 600 620 640 660 680 700
(b) Wavelength (nm)Fig. 7. Comparison of conventional thermal evaporation andMBD of ZnSe on BK7 glass. Similar growth rates and substratetemperatures are used in each case. (a) Refractive index versuswavelength, (b) extinction coefficient versus wavelength.
produced by MBD indicated that a similar microstruc-ture was present,23 with the columns orientatednormal to the layer interfaces. The spatial distribu-tion and size of these columns dictate the packingdensity of the layer. This is usually a function ofsubstrate temperature, and to a lesser extent, afunction of the rate of deposition. The energy withwhich the evaporant particles collide with the sub-strate determines the mobility at the depositionsurface. This will, in turn, have a marked effect onthe size of columns formed.2 4 Slow rates will encour-age the growth of larger crystallites, but may alsoincrease the void density of the thin film. Therefractive index of a material is heavily dependent onthe packing density 2 5 and hence will be greatly ef-fected by variations in growth conditions.
The results for the MBD films, showing higherrefractive indices and a steeper absorption edge com-pared with conventionally prepared coatings (Fig. 7)imply that a higher packing density is being achievedunder the optimized growth conditions.
5. Summary and Conclusions
A procedure has been presented for the calculation ofthe optical constants of weakly absorbing, homoge-neous thin films deposited on transparent substrates.The approach relies on turning-point transmissiondata only and uses the equations developed by Mani-facier et al.
2 0 Initial estimates of n and d are ob-tained in a similar manner to that detailed by Swane-poel.2 ' The routine then iteratively refines thecalculated values of n(X), k(X), and d to obtain a closematch to experimental data. Good fits could beobtained over all spectral regions, apart from atwavelengths corresponding to high absorption levels(i.e., k > 10-2).
An error analysis showed, as expected, that as theratio of transmission maxima to minima (the fringecontrast) approaches unity, large increases in theerror An/n can occur. It was also found that themodified turning-point method provides a factor of 4better accuracy in determining the refractive indexcompared with the Swanepoel technique. In regionsof low absorption (k < 10-3) the calculated error inthe extinction coefficient for both approaches provedto be very high. However, when k values in therange 10-3 to 10-2 were measured, significant im-provements were shown with the modified turning-point method, while the errors in the extinctioncoefficient obtained from the Swanepoel method21
exceeded 100%.Results have been obtained for numerous materials
including MBD-grown ZnSe, ZnS, and low-index fluo-rides. An investigation into the effects of varyingthe growth conditions on the thin-film optical con-stants was carried out. The optimum growth param-eters were determined in order to produce high-indexlow-absorption (including scatter) durable material.Repeatable optical constants values were calculatedfor films grown in different runs under identicalconditions. It should be noted that although theanalysis was initially developed for the study ofcoatings produced by the MBD technique, it is equallyapplicable to the study of films produced by conven-tional thermal evaporation and by other growthmethods.
Care should also be taken when interpreting theresults of films that display slight inhomogeneity ofrefractive index in the growth direction. This willhave the effect of reducing or increasing the transmis-sion maxima values to above or below that of the baresubstrate level in regions of low absorption. A fur-ther uncertainty is therefore introduced into thedetermination of the turning points. The treatmentof inhomogeneous layers has not been dealt with inthis paper. Further development of the analysistechnique is planned, particularly to analyze filminhomogeneity on the basis of both transmission andreflection spectra.
The MBD project is funded by the U.K. Science andEngineering Research Council (Rolling Grant GR/E8833.2) and OCLI Optical Coatings Ltd. The au-
5626 APPLIED OPTICS / Vol. 32, No. 28 / 1 October 1993
Molecular Beam Deposited ZnSe
Thermally Evaporated ZnSe
l In I I I I I
Molecular Beam Deposited ZnSe
Thermally Evaporated ZnSeI . . . . .
. . . . . . . . . . . . .
n
v.vw

thors thank I. T. Muirhead, S. P. Fisher, J. F.Leonard, and J. S. Orr for the growth of the samplesand J. G. H. Mathew for his initial method develop-ment work. Paul Meredith acknowledges the sup-port of a SERC CASE award with OCLI OpticalCoatings Ltd. The authors also thank S. D. Smithand K. L. Lewis for regular discussions.
References1. K. L. Lewis and J. A. Savage, "Assessment of coatings
produced by molecular beam techniques," in Proceedings ofSymposium on Laser Induced Damage in Optical Materials,Natl. Bur. Stand. (U.S.) Spec. Publ. 688, 277 (1983).
2. C. H. Hale, I. T. Muirhead, S. P. Fisher, J. S. Orr, J. G. H.Mathew, K. A. Prior, A. C. Walker, and S. D. Smith, "Thegrowth of thin films with high thickness uniformity usingultra-high vacuum molecular beam deposition," J. Vac. Sci.Technol. A 8, 3934-3937 (1990).
3. I. T. Muirhead, A. Miller, K. L. Lewis, J. Staromlynska, and K.Welford, "Molecular beam deposited bistable interferencefilters," in Optical Interference Coatings, Vol. 6 of 1988 OSATechnical Digest Series (Optical Society of America, Washing-ton, D.C., 1988), pp. 245-246.
4. Y. T. Chow, B. S. Wherrett, E. Van Stryland, B. T. McGuckin,D. C. Hutchings, J. G. H. Mathew, A. Miller, and K. L. Lewis,"Continuous-wave laser-pumped optical bistability in ther-mally deposited and molecular beam grown ZnSe interferencefilters," J. Opt. Soc. Am. B 3, 1535-1539 (1986).
5. R. J. Campbell, G. S. Buller, J. G. H. Mathew, S. D. Smith, andA. C. Walker, "Irradiation induced switch power drift inoptically bistable interference filters at 514 and 830 nm," Appl.Opt. 29, 638-643 (1990).
6. L. I. Maisel and R. Glang, eds., Handbook of Thin FilmTechnology (McGraw-Hill, New York, 1970).
7. B. A. Movchan and A. V. Demchisin, Fiz. Met. Metalloved. 28,653-660 (1969).
8. W. Heitman, "The influence of various parameters on therefractive index of evaporated dielectric films," Appl. Opt. 7,1541-1543 (1968).
9. A. Vasicek, Optics of Thin Films (North-Holland, Amsterdam,1960).
10. S. Tolansky, Multiple Beam Interferometry of Surfaces andFilms (Claredon, Oxford, 1983).
11. 0. S. Heavens, Optical Properties of Thin Solid Films (Butter-worth, London, 1955).
12. H. A. Macleod, Thin Film Optical Filters (Hilger, Bristol, UK,1986).
13. E. D. Palik, ed., Handbook of Optical Constants of Solids(Academic, London, 1985), Vols. 1 and 2.
14. F. Abeles, "Methods for determining optical parameters ofthin films," in Progress in Optics, E. Wolf, ed. (North-Holland,Amsterdam, 1963), Vol. 2.
15. J. F. Hall and W. F. C. Fergusson, "Optical properties ofcadmium sulfide and zinc sulfide from 0.6 micron to 14microns," J. Opt. Soc. Am. 45,714-718 (1955).
16. R. E. Denton, R. D. Campbell, and S. G. Tomlin, "Thedetermination of the optical constants of thin films frommeasurements of reflectance and transmittance at normalincidence," J. Appl. Phys. D 5, 852-863 (1972).
17. J. M. Bennett and M. J. Booty, "Computational method fordetermining n & k for a thin film from measured reflectance,transmittance and film thickness," Appl. Opt. 5,41-43 (1966).
18. S. P. Lyashenko and V. K. Miloslavskii, "A simple method forthe determination of thickness and optical constants of semi-conducting the dielectric layers," Opt. Spectrosc. (USSR) 16,80-81 (1964).
19. A. S. Valeev, "Determination of the optical constants of weaklyabsorbing thin films," Opt. Spectrosc. (USSR) 15, 269-274(1963).
20. J. C. Manifacier, J. Gasiot, and J. P. Fillard, "A simple methodfor the determination of the optical constants, n, k, and thethickness of a weakly absorbing thin film," J. Phys. E 9,1002-1004(1976). a L
21. R. Swanepoel, "Determination of the thickness and opticalconstants of amorphous silicon," J. Phys. E 16, 1214-1222(1983).
22. J. M. Pearson, "Electron microscopy of multilayer thin films,"Thin Solid Films 6, 349-358 (1970).
23. K. L. Lewis, A. M. Pitt, N. G. Chew, A. G. Cullis, T. J.Wyatt-Davis, L. Charlwood, 0. D. Dosser, and I. T. Muirhead,"Fabrication of fluoride thin films using ultra-high vacuumtechniques," in Proceedings of Laser Induced Damage inOptical Materials, Natl. Inst. Stand. Technol. Spec. Publ. 752,365 (1986).
24. A. G. Dirks, and H. J. Leamy, "Columnar microstructure invapor deposited thin films," Thin Solid Films 47, 219-233(1977).
25. M. Harris, H. A. Macleod, and S. Ogura, "The relationshipbetween thin film structure and inhomogeneity," Thin SolidFilms 57, 173-178 (1978).
1 October 1993 / Vol. 32, No. 28 / APPLIED OPTICS 5627