Improved Dredge Material Management for the Great Barrier ... · SKM 2013, Improved dredge material...
100
Improved Dredge Material Management for the Great Barrier Reef Region Synthesis Report Sinclair Knight Merz Pty Ltd (SKM) Asia-Pacific Applied Science Associates (APASA) Revision 1.3 15 July 2013
Transcript of Improved Dredge Material Management for the Great Barrier ... · SKM 2013, Improved dredge material...
Improved Dredge Material Management for the Great Barrier Reef Region
Synthesis Report
Sinclair Knight Merz Pty Ltd (SKM)
Asia-Pacific Applied Science Associates (APASA)
Revision 1.3
15 July 2013
i
© Commonwealth of Australia 2013 Published by the Great Barrier Reef Marine Park Authority 2013 ISBN 978 1 922126 14 6 (ebook)
This work is copyright. You may download, display, print and reproduce this material in unaltered form only (appropriately acknowledging this source) for your personal, non-commercial use or use within your organisation. Apart from any use as permitted under the Copyright Act 1968, all other rights are reserved. Disclaimer
The views and opinions expressed in this publication are those of the authors and do not necessarily reflect those of the Australian Government or the Minister for Sustainability, Environment, Water, Population and Communities.
While reasonable efforts have been made to ensure that the contents of this publication are factually correct, the Australian Government does not accept responsibility for the accuracy or completeness of the contents, and shall not be liable for any loss or damage that may be occasioned directly or indirectly through the use of, or reliance on, the contents of this publication. National Library of Australia Cataloguing-in-Publication entry
Sinclair Knight Merz (Firm). Improved dredge material management for the Great Barrier Reef Region / Sinclair Knight Merz Pty Ltd (SKM); Asia-Pacific Applied Science Associates (APASA). ISBN 978 1 922126 14 6 (ebook) Dredging spoil--Environmental aspects--Queensland--Great Barrier Reef. Dredging spoil--Queensland--Great Barrier Reef--Management. Spoil banks--Environmental aspects--Queensland--Great Barrier Reef. Spoil banks--Queensland--Great Barrier Reef--Management. Dredging--Environmental aspects--Queensland--Great Barrier Reef. Dredging--Risk management--Queensland--Great Barrier Reef. Water quality management--Queensland--Great Barrier Reef. Hydrodynamic receptors. Asia-Pacific Applied Science Associates. Great Barrier Reef Marine Park Authority. 363.7284 This publication should be cited as: SKM 2013, Improved dredge material management for the Great Barrier Reef Region, Great Barrier Reef Marine Park Authority, Townsville. Acknowledgement This report was supported with funding from the Department of Sustainability, Environment, Water,
Population, and Communities through the Sustainable Regional Development Program.
Requests and enquiries concerning reproduction and rights should be addressed to:
Great Barrier Reef Marine Park Authority 2-68 Flinders Street (PO Box 1379) Townsville QLD 4810, Australia
Phone: (07) 4750 0700 Fax: (07) 4772 6093 Email: [email protected] www.gbrmpa.gov.au

ii
DOCUMENT HISTORY AND STATUS
Revision Date
issued Author(s) Reviewed
by Approved
by Date
approved Revision type
A 20/6/13 C Bailey, M Yeates
M Huber M Huber 21/6/13 Draft
0 21/6/13 C Bailey, M Yeates
M Huber M Huber 21/6/13 Draft for client comments
1 28/6/13 C Bailey, M Yeates
M Yeates M Yeates 28/6/13 Final
1.1 3/7/13 C Bailey, M Yeates
M Yeates M Yeates 3/7/13 Revised Final
1.2 10/7/13 C Bailey, M Yeates
M Yeates M Yeates 10/7/13 Revised Final
1.3 15/7/13 C Bailey, M Yeates
M Yeates M Yeates 15/7/13 Revised Final
iii
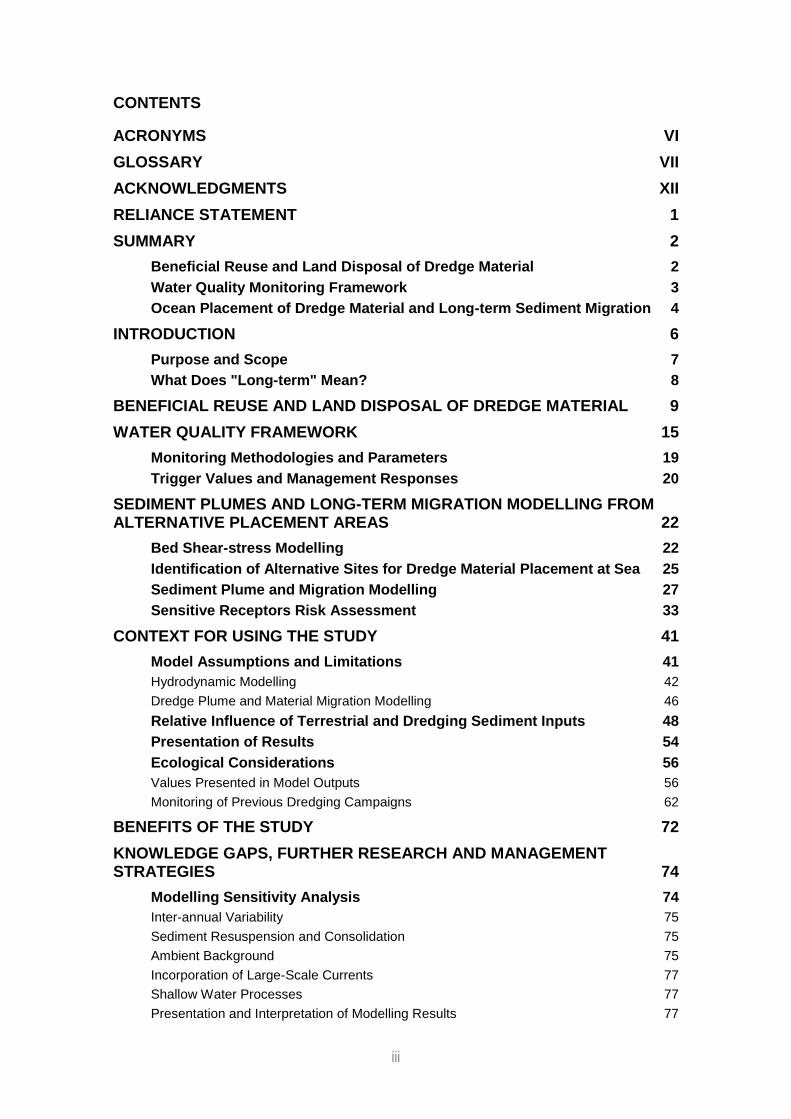
CONTENTS
ACRONYMS VI
GLOSSARY VII
ACKNOWLEDGMENTS XII
RELIANCE STATEMENT 1
SUMMARY 2
Beneficial Reuse and Land Disposal of Dredge Material 2
Water Quality Monitoring Framework 3
Ocean Placement of Dredge Material and Long-term Sediment Migration 4
INTRODUCTION 6
Purpose and Scope 7
What Does "Long-term" Mean? 8
BENEFICIAL REUSE AND LAND DISPOSAL OF DREDGE MATERIAL 9
WATER QUALITY FRAMEWORK 15
Monitoring Methodologies and Parameters 19
Trigger Values and Management Responses 20
SEDIMENT PLUMES AND LONG-TERM MIGRATION MODELLING FROM ALTERNATIVE PLACEMENT AREAS 22
Bed Shear-stress Modelling 22
Identification of Alternative Sites for Dredge Material Placement at Sea 25
Sediment Plume and Migration Modelling 27
Sensitive Receptors Risk Assessment 33
CONTEXT FOR USING THE STUDY 41
Model Assumptions and Limitations 41
Hydrodynamic Modelling 42
Dredge Plume and Material Migration Modelling 46
Relative Influence of Terrestrial and Dredging Sediment Inputs 48
Presentation of Results 54
Ecological Considerations 56
Values Presented in Model Outputs 56
Monitoring of Previous Dredging Campaigns 62
BENEFITS OF THE STUDY 72
KNOWLEDGE GAPS, FURTHER RESEARCH AND MANAGEMENT STRATEGIES 74
Modelling Sensitivity Analysis 74
Inter-annual Variability 75
Sediment Resuspension and Consolidation 75
Ambient Background 75
Incorporation of Large-Scale Currents 77
Shallow Water Processes 77
Presentation and Interpretation of Modelling Results 77
iv
Direct Sediment Resuspension and Consolidation Studies 77
Improved Understanding of Operational Mitigation Measures 78
A Strategic Approach to Monitoring 79
Methods to Assess Cumulative Impacts and Resilience 79
Beneficial Reuse of Dredge Material 79
REFERENCES 80
APPENDIX A LITERATURE REVIEW AND COST ANALYSIS 82
APPENDIX B WATER QUALITY FRAMEWORK 83
APPENDIX C BED SHEAR-STRESS MODELLING 84
APPENDIX D IDENTIFICATION OF ALTERNATIVE SITES FOR DREDGE MATERIAL PLACEMENT AT SEA 85
APPENDIX E SEDIMENT PLUME AND MIGRATION MODELLING 86
APPENDIX F SENSITIVE RECEPTORS RISK ASSESSMENT 87
FIGURES
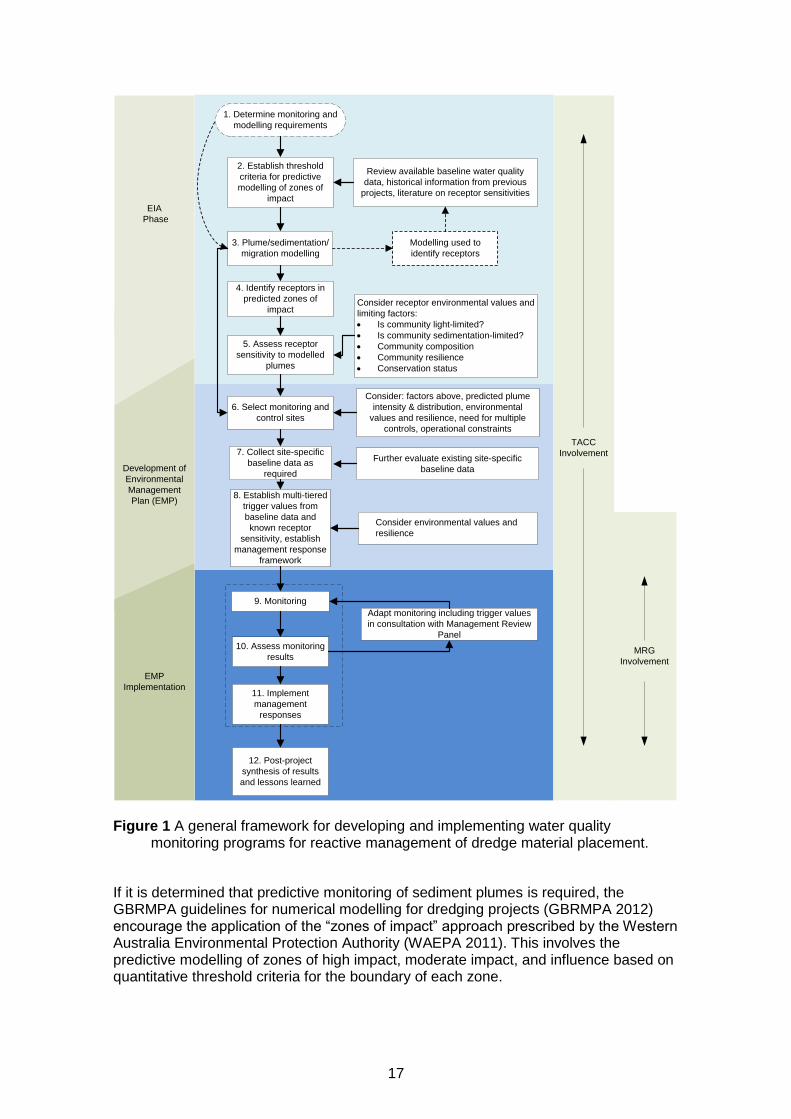
Figure 1 A general framework for developing and implementing water quality monitoring programs for reactive management of dredge material placement. 17
Figure 2. Snapshot of predicted current fields with (top) and without (bottom) including large-scale current forcing in the Gladstone study area. The high current speeds south of Gladstone reflect forcing by tides and waves. The high current speeds to the north in the top figure reflect the influence of the large-scale currents as well as tides and local winds. The dramatic decrease in current speeds near shore in the top panel results from the cut-off in applying large-scale current forcing at the 10 m depth contour. 43
Figure 3.Total sedimentation at day 30 of the Abbot Point placement scenario at the current placement site, including large-scale current forcing. 44
Figure 4.Total sedimentation at day 30 of the Abbot Point placement scenario at the current placement site, without large-scale current forcing. 45
Figure 5. Imaginary zoomed-in view of a section of the model grid. The number in each cell represents the per cent of time during the model run each cell experiences a TSS concentration of 5 mg/L. The blue line shows the 50
th percentile contour for 5mg/L TSS. 55
Figure 6. Presentation of the imaginary results in figure 34 as a shaded area. Areas in the darker blue area experience 5 mg/L TSS more than 50 per cent of the time, those in the light blue area less than 50 per cent of the time. 56
Figure 7. Total sedimentation (top) and sedimentation rate (bottom) at Abbot Point Time Series 1 site (see Appendix F Sensitive Receptors Risk Assessment, figure 69). 60
Figure 8. Total sedimentation (top) and sedimentation rate (bottom) at Abbot Point Time Series 2 Site (see Appendix F Sensitive Receptors Risk Assessment, figure 69). 61
Figure 9. Large scale current rose diagrams for El Niño (2004), La Niña (2011) and neutral (2007) years at the five ports. 76

v
TABLES
Table 1. Summary of port-specific options for placement of dredge material on land. 10
Table 2. Estimated TSS inputs (kt/y) from ten major river catchments. 50
Table 3.Volumes and dry mass of dredged material envisioned over 25 years at the six locations. 51
Table 4. Summary of comparisons of dredging volumes as a relative increase over river inputs, based on the estimates of Kroon et al. (2009, 2012). Relative increases would be slightly smaller using the river input estimates of Joo et al. (2012). 53
Table 5. Summary of ecological monitoring of dredging and material placement in the six locations. 63
vi
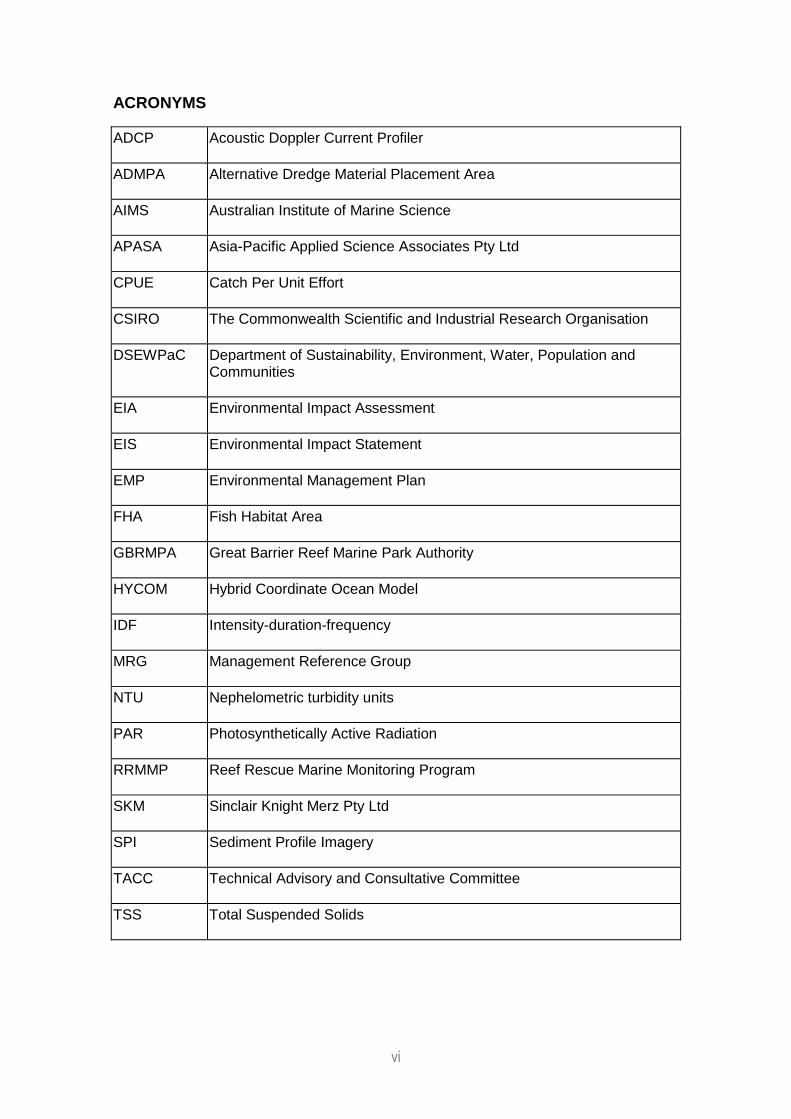
ACRONYMS
ADCP Acoustic Doppler Current Profiler
ADMPA Alternative Dredge Material Placement Area
AIMS Australian Institute of Marine Science
APASA Asia-Pacific Applied Science Associates Pty Ltd
CPUE Catch Per Unit Effort
CSIRO The Commonwealth Scientific and Industrial Research Organisation
DSEWPaC Department of Sustainability, Environment, Water, Population and Communities
EIA Environmental Impact Assessment
EIS Environmental Impact Statement
EMP Environmental Management Plan
FHA Fish Habitat Area
GBRMPA Great Barrier Reef Marine Park Authority
HYCOM Hybrid Coordinate Ocean Model
IDF Intensity-duration-frequency
MRG Management Reference Group
NTU Nephelometric turbidity units
PAR Photosynthetically Active Radiation
RRMMP Reef Rescue Marine Monitoring Program
SKM Sinclair Knight Merz Pty Ltd
SPI Sediment Profile Imagery
TACC Technical Advisory and Consultative Committee
TSS Total Suspended Solids
vii
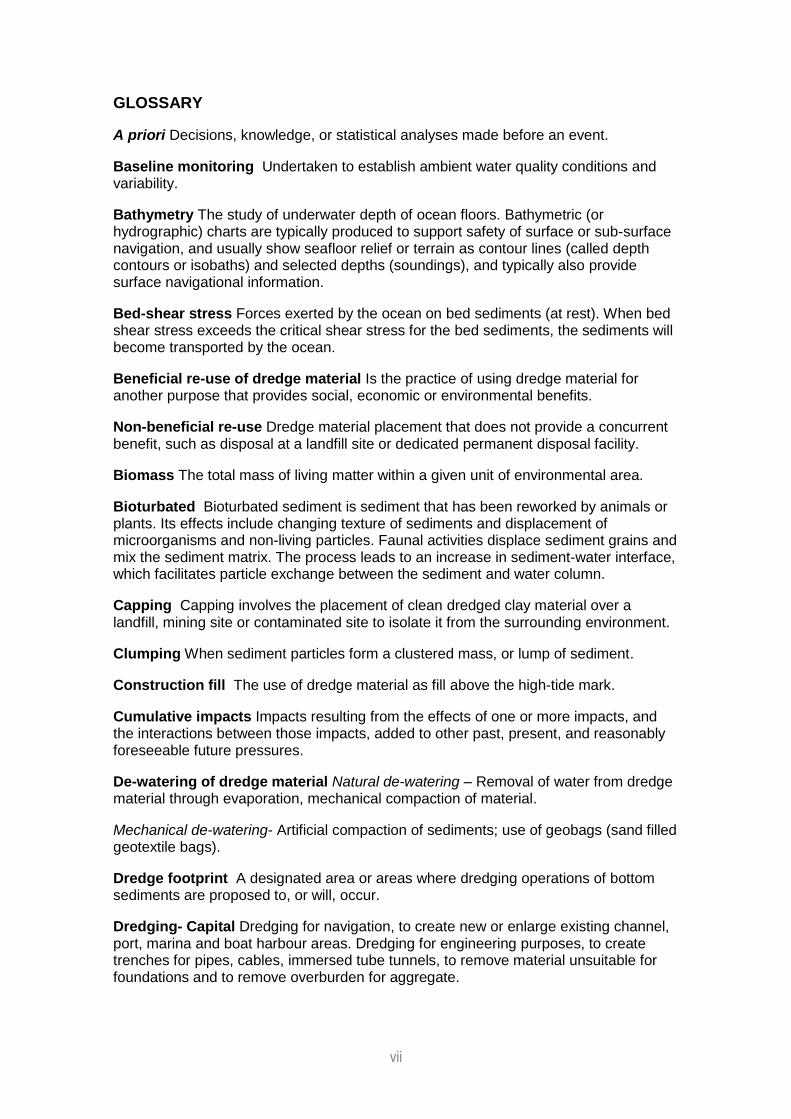
GLOSSARY
A priori Decisions, knowledge, or statistical analyses made before an event.
Baseline monitoring Undertaken to establish ambient water quality conditions and variability.
Bathymetry The study of underwater depth of ocean floors. Bathymetric (or hydrographic) charts are typically produced to support safety of surface or sub-surface navigation, and usually show seafloor relief or terrain as contour lines (called depth contours or isobaths) and selected depths (soundings), and typically also provide surface navigational information.
Bed-shear stress Forces exerted by the ocean on bed sediments (at rest). When bed shear stress exceeds the critical shear stress for the bed sediments, the sediments will become transported by the ocean.
Beneficial re-use of dredge material Is the practice of using dredge material for another purpose that provides social, economic or environmental benefits.
Non-beneficial re-use Dredge material placement that does not provide a concurrent benefit, such as disposal at a landfill site or dedicated permanent disposal facility.
Biomass The total mass of living matter within a given unit of environmental area.
Bioturbated Bioturbated sediment is sediment that has been reworked by animals or plants. Its effects include changing texture of sediments and displacement of microorganisms and non-living particles. Faunal activities displace sediment grains and mix the sediment matrix. The process leads to an increase in sediment-water interface, which facilitates particle exchange between the sediment and water column.
Capping Capping involves the placement of clean dredged clay material over a landfill, mining site or contaminated site to isolate it from the surrounding environment.
Clumping When sediment particles form a clustered mass, or lump of sediment.
Construction fill The use of dredge material as fill above the high-tide mark.
Cumulative impacts Impacts resulting from the effects of one or more impacts, and the interactions between those impacts, added to other past, present, and reasonably foreseeable future pressures.
De-watering of dredge material Natural de-watering – Removal of water from dredge material through evaporation, mechanical compaction of material.
Mechanical de-watering- Artificial compaction of sediments; use of geobags (sand filled geotextile bags).
Dredge footprint A designated area or areas where dredging operations of bottom sediments are proposed to, or will, occur.
Dredging- Capital Dredging for navigation, to create new or enlarge existing channel, port, marina and boat harbour areas. Dredging for engineering purposes, to create trenches for pipes, cables, immersed tube tunnels, to remove material unsuitable for foundations and to remove overburden for aggregate.
viii
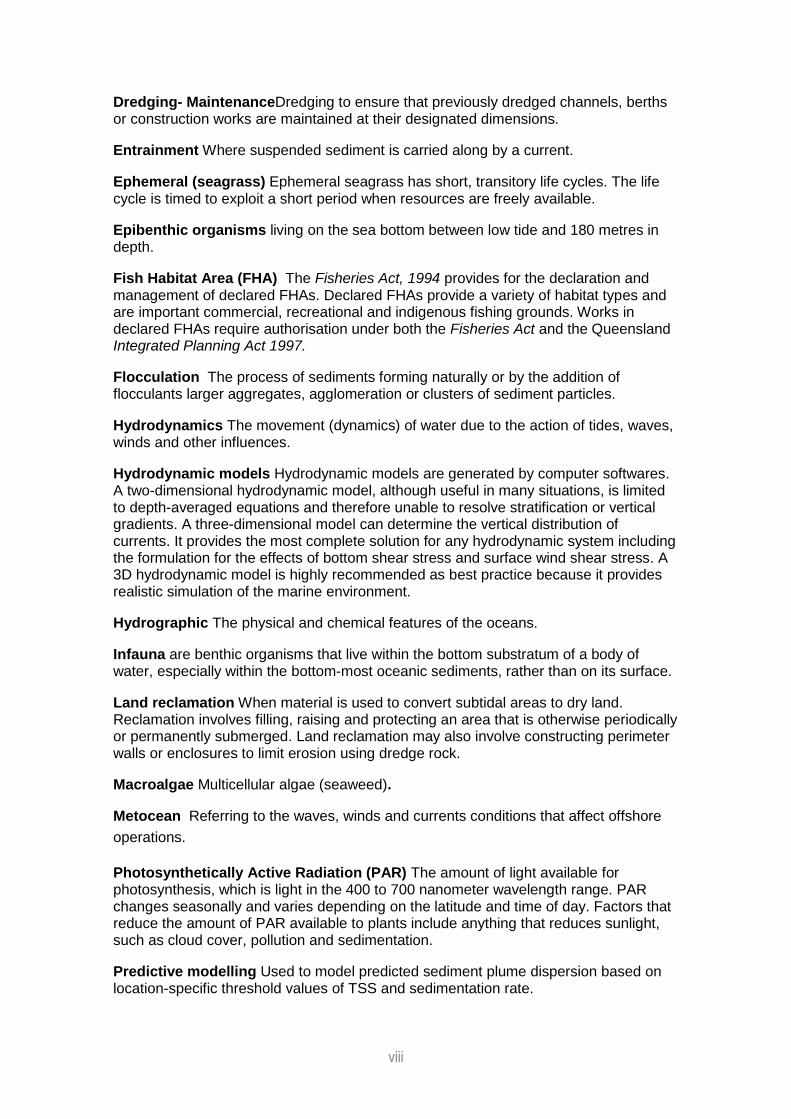
Dredging- MaintenanceDredging to ensure that previously dredged channels, berths or construction works are maintained at their designated dimensions.
Entrainment Where suspended sediment is carried along by a current.
Ephemeral (seagrass) Ephemeral seagrass has short, transitory life cycles. The life cycle is timed to exploit a short period when resources are freely available.
Epibenthic organisms living on the sea bottom between low tide and 180 metres in depth.
Fish Habitat Area (FHA) The Fisheries Act, 1994 provides for the declaration and management of declared FHAs. Declared FHAs provide a variety of habitat types and are important commercial, recreational and indigenous fishing grounds. Works in declared FHAs require authorisation under both the Fisheries Act and the Queensland Integrated Planning Act 1997.
Flocculation The process of sediments forming naturally or by the addition of flocculants larger aggregates, agglomeration or clusters of sediment particles.
Hydrodynamics The movement (dynamics) of water due to the action of tides, waves, winds and other influences.
Hydrodynamic models Hydrodynamic models are generated by computer softwares. A two-dimensional hydrodynamic model, although useful in many situations, is limited to depth-averaged equations and therefore unable to resolve stratification or vertical gradients. A three-dimensional model can determine the vertical distribution of currents. It provides the most complete solution for any hydrodynamic system including the formulation for the effects of bottom shear stress and surface wind shear stress. A 3D hydrodynamic model is highly recommended as best practice because it provides realistic simulation of the marine environment.
Hydrographic The physical and chemical features of the oceans.
Infauna are benthic organisms that live within the bottom substratum of a body of water, especially within the bottom-most oceanic sediments, rather than on its surface.
Land reclamation When material is used to convert subtidal areas to dry land. Reclamation involves filling, raising and protecting an area that is otherwise periodically or permanently submerged. Land reclamation may also involve constructing perimeter walls or enclosures to limit erosion using dredge rock.
Macroalgae Multicellular algae (seaweed).
Metocean Referring to the waves, winds and currents conditions that affect offshore
operations.
Photosynthetically Active Radiation (PAR) The amount of light available for photosynthesis, which is light in the 400 to 700 nanometer wavelength range. PAR changes seasonally and varies depending on the latitude and time of day. Factors that reduce the amount of PAR available to plants include anything that reduces sunlight, such as cloud cover, pollution and sedimentation.
Predictive modelling Used to model predicted sediment plume dispersion based on location-specific threshold values of TSS and sedimentation rate.
ix
Reactive management (in relation to water quality monitoring) Links water quality monitoring to monitoring of ecological responses. The aim of reactive management is to provide for management action to prevent or minimise ecological impact due to reduced water quality through establishing reactive trigger values, determining whether exceedance of those trigger values results from dredging/disposal and implementing management responses accordingly. Reactive management generally requires that water quality monitoring sites are linked to ecological receptor monitoring sites and requires a priori specification of trigger values and management response hierarchies.
Multi-tiered reactive management A tiered approach to management allows for a series of management responses ranging from further investigation in the first instance up to, if necessary, the cessation of dredge material placement operations.
Scavenging when chemical elements in the ocean are rapidly sorbed onto sinking particles and removed to the sediments. The concentrations of scavenged elements generally decrease with time. External processes will markedly change the concentration of these elements because inputs or outputs are large relative to rates of mixing.
Scour changes on the bed of the ocean. The frequent movement of water can lead to a scouring effect.
Sedimentation The deposition or accumulation of sediment either on the seabed or in the water column. Deposition on the seabed is calculated as a probability function of the prevailing bottom stress, local sediment concentration and size class. Sediment that is deposited may subsequently be resuspended into the lower water column if critical levels of bottom stress are exceeded.
Sedimentation rate (mg/cm2/d) The amount of sediment depositing or accumulating on the ocean floor per unit time, in milligrams per square centimetre per day.
Sediment consolidation is important in cohesive sediment transport. Primary consolidation is caused by the self-weight of sediment, as well as the deposition of additional materials. Primary consolidation begins when the self-weight of the sediment exceeds the seepage force induced by the upward flow of pore water from the underlying sediment. Primary consolidation ends when the seepage force has completely dissipated. Secondary consolidation is caused by the plastic deformation of the seabed under a constant overburden. It begins during the primary consolidation and may last for weeks or months.
Sediment plume spatial extents For this project spatial extents of sediment plumes associated with dredge material placement are modelled and expressed as median (50th percentile) and 95th percentile contours of a range of values of TSS (mg/L) and sedimentation rate (mg/cm2/d).
Median (50th percentile) contours represent “average” conditions, for example a 5 mg/L TSS median contour shows locations where 5 mg/L is predicted to occur 50 per cent of the time during the modelling period. Areas enclosed by the contour are predicted to experience TSS concentrations ≥ 5 mg/L more than half the time. Areas outside the contour are predicted to experience 5 mg/L TSS less than half the time during the modelling period.
The 95th percentile contours represent conditions 5 per cent of the time. For example, areas outside the 95th percentile contour for 10 mg/cm2/d sedimentation rate are predicted to experience sedimentation of this intensity less than 5 per cent of the time during the dredge material placement campaign.
x
Sediment resuspension threshold The critical bed shear-stress necessary to resuspend sediment particles of a given size into the water column.
Sedimentation rate (mg/cm2/d). The amount of sediment depositing or accumulating on the ocean floor per unit time, in milligrams per square centimetre per day.
Sediment transport The movement of solid particles (sediment), typically due to a combination of the force of gravity acting on the sediment, and the movement of the fluid in which the sediment is entrained. Sediment transport is affected by a range of oceanographic factors including waves, currents and tides.
Sediment transport rate For this project sediment transport rates were calculated using a hydrodynamic model applying the influences of large-scale current model predictions, tides and local winds. The influences of these variables on hydrodynamics and sediment transport were incorporated into the model by including vectors (the direction or course followed).
Sensitive Receptors (sensitive marine environmental receptors) Certain key reef marine organisms, habitats and communities are sensitive to dredging and at-sea dredge material placement activities. Coral reefs, seagrass, macroalgal and macroinvertebrate communities are ‘sensitive receptors’ that occur within the vicinity of Great Barrier Reef Region ports. Impacts can result from both direct effects, for example burial by dredge material and indirect effects such as reductions in light availability to corals or seagrasses due to elevated suspended sediment concentrations in the water column. Reduced health of these sensitive receptors could negatively impact on the world heritage values of the Great Barrier Reef.
Sentinel sites Are located at the boundaries of modelled zones of impact. These are particularly important for large projects, especially if a zone of high impact is predicted, it may be useful to place sensitive receptor monitoring sites within “sentinel sites” at the boundaries of model-predicted zones of influence and impact.
Shoaling The bottom effect which influences the height of waves moving from deep to shallow water.
Special Management Areas (SMA) SMAs have been developed in the Great Barrier Reef Marine Park to allow implementation of appropriate management strategies in addition to the current Zoning Plans. SMAs include conservation areas such as Dugong Protection Areas, public safety, public appreciation and emergency outbreaks.
Surface current roses A diagrammatic representation of the proportion and rate range (in metres/second) of daily current records flowing to a given direction.
Suspended sediment concentration Total Suspended Solids (TSS) (mg/L) The concentration of sediment suspended in seawater (not dissolved), expressed in milligrams of dry sediment per litre of water-sediment mixture (mg/L).
Tidal forcing The term tidal force is used to describe the forces due to tidal acceleration. Tidal forcings are one component driving hydrodynamic and hydrographic condtions.
Total sedimentation (mg/cm2) The amount of dredge material deposited on the seabed in milligrams per square centimetre. For example, total sedimentation of 5 mg/cm2 equates to a sediment thickness of 0.05 mm.
xi
Trigger values In relation to Sensitive Receptors. For a given environmental parameter, such as, for example TSS or turbidity caused by dredging or dredge material placement; the trigger value is the level in the environment at which, if a Sensitive Receptor is exposed, it would not be resilient to disturbance. Trigger values may also refer to levels of environmental parameters that, if exceeded, require a defined management response during dredging and material placement operations.
Trigger values In relation to water quality and sensitive environmental receptors. For a given environmental parameter, such as, for example TSS, turbidity or reduced Photosynthetically Active Radiation caused by dredging or dredge material placement; the trigger value is the level in the environment at which, if a Sensitive Receptor is exposed, it would not be resilient to disturbance. Trigger values may also refer to levels of environmental parameters that, if exceeded, require a defined management response during dredging and material placement operations. It is possible to establish trigger values based on the known tolerance of receptors to diminished water quality. For example, one project established light-based triggers for seagrass receptors in the Gladstone region. Minimum light requirements, duration in which seagrass could tolerate light deprivation and the required recovery period from light deprivation was quantitatively established. As coral communities often include many more species than seagrass communities, and coral species differ widely in tolerance to light deprivation and sedimentation, it is more difficult to use known tolerance to set trigger values for coral communities.
Turbidity Turbidity is a measure of the degree to which the water loses its transparency due to the presence of suspended particulates. The more total suspended solids in the water, the higher the turbidity. There are various parameters influencing the cloudiness of the water. Some of these are: sediments, phytoplankton, resuspended sediments from the bottom, waste discharge, algae growth and urban runoff.
Turbidity is measured in NTU: Nephelometric Turbidity Units using a nephelometer, which measures the intensity of light scattered at 90 degrees as a beam of light passes through a water sample.
Wave-induced liquefaction is an important factor for analysing the seabed and designing marine structures. As waves propagate and fluctuate over the ocean surface, energy is carried within the medium of the water particles. This energy could be transmitted to the seabed, which results in the complex mechanisms of marine sediment stability and behaviour and significantly affects the stability of the seabed.
Wind forcing (wind load) The speed of the wind or wind velocity acts as pressure when it meets with a structure. The intensity of that pressure is the wind load. Wind load (force) is calculated with the general formula.
Windload (force) = Area x Wind Pressure x drag coefficient.
Zones of Impact Are established through predictive modelling of sediment plumes zones of high impact, moderate impact and influence based on quantitative threshold criteria for the boundary of each zone can be established.

xii
ACKNOWLEDGMENTS
The Department of Sustainability, Environment, Water, Population and Communities (DSEWPaC) funded the work contained in this report and the Great Barrier Reef Marine Park Authority is gratefully acknowledged for commissioning and defining the scope of work and for their assistance during the project. We would also like to thank all of the attendees at the risk assessment workshops for the Port of Gladstone, Hay Point, Abbot Point, Townsville, Cairns and Rosslyn Bay State Boat Harbour for their input and engagement, provision of data and information, and prompt feedback.
1
RELIANCE STATEMENT
This report has been prepared pursuant to the Contract between Sinclair Knight Merz Pty Limited (SKM) and the Great Barrier Reef Marine Park Authority (the Client) dated 18 September 2012 as varied on 21 November 2012, 14 March 2013 and 17 June 2013 (the Contract). The scope of this report and associated services performed by SKM was developed with the Client to meet the specific needs of the project.
In preparing this report, SKM has relied upon, and presumed accurate, information (or confirmation of the absence thereof) provided by the Client and/or other sources including port authorities. Except as otherwise stated in the report, SKM has not attempted to verify the accuracy or completeness of such information. If the information relied upon by SKM as at the date of issue of this report is subsequently determined to be false, inaccurate or incomplete, then it is possible that the accuracy of SKM’s observations and conclusions expressed in this report may be affected.
SKM warrant that it has prepared this report in accordance with the usual care and thoroughness of the consulting profession, by reference to applicable standards, guidelines, procedures and practices and information sourced at the date of issue of this report. No other warranty or guarantee, whether expressed or implied, is made as to the data, observations, and findings expressed in this report, to the extent permitted by law except as provided for in the Contract between SKM and the Client.
SKM strongly recommends that this report should be read in full and no excerpts be interpreted as representative of the findings. Except as provided for in the Contract, no responsibility is accepted by SKM for use of any part of this report in any other context.
This report has been prepared on behalf of, SKM’s Client, and is subject to, and issued in accordance with, the provisions of the Contract between SKM and the Client. SKM accepts no liability or responsibility whatsoever for any use of, or reliance upon, this report by any third party but this does not affect the obligation on SKM to indemnify the Client in accordance with the terms of the Contract.
2
SUMMARY
The Australian and Queensland Governments have agreed to undertake a comprehensive strategic assessment to identify, plan for, and manage risks within the Great Barrier Reef World Heritage Area (World Heritage Area) and adjacent coastal zone. The comprehensive strategic assessment comprises two elements. One is the Great Barrier Reef Coastal Zone Strategic Assessment, being undertaken by the Queensland Government. The other is the Great Barrier Reef Region Strategic Assessment being led by the Great Barrier Reef Marine Park Authority (GBRMPA). The comprehensive strategic assessment considers direct, indirect and cumulative impacts of actions on matters of national environmental significance as defined by the Environment Protection and Biodiversity Conservation Act 1999, the effectiveness of existing environmental management arrangements, and the need for improved management strategies.
The GBRMPA commissioned Sinclair Knight Merz (SKM) and Asia-Pacific Applied Science Associates (APASA) to complete the ‘Improved Dredge Material Management for the Great Barrier Reef Region’ project. The project has focused on six study areas within 50 km of:
Port of Gladstone
Rosslyn Bay State Boat Harbour
Port of Hay Point
Port of Abbot Point
Port of Townsville
Port of Cairns.
The project comprised three main tasks:
A literature review, cost analysis, and review of options for beneficial reuse and land disposal of dredge material in the six study areas
Development of a generic framework for reactive water quality monitoring and management programs during dredging and disposal material placement operations
Identification of potential alternative dredge material placement areas in the six study areas, and comparative assessment of environmental risks from sediment plumes and long-term migration of sediment from these hypothetical alternatives, as well as currently used placement sites.
The purpose of this report is to present a systematic summary of the previous studies completed for the ‘Improved Dredge Material Management for the Great Barrier Reef Region’ (SKM 2013a, 2013b; SKM APASA 2013a, 2013b, 2013c, 2013d). The final reports of each study component are included as Appendices to this report (see Appendices A - F).
Beneficial Reuse and Land Disposal of Dredge Material
The study reviewed potential options for beneficial reuse or land disposal of dredge material in the six study areas. These options included use of the material for land reclamation, construction fill, mine rehabilitation, beach nourishment, shoreline protection and erosion control, soil improvement for agriculture, forestry, aquaculture or parks and recreation, habitat restoration and landfill site capping. The study also
3
considered options for permanent disposal of the material at existing landfill sites or dedicated permanent disposal facilities.
The assessment of options was based on:
Geotechnical characteristics of the expected dredge material
Anticipated volumes of dredge material
Habitat characteristics and land uses surrounding the six study locations
Demand for the identified uses surrounding the locations.
The study also estimated the likely range of costs per cubic metre for transporting, handling, and treating material in each of the locations, but did not assess the feasibility of land-based options on economic grounds.
The study found that beneficial reuse or land disposal at the six locations are unlikely to be viable as a strategy for overall management of dredge material in the long term. This is largely because much of the expected material, particularly that from maintenance dredging, is dominated by silts and clays. These are unsuitable for some uses (e.g. beach nourishment). For a number of other uses the material would require dewatering in relatively thin layers for subsequent handling and transport, and there is a lack of available land for treating the material nearby the six locations, and relative to the predicted volumes of dredge material over 25 years. Engineering constraints also limit the options for use of the dredge material on land.
At some ports, particularly for capital dredging of rocky or sandy material, there may be options for beneficial reuse. These require careful assessment on a case-by-case basis, which should include consideration of opportunities to make use of new treatment technologies or find innovative uses for the material. There should be continuing research on new treatment technologies and innovative approaches to beneficial reuse. Successful innovation has the potential to reduce the proportion of the overall volume of dredge material that is placed at sea.
Future coastal development could create new opportunities for beneficial reuse. As part of a broader regional management strategy, it may be possible to identify economic development options that expand the use of and increase demand for dredge material. It would also be beneficial to involve local councils in identifying potential uses and placement sites for dredge material.
Water Quality Monitoring Framework
The study developed a general framework for developing water quality monitoring programs for dredging and material placement projects. The framework is aimed at reactive management, that is, at detecting potentially stressful water quality conditions in time to take management actions to prevent or minimise ecological impacts. The framework includes three phases:
Environmental Impact Assessment including hydrodynamic modelling to predict the potential scale of impact and identify potentially affected ecological receptors and their sensitivity
Development of an Environmental Management Plan (EMP) to identify appropriate impact and control sites, set quantitative water quality values that will trigger specific management actions, taking into account expected ecosystem sensitivity and resilience
Implementation of the EMP during dredging and disposal operations.
4
Most importantly, a major outcome of the study has been to identify the potential for dredge material to migrate over larger spatial scales and longer time scales than had previously been appreciated. Further research is needed to refine and verify the predictions of the study, but the results strongly indicate a need for a more strategic approach to water quality monitoring, coupled with ecological condition monitoring, that is aimed at discriminating the effects of dredge material placement on water quality from the effects of human activities, particularly elevated sediment inputs from land-use change, and from natural variability. Strategic monitoring should be implemented on large spatial scales up to that of the entire Region, and in the long term (i.e. be permanent). It should be aimed at informing the assessment of cumulative effects, and support the consideration of resilience in management arrangements.
Reactive water quality and ecological health monitoring during dredging operations and strategic monitoring are both required at different levels in the overall strategy for improved dredged material management in the Region.
The water quality monitoring framework includes a number of features and recommendations for good practice with regard to overall monitoring design, monitoring methodologies and parameters, development of trigger values and management responses, selection of monitoring sites, and the general management framework. Key recommendations include:
EMPs should adopt a multi-tiered approach, with a hierarchy of trigger values invoking progressively more stringent management responses
Low-level water quality triggers should be linked to early investigative responses to assess potential ecological responses to reduced water quality
Where monitoring is aimed at preventing impacts of decreased light on light-dependent receptors, the monitoring and trigger values should be based on photosynthetically active radiation
Remote sensing is a complementary monitoring method that should not replace in situ measurements, but is useful for detecting the spatial extent of surface plumes and distinguishing regional events from dredging-related plumes. Algorithm development and ground truthing should use dredge material plumes, not ambient suspended sediments
Monitoring programs should consider using multiple control sites, at multiple spatial scales
Monitoring programs should establish an independent body (typically referred to as a Technical Advisory and Consultative Committee or Management Review Group) to review the monitoring results and make key decisions on appropriate management responses in the event of water quality exceedances. The body should be involved early in the process, in all three phases of developing and implementing the program.
Ocean Placement of Dredge Material and Long-term Sediment Migration
The study identified potential alternative dredge material placement areas in the six study areas, and conducted a comparative assessment of sediment plumes and long-term migration of sediment from these hypothetical alternatives, as well as currently used placement sites.
5
The study provides insight into differences in the maximum credible sediment excursions, both during dredging disposal operations and over 12 months that may result from placing dredge material at hypothetical alternative and currently used material placement sites. Including the effects of large-scale currents in hydrodynamic modelling of bed shear-stress and long-term sediment migration indicates that placement of material in deeper water further offshore in the Reef lagoon than the currently used placement sites does not necessarily result in reduced migration of dredge material. In fact, material placed offshore may be more mobile than if placed in the current sites closer to shore.
The study is the first to incorporate the effects of large-scale currents in the Region in modelling dredge material migration and model dredge material migration over a period of 12 months. A key result is the finding that dredge material placed at sea has the potential to migrate on much greater spatial and temporal scales than has previously been appreciated.
Another benefit of the study has been to identify key knowledge gaps and research areas in relation to developing improved management strategies for dredge material in the Region. These include:
Model sensitivity analysis to evaluate the potential relative influences of inter-annual variability in metocean conditions, critical shear-stresses for sediment resuspension, and sediment consolidation on sediment migration
Modelling of resuspension and transport of ambient sediments, and the interactions of dredge material and ambient sediments
Investigation of different approaches to incorporate the influence of large-scale currents in hydrodynamic models
Field and laboratory studies of sediment consolidation, resuspension and transport processes
Modelling and field studies of the effects of different placement methodologies (e.g. “spreading” versus “piling” dredge material) on subsequent sediment mobility.
Further research on potential large-scale movement of dredge material in the Great Barrier Reef system should be designed to support the development of a strategic approach to water quality and ecological monitoring in the region. Key aspects of such an approach include:
Monitoring at multiple spatial scales, up to the scale of the Region as a whole
Long-term (i.e. permanent) monitoring to quantify trends in water quality and ecosystem condition over time
Monitoring designed to help differentiate sources of sediments in the system (e.g. dredge material vs. river inputs, new inputs vs. resuspension of ambient sediments) in relation to water quality conditions
Monitoring designed to support the assessment of cumulative impacts of different human activities and natural events, and the assessment of ecosystem resilience.
Improved approaches to assess cumulative impacts and ecosystem resilience are also needed.
6
INTRODUCTION
The Australian and Queensland governments have agreed to undertake a comprehensive strategic assessment to identify, plan for, and manage risks within the Great Barrier Reef Marine Park (Marine Park), Great Barrier Reef World Heritage Area (World Heritage Area) and adjacent coastal zone. This assessment is in part a response to the World Heritage Committee’s request for Australia to undertake a strategic assessment of future developments that could impact on the reef’s values, and to enable long-term planning for sustainable development (World Heritage Committee June 2011). The comprehensive strategic assessment comprises two elements. One is the Great Barrier Reef Coastal Zone Strategic Assessment, being undertaken by the Queensland Government. The other is the Great Barrier Reef Region Strategic Assessment being led by the Great Barrier Reef Marine Park Authority (GBRMPA). The comprehensive strategic assessment considers direct, indirect and cumulative impacts on matters of national environmental significance, as defined by the Environment Protection and Biodiversity Conservation Act 1999, from existing, planned and potential future coastal development activities including those associated with increased shipping and port infrastructure development. The strategic assessment also considers the effectiveness of existing environmental management arrangements and the need for improved management strategies.
Queensland’s mining and resource sectors are currently in a phase of significant expansion, with a number of new or expanded export facilities proposed along the Queensland coast to meet the needs of the sector. Port expansions have also been proposed to meet the growing needs of the tourism, naval and other economic sectors in general. Port expansions involve significant works within and adjacent to the World Heritage Area and its adjacent coastal zone. Such expansions often involve significant capital dredging to create new or deeper shipping channels and/or berth areas. Similarly, the regular maintenance dredging for maintaining safe access for ships into ports is another consideration in the management of the Great Barrier Reef Region (the Region).
The GBRMPA commissioned Sinclair Knight Merz (SKM) and Asia-Pacific Applied Science Associates (APASA) to complete the ‘Improved Dredge Material Management for the Great Barrier Reef Region’ project. The research is funded under the Australian Government’s Sustainable Regional Development program, which aims to secure a sustainable future for Australia’s high-growth regional areas through regional sustainability planning and strategic assessments.
The project has focused on six study areas within 50 km of:
Port of Gladstone
Rosslyn Bay State Boat Harbour
Port of Hay Point
Port of Abbot Point
Port of Townsville
Port of Cairns.
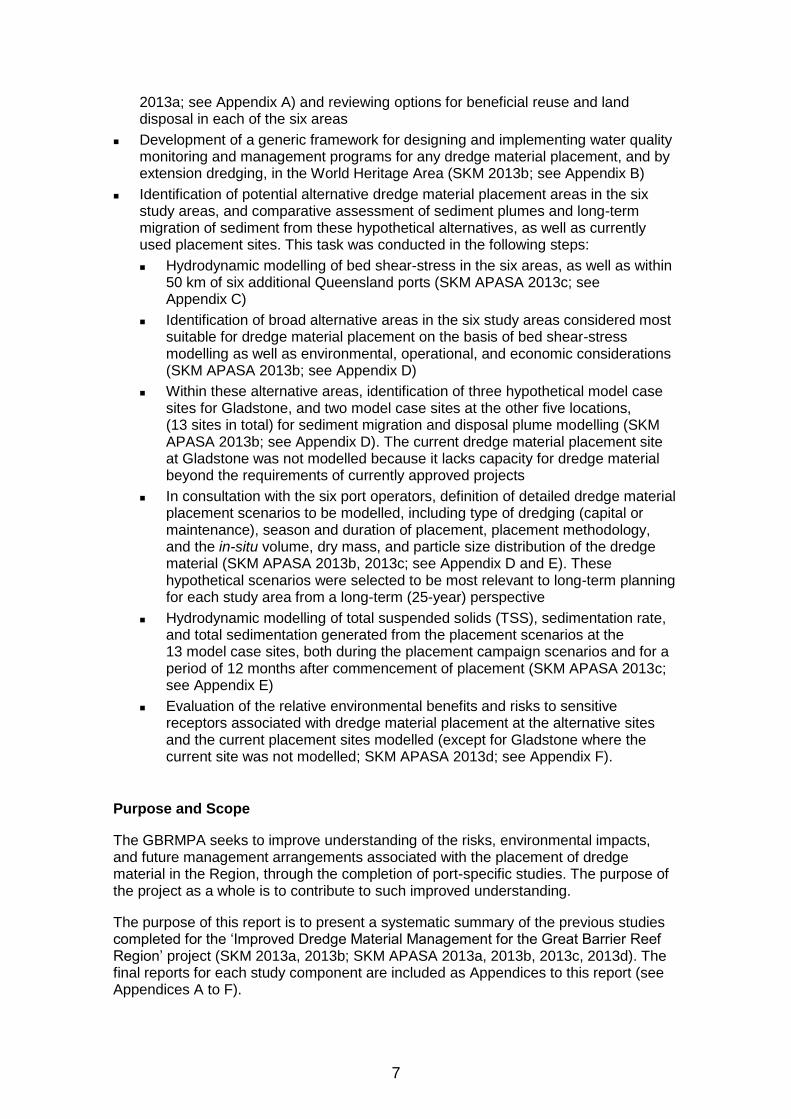
The project comprised three main tasks:
A literature review and cost analysis synthesising information on environmental and economic costs of beneficial reuse and land disposal of dredge material (SKM
7
2013a; see Appendix A) and reviewing options for beneficial reuse and land disposal in each of the six areas
Development of a generic framework for designing and implementing water quality monitoring and management programs for any dredge material placement, and by extension dredging, in the World Heritage Area (SKM 2013b; see Appendix B)
Identification of potential alternative dredge material placement areas in the six study areas, and comparative assessment of sediment plumes and long-term migration of sediment from these hypothetical alternatives, as well as currently used placement sites. This task was conducted in the following steps:
Hydrodynamic modelling of bed shear-stress in the six areas, as well as within 50 km of six additional Queensland ports (SKM APASA 2013c; see Appendix C)
Identification of broad alternative areas in the six study areas considered most suitable for dredge material placement on the basis of bed shear-stress modelling as well as environmental, operational, and economic considerations (SKM APASA 2013b; see Appendix D)
Within these alternative areas, identification of three hypothetical model case sites for Gladstone, and two model case sites at the other five locations, (13 sites in total) for sediment migration and disposal plume modelling (SKM APASA 2013b; see Appendix D). The current dredge material placement site at Gladstone was not modelled because it lacks capacity for dredge material beyond the requirements of currently approved projects
In consultation with the six port operators, definition of detailed dredge material placement scenarios to be modelled, including type of dredging (capital or maintenance), season and duration of placement, placement methodology, and the in-situ volume, dry mass, and particle size distribution of the dredge material (SKM APASA 2013b, 2013c; see Appendix D and E). These hypothetical scenarios were selected to be most relevant to long-term planning for each study area from a long-term (25-year) perspective
Hydrodynamic modelling of total suspended solids (TSS), sedimentation rate, and total sedimentation generated from the placement scenarios at the 13 model case sites, both during the placement campaign scenarios and for a period of 12 months after commencement of placement (SKM APASA 2013c; see Appendix E)
Evaluation of the relative environmental benefits and risks to sensitive receptors associated with dredge material placement at the alternative sites and the current placement sites modelled (except for Gladstone where the current site was not modelled; SKM APASA 2013d; see Appendix F).
Purpose and Scope
The GBRMPA seeks to improve understanding of the risks, environmental impacts, and future management arrangements associated with the placement of dredge material in the Region, through the completion of port-specific studies. The purpose of the project as a whole is to contribute to such improved understanding.
The purpose of this report is to present a systematic summary of the previous studies completed for the ‘Improved Dredge Material Management for the Great Barrier Reef Region’ project (SKM 2013a, 2013b; SKM APASA 2013a, 2013b, 2013c, 2013d). The final reports for each study component are included as Appendices to this report (see Appendices A to F).
8
The report aims to capture key messages and conclusions regarding dredge material management in the region that have resulted from the study. This report also identifies knowledge gaps and additional research that would further increase understanding of risks and potential management arrangements associated with dredge material placement in the World Heritage Area.
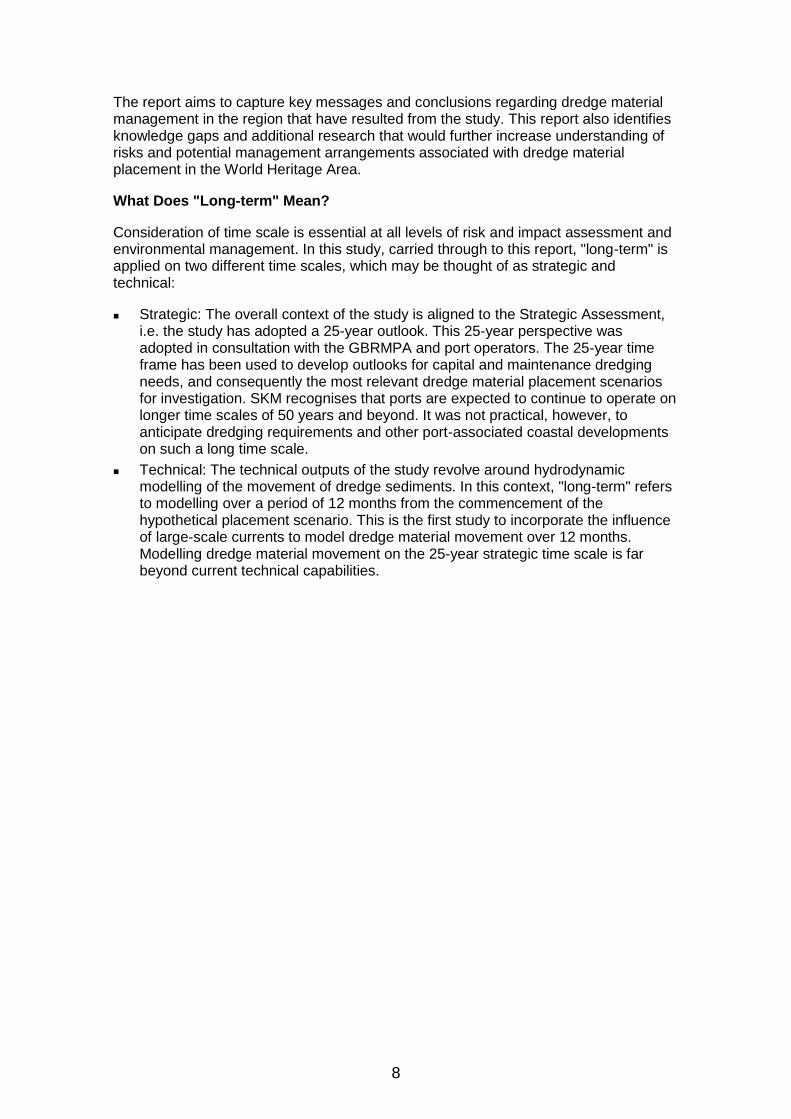
What Does "Long-term" Mean?
Consideration of time scale is essential at all levels of risk and impact assessment and environmental management. In this study, carried through to this report, "long-term" is applied on two different time scales, which may be thought of as strategic and technical:
Strategic: The overall context of the study is aligned to the Strategic Assessment, i.e. the study has adopted a 25-year outlook. This 25-year perspective was adopted in consultation with the GBRMPA and port operators. The 25-year time frame has been used to develop outlooks for capital and maintenance dredging needs, and consequently the most relevant dredge material placement scenarios for investigation. SKM recognises that ports are expected to continue to operate on longer time scales of 50 years and beyond. It was not practical, however, to anticipate dredging requirements and other port-associated coastal developments on such a long time scale.
Technical: The technical outputs of the study revolve around hydrodynamic modelling of the movement of dredge sediments. In this context, "long-term" refers to modelling over a period of 12 months from the commencement of the hypothetical placement scenario. This is the first study to incorporate the influence of large-scale currents to model dredge material movement over 12 months. Modelling dredge material movement on the 25-year strategic time scale is far beyond current technical capabilities.
9
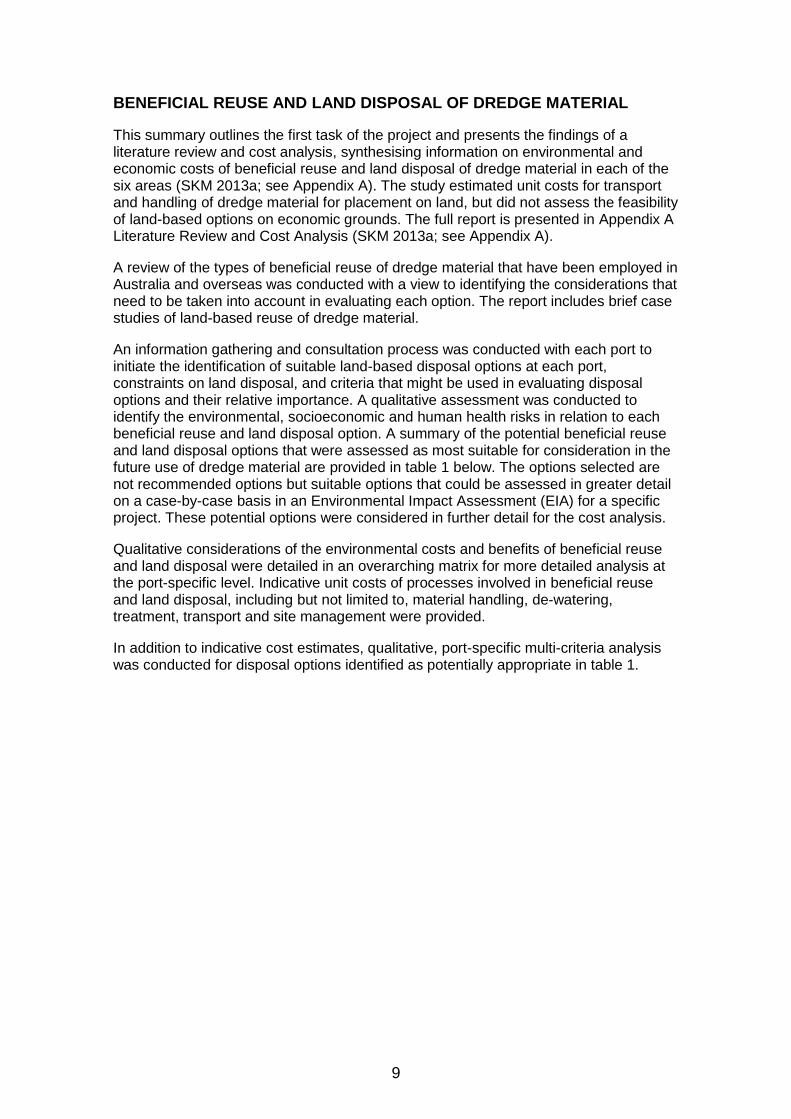
BENEFICIAL REUSE AND LAND DISPOSAL OF DREDGE MATERIAL
This summary outlines the first task of the project and presents the findings of a literature review and cost analysis, synthesising information on environmental and economic costs of beneficial reuse and land disposal of dredge material in each of the six areas (SKM 2013a; see Appendix A). The study estimated unit costs for transport and handling of dredge material for placement on land, but did not assess the feasibility of land-based options on economic grounds. The full report is presented in Appendix A Literature Review and Cost Analysis (SKM 2013a; see Appendix A).
A review of the types of beneficial reuse of dredge material that have been employed in Australia and overseas was conducted with a view to identifying the considerations that need to be taken into account in evaluating each option. The report includes brief case studies of land-based reuse of dredge material.
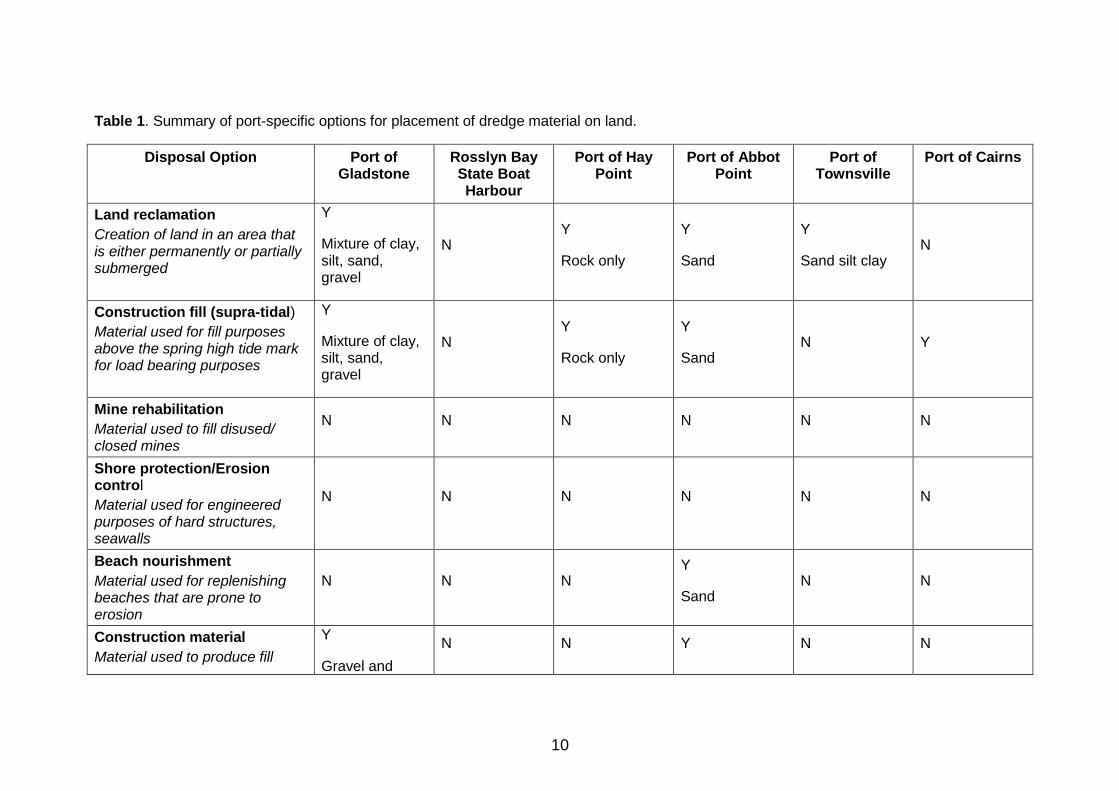
An information gathering and consultation process was conducted with each port to initiate the identification of suitable land-based disposal options at each port, constraints on land disposal, and criteria that might be used in evaluating disposal options and their relative importance. A qualitative assessment was conducted to identify the environmental, socioeconomic and human health risks in relation to each beneficial reuse and land disposal option. A summary of the potential beneficial reuse and land disposal options that were assessed as most suitable for consideration in the future use of dredge material are provided in table 1 below. The options selected are not recommended options but suitable options that could be assessed in greater detail on a case-by-case basis in an Environmental Impact Assessment (EIA) for a specific project. These potential options were considered in further detail for the cost analysis.
Qualitative considerations of the environmental costs and benefits of beneficial reuse and land disposal were detailed in an overarching matrix for more detailed analysis at the port-specific level. Indicative unit costs of processes involved in beneficial reuse and land disposal, including but not limited to, material handling, de-watering, treatment, transport and site management were provided.
In addition to indicative cost estimates, qualitative, port-specific multi-criteria analysis was conducted for disposal options identified as potentially appropriate in table 1.
10
Table 1. Summary of port-specific options for placement of dredge material on land.
Disposal Option Port of Gladstone
Rosslyn Bay State Boat Harbour
Port of Hay Point
Port of Abbot Point
Port of Townsville
Port of Cairns
Land reclamation
Creation of land in an area that is either permanently or partially submerged
Y
Mixture of clay, silt, sand, gravel
N Y
Rock only
Y
Sand
Y
Sand silt clay N
Construction fill (supra-tidal)
Material used for fill purposes above the spring high tide mark for load bearing purposes
Y
Mixture of clay, silt, sand, gravel
N Y
Rock only
Y
Sand N Y
Mine rehabilitation
Material used to fill disused/ closed mines
N N N N N N
Shore protection/Erosion control
Material used for engineered purposes of hard structures, seawalls
N N N N N N
Beach nourishment
Material used for replenishing beaches that are prone to erosion
N N N Y
Sand N N
Construction material
Material used to produce fill
Y
Gravel and
N N Y N N
11
Disposal Option Port of Gladstone
Rosslyn Bay State Boat Harbour
Port of Hay Point
Port of Abbot Point
Port of Townsville
Port of Cairns
material, construction product (e.g. brick) or mixture
sand Sand
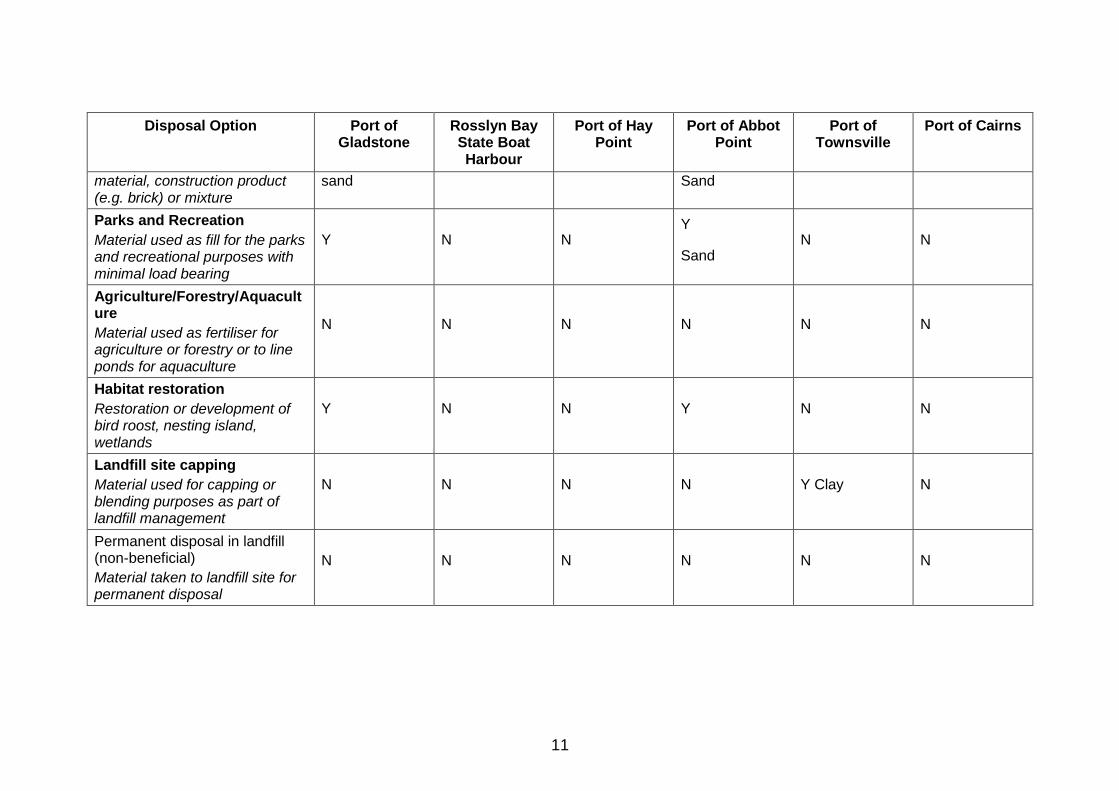
Parks and Recreation
Material used as fill for the parks and recreational purposes with minimal load bearing
Y N N Y
Sand N N
Agriculture/Forestry/Aquaculture
Material used as fertiliser for agriculture or forestry or to line ponds for aquaculture
N N N N N N
Habitat restoration
Restoration or development of bird roost, nesting island, wetlands
Y N N Y N N
Landfill site capping
Material used for capping or blending purposes as part of landfill management
N N N N Y Clay N
Permanent disposal in landfill (non-beneficial)
Material taken to landfill site for permanent disposal
N N N N N N
12
Disposal Option Port of Gladstone
Rosslyn Bay State Boat Harbour
Port of Hay Point
Port of Abbot Point
Port of Townsville
Port of Cairns
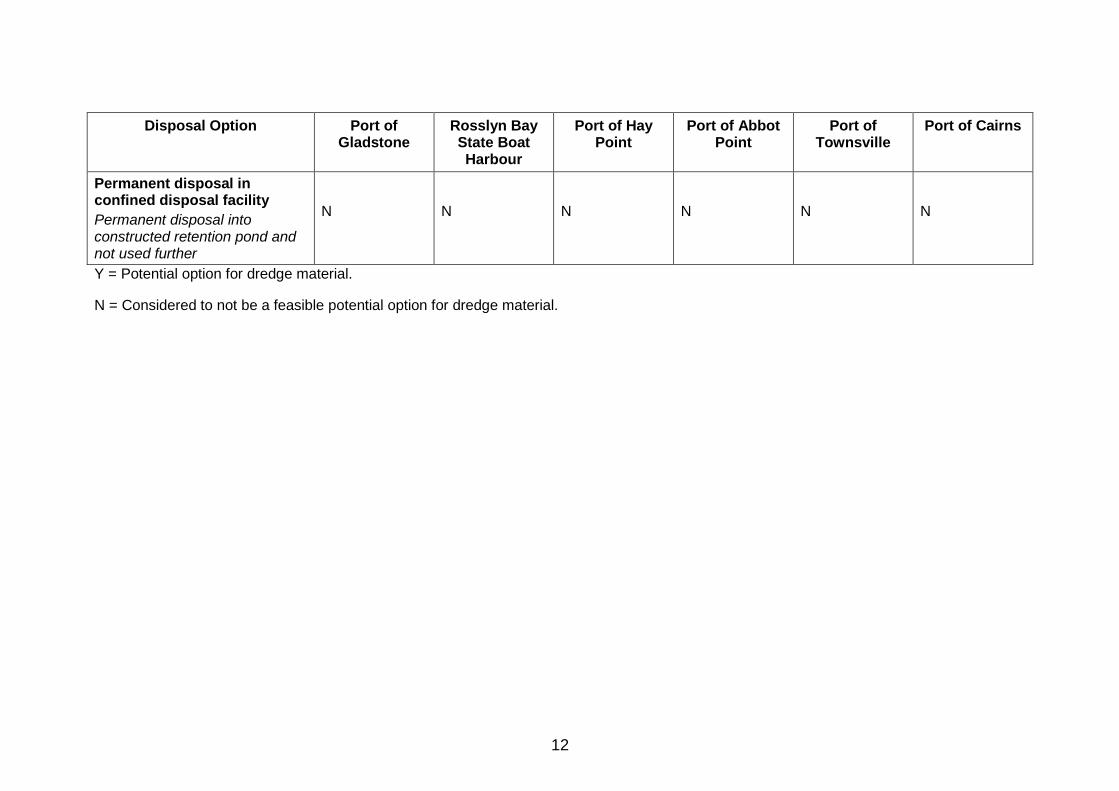
Permanent disposal in confined disposal facility
Permanent disposal into constructed retention pond and not used further
N N N N N N
Y = Potential option for dredge material.
N = Considered to not be a feasible potential option for dredge material.
13
A number of potential disposal options were unviable at each location, based on absolute constraints outlined in more detail in the full report (Appendix A Literature Review and Cost Analysis). For Rosslyn Bay State Boat Harbour, no options for beneficial reuse or land disposal were assessed to be viable, mainly due to the land constraints for drying the dredge material. At the Port of Hay Point the distance of the area to be dredged from the shore posed a major constraint in transporting the material by pipeline. In addition, the nature of the material meant that transport by barge was not an option. The only viable option for beneficial reuse at Hay Point was for the use of rock material, which although uncommon has been found previously in the area and used in land reclamation as fill material.
The main common constraint for all the ports was available nearby flat land for drying the dredge material to enable it to be transported and used elsewhere, relative to the predicted volumes of dredge material to be generated over 25 years. This generally constrained options for permanently holding dredge material within a holding pond or disposing of it into a landfill site, or for drying the material.
Dewatering requires large areas of land for containing the material in layers thin enough for the material to dry for transport. For example, Morton (2012) considered that dredge material at the Port of Hay Point could not be dried if placed in layers thicker than 1.5 m, so that drying of 15 Mm3 of dredge material would require at least 7500 ha of flat land. SKM views this estimate to be consistent with general engineering requirements. SKM also notes that drying dredge material in onshore impoundments may not be feasible at all in the wet tropics.
The volumes of dredge material predicted to be generated by the five ports over 25 years is large, ranging from 8.5 million m3 at Abbot Point to 80 million m3 at Gladstone. A lack of large areas of available flat land to contain dredge material near the ports, whether for final disposal or dewatering before transport to other destinations, severely constrains options for land placement of the full volume of anticipated dredge material. The anticipated 25-year volume of dredge material at Rosslyn Bay State Boat Harbour is much smaller (250,000 m3), but even so the availability of flat land nearby is constrained by surrounding land uses (National Park, residential, agriculture) and steep topography. Even when drying is feasible, the fine material that characterises much of the dredge material from the six locations has limited potential uses as fill due to its geotechnical characteristics unless treated.
No suitable opportunities for use of dredge material in mine rehabilitation were identified, as transporting the wet material was a major constraint. The dredge material for all locations was not suitable for shore protection (e.g. rock armouring) however, there was a possible opportunity for sand from dredge material at the Port of Abbot Point to be used for future beach re-nourishment purposes. The dredge material at all locations was not considered suitable for agricultural use due to the high salt content and need for de-watering and processing. The clay portion of dredge material present at Cairns, Townsville and Hay Point could be used in aquaculture for the lining of earth ponds to prevent water seepage. However, it is unlikely that there will be sufficient demand for this type of use in these regions to provide a major disposal option.
The capital dredge material at the Port of Gladstone is highly layered and although land availability is a major constraint for drying and separating the dredge material, should this obstacle be overcome, some fractions could be used for land reclamation, construction material, fill, or restoration of mangrove and wetland habitats. The dredge material for the Port of Abbot Point contains a high percentage of sand that could be used for land reclamation, construction fill, construction material, for parks and recreation and habitat creation. Although there is currently no demand for the use of the sand as construction material this may change in the future with increased

14
development of the land around Abbot Point. Construction fill could feasibly be considered as a use of dredge material at the Port of Cairns, however, this option would only be suitable if there were no other contaminants present and any acid sulphate soil was treated. Land reclamation was considered an option for the Port of Townsville as well as landfill capping, however, land for drying the clay material may be an issue.
The cost review revealed that the placement of dredge material offshore was significantly cheaper than all of the options considered for beneficial reuse and land based disposal. This was mainly due to the comparative costs involved in storing the dredge material in a holding pond to dry out before further use could be made, which involved the construction of the de-watering basin, the de-watering itself, stabilisation and separation costs, and the monitoring of water quality throughout the duration of the de-watering process. The use of rock material for land reclamation and fill material was less costly as this avoided the de-watering costs.
There are a number of additional costs which are not included in this study due to the detailed and project-specific nature of the variables that would need to be considered. These would best be quantified on a case-by-case basis for a project-specific EIA.
Consideration of potential beneficial reuse of dredge material on land should recognise the demand side of the equation, that is, the need for other parties to desire or at least accept ports' dredge material for use on land. In the Queensland setting, there is little demand for a number of potential uses of dredge material, including use as soil amendment for agriculture and forestry, aquaculture pond construction, or wetland creation/restoration.
Although land-based reuse or disposal are not viable options to manage the entire volume of dredge material generated in the six study areas over 25 years, there may be opportunities for reuse of smaller amounts of dredge material, particularly sand, gravel and rock, if generated by specific projects. Such opportunities should be assessed on a case-by-case basis for individual projects, according to the nature and volume of material to be dredged. This case-by-case assessment of opportunities for beneficial reuse of land disposal is required by the ‘National Assessment Guidelines for Dredging’ (NAGD). Such case-by-case assessment should include consideration of opportunities to make use of new treatment technologies or find innovative uses for the material.

15
WATER QUALITY FRAMEWORK
This summary outlines the results of the second task of the project, development of a generic framework for designing and implementing water quality monitoring programs for reactive management during dredge material placement operations in the World Heritage Area. The full report is presented in Appendix B Water Quality Framework (SKM 2013b; see Appendix F).
Although the framework has been developed specifically in the context of the offshore placement of dredge material, the concepts are applicable to dredging projects generally. The report reviews:
Methodologies and monitoring parameters for water quality monitoring for dredge material relocation
Existing information from dredging projects in Queensland and elsewhere in Australia
Approaches to establishing water quality trigger values for water quality monitoring and management, with a focus on a multi-tier reactive management approach
Approaches for selecting monitoring sites
Approaches to establishing reactive management response regimes.
The scope and timeframe for this study did not allow detailed, quantitative development of water quality triggers or management measures at the six locations. Detailed water quality monitoring and management programs for dredging projects must be developed on a project-specific basis, utilising a comprehensive and detailed EIA, which is beyond the level of detail permitted by the scope of the present study.
A generic framework for developing and implementing water quality monitoring for the specific purpose of reactive management – i.e. to provide warning of potentially stressful conditions during material placement operations early enough to take management responses to prevent or minimise ecological impacts - is presented in figure 1. Although the framework has been developed specifically in the context of offshore placement of dredge material, the concepts are applicable to dredging projects generally.
As a generic conceptual framework, the framework illustrated cannot be directly applied to individual projects, each of which will have specific aspects that require adaptation of the generic conceptual framework. Steps may be skipped, or their timing altered, in adapting the framework to the specific circumstances of a given project. In many cases monitoring programs will have objectives in addition to reactive management during dredging and dredge material placement operations. In particular, the framework is likely to be adapted on the basis of existing available baseline data and other information regarding the water quality and ecological outcomes of previous projects at the location.
The first step in developing a water quality monitoring program is to determine the data requirements of the program and whether monitoring and/or predictive impact modelling are needed, based on a review and analysis of existing information. In general, water quality monitoring for the purpose of triggering reactive management responses is not required if the proposed project is of shorter duration than established duration thresholds for impact, or the duration is so short that monitoring results cannot realistically lead to management responses.

16
Water quality monitoring for reactive management may also be unnecessary for maintenance dredging projects that are very similar to previous projects where repeated (minimum three campaigns) water quality monitoring has demonstrated compliance with trigger values and where established ecological monitoring demonstrates no evidence of significant short- or long-term impacts on receptors that can be attributed to dredging and dredge material placement.
It is stressed again that the above discussion on when water quality monitoring may not be required is focused on monitoring for the purpose of identifying declines in water quality early enough to initiate management responses. Water quality monitoring for dredging and dredge material placement projects may be conducted for a variety of other reasons.
17
Figure 1 A general framework for developing and implementing water quality monitoring programs for reactive management of dredge material placement.
If it is determined that predictive monitoring of sediment plumes is required, the GBRMPA guidelines for numerical modelling for dredging projects (GBRMPA 2012) encourage the application of the “zones of impact” approach prescribed by the Western Australia Environmental Protection Authority (WAEPA 2011). This involves the predictive modelling of zones of high impact, moderate impact, and influence based on quantitative threshold criteria for the boundary of each zone.
2. Establish threshold
criteria for predictive
modelling of zones of
impact
3. Plume/sedimentation/
migration modelling
4. Identify receptors in
predicted zones of
impact
5. Assess receptor
sensitivity to modelled
plumes
6. Select monitoring and
control sites
Consider: factors above, predicted plume
intensity & distribution, environmental
values and resilience, need for multiple
controls, operational constraints
7. Collect site-specific
baseline data as
required
8. Establish multi-tiered
trigger values from
baseline data and
known receptor
sensitivity, establish
management response
framework
Consider environmental values and
resilience
9. Monitoring
10. Assess monitoring
results
Adapt monitoring including trigger values
in consultation with Management Review
Panel
11. Implement
management
responses
12. Post-project
synthesis of results
and lessons learned
EIA
Phase
1. Determine monitoring and
modelling requirements
Review available baseline water quality
data, historical information from previous
projects, literature on receptor sensitivities
Consider receptor environmental values and
limiting factors:
· Is community light-limited?
· Is community sedimentation-limited?
· Community composition
· Community resilience
· Conservation status
Development of
Environmental
Management
Plan (EMP)
EMP
Implementation
TACC
Involvement
MRG
Involvement
Further evaluate existing site-specific
baseline data
Modelling used to
identify receptors
18
For proposed projects involving new ports, dredging and relocation of unprecedented volumes of material, dredging and relocation of unusual material types, or novel dredging and placement methods, knowledge of the potentially affected receptors may not be sufficient to establish impact threshold criteria prior to modelling. It will then be necessary to first model the general spatial distribution of varying levels of TSS and sedimentation, use the results to identify potential receptors, and then proceed to establish threshold criteria for zones of impact and influence. This iterative approach to first identify receptors that might be affected in order to then determine suitable impact thresholds is indicated by the dashed path at the top of figure 1.
The present study considers the implications of placement at hypothetical alternative sites at considerable distance and in different oceanographic settings from the currently used sites. It is therefore an example of a case where the potential receptors were uncertain prior to modelling. The scope of this project did not permit the iterative approach of first using modelling to identify the potentially affected receptors, then establishing thresholds and modelling zones of impact. The project proceeded to the first step, identifying potentially affected receptors on the basis of model predictions of the spatial extent of elevated TSS, increased sedimentation rates and total sedimentation.
Even when general ecological community types potentially affected by dredge material placement are known, the sensitivity of given community types may vary widely. For example, threshold criteria are often set on the basis of coral receptors because corals are expected to be among the most sediment-sensitive receptors in the World Heritage Area. Corals vary widely in sensitivity to turbidity and sedimentation, however, both among species and as a function of ambient conditions (Erftemeijer et al. 2012; Gilmour et al. 2006). As a result, no generic thresholds will accurately predict turbidity or sedimentation impacts on all coral species or coral communities at all sites. The same is true for other marine communities. Therefore, the development of meaningful impact threshold criteria necessarily requires site-specific information on ambient turbidity and sedimentation regimes and on the species composition of coral communities (Erftemeijer et al. 2012; PIANC 2010) and other receptors.
Once modelling has predicted zones of impact and influence, the next steps in the framework (steps 4 and 5) are to identify receptors in the predicted zones of impact and assess their sensitivity to modelled plumes, taking into account the considerations identified in figure 1. For projects that are similar to previous projects in the area, it will often be possible to identify receptors and their sensitivity during the initial review of available information, and modelling of zones of impact and influence may not be needed.
The report reviews approaches to step 8 in the framework, establishing water quality trigger values for reactive management based on site-specific baseline data. These include:
Simple percentiles (e.g. 80th, 95th, 99th) of baseline data, or a percentile plus some allowable level above the percentile
Intensity-duration-frequency (IDF) approaches that consider not only the magnitude of change from baseline levels, but also the duration and frequency of such events
Control charting, which is a variation of the IDF approach
Known tolerance thresholds of receptors to reduced light, sedimentation, or other stressors. Tolerance thresholds are generally more applicable to seagrasses than corals because of wide variability in tolerance among coral communities and individual coral species.
19
SKM recommends that in applying any of the above approaches, the environmental values and resilience of receptors are also considered when setting trigger values.
The report also presents conceptual frameworks for multi-tiered reactive management, commencing with investigative triggers and ramping up to more proactive management responses at higher levels of exceedance.
Most importantly, a major outcome of the study has been to identify the potential for dredge material to migrate over larger spatial scales and longer time scales than had previously been appreciated. As discussed in ‘Context for Using the Study’, page 41, further research is needed to refine and verify the predictions of this initial study, but the results strongly indicate a need for a more strategic approach to water quality monitoring, coupled to ecological condition monitoring, that is aimed at discriminating the effects of dredge material placement on water quality from the effects of human activities, particularly elevated sediment inputs from land-use change, and from natural variability. Strategic monitoring should be implemented on large spatial scales up to that of the entire Region, and in the long term (i.e. permanent). It should be aimed at informing the assessment of cumulative effects, and support the consideration of ecosystem resilience in management arrangements.
Water quality monitoring programs designed for reactive management to prevent acute ecological impacts during dredging and disposal operations will not address the need for a broader strategic monitoring program on large spatial and long temporal scales. Monitoring of individual dredging and material placement campaigns is unlikely to detect long-term, cumulative impacts, indeed, sediment may not even arrive at potentially affected distant sites on the time scale of an individual campaign. On the other hand, it will be difficult to design and implement a broad-scale, long-term strategic monitoring program that can provide information to support the reactive management of a given dredging and disposal operation. This is because a strategic monitoring program is unlikely to provide information on changes in water quality or ecological condition rapidly enough to take management actions during an individual project’s operations (except possibly for very large dredging projects). Thus, reactive water quality and ecological health monitoring during dredging and strategic monitoring are both required at different levels in the overall strategy for improved dredged material management in the Region.
Finally, the report presents SKM’s recommendations for good practice in water quality monitoring programs for dredge material placement, as follows:
Monitoring Methodologies and Parameters
Except for small projects or routine projects where similar projects have been adequately monitored, multiple methods (vessel-based monitoring, fixed loggers, remote sensing) should be incorporated into the design of monitoring programs
A robust quality assurance system including cross-calibration of all monitoring instruments is essential
Fixed loggers for baseline measurement of water quality should be equipped with sensors capable of recording the full range of natural variability. If baseline monitoring shows that conditions frequently exceed the maximum range of measurement the sensors should be replaced with sensors that have a broader range.
Remote sensing is a complementary monitoring method and should not replace in situ measurements, however it is useful for detecting the spatial extent of surface plumes and distinguishing regional climatic influences from sediment plumes related to material placement
20
If remote sensing is used, algorithm development and ground truthing should use dredge material plumes, not ambient suspended sediments
If TSS values derived from turbidity measurements are required for model calibration or other purposes, calculation of the turbidity/TSS relationship should be based on actual dredge material rather than ambient suspended sediments
Photosynthetically active radiation (PAR) is the preferred parameter for monitoring intended to provide warning of potential impacts of increased light attenuation upon light-dependent receptors, followed by turbidity and TSS, which are surrogates for light attenuation. The exception is when there are extensive existing baseline data and/or data on the ecological impacts of turbidity and TSS and baseline data on PAR are not adequate to establish trigger values to warn of potential impending impacts. Monitoring of turbidity and/or TSS may still be required for other purposes such as validating modelling or remote sensing algorithms or to meet approval conditions.
Trigger Values and Management Responses
Experimental quantification of receptor tolerance thresholds is the preferred approach for setting trigger values, but it is recognised that this is not feasible except for very large projects and with current scientific understanding, not at the community level for corals
Where tolerance thresholds are not established, trigger values, at least for large projects, should take into account the ambient regime of variability in duration and frequency of elevated turbidity and sedimentation, as well as the intensity
Where trigger values are derived from the ambient range of variability (e.g. 80th, 95th, 99th percentiles) consideration should be given to identify environmental values as well as the resilience of monitoring receptors
Baseline water quality monitoring data used to establish reactive monitoring trigger values should not be collected during dredging and material placement operations. If “baseline” data are compromised by dredging and material placement, trigger values should be adjusted on a precautionary basis.
Trigger values for light-related impacts should apply only during daylight hours
If turbidity is the parameter being monitored, it is preferable to express trigger values in nephelometric turbidity units (NTU), rather than measuring turbidity and converting for comparison to a trigger value in mg/L TSS based on a measured turbidity/TSS relationship
Because of the difficulties in reliably measuring sedimentation, SKM recommends caution in linking operational management responses such as a reduction or termination of material placement directly to sedimentation triggers. Rather, sedimentation triggers should be linked to further water quality and investigations to determine ecological responses. Management responses should be taken in response to signs of stress on sensitive receptors.
Monitoring for ecological responses during dredging and dredge material placement campaigns, especially for large campaigns, should be conducted even in the absence of exceedances of trigger values. This is to verify that the trigger values used are appropriate with respect to the sensitivity and resilience of the receptors.
Trigger values for specific seasons will be required when:
1) A proposed dredging and material placement campaign will span two or more seasons, that is for medium- or long-term campaigns and
21
2) There are statistically significant seasonal differences in the 50th, 80th, or 95th percentiles of baseline data for the monitored parameter and/or there are known seasonal differences in receptor sensitivity.
Monitoring Site Selection
Depending on project size, monitoring designs should consider using multiple reference (control) sites at varying distances from the placement activity. Modelling can be used to inform the selection of control sites but the possibility that sediment movement does not conform to model predictions, so that sites established as controls are in fact affected by sediment from dredging and material placement, should be considered.
Sentinel sites at the boundaries of modelled zones of impact should be considered, especially for large projects of long duration.
Need for Water Quality Monitoring in Reactive Management
Water quality monitoring for reactive management of dredge material placement activities is not necessary if the duration of the activities is less than the duration of stress required to result in impact, or if past monitoring has demonstrated that very similar programs do not result in impact. Monitoring for other purposes may still be required, however.
General Framework
Technical Advisory and Consultative Committees (TACCs) established for long-term management of maintenance dredging should be involved throughout all three phases of management (Environmental Impact Assessment, Environmental Management Plan Development, and Environmental Management Plan Implementation)
Management Review Groups should be established and engaged early in the design of the reactive management for capital dredging projects, commencing with the establishment of trigger values and management responses
There should be a regular cycle of assessing the effectiveness of the monitoring program and adapting it as required
The final outcomes of reactive management programs for dredge material placement projects should be synthesised and documented to promote continuing improvement in the management of dredge material in the World Heritage Area.
22
SEDIMENT PLUMES AND LONG-TERM MIGRATION MODELLING FROM ALTERNATIVE PLACEMENT AREAS
This summary presents the third task of the project comprising four sub-tasks:
Hydrodynamic modelling of bed shear-stress in the six areas, as well as within 50 km of six additional Queensland ports (SKM APASA 2013a; see Appendix C)
Identification of broad alternative areas in the six study areas considered most suitable for dredge material placement on the basis of bed shear-stress modelling as well as environmental, operational, and economic considerations (SKM APASA 2013b). Within these alternative areas, identification of three hypothetical model case sites for Gladstone, and two model case sites at the other five locations, (13 sites in total) for sediment migration and disposal plume modelling (SKM APASA 2013b; see Appendix D).
Hydrodynamic modelling of TSS, sedimentation rate, and total sedimentation generated from the placement scenarios at the 13 model case sites, both during the placement campaign scenarios and for a period of 12 months after commencement of placement (SKM APASA 2013c; see Appendix E)
Evaluation of the relative environmental benefits and risks to sensitive receptors associated with dredge material placement at the alternative sites modelled and current placement sites, (except for Gladstone where the current placement site was not modelled; SKM APASA 2013d; see Appendix F).
Bed Shear-stress Modelling
This report is the first sub-task of the third task of the project. The full report is presented in Appendix C Bed Shear-stress Modelling (SKM APASA 2013a; see Appendix C).
Modelling the bed shear-stress within a 50 km radius of the 12 Queensland trading ports is important in determining whether the combined forces are sufficient to mobilise unconsolidated sediments of different grain size categories on the seafloor and in turn the relative stability of dredge material. The findings from the bed shear-stress modelling, together with various other site selection constraints that have been independently defined (i.e. operational, economic, social, cultural and environmental considerations), were used to identify 3 alternative dredge material placement sites at Port of Gladstone, and 2 at each of the other five ports (Rosslyn Bay State Boat Harbour, Port of Hay Point, Port of Abbot Point, Port of Townsville and Port of Cairns). All sites were within a 50 km radius of their respective ports for further modelling and assessment.
The bed shear-stress modelling study was carried out in a number of independent yet, integrated stages. Firstly, as the oceanographic conditions fluctuate from one year to the next, an analysis was carried out representative of El Niño (2004), La Niña (2011) and neutral (2007) years, which was used to verify which year represents high-energy conditions. Based on this analysis, the 2011 period was identified as the year with the strongest predicted currents. Secondly, a dataset was established that incorporates the three-dimensional effects of the oceanic currents (i.e. effects from the prevailing south-east trade winds and East Australian Current) and tide-driven and wind-driven coastal currents. The data was validated against tide data from the National Tidal Facility and current data adjacent to the Hay Point and Townsville existing material disposal sites. The third step involved modelling the wave climate for the period corresponding to the current data and confirming the model accuracy using measured data at five locations (Gladstone, Emu Park, Mackay, Townsville and Cairns). The final step was to estimate
23
the 50th (or average conditions) and 95th (or extreme conditions) percentile bed shear-stress levels due to the combined current and wave forces, using the empirical formulation described in Soulsby (1997), which assumes non-cohesive rough (i.e. bioturbated) sediments under non-breaking waves.
It is important to note that this study will not replace the need for a detailed EIA associated with any future dredge material placement operations. A detailed EIA would be required since there is a need to understand the composition of any future dredge material placement operation. Each placement operation potentially delivers a different grain size mix to the selected dredge material placement area. Future dredging operations would also cause modification to the bathymetry which, for future operations, is unforeseen. Consequently, the study herein helps define the scour potential for the existing historical material placement sites and other locations within the region as a decision support tool and for comparative purposes to guide such detailed studies in the future.
Key findings for the 12 ports were:
Port of Gladstone: The modelling indicates high shear-stress levels (or more dispersive zones) for the majority of the study area, with the potential to mobilise unconsolidated material up to coarse sand under average conditions. Select inshore areas east and west of the existing material placement site show lower bed shear-stresses (i.e. more retentive zones).
Rosslyn Bay State Boat Harbour: The 50th percentile results indicate that the bed shear-stresses at the existing material placement site suggest a reasonably retentive environment and will be stable for sediments larger than fine silt. By moving offshore the stress levels increase significantly and would have the potential to mobilise unconsolidated fine and coarse sand. The 95th percentile stress distributions show that sediments as large as coarse sand could be periodically mobilised for any location offshore from the port and that there would be no locations where dredge deposits would remain stable.
Port of Hay Point: The results showed that under average conditions the majority of the study area is energetic enough to mobilise unconsolidated material up to coarse sands. However, the areas southwest of the existing material placement sites are more retentive, where recently settled sediments larger than coarse silt are unlikely to mobilise.
Port of Mackay: Similar to the Port of Hay Point, even under average conditions the majority of the study area is energetic enough to mobilise unconsolidated material up to coarse sands. At the existing material placement site, the stresses are a slightly reduced but still show the potential for remobilisation of recently deposited sediments up to fine sand.
Port of Abbot Point: The study area is a relatively low-energy and retentive environment under average (50th percentile) conditions. The predicted shear-stresses are sufficient to mobilise unconsolidated sediments only up to fine silts, and peripheral areas up to coarse silts.
Port of Townsville: Much of the study area has a relatively low-energy seabed environment, with shear-stress sufficient to potentially mobilise unconsolidated sediments up to coarse silts during average conditions. Modelled shear-stress in the north-eastern zone of the study area is sufficient to mobilise fine sands. Additionally, there is a small zone north of Magnetic Island with lower predicted shear-stress values (more retentive environment), sufficient to mobilise material only up to fine silt.
Port of Lucinda: Modelling results indicate that most of the areas are retentive under average (50th percentile) conditions, with the northern and southern regions

24
having a predicted shear-stress sufficient to mobilise unconsolidated sediments typically up to coarse silts. However a more dispersive environment is predicted adjacent the port of Lucinda with predicted bed shear-stress values high enough to mobilise sediments up to coarse sand. Dispersive zones are also predicted north of Hinchinbrook Island, in the outer reefs northeast of Lucinda and southwest of Palm Island.
Port of Mourilyan: The study area is a relatively low-energy retentive environment under average (50th percentile) conditions, with the bed shear-stress values indicate potential mobilisation of clays along the near-shore region and up to fine and coarse silts in the deeper offshore regions.
Port of Cairns: The 50th percentile modelling predicts relatively low sediment mobility (mostly retentive areas) within the Cairns study area, with shear-stress sufficient only to mobilise unconsolidated clays along the immediate coastline, grading into shear-stresses sufficient to potentially mobilise fine and coarse silts further offshore. Only a few reef-associated areas have predicted shear stresses sufficient to mobilise fine to coarse sands.
Port of Cooktown: Similar to the Cairns study region, under average conditions the bed shear-stress is relatively low, sufficient only to mobilise unconsolidated clays along much of the immediate coastline and coarse silts moving offshore. Offshore reef-associated areas have predicted shear stresses sufficient to mobilise sediments up to coarse sands.
Port of Cape Flattery: The study area is a low-energetic retentive environment under average (50th percentile) conditions. The stress values are sufficient to mobilise unconsolidated clays along immediate near-shore regions and fine and coarse silts in adjacent waters.
Port of Quintell Beach: Similar to the Port of Cape Flattery, the study area is a low-energetic retentive environment under average (50th percentile) conditions, with stress values sufficient to mobilise unconsolidated clays along immediate near-shore regions and fine and coarse silts in adjacent waters.
An assessment of the 95th percentile bed shear stress levels showed that for all of the 12 Queensland trading ports, the majority of the study areas would become highly energetic (i.e. more dispersive) with the potential to mobilise unconsolidated sediments as large as coarse sand.
25
Identification of Alternative Sites for Dredge Material Placement at Sea
This report is the second sub-task of the third task of the project. The full report is presented in Appendix D Identification of Alternative Sites for Dredge Material Placement at Sea (SKM APASA 2013b; see Appendix D).
Within each of the six port study areas (Port of Gladstone, Rosslyn Bay State Boat Harbour, Port of Hay Point, Port of Abbot Point, Port of Townsville and Port of Cairns), broad areas most suited to dredge material placement have been identified based on available literature and data regarding environmental receptors, fisheries, zoning, cultural heritage, and navigation, as well as on hydrodynamic modelling of bed shear-stress. The report provides the rationale for the selection of alternative areas. The scope of the study was to identify alternatives to the current placement sites, but there is no presumption that the alternative areas are inherently preferable to the current dredge material placement sites.
The scope and timeframe for this study did not allow a detailed, quantitative multi-criteria analysis with agreed scoring and weighting criteria. Given the limitations in scope, the study adopted two sets of criteria: hard (no-go) constraints and “preferential” constraints. The hard (no-go) constraints were:
All areas not in the General Use Zone of the Marine Park
Areas within a 2 km buffer zone around coral reefs
Areas with a 5 km buffer zone around identified turtle feeding and breeding areas
Existing shipping channels
Special Management Areas and Fish Habitat Areas.
“Preferential” constraints included:
Areas of known environmental, tourism, recreational or commercial value were avoided, including seagrass habitat and areas of comparatively high commercial fisheries value as indicated by catch per unit effort (CPUE) in the trawl fishery
Ship anchorages and pilot boarding locations were avoided
Dredge material placement sites that would require material transport vessels to cross major shipping lanes were avoided
Areas with existing sediment characteristics similar to the expected dredge material were preferred, to the extent possible.
One (for Rosslyn Bay State Boat Harbour and Port of Hay Point) or two (for Port of Gladstone, Port of Abbott Point, Port of Townsville, and Port of Cairns) alternative dredge material placement areas (referred to on maps as ADMPAs) were identified in the 50 km study areas around the six ports. For each port, two model case sites were identified within the alternative placement areas, except for the Port of Gladstone where 3 model case sites were identified, recognising that the current placement site for Gladstone has no remaining capacity. The next sub-task of the project conducted hydrodynamic modelling of sediment plumes generated by dredge material placement during a representative dredging campaign, and subsequent sediment migration over a 12-month period, at the model case sites and (except for Gladstone) the current placement sites.
The current dredge material placement sites are not considered in this component of the study except as noted, as the scope was to identify alternative sites to the existing
26
ones. It is acknowledged that many of the current dredge material placement sites are still in use and have not yet reached their full capacity. Environmental risks associated with the current material placement sites (except for Gladstone) are modelled in the subsequent components of the study.
Findings for the six ports were:
Port of Gladstone: Two alternative dredge material placement areas, one to the north-east and one to the north-west of the Gladstone port entrance were identified. These areas minimise interaction with navigational routes, avoid sensitive environmental receptors, are in relatively retentive areas for sediment dispersion, and appear not to overly commercially important fishing grounds. Unlike the other five ports, for which two model case sites each were identified, three model case sites were identified for Gladstone to take into account that the current placement site is already fully committed. Two of the model case sites are in the alternative area to the north-west and one is in the area to the north-east.
Rosslyn Bay State Boat Harbour: One alternative placement area was identified, to the north-east of Rosslyn Bay State Boat Harbour. This area avoids sensitive areas and is of moderate trawl fisheries value, although it is immediately adjacent to a Conservation Park zone. Model Case 1 within the alternative placement area is east of the current material placement site and Model Case 2 lies to the north of that.
Port of Hay Point: One alternative area for dredge material placement was identified, to the north of the shipping channel and anchorages. Additional areas were considered, however, areas to the east have high shipping traffic, and areas to the south have been identified by the Harbour Master as potential areas for future anchorage expansion, and placement to the south has the potential for transport of dredge material back into the channel. The alternative area minimises interaction with navigational routes, avoids sensitive environmental receptors, is relatively retentive of fine and course sands, and has relatively low historical levels of fisheries catch. Model Case 1 lies immediately to the north of the northern anchorages, and Model Case 2 is further to the north-east.
Port of Abbot Point: Two alternative dredge material placement areas were identified to the north-west and north-east of the port between the 20 m and 40 m depth contours. Both of the identified areas avoid sensitive areas interactions with navigational routes and shipping activity, however the northern area is closer to non-General Use Marine Park zones. Both areas have historically had low fisheries catch. One model case site was identified in a part of each area relatively close to the port.
Port of Townsville: Two alternative areas for dredge material placement were identified to the east and west of the Port of Townsville. Placement of dredge material outside of these areas was constrained by Marine National Park Zones, sensitive environmental receptors, and shipping traffic. The areas minimise interaction with navigation, avoid sensitive receptors, and have historically not been high-value fisheries grounds. One model case was identified in each of the alternative areas.
Port of Cairns: Two alternative areas for material placement were identified, both to the north-east of the Port of Cairns near the 20 m depth contour. Options for dredge material placement sites at Cairns are very constrained due by reefs, non-General Use marine park zones, and shipping activity. Both of the alternative areas avoid interactions with sensitive environmental receptors and navigational routes; however, they have consistently high fisheries CPUE.
27
Sediment Plume and Migration Modelling
This report is the third sub-task of the third task of the project. The full report is presented in Appendix E Sediment Plume and Migration Modelling (SKM APASA 2013c; see Appendix E).
Hydrodynamic modelling of TSS plumes, sedimentation rate, and total sedimentation generated from the placement scenarios at the 13 model case sites, both during the placement campaign scenarios and for a period of 12 months after commencement of placement was conducted. The findings of this research were used in a subsequent report “Sensitive Receptor Risk Assessment of Alternative and Current Dredge Material Placement Sites” (SKM APASA 2013d; see Appendix F) to assess the potential relative benefits and risks associated with the placement of dredge material at alternative and current material placement sites. The objectives of this study were to assess the relative merits (if any) of dredge material placement at other sites.
The sediment plume modelling was based on relevant hypothetical placement scenarios (i.e. dredge material volumes based on capital or maintenance material, sediment characteristics, duration and dredging equipment) established in cooperation with port operators but do not represent specific, past or proposed, dredging campaigns. This study is a direct side-by-side comparison between alternative sites. As such it was necessary to model the same frequency of dredge material placement at each site at each location. It is acknowledged that this could not occur in practice, as several of the alternatives assessed were at much greater distances from the dredge area than the existing locations. This is an acknowledged limitation of the study but serves to achieve the stated objective of a direct comparison between sites.
The research was based entirely on existing information and data available to SKM and APASA. No field surveys of the existing environment were undertaken to support the results of this study. This research is not an EIA of a specific dredging project, nor does it replace EIAs that have been conducted for previous and currently proposed projects.
A key finding of this research was the existence of inter-annual variations of large-scale currents across all five major ports, which in turn would influence sediment migration patterns. The surface currents for the neutral (2007) and La Niña (2011) years were generally stronger and flowing towards the west-north-west, while in 2004 (El Niño conditions) the currents were weaker and more variable. The strongest currents occurred during 2011, coinciding with stronger wind events. The presence of this inter-annual variation in oceanographic conditions can be the cause of differences found in dredge plume footprints between models. The extent of the dredge plume footprint is dependent on what kind of year (neutral, La Niña or El Niño) the modellers have chosen to model. In this case, as a conservative approach, 2011 was selected as it was the most energetic year of the eight year data set assessed and the model outputs will provide an upper bound (credible maximum) that dredge sediments could travel.
It should be noted that this research is the first to incorporate the combined influence of waves, tides, local winds and large-scale currents when modelling the movement of dredge material over 12 months at multiple locations. Large-scale currents are not usually incorporated when modelling the fate of material placement and there is some debate as to the influence of large-scale currents in inshore areas of the Great Barrier Reef. Like any research, it has limitations and has identified areas for further research. As part of the further research, it would be necessary to model the travel of dredge sediment during multiple years (i.e. El Niño, La Niña and neutral years) while holding other parameters constant. As it is not known what kind of oceanographic conditions will be present at the time of the dredging it is important to predict what would happen to the dredge plume during different types of years (i.e. El Niño, La Niña and neutral).
28
This would highlight the differences in dredge plume footprints as a result of inter-annual variations and provide upper and lower bounds for the dredge plume footprints and greater certainty in predicted extents.
The main results and recommendations that stem from this report are:
1) The use of large-scale currents in modelling dredge plumes in the Great Barrier Reef is important and their use is advocated in the ‘Guidelines to hydrodynamic modelling for dredging projects’ produced by the GBRMPA (2012)
2) The use of large-scale currents has highlighted that dredge material may travel longer distances, through constant resuspension from the material placement site than originally understood
3) There is an existence of inter-annual variations of large-scale currents at the five ports, which in turn would influence sediment migration patterns. The surface currents for the neutral (2007) and La Niña (2011) years were generally stronger and flowing towards the west-north-west, while in 2004 (El Niño conditions) the currents were weaker and more variable. The strongest currents occurred during 2011, coinciding with stronger wind events. Therefore, as a conservative approach, 2011 was selected as part of this research study as it was the most energetic year and provided an upper bound that dredge sediments would travel
4) Offshore sites may not necessarily be more retentive than inshore sites. The use of alternate disposal sites needs to be assessed on a case by case basis depending on the sensitive receptors which may be impacted
5) The production of guidelines for environmental impact predictions by the regulators would enhance clarity and confidence for industry and consultants.
This first phase of research included a number of limitations, such as the model did not take the consolidation of dredge material on the bottom into account, which gives an upper bound for subsequent resuspension and migration. Furthermore, the project scope precluded interactions and comparisons between dredge material and ambient material. Additional modelling that incorporates ambient resuspension would provide valuable insight into the relative contributions of dredge material and other sources of sediment in the Region such as riverine inputs, and their subsequent migration. This would be a direct contribution to improved capabilities for cumulative impact assessment. Consideration of the effects of local-scale, shallow-water wave action around reefs and coastlines and resultant sediment resuspension, and tidal pumping and trapping of fine sediments into estuaries and mangroves was beyond the scope of this study. Finally, the Hybrid Coordinate Ocean Model (HYCOM) large scale-current predictions were combined onto the same grid as the HYDROMAP tides and local wind currents through vector addition within every grid point from the 10 m contour outward. There is debate on whether this is an over-estimate in the forcing. To further quantify this approach, future work would involve using the HYCOM large-scale current model predictions as boundary.
The maps provided in this report were produced to enhance the understanding of the sometimes subtle differences between dredge material placements at alternative sites. This does not necessarily imply that large amounts of sediments will be found at these sites, in fact, in some cases the amount of benthic deposition is so small that it could not even be measured. This was done purely to tease out a comparison between sites. The modelling provided in this report, and the associated maps are a first step in determining the ecological impacts of a dredge campaign. It shows the geographical extents of where the sediment may migrate to but does not necessarily imply ecological significance. This report should be read in conjunction with the ‘Sensitive Receptor
29
Risk Assessment of Alternate and Current Dredge Material Placement Sites’ (SKM APASA 2013d; see Appendix F) which describes in more detail the ecological relevance of the thresholds that were selected for the TSS, sedimentation rate and total sedimentation maps. The use of the 100th percentile TSS value in the case of Rosslyn Bay and Port of Townsville was purely done to allow for comparisons between the alternate model cases and current site at these study locations, respectively.
The maps and results of this study should not be taken out of context of the objective for which they were produced. They do not replace the need for detailed EIS’s nor can the results be extrapolated to other dredge scenarios remembering that what was modelled was specific for each port. This means, for example, that the modelled scenario for Townsville which involved the disposal of 400,000m3 of maintenance material cannot be extrapolated to a 10 million m3 capital dredging and disposal campaign. This will require its own EIS and may have substantially different results to those depicted in this report.
The modelling results for the six study locations showed:
Port of Gladstone
The TSS plumes migrated to the north-west for all of the model case sites.
For 95 per cent of the time during the material placement operation the TSS concentrations did not exceed 25 mg/L. Results for Model Cases 1 and 2 show the 10–24 mg/L contour extended up to 3 km and 10 km north–west, from the material placement sites, respectively. Two isolated regions with concentrations of 10–24 mg/L were predicted 2 km and 10 km to the north–west from Model Case 3.
The 95th percentile results showed that the sedimentation rate contours were widespread. The sedimentation rates of 100 mg/cm2/d and greater for Model Cases 1-3 included areas east of Curtis Island, Rundle, Hummocky and Keppel Islands and also 10 km north-west from the material placement sites. The highest sedimentation rate (≥ 250 mg/cm2/d) was within the boundary of the material placement sites.
At the end of the 19-week campaign, the mean thickness across Model Case 3 was greater (101 mm) than compared to Model Case 1 and 2 (~96 mm). Therefore the results indicated that Model Case 1 was more retentive than the placement at offshore areas (Model Cases 2 and 3).
At the end of 12 months, total sedimentation of ≥ 0.97 mm was predicted at the eastern extent of Curtis Island and around Rundle Island, and 5 km from the material placement sites for Model Cases 1 and 2. Results for Model Case 3 showed increased total sedimentation along the same regions but also included Hummocky Island and Keppel Islands.
Rosslyn Bay State Boat Harbour
The TSS plumes migrated to the north-north-west for the model cases and material placement sites. The concentrations were predicted to remain below 5 mg/L, 95 per cent of the time for all three material placement simulations.
The distribution of predicted sedimentation rates was very similar for Model Cases 1, 2 and current material placement site. The highest sedimentation rate (25–49 mg/cm2/day) were limited to within a 1 km from the material placement sites.
The mean increase in bottom thickness across the material placements sites at day 90 revealed that the current material placement site was higher and retained more sediments (~19 mm) compared to Model Cases 1 and 2 (13 mm and 11 mm,
30
respectively). Therefore the results indicated that current site was more retentive and that the placement at offshore areas (Model Cases 2 and 3).
At the end of the 12 months, total sedimentation of 100 mg/cm2 or greater (or bottom thickness of 1.11 mm or greater) were confined to within 1 km from the material placement sites.
Port of Hay Point
The TSS plumes migrated to the north-north-west for the model case and material placement sites. Based on the 95th percentile, predicted concentrations did not exceed 9 mg/L for Model Cases 1. For Model Case 2, the 95th percentile results showed concentrations between 10-24 mg/L or lower were predicted to be confined to within the boundary of the material placement site. In comparison, the 10-24 mg/L TSS concentrations were predicted to extend up to 13km north-north-west from the current material placement site.
The 95th percentile sedimentation rate results for Model Case 1, indicated that rates of 100 mg/cm2/d or greater occurred south of Carlisle, Brampton and St Bees Islands and the perimeter of the material placement site. Model Case 2 showed a sedimentation rate of 100 mg/cm2/d or greater south of Carlisle and Brampton Islands and around the boundary of the material placement site. The results for the current site revealed isolated regions of 100 mg/cm2/d or greater (above background) near the southern coastline of Brampton Island, a region approximately 10 km in a north-north-west direction and around the perimeter of the material placement site.
The mean bottom thickness at the end of the 155-day campaign was highest at the current material placement site (98 mm) compared to Mode Case 2 (96 mm) and Model Case 1 (89 mm). These results indicate that the current material placement site was more retentive.
Modelling at the end of the 12 months showed that for Model Cases 1 and 2, the greater total sedimentation levels (≥ 100 mg/ cm2 equivalent to ≥ 1.02 mm) were confined to within 1 km from the material placement sites. Depositional values of ≥ 250 mg/ cm2 (≥ 2.56 mm) were predicted to extend approximately 2-4 km in all directions from the current material placement site.
Port of Abbot Point
The 95th percentile analysis indicated that at the current site concentrations above 50 mg/L extended approximately 2.5 km west-north-west. While concentrations between 10-24 mg/L were predicted to extend up to 15 km from the current placement site. In contrast, modelling showed smaller plumes of lower concentration (less than 25 mg/L) for Model Cases 1 and Case 2. Concentrations between 10-24 mg/L were predicted to extend up to 10 km north-west from the boundary.
There were considerable differences in the sedimentation rate contours between the existing material placement site and the two model case sites based on the 95th percentile analysis. For Model Cases 1 and 2, rates of sedimentation of 100 mg/cm2/d or greater were predicted around the material placement sites. In contrast, the results for the current material placement site showed elevated sedimentation rates around the site and along the coast near Cape Upstart and adjacent to Alva.
31
The current material placement site was predicted to retain the greatest average thickness at the end of the 56-day period (330 mm) compared to Model Case 1 (110 mm) and Model Case 2 (165 mm). The current material placement site was predicted to be more retentive than the other model cases.
At the end of the 12 months, higher total sedimentation levels (≥ 100 mg/ cm2, equivalent to ≥ 0.97 mm) were within 5-10 km from the current material placement site.
Port of Townsville
The TSS plumes were predicted to mainly disperse in a north-west direction for all three modelled material placement sites
The TSS concentrations would remain equal to or below 5 mg/L for 95 per cent of the time at all three material placement sites. In order to compare the alternate sites the 100th percentile was shown in the results.
Fifty per cent of the time, the sedimentation rates did not exceed 24 mg/cm2/d for all three sites. Based on the 95th percentile analysis, the elevated rates of sedimentation of 100 mg/cm2/d or more were confined to the material placement sites.
Results demonstrated very small increases in mean thicknesses across the material placement sites by day 45 (between 1.7 mm to 2.1 mm). All three sites were predicted to be equally dispersive.
Modelling results at the end of the 12 months indicated that higher total sedimentation levels (≥ 100 mg/cm2, equivalent to ≥ 0.97 mm) were confined within the material placement sites.
Port of Cairns
The TSS plumes migrated to the north-west for all of the model case sites. There were no concentrations greater than 9 mg/L predicted for Model Cases 1 and 2, on the basis of the 95th percentile analysis. Results for the current material placement site revealed that the 10-24 mg/L contour extended approximately 2 km north-west of the material placement site.
For Model Cases 1 and 2, the 95th percentile analysis showed elevated rates of sedimentation (100 mg/cm2/d or more) within the material placement site, along the Penguin Channel at Cape Kimberley and at Snapper Island. In comparison, the results for the current material placement site was predicted to have smaller areas of elevated rates of sedimentation (100 mg/cm2/d or more) along the Penguin Channel at Cape Kimberley north-west of the placement site.
The results indicated that the mean thickness across the current material placement site (8 mm) was, approximately 2 mm greater than the average thickness increases at Model Cases 1 and 2 at day 38. The current site was predicted to be more retentive than the offshore alternate areas.
Modelling results at the end of the 12 months indicated for all three sites the higher total sedimentation levels (≥ 100 mg/cm2, equivalent to ≥ 0.97 mm) were confined to within 2.5 km from the material placement sites.
Finally, a comparison between the results at the completion of the material placement period and at 12 months for all study locations revealed the extent of the total

32
sedimentation areas were significantly reduced, due to continuing sediment resuspension processes and sediment shifting in a northward direction.
33
Sensitive Receptors Risk Assessment
This report is the final and fourth sub-task of the third task of the project. The full report is presented in Appendix F Sensitive Receptors Risk Assessment (SKM APASA 2013d; see Appendix F).
This final report examines modelling of TSS, sedimentation rate, and total sedimentation in the six study areas in relation to the relative risks to sensitive receptors that result from placement of dredge material in potential alternative site as well as the currently used placement site. The current material placement site at Gladstone was not modelled because currently approved projects will use the remaining capacity of the site.
The study compares the implications of placing dredge material at hypothetical alternative model cases as well as the currently used sites (except for Gladstone) for hypothetical scenarios developed in cooperation with the port authority and GBRMPA. The primary objective of the modelling component of the study was to provide insight into the dispersal of dredge material from alternative placement sites, using a consistent modelling approach applied over large spatial and temporal scales. The purpose of the sensitive receptor risk assessment, the subject of this report, was to characterise the relative ecological implications, risks and uncertainties of placement at alternative sites.
The focus in using this report should be on comparing alternatives, not on detailed assessments of individual alternatives. In this sense, the study constitutes a screening-level “sensitivity analysis” of the relative merits, if any, of potential alternative placement areas. The study serves as a tool to guide the selection and assessment of options for ocean placement of dredge material; it does not and should not be interpreted as recommending specific sites. This research is not an EIA of any specific project, nor does it replace EIAs that have been conducted for previous and currently proposed projects. In fact, this research has further reinforced the need for detailed, project-specific EIAs in the World Heritage Area.
This pilot study is the first to incorporate the effects of large-scale currents in the Region in modelling the migration of dredge material over the long term (12 months). One of the most important results of the study is that dredge material placed at sea has the potential to migrate on much greater spatial and temporal scales than has previously been appreciated, largely because the influence of large-scale currents has not previously been included in modelling of dredge material transport.
Another key finding of the study is that placement of material in deeper water further offshore in the Reef lagoon than the currently used placement sites does not necessarily result in reduced migration of dredge material. In fact, because of the effects of large-scale currents, material placed offshore may be more mobile than if placed in the current sites closer to shore. There was little difference in the predicted retentiveness of the existing inshore placement sites and the modelled alternative sites offshore. However, in general material from the inshore sites migrated more in the coastal zone nearer the placement site, whereas material placed further offshore moved further distances to the north-west before reaching the coastal zone, and was more likely to impinge upon receptors further offshore. Material placed further offshore also tended to move further in the long-term (12-month) modelling, often beyond the model boundary. This reinforces the need for detailed case-by-case assessment of existing and proposed placement sites in relation to potentially affected sensitive receptors.
34
The modelling and environmental risk assessment for the six study areas has evaluated relative potential risks and benefits from placement of dredge material at alternative model case sites. Overall, risks related to increased suspended sediment concentrations were low for most modelled sites. The primary risks to sensitive receptors identified were related to increased sedimentation rates and total sedimentation. Risks are summarised on a port-by-port basis in following sections.
Mitigation measures associated with individual material placement projects will depend on the specific project. At the initial screening level of this study, the first step in risk mitigation would be more detailed assessment of any proposed alternative placement site, which has been done in conjunction with proposals for new placement areas at several of the six locations. Again, this reinforces the need for detailed, project-specific EIAs of proposed dredging and material placement projects.
An important result of the study has been to identify key knowledge gaps and research areas in relation to developing improved management strategies for dredge material in the Region. Given the time and financial constraints on the study, and the ambitious undertaking of applying a novel approach (including the influence of large scale currents and modelling over a full 12 months after commencement of dredging) at the scale of the entire Reef, necessitated a number of simplifying assumptions. These, and their potential implications, are described in the body of the report. An important result of considering the assumptions has been to identify key knowledge gaps and topics for further research.
Many of these knowledge gaps and topics for further research involve further studies to determine the sensitivity of the model predictions to the study’s assumptions. This sensitivity analysis would be invaluable in developing improved models to provide the best possible predictive assessment of dredge material movement in the World Heritage Area. Model sensitivity analysis would also help set priorities for field and laboratory research, by identifying which parameters are most critical to quantify. Perhaps most importantly, the results are needed to help clarify the range of variability and uncertainty in model predictions of dredge material migration. Key topics for model sensitivity analysis include:
Inter-annual variability. The modelling in this study used data from 2011, which was a strong La Niña year and had the most energetic conditions (i.e. highest current speeds) of the 2004-2011 period of data examined. Understanding how the model would predict sediment migration in El Niño or neutral years would help reduce uncertainty.
Sediment resuspension. Sediment resuspension was modelled using uniform estimates based on accepted published values. Additional model runs varying these estimates would elucidate the sensitivity of the model predictions to this parameter.
Sediment consolidation. The model did not take into account the consolidation of dredge material on the bottom after initial deposition (SKM APASA 2013c; see Appendix E). Again, the importance of this assumption, and thus the priority of studies to quantify consolidation, could be tested through model sensitivity studies.
Ambient background. The study modelling predicted "above background" TSS and sedimentation, a standard approach but with important implications. These include the potential for small increases above background to cause additional stress or even tip the system over a tolerance threshold; conversely it is possible that the above-background increase will be very small relative to the ambient background, that is, that the ambient regime will predominate over the effects of dredge material placement. Modelling that incorporates resuspension of ambient sediment will
35
reduce uncertainty regarding long-term migration of sediment and also be a direct contribution to improved capabilities for cumulative impact assessment.
How to incorporate large-scale currents. The modelling in this study incorporated the influence of large-scale currents on sediment transport through a process of vector addition, that is, overlaying the effects of large-scale currents on local conditions (SKM APASA 2013c; see Appendix E). To improve understanding of the most appropriate way to include the influence of large-scale currents in predictive modelling, studies using a different approach, specifically modelling that applies the influence of large-scale currents as boundary conditions rather than a simple overlay, is recommended.
Shallow-water processes. Constraints on the study prevented the inclusion of shallow-water processes, specifically shallow wave effects and tidal pumping of sediment into mangroves and estuaries, in the modelling (SKM APASA 2013c; see Appendix E). The model predictions of relatively high sediment deposition on the exposed windward sides of islands and reefs do not take these processes into account and are therefore unlikely to be realistic. If the study is used for the intended purpose, comparison of the relative outcomes of placing material in different locations, and not to predict impacts on specific receptors, this is not a critical assumption. Detailed EIAs, however, need to consider these processes.
Presentation of results. Model results presented as maps of percentiles of occurrence of various TSS concentrations and sedimentation rates are sometimes difficult to understand and interpret. SKM and APASA believe it would be beneficial to initiate a process to address questions such as: a) What is the best way to represent model output? b) What should be industry standards or what is considered best practice when reporting modelling results? c) How should the technical/regulatory community interpret modelling results?
In addition to sensitivity analysis of the model predictions, direct field studies are needed both to validate the model and conversely to better quantify the parameters that the sensitivity analysis indicates are most critical. Subject to the sensitivity analysis, priority areas for field studies are:
Direct measurements of resuspension. The model predictions of significant sediment resuspension in offshore areas deeper than 20 m are an unexpected result. Field measurements of bed shear-stress and/or sediment resuspension would help validate the model and also improve understanding of the implications of placing dredge material at new sites in deeper water, further offshore, than at present. It is possible that existing data collected for measuring current speeds could be “data mined” and reprocessed to provide at least preliminary data on actual resuspension.
Material consolidation studies. The modelling did not take into account the consolidation (natural compaction of material with time) of sediment after initial deposition on the seabed after release. Consolidation is known to occur and potentially has a large effect on the modelling predictions of this study. Field and laboratory studies such as Wolanski et al. (1992) examining consolidation and resuspension in terms of sediment concentrations in the water column in relation to currents would be useful in quantifying consolidation and its effects on resuspension. Consolidation of seabed sediments can also be measured directly with advanced techniques such as sediment profile imagery (SPI).
The model in this study assumed material was released randomly over the sites. Operational measures during dredge material placement have the potential to reduce
36
loss of dredge material from a placement site, and further modelling and/or direct studies of sediment consolidation and resuspension in relation to placement methodology would provide improved understanding of the potential effectiveness of such measures. Navigational considerations, hydrodynamic and habitat effects of altered bathymetry, operational constraints, and other factors also need to be considered in designing the placement methodology. Port- and project-specific EIAs are required to identify and assess specific operational mitigation measures.
The finding that dredge material has the potential to migrate on larger spatial and temporal scales than previously appreciated indicates a strong need for a more strategic approach to water quality and ecological monitoring in the Region with regard to sediment-related impacts. Key aspects of such an approach include:
The monitoring should operate at multiple spatial scales, up to the scale of the Region as a whole
The monitoring should be a long-term (i.e. permanent) program
The program should be designed to maximise the ability to differentiate sources of sediments in relation to water quality conditions
The program should be designed to support assessment of cumulative impacts and ecosystem resilience.
The detailed scientific design of such a strategic monitoring program will require considerably improved understanding of the long-term behaviour of dredge material, as well as sediment from other sources, including through the research identified above. The process for developing the program, however, should commence as soon as possible and not wait for the outcomes of future research.
The results of this study clearly identify the need for better understanding of the cumulative impacts of coastal development activities, including dredging and dredge material placement, on water quality and thereby the ecosystems of the Region. It must also be recognised that there are multiple stresses on the Reef ecosystem in addition to sediment-related effects. Some of these stresses, most importantly climate change and ocean acidification, cannot be managed at the Regional level. Management of dredge material must therefore occur in the context of maintaining ecosystem resilience to broader-scale stresses. Robust, objective, and science-based methodologies are needed, in the first instance to design a strategic monitoring program, but much more broadly to define, assess, and manage cumulative impacts and ecosystem resilience in the Region, and to assess the effectiveness of management interventions.
The modelling predicted the spatial extent of a range of levels of TSS, sedimentation rate, and total sedimentation without regard to potential impacts. As the purpose of the study was to compare and contrast potential advantages and disadvantages of alternative material placement locations, the values presented in the output maps were selected with regard to both ecological relevance and the need to select values that provided contour maps useful for comparative purposes. Ecologically relevant thresholds vary widely, between regions, ecosystem types (e.g. reefs, seagrass meadows), and depend on considerations such as background water quality, species composition, ecosystem resilience, and other existing natural and anthropogenic stresses. The model output values did take into account available information on species tolerances to sediment-related stress and their variability.
Modelling for dredging projects in the World Heritage Area is most often conducted with regard to impacts on corals. Tolerance to chronic TSS concentrations in coral
37
communities ranges from < 10 mg/L for offshore communities in clear waters to > 100 mg/L for some nearshore reefs (Erftemeijer et al. 2012). Measured tolerances of individual coral species to more acute exposures to TSS range from TSS concentrations of < 30 mg/L to as high as 1000 mg/L TSS for exposures in the order of several weeks. Measured tolerance thresholds to sedimentation rate in individual coral species range from < 10 mg/cm2/d to > 400 mg/cm2/d (Erftemeijer et al. 2012). Thresholds for light-related impacts in seagrasses are generally measured in terms of absolute light levels or a percentage of surface irradiance, which could not be related to TSS concentrations in the scope of this study. Time scales for light deprivation impacts on seagrasses are weeks to months.
The contoured values for total sedimentation (the total amount of sediment resting on the bottom, including on organisms living there) are again most relevant to corals. Impacts on corals have been observed at a total sedimentation as low as 0.14 mg/cm2 and as high as 234 mg/cm2, and for studies that measure total sedimentation as the thickness of sediment on the bottom, from 2–5 mm, but there have been relatively few studies of total sedimentation thresholds in corals. The maximum value of 250 mg/cm2 contoured in this study, corresponding to a bottom thickness of 2.63-4.10 mm (depending on the study area modelled in this report), is well below the lowest published impact thresholds for seagrasses (15 mm; Erftemeijer & Lewis 2006).
Many receptors in the Region (seagrasses, macroalgae, microphytobenthos, soft corals, ascidians, sponges, anemones, giant clams, and other invertebrates with photosynthetic symbionts) can be affected by TSS sedimentation rate and total sedimentation, but tolerance thresholds are poorly known.
Given the wide range of potential receptor tolerances, a range of values for TSS (5-50 mg/L), sedimentation rate (5-250 mg/cm2/d) and total sedimentation (5-250 mg/cm2, or 0.05 to 4.10 mm, depending on study area) are presented in the modelling output maps. These ranges can generally be considered precautionary, especially for receptors other than corals, and are also useful in comparing the implications of placement options. It is stressed that the main purpose of this study is not to assess impacts on specific receptors, but rather to compare the relative risks and benefits, if any, of material placement at different locations.
Port of Gladstone
Modelling results for TSS for all model cases pose low risk to sensitive receptors in the area with infrequent (95th percentile) concentrations of 10 mg/L predicted
Modelling results for sedimentation rate were similar for all model cases. Results showed sustained (50th percentile) sedimentation rate would generally remain within Model Case boundaries. Infrequent episodes (95th percentile) of high sedimentation along the coast north of Gladstone extending north of the Keppel Islands with medium risks identified for coral reefs, fish habitat areas (FHAs) and Non-General Use Zones.
Modelling results for total sedimentation were similar for all model cases, with sediment deposited along the coast north of Gladstone extending north of the Keppel Islands. This reflects the repeated settlement and resuspension of sediments until they arrive at natural depositional environments.
The three model cases have similar patterns TSS, sedimentation rate, and total sedimentation. Model Case 1 was assessed to pose the lowest risk to sensitive receptors, with risks rated as low to medium.
Current environmental conditions in the Fitzroy region are monitored through the Reef Rescue Marine Monitoring Program (RRMMP), which involves water quality and reef health. Monitoring has found waters in the area demonstrate a clearly

38
declining inshore to offshore gradient, with annual median TSS values of 5 mg/L in inshore waters declining to < 0.5 mg/L in midshelf waters. There is also gradient of approximately 5 mg/L to 1 mg/L moving north from the mouth of the Fitzroy River The area has received a moderate TSS paddock to reef rating since 2002, although turbidity has increased since 2008 (Brando et al. 2011, Schaffelke et al. 2011). Reef health around the Keppel Islands has been declining since 2009, receiving a poor rating in 2011 (Thompson et al. 2011a,b).
Rosslyn Bay State Boat Harbour
Modelling results for TSS, sedimentation rate, and total sedimentation indicated that demonstrated that material placement at Model Cases 1 and 2 and the current site would pose low to medium risks sensitive receptors. The medium risks for Model Case 1 and the current site result from the location of the current site in a Conservation Park Zone, and the close proximity of Model Case 1. The medium risk for Model Case 2 results from low levels of total sedimentation both during the dredging period and after 12 months in the Corio Bay FHA.
Modelling results predicted there would be no environmental benefit in moving the current material placement site east to Model Case 1 or north-east to Model Case 2. While Model Case 1 is located outside of the Conservation Park Zone, the 100th percentile TSS contours predicted a slightly more severe suspended sediment plume for this placement site than for the current site, which is located within the Conservation Park Zone.
Current environmental conditions in the Fitzroy region are monitored through the RRMMP. Monitoring has found waters in the area demonstrate a clearly declining inshore to offshore gradient with annual median TSS values of 5 mg/L in inshore waters. The area has received a moderate TSS paddock to reef rating since 2002, although turbidity has increased since 2008 (Brando et al. 2011, Schaffelke et al. 2011). Reef health around the Keppel Islands has been declining since 2009, receiving a poor rating in 2011 (Thompson et al. 2011a,b).
Port of Hay Point
Modelling of TSS predicted sediment plumes of low intensity, with risks assessed as low for all but two receptors for the current site, assessed as medium risk to a non-General Use Zone and coral reefs. Risks from TSS plumes were assessed as low for Model Cases 1 and 2.
Modelling for the current site predicted elevated sedimentation rates and total sedimentation along the coast and around islands located in a line running parallel with the coast, 20 km east of the mainland. Coastal sedimentation is avoided for Model Cases 1 and 2 due to the offshore location, however total sedimentation is higher at islands to the north than for the current site. Material was predicted to be more mobile if places at Model Cases 1 and 2, and after 12 months sediment deposited at the end of the dredging period had moved beyond the model domain. Risks were assessed as being medium to high for coral reefs across all model cases.
Model Cases 1 and 2 may provide a lower level of environmental risk than the current site. There may therefore be merit in further investigating the offshore alternative material placement sites at Hay Point, as a means of reducing sediment-related environmental risks from placement activities at the current site on inshore coral reef and soft bottom communities between Hay Point and Airlie Beach.
39
Current environmental conditions in the Mackay and Whitsunday region are monitored through the RRMMP. Monitoring has found waters in the area demonstrate a clearly declining inshore to offshore gradient with annual median TSS values of 5 mg/L in inshore waters. The area has generally received improving TSS paddock to reef ratings since 2002, although turbidity has increased since 2008 (Brando et al. 2011, Schaffelke et al. 2011). Reef health in the Mackay and Whitsunday Islands has remained stable since 2009 with a moderate rating (Thompson et al. 2011a,b). Data from the AIMS Long Term Monitoring Program show coral cover in the Whitsundays inshore monitoring sites has generally increased since 1993 (AIMS 1996-2013).
Port of Abbot Point
Suspended sediment plumes generally posed a low risk to sensitive receptors for Model Cases 1 and 2, while the current site was generally assessed as having medium risks
Modelling for the current site predicted high sedimentation rates and total sedimentation at Cape Upstart, which has high environmental values, resulting in high risk ratings for some receptors. Risks to the Burdekin FHA were assessed as high for all three placement sites due to predicted increases in sedimentation rate and total sedimentation.
Model Cases 1 and 2 appear to have a lower level of environmental risk than the current site due to their distance offshore
Current environmental conditions in the Burdekin region are monitored through the RRMMP. Monitoring has found waters in the area demonstrate a clearly declining inshore to offshore gradient with annual median TSS values of 5 mg/L in inshore waters. The area has generally received improving TSS paddock to reef ratings since 2002, although turbidity has increased since 2008 (Brando et al. 2011, Schaffelke et al. 2011). Reef health in the Burdekin region has remained declined since 2009 with a poor rating in 2011 (Thompson et al. 2011a,b).
Port of Townsville
Environmental risks associated with suspended sediment plumes are predicted to be low for Model Cases 1 and 2. Modelled plumes from the current site received medium risk ratings as plumes infrequently (95th percentile) have the potential to impact on a number of sensitive receptors (coral, seagrass and tourism).
Modelling predicted some infrequent (95th percentile) short-term (dredging period) sedimentation across the Townsville region, with sedimentation coinciding with island and reef communities of Great Palm and Magnetic Islands. However, that under average (50th percentile) conditions during the dredging period, sedimentation rates only increased around the extent of the material placement sites.
During the dredging period the model predicted higher total sedimentation sediment accumulation along the coast, particularly in Cleveland Bay and the east side of Magnetic Island, and less deposition offshore, for the current site compared to Model Cases 1 and 2. After 12 months most sediment had moved north, except small amounts of residual sedimentation along the coast as far north as Hinchinbrook Island for the current site.
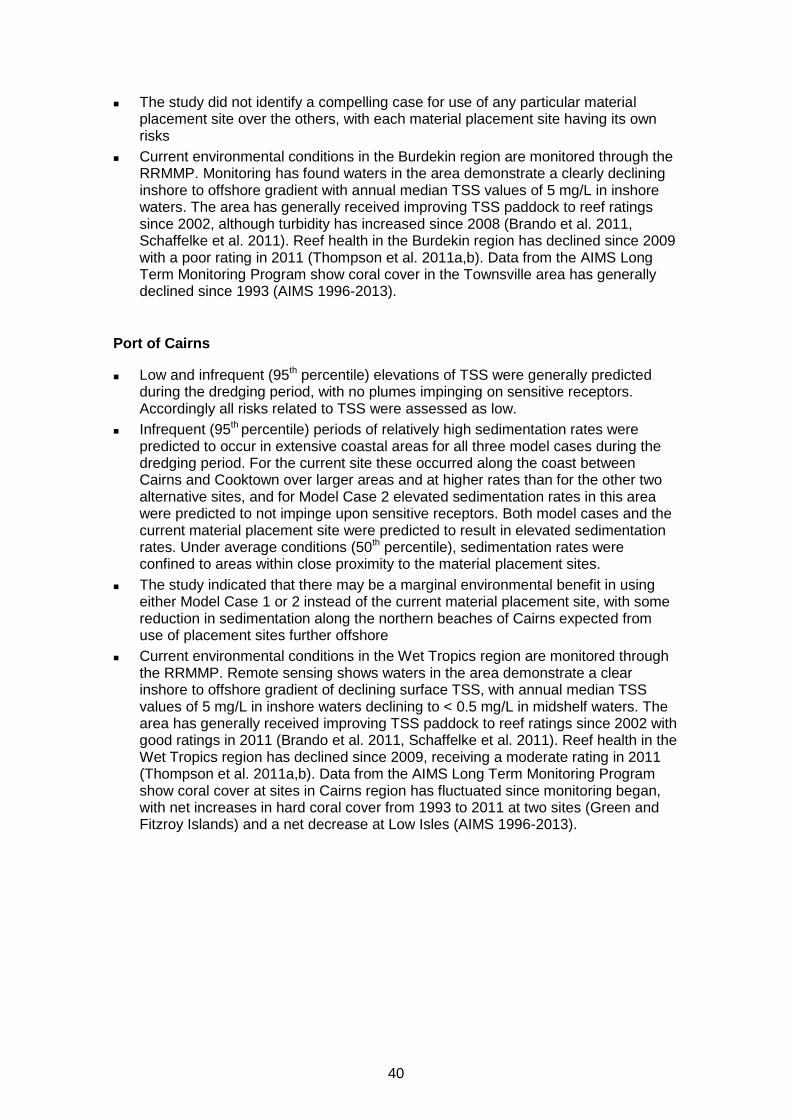
40
The study did not identify a compelling case for use of any particular material placement site over the others, with each material placement site having its own risks
Current environmental conditions in the Burdekin region are monitored through the RRMMP. Monitoring has found waters in the area demonstrate a clearly declining inshore to offshore gradient with annual median TSS values of 5 mg/L in inshore waters. The area has generally received improving TSS paddock to reef ratings since 2002, although turbidity has increased since 2008 (Brando et al. 2011, Schaffelke et al. 2011). Reef health in the Burdekin region has declined since 2009 with a poor rating in 2011 (Thompson et al. 2011a,b). Data from the AIMS Long Term Monitoring Program show coral cover in the Townsville area has generally declined since 1993 (AIMS 1996-2013).
Port of Cairns
Low and infrequent (95th percentile) elevations of TSS were generally predicted during the dredging period, with no plumes impinging on sensitive receptors. Accordingly all risks related to TSS were assessed as low.
Infrequent (95th percentile) periods of relatively high sedimentation rates were predicted to occur in extensive coastal areas for all three model cases during the dredging period. For the current site these occurred along the coast between Cairns and Cooktown over larger areas and at higher rates than for the other two alternative sites, and for Model Case 2 elevated sedimentation rates in this area were predicted to not impinge upon sensitive receptors. Both model cases and the current material placement site were predicted to result in elevated sedimentation rates. Under average conditions (50th percentile), sedimentation rates were confined to areas within close proximity to the material placement sites.
The study indicated that there may be a marginal environmental benefit in using either Model Case 1 or 2 instead of the current material placement site, with some reduction in sedimentation along the northern beaches of Cairns expected from use of placement sites further offshore
Current environmental conditions in the Wet Tropics region are monitored through the RRMMP. Remote sensing shows waters in the area demonstrate a clear inshore to offshore gradient of declining surface TSS, with annual median TSS values of 5 mg/L in inshore waters declining to < 0.5 mg/L in midshelf waters. The area has generally received improving TSS paddock to reef ratings since 2002 with good ratings in 2011 (Brando et al. 2011, Schaffelke et al. 2011). Reef health in the Wet Tropics region has declined since 2009, receiving a moderate rating in 2011 (Thompson et al. 2011a,b). Data from the AIMS Long Term Monitoring Program show coral cover at sites in Cairns region has fluctuated since monitoring began, with net increases in hard coral cover from 1993 to 2011 at two sites (Green and Fitzroy Islands) and a net decrease at Low Isles (AIMS 1996-2013).
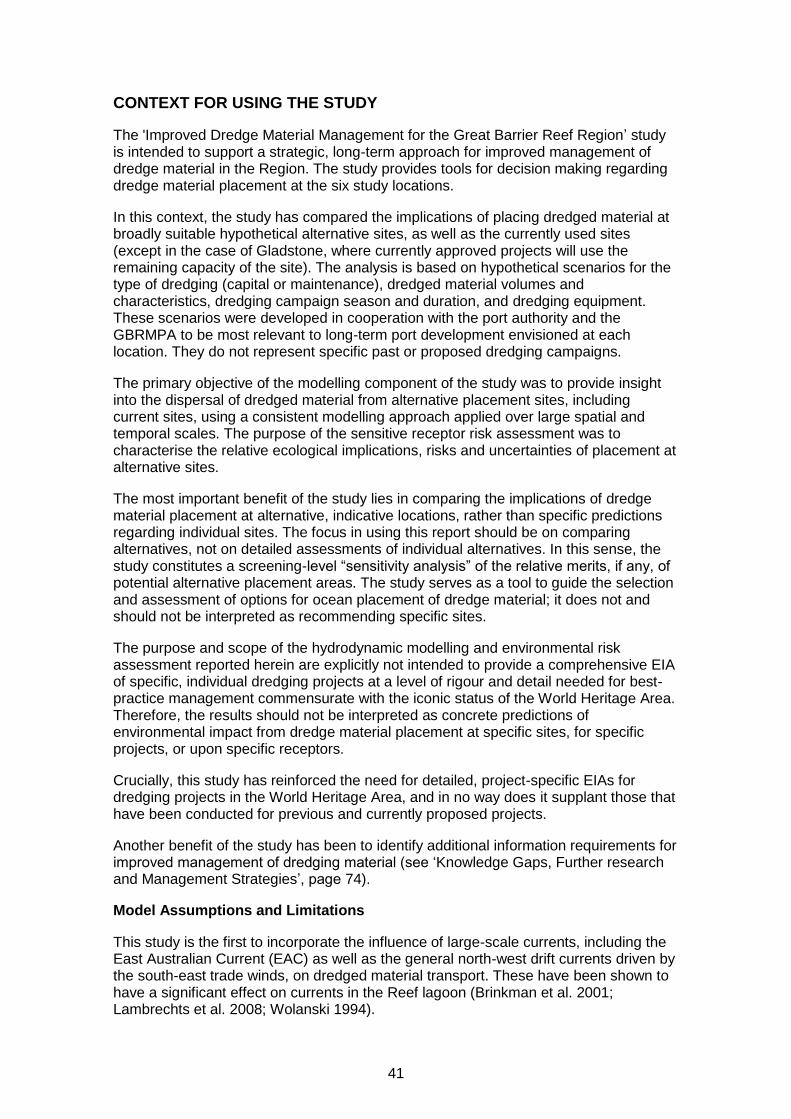
41
CONTEXT FOR USING THE STUDY
The 'Improved Dredge Material Management for the Great Barrier Reef Region’ study is intended to support a strategic, long-term approach for improved management of dredge material in the Region. The study provides tools for decision making regarding dredge material placement at the six study locations.
In this context, the study has compared the implications of placing dredged material at broadly suitable hypothetical alternative sites, as well as the currently used sites (except in the case of Gladstone, where currently approved projects will use the remaining capacity of the site). The analysis is based on hypothetical scenarios for the type of dredging (capital or maintenance), dredged material volumes and characteristics, dredging campaign season and duration, and dredging equipment. These scenarios were developed in cooperation with the port authority and the GBRMPA to be most relevant to long-term port development envisioned at each location. They do not represent specific past or proposed dredging campaigns.
The primary objective of the modelling component of the study was to provide insight into the dispersal of dredged material from alternative placement sites, including current sites, using a consistent modelling approach applied over large spatial and temporal scales. The purpose of the sensitive receptor risk assessment was to characterise the relative ecological implications, risks and uncertainties of placement at alternative sites.
The most important benefit of the study lies in comparing the implications of dredge material placement at alternative, indicative locations, rather than specific predictions regarding individual sites. The focus in using this report should be on comparing alternatives, not on detailed assessments of individual alternatives. In this sense, the study constitutes a screening-level “sensitivity analysis” of the relative merits, if any, of potential alternative placement areas. The study serves as a tool to guide the selection and assessment of options for ocean placement of dredge material; it does not and should not be interpreted as recommending specific sites.
The purpose and scope of the hydrodynamic modelling and environmental risk assessment reported herein are explicitly not intended to provide a comprehensive EIA of specific, individual dredging projects at a level of rigour and detail needed for best-practice management commensurate with the iconic status of the World Heritage Area. Therefore, the results should not be interpreted as concrete predictions of environmental impact from dredge material placement at specific sites, for specific projects, or upon specific receptors.
Crucially, this study has reinforced the need for detailed, project-specific EIAs for dredging projects in the World Heritage Area, and in no way does it supplant those that have been conducted for previous and currently proposed projects.
Another benefit of the study has been to identify additional information requirements for improved management of dredging material (see ‘Knowledge Gaps, Further research and Management Strategies’, page 74).
Model Assumptions and Limitations
This study is the first to incorporate the influence of large-scale currents, including the East Australian Current (EAC) as well as the general north-west drift currents driven by the south-east trade winds, on dredged material transport. These have been shown to have a significant effect on currents in the Reef lagoon (Brinkman et al. 2001; Lambrechts et al. 2008; Wolanski 1994).
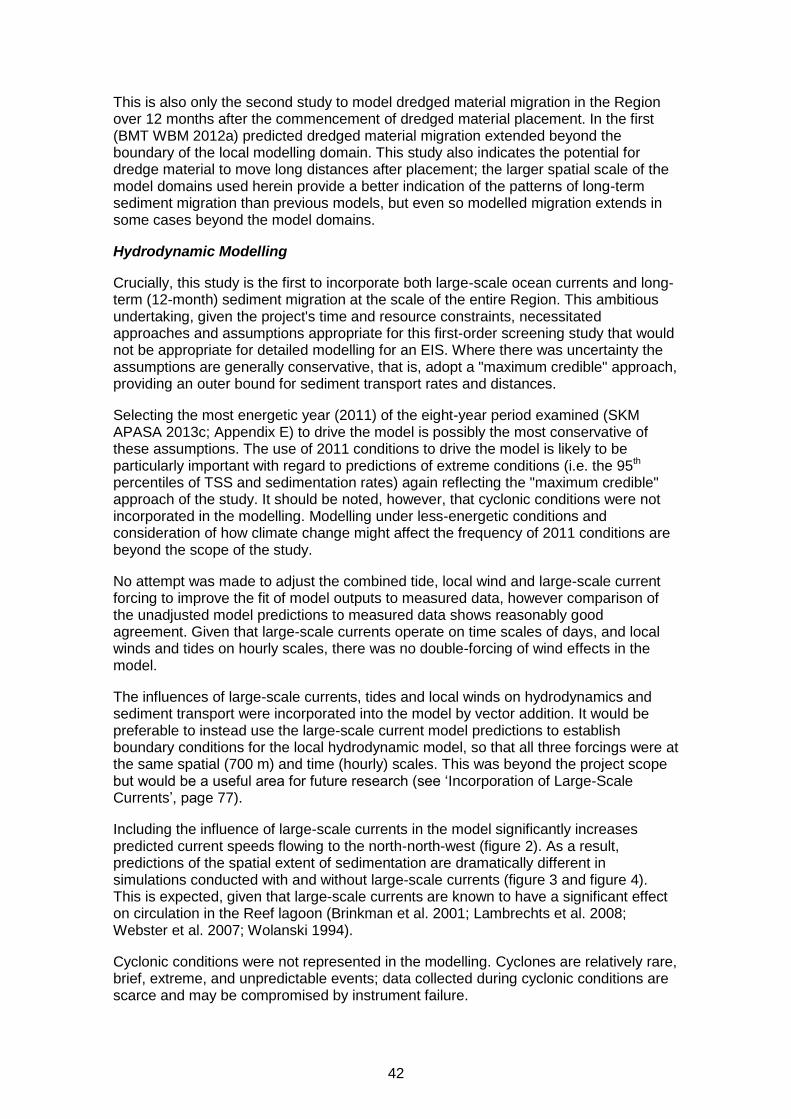
42
This is also only the second study to model dredged material migration in the Region over 12 months after the commencement of dredged material placement. In the first (BMT WBM 2012a) predicted dredged material migration extended beyond the boundary of the local modelling domain. This study also indicates the potential for dredge material to move long distances after placement; the larger spatial scale of the model domains used herein provide a better indication of the patterns of long-term sediment migration than previous models, but even so modelled migration extends in some cases beyond the model domains.
Hydrodynamic Modelling
Crucially, this study is the first to incorporate both large-scale ocean currents and long-term (12-month) sediment migration at the scale of the entire Region. This ambitious undertaking, given the project's time and resource constraints, necessitated approaches and assumptions appropriate for this first-order screening study that would not be appropriate for detailed modelling for an EIS. Where there was uncertainty the assumptions are generally conservative, that is, adopt a "maximum credible" approach, providing an outer bound for sediment transport rates and distances.
Selecting the most energetic year (2011) of the eight-year period examined (SKM APASA 2013c; Appendix E) to drive the model is possibly the most conservative of these assumptions. The use of 2011 conditions to drive the model is likely to be particularly important with regard to predictions of extreme conditions (i.e. the 95th percentiles of TSS and sedimentation rates) again reflecting the "maximum credible" approach of the study. It should be noted, however, that cyclonic conditions were not incorporated in the modelling. Modelling under less-energetic conditions and consideration of how climate change might affect the frequency of 2011 conditions are beyond the scope of the study.
No attempt was made to adjust the combined tide, local wind and large-scale current forcing to improve the fit of model outputs to measured data, however comparison of the unadjusted model predictions to measured data shows reasonably good agreement. Given that large-scale currents operate on time scales of days, and local winds and tides on hourly scales, there was no double-forcing of wind effects in the model.
The influences of large-scale currents, tides and local winds on hydrodynamics and sediment transport were incorporated into the model by vector addition. It would be preferable to instead use the large-scale current model predictions to establish boundary conditions for the local hydrodynamic model, so that all three forcings were at the same spatial (700 m) and time (hourly) scales. This was beyond the project scope but would be a useful area for future research (see ‘Incorporation of Large-Scale Currents’, page 77).
Including the influence of large-scale currents in the model significantly increases predicted current speeds flowing to the north-north-west (figure 2). As a result, predictions of the spatial extent of sedimentation are dramatically different in simulations conducted with and without large-scale currents (figure 3 and figure 4). This is expected, given that large-scale currents are known to have a significant effect on circulation in the Reef lagoon (Brinkman et al. 2001; Lambrechts et al. 2008; Webster et al. 2007; Wolanski 1994).
Cyclonic conditions were not represented in the modelling. Cyclones are relatively rare, brief, extreme, and unpredictable events; data collected during cyclonic conditions are scarce and may be compromised by instrument failure.
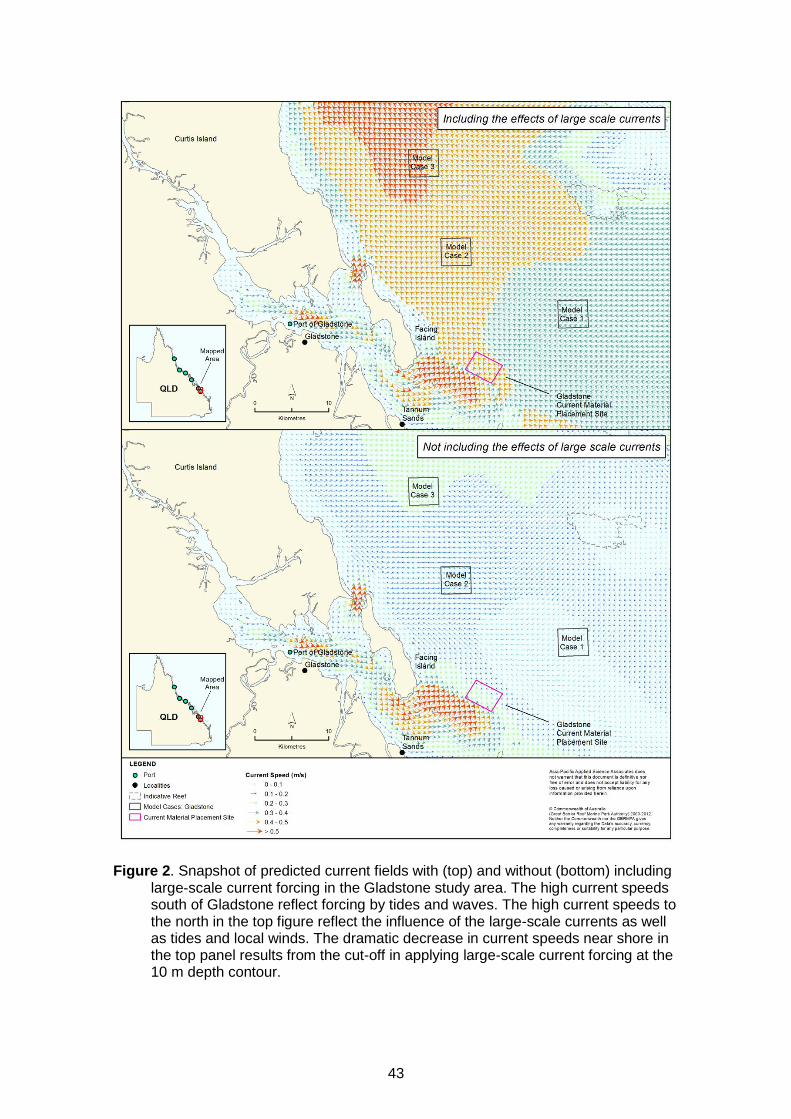
43
Figure 2. Snapshot of predicted current fields with (top) and without (bottom) including large-scale current forcing in the Gladstone study area. The high current speeds south of Gladstone reflect forcing by tides and waves. The high current speeds to the north in the top figure reflect the influence of the large-scale currents as well as tides and local winds. The dramatic decrease in current speeds near shore in the top panel results from the cut-off in applying large-scale current forcing at the 10 m depth contour.
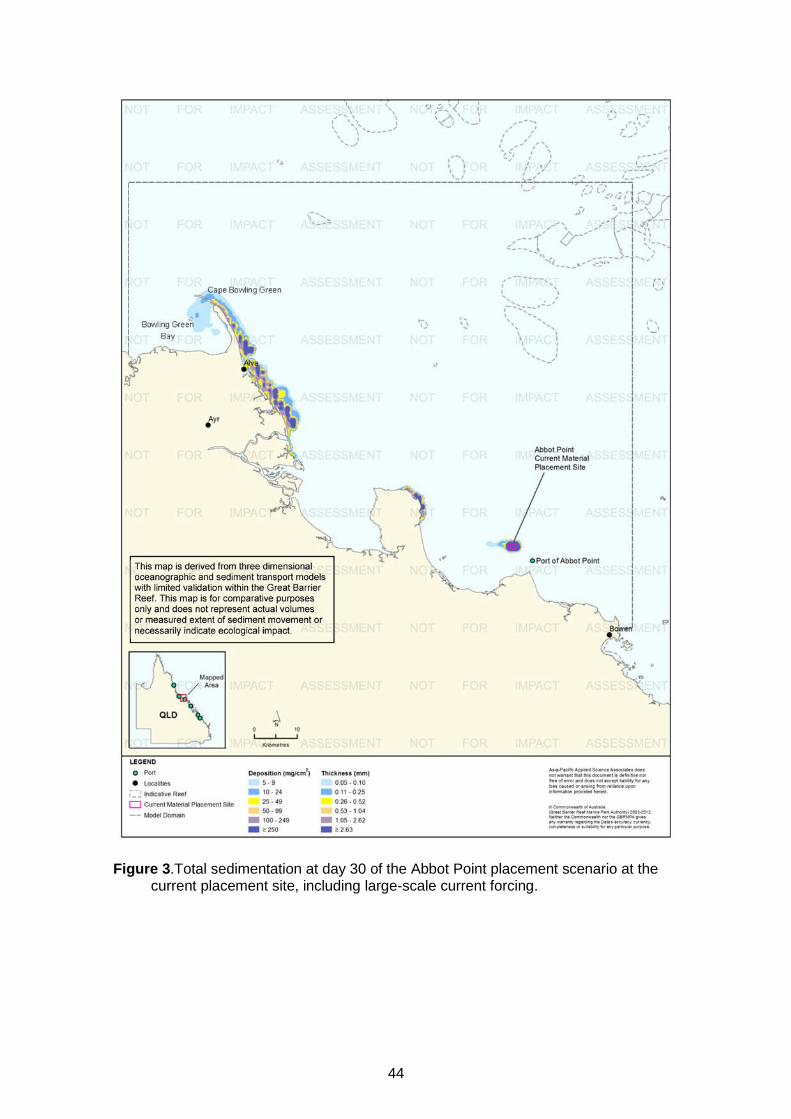
44
Figure 3.Total sedimentation at day 30 of the Abbot Point placement scenario at the current placement site, including large-scale current forcing.
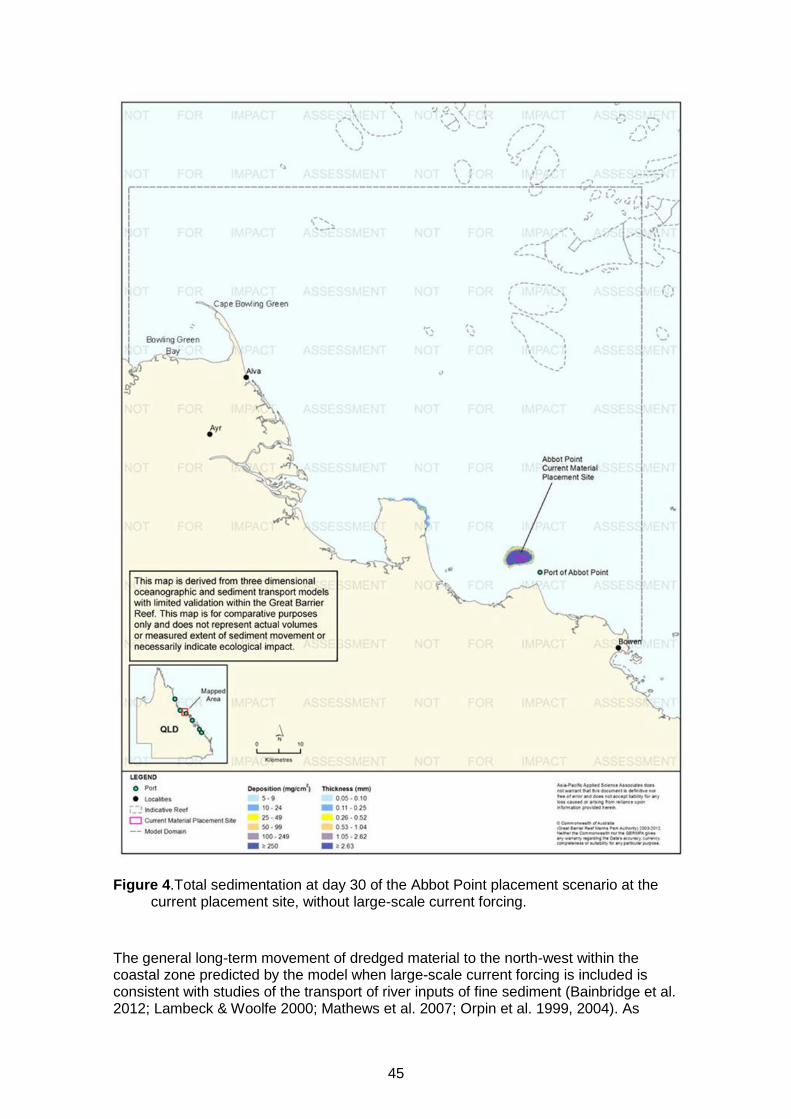
45
Figure 4.Total sedimentation at day 30 of the Abbot Point placement scenario at the current placement site, without large-scale current forcing.
The general long-term movement of dredged material to the north-west within the coastal zone predicted by the model when large-scale current forcing is included is consistent with studies of the transport of river inputs of fine sediment (Bainbridge et al. 2012; Lambeck & Woolfe 2000; Mathews et al. 2007; Orpin et al. 1999, 2004). As
46
shown in figure 3, the model predicts some sediment will move into Bowling Green Bay, in the opposite direction to the dominant transport to the north-west. This movement of sediment into quiescent, north-facing bays is also consistent with other studies. For example, Orpin et al. (2004) estimate that most sediment from the Burdekin River moves northward in the coastal zone to be deposited in Bowling Green Bay.
Figure 3 is also useful in demonstrating that model outputs should not be examined and interpreted in minute detail. Figure 3 shows sediment moving across land at the northern tip of Cape Bowling Green. This is an artefact of the size of the model grids: at the northern tip of Cape Bowling Green most of a 700 x 700 m grid cell will be water and treated as such in the model. It is important to understand that the model predictions cannot be interpreted at such minute scales.
The influence of large-scale currents becomes progressively weaker moving toward the coast, and is non–existent in enclosed bays and estuaries (King & Wolanski 1992). Therefore, the inclusion of forcing by large-scale currents from the 10 m contour outward resulted in an abrupt decrease in modelled current speeds, and therefore sediment movement, in areas shallower than 10 m (figure 2). Given that the influence of large-scale currents will actually decline over a gradient of water depth approaching the coast, the model is likely to over-predict sedimentation inshore of the 10 m depth contour relative to deeper depths, because modelled sediment particles enter a different model environment when they move into shallow depths. This also means the model may tend to under-estimate resuspension and subsequent transport from areas < 10 m depth. In addition, the model did not incorporate the effects of local-scale, shallow-water wave action and resultant sediment resuspension, or the tidal pumping and trapping of fine sediments into estuaries and mangroves. These processes are known to be important in governing nearshore turbidity and sedimentation (Alongi & McKinnon 2005; Furukowa & Wolanski 1996; Webster et al. 2007; Wolanski et al. 1997, 2005). High predicted sedimentation in nearshore areas needs to be interpreted in this context. For example, the relatively high sedimentation predicted on the exposed windward sides of islands and reefs do not take these processes into account and are unlikely to be realistic. Again it is emphasised that the primary benefit of the study is comparison of the broad implications of placement at relative sites, rather than assessment of local-scale impacts of placement at individual alternative sites.
Dredge Plume and Material Migration Modelling
The modelling scenarios (capital or maintenance dredging, volume and particle size distribution of dredge material, duration and time of year of placement, and operational parameters) for each of the six locations are presented in SKM APASA 2013c (see Appendix E). Certain assumptions made for all six locations should be kept in mind in interpreting the modelling results, particularly regarding placement methodology and the subsequent behaviour of dredge material.
The model assumed that dredged material was released randomly over the defined material placement sites, spreading it over a large area. In reality, dredged material placement will differ for the six areas and between projects. Material may be placed in a grid pattern to spread it across the placement site, or concentrated in a mound. Individual releases of dredged material may occur while the dredge or barge is stationary or underway, and if underway moving in a straight line or turning. The placement methodology will affect the thickness and spatial extent of dredge material on the bottom immediately after release, and hence its subsequent resuspension. Accounting for such port-specific operations was beyond the scope of this study. Consideration of placement methodology at a level required for a port- and project-specific EIS offers opportunities for mitigation of sediment-related impacts from dredge
47
material placement (see ‘Improved Understanding of Operational Mitigation Measures’, page 78). Navigational considerations, hydrodynamic and habitat effects of altered bathymetry, and other factors also need to be considered in designing the placement methodology.
During the material relocation period, the sediment plume was calculated on a 200 m x 200 m horizontal resolution, which limited the ability to assess the very near thickness accumulation of sediments on the material placement site. Therefore, the thickness of sediment deposits immediately over the material placement site will be higher for actual projects than predicted by the modelling herein. Again, the model represents “maximum credible” scenarios for dredge material migration from the placement site.
There is considerable uncertainty in quantifying two key parameters in the sediment plume model: the erosion constant and the consolidation rate. The authors have addressed the uncertainties regarding the erosion constant by drawing on experience from past field studies and available literature. Though erosion will be site- and project-specific, the modelling applied a uniform erosion method, as the complexity of quantifying specific erosion constants for each of the six dredging scenarios was far beyond the scope of the project. The van Rijn resuspension method applied in the DREDGEMAP model used is widely accepted. The model has been used to predict ambient suspended sediment concentrations in Port Curtis over 6 months, and compares well with actual current measurements from permanent water quality monitoring sites. The van Rijn method includes the effect of armouring, which occurs when fine sediment is winnowed from the very surface of the sediment to leave a layer of relatively coarse material that protects underlying fines from being resuspended. The assumption of random placement over the entire placement site is significant in this regard, as armouring will be less important for thin, widely distributed layers of dredge material than for less extensive, thicker layers.
The model assumed that dredge material on the bottom remains unconsolidated, that is, there is no allowance for the compaction of material over time. Consolidation will in fact occur and will reduce sediment resuspension. There is insufficient information on the rates of consolidation of dredge material to credibly quantify it in the modelling. Quantification of a generic consolidation rate, much less site-specific rates for the six locations, would require significant field and laboratory studies, such as that conducted by Wolanski et al. (1992) during a disposal program in Townsville. Wolanski et al. (1992) describe the consolidation rates as well as events that undid the process; there seemed to be not just one event of consolidation but episodes of consolidation and resuspension. Wave-induced liquefaction of consolidated ambient sediment, as opposed to dredge material, can be an important driver of TSS levels (Lambrechts et al. 2010). Further studies of consolidation would be a useful complement to future dredge material modelling studies.
Settling of mixtures of sediment particles is a complex process due to interaction of the different size classes, some of which tend to be cohesive and thus clump together to form larger particles that have different fall rates than would be expected from their individual sizes. Enhanced settlement rates due to flocculation and scavenging are particularly important for clay and fine-silt sized particles (Swanson et al. 2004) and these processes have been implemented in DREDGEMAP based on previous United States Army Corp of Engineers Studies (USACE; Teeter 1998).
The DREDGEMAP model employs five material classes based on sediment particle sizes. The classes are biased toward the finer materials, not only because these are typically the most dispersive and responsible for the greatest turbidity increases in the water column, but also because they have the greatest impacts when settling on corals. Minimum sinking rates were calculated using Stokes equations, based on the
48
size and density of the particle. However, sinking rates of finer classes (representing clay and silt-sized particles) are increased based on the local concentration of the same and larger particles, to account for clumping and entrainment. Deposition on the seabed is calculated as a probability function of the prevailing bottom stress, local sediment concentration and size class. Sediment that is deposited may subsequently be resuspended into the lower water column if critical levels of bottom stress are exceeded. Mixing of re-suspended sediment into higher levels of the water column is a dynamic balance between estimates of the sinking rate and vertical mixing induced by turbulence (as specified by vertical mixing coefficients).Values for sediment deposition, sediment resuspension and sediment settling velocities are all based on peer-reviewed literature (van Rijn, 1989; Teeter 1998; Soulsby & Whitehouse, 1997; Soulsby 1998).
TSS concentrations based on the release of particles of dredge material are most amenable to modelling, and the basis of nearly all predictive modelling for dredging and material placement proposals. TSS per se is not usually the direct mediator of ecological impacts, nor is elevated turbidity that results from TSS. For most dredging and material placement projects the primary concern is the effects of TSS and turbidity in reducing the light available to light-dependent organisms. SKM (2013b) concluded that in such cases PAR is the appropriate parameter for reactive water quality monitoring in dredging and material placement. Considerable progress has been made in predictive modelling of effects of elevated TSS on light availability and light quality, which is appropriate for environmental impact assessment as well as reactive monitoring. Light modelling was beyond the scope of the present study.
The modelling predicted "above background" TSS and sedimentation, meaning that dredge material is considered in isolation from ambient conditions. This inherently assumes that the effects of dredge material placement are simply additive to whatever ambient levels exist at any point in time. This is a standard approach often used in modelling dredge material placement and a necessary assumption given the time and financial constraints of the study.
Modelling above-background TSS and sedimentation has important implications. If ambient TSS or sedimentation are already at or near levels causing ecosystem stress, relatively small increases above background could increase stress, leading to cumulative impacts, and potentially tip the system over a tolerance threshold. Conversely, if the above-background contribution from dredge material is small relative to ambient background, it could be difficult to measure any incremental increase attributable to dredging. An important aspect of the “above background" assumption in relation to the model predictions is in regard to dredge material resuspension, which is the primary driver of the long-range migration predicted by the model. As described above, the modelling incorporates the effects of armouring of the dredge material after it settles on the seabed. The model does not, however, include interactions between dredge material and ambient sediments after resuspension events, in particular the potential mixing of dredge material with resuspended ambient sediment, potentially followed by burial of significant amounts of dredge material under ambient sediment upon re-deposition.
The modelling did not set any operational limits on material placement, which was assumed to continue regardless of weather. In actuality, material placement will be constrained by strong winds and waves, conditions in which sediment mobility will be greatest.
Relative Influence of Terrestrial and Dredging Sediment Inputs
As noted above, the modelled north-westerly migration of dredge material in this study is consistent with previous studies of transport of sediment input from rivers. It is
49
impossible to make like-for-like comparisons of river inputs of sediment to potential mobilisation of sediments by dredge material placement (and it is important to recognise that the scope of this study was restricted to material placement and not dredging itself). Nonetheless, it is instructive to consider long-term quantities of dredge material in the context of riverine inputs. It is also critically important to recognise that TSS inputs from rivers are estimated to have increased more than five-fold since pre-European times (Kroon et al. 2009).
Table 2 shows recent estimates of TSS inputs, in kilotonnes (kt) of dry mass, from the 10 major catchments draining into the study area by Joo et al. (2012) and Kroon et al. (2009, 2012). Using the estimates of Kroon et al. (2012), these 10 catchments account for 72 per cent of current (i.e. post-European) TSS inputs to the Reef lagoon. Joo et al. (2012) did not estimate total inputs to the lagoon but instead focused on these 10 catchments because they have been identified as priority catchments for ReefPlan (Carroll et al. 2012).
Joo et al. (2012) derived their estimates from end-of-river monitoring of TSS concentrations over three years (2006/07, 2007/08 and 2008/09), coupled with modelling. The estimates of Kroon et al. (2009. 2012) were based on available estimates of river inputs, including monitoring data, and catchment modelling. Kroon et al. (2012) provide refined estimates for six catchments (Pioneer, Burdekin, Herbert, Tully, Johnstone and Barron) using additional monitoring data and model corrections. Kroon et al. (2012) present estimated inputs on the basis of annual means, while Joo et al. (2012) present estimates for the three individual years. For comparison, table 2 shows the mean over the three years of Joo et al.’s (2012) estimates, as well as the range, as an indication of inter-annual variability.
There are substantial differences in predicted TSS inputs from individual rivers, which are likely to result from differences in methodology, and the years of monitoring data used in deriving the estimates. The very low TSS input estimates for the Burnett River by Joo et al. (2012), for example, reflect the absence of a high-flow event during the monitoring period used in that study. There are additional uncertainties in these estimates, including the possibility of significant TSS inputs from over-bank flows during floods that are not captured in monitoring data (Darnell et al. 2012; Wallace et al. 2012). Nonetheless, they represent a useful context for considering river inputs of sediment in relation to dredge material quantities.
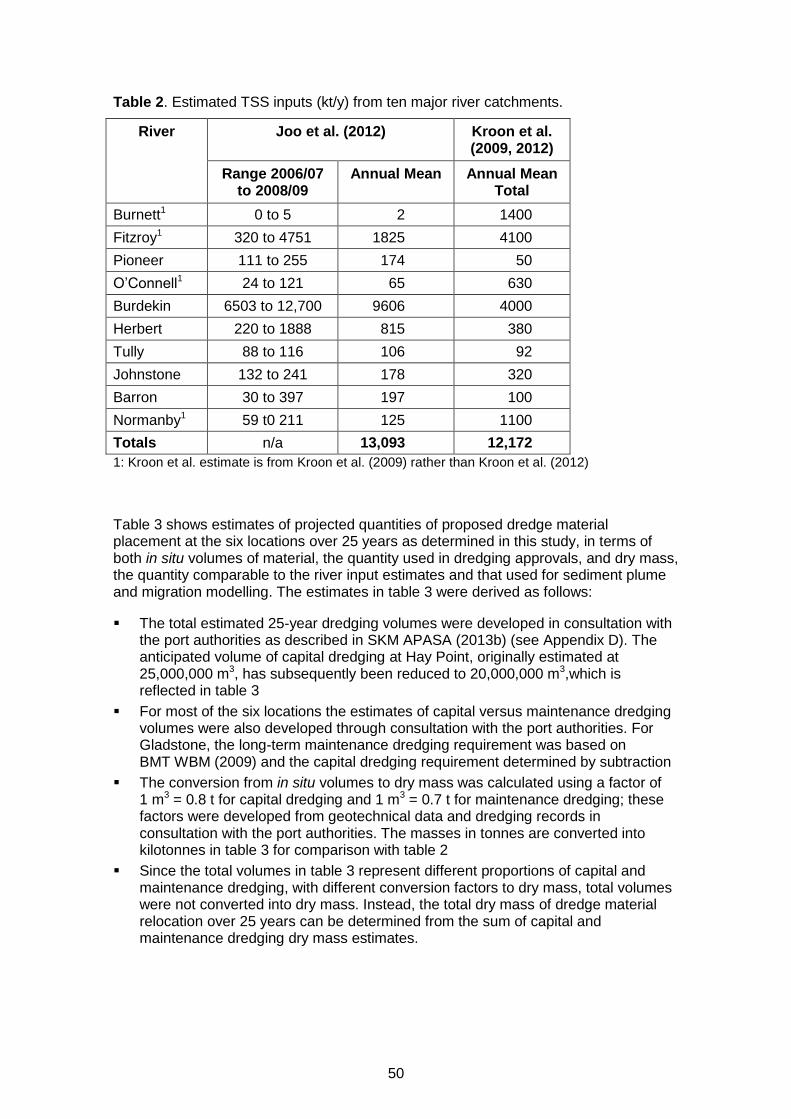
50
Table 2. Estimated TSS inputs (kt/y) from ten major river catchments.
River Joo et al. (2012) Kroon et al. (2009, 2012)
Range 2006/07 to 2008/09
Annual Mean Annual Mean Total
Burnett1 0 to 5 2 1400
Fitzroy1 320 to 4751 1825 4100
Pioneer 111 to 255 174 50
O’Connell1 24 to 121 65 630
Burdekin 6503 to 12,700 9606 4000
Herbert 220 to 1888 815 380
Tully 88 to 116 106 92
Johnstone 132 to 241 178 320
Barron 30 to 397 197 100
Normanby1 59 t0 211 125 1100
Totals n/a 13,093 12,172
1: Kroon et al. estimate is from Kroon et al. (2009) rather than Kroon et al. (2012)
Table 3 shows estimates of projected quantities of proposed dredge material placement at the six locations over 25 years as determined in this study, in terms of both in situ volumes of material, the quantity used in dredging approvals, and dry mass, the quantity comparable to the river input estimates and that used for sediment plume and migration modelling. The estimates in table 3 were derived as follows:
The total estimated 25-year dredging volumes were developed in consultation with the port authorities as described in SKM APASA (2013b) (see Appendix D). The anticipated volume of capital dredging at Hay Point, originally estimated at 25,000,000 m3, has subsequently been reduced to 20,000,000 m3,which is reflected in table 3
For most of the six locations the estimates of capital versus maintenance dredging volumes were also developed through consultation with the port authorities. For Gladstone, the long-term maintenance dredging requirement was based on BMT WBM (2009) and the capital dredging requirement determined by subtraction
The conversion from in situ volumes to dry mass was calculated using a factor of 1 m3 = 0.8 t for capital dredging and 1 m3 = 0.7 t for maintenance dredging; these factors were developed from geotechnical data and dredging records in consultation with the port authorities. The masses in tonnes are converted into kilotonnes in table 3 for comparison with table 2
Since the total volumes in table 3 represent different proportions of capital and maintenance dredging, with different conversion factors to dry mass, total volumes were not converted into dry mass. Instead, the total dry mass of dredge material relocation over 25 years can be determined from the sum of capital and maintenance dredging dry mass estimates.
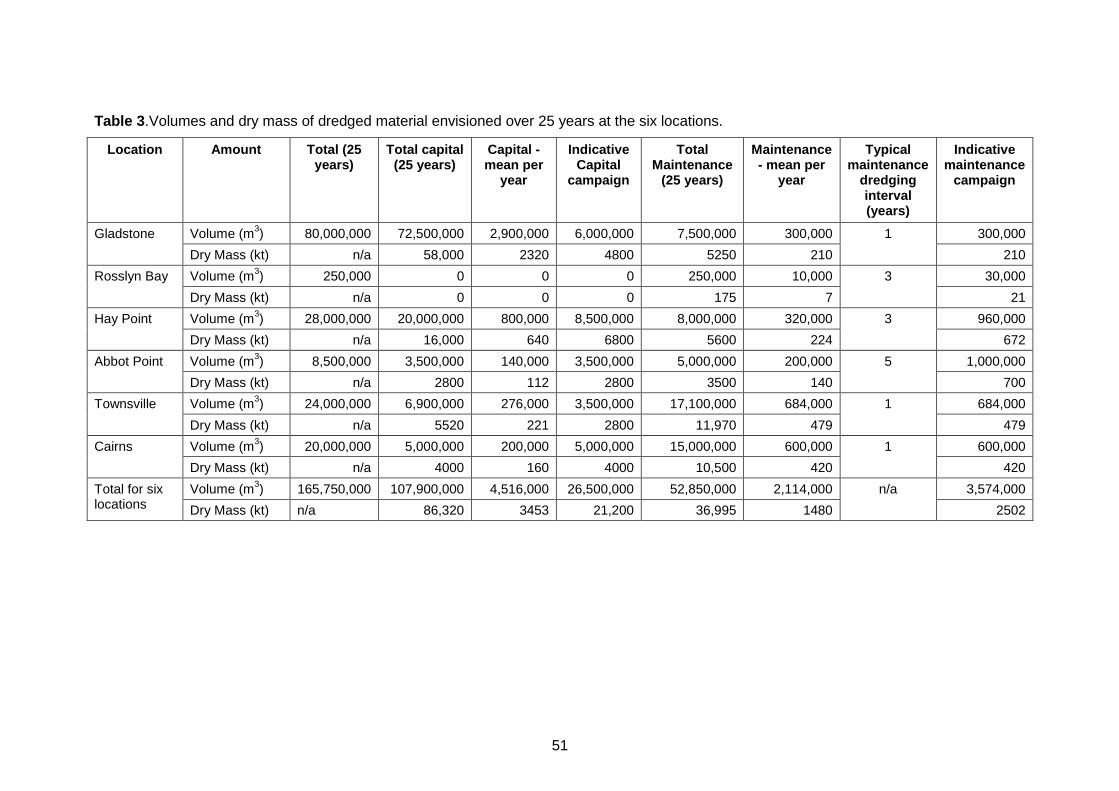
51
Table 3.Volumes and dry mass of dredged material envisioned over 25 years at the six locations.
Location Amount Total (25 years)
Total capital (25 years)
Capital - mean per
year
Indicative Capital
campaign
Total Maintenance
(25 years)
Maintenance - mean per
year
Typical maintenance
dredging interval (years)
Indicative maintenance
campaign
Gladstone Volume (m3) 80,000,000 72,500,000 2,900,000 6,000,000 7,500,000 300,000 1 300,000
Dry Mass (kt) n/a 58,000 2320 4800 5250 210 210
Rosslyn Bay Volume (m3) 250,000 0 0 0 250,000 10,000 3 30,000
Dry Mass (kt) n/a 0 0 0 175 7 21
Hay Point Volume (m3) 28,000,000 20,000,000 800,000 8,500,000 8,000,000 320,000 3 960,000
Dry Mass (kt) n/a 16,000 640 6800 5600 224 672
Abbot Point Volume (m3) 8,500,000 3,500,000 140,000 3,500,000 5,000,000 200,000 5 1,000,000
Dry Mass (kt) n/a 2800 112 2800 3500 140 700
Townsville Volume (m3) 24,000,000 6,900,000 276,000 3,500,000 17,100,000 684,000 1 684,000
Dry Mass (kt) n/a 5520 221 2800 11,970 479 479
Cairns Volume (m3) 20,000,000 5,000,000 200,000 5,000,000 15,000,000 600,000 1 600,000
Dry Mass (kt) n/a 4000 160 4000 10,500 420 420
Total for six locations
Volume (m3) 165,750,000 107,900,000 4,516,000 26,500,000 52,850,000 2,114,000 n/a 3,574,000
Dry Mass (kt) n/a 86,320 3453 21,200 36,995 1480 2502
52
A high-level comparison of table 2 and table 3 indicates that the estimated annual dry mass of dredge material from the six locations (4933 kt/y, the sum of the annual dry masses from capital and maintenance dredging) represents about 38-41 per cent of the total estimated annual terrestrial sediment input from the ten major catchments.
In this regard, it is important to differentiate capital from maintenance dredging. Maintenance dredging represents the relocation of material that is already mobile in the ambient sedimentary regime and has been trapped in areas that are already dredged. Thus, relocation of material from maintenance dredging does not represent a new input of sediment to the lagoon. If only capital dredging is considered, annual bulk sediment inputs from dredge material relocation reduce to about 26-28 per cent of annual river inputs from the 10 catchments to the lagoon, averaged over 25 years.
Capital dredging material is dominated by relatively coarse material (sand and coarser), whereas TSS input from rivers is dominated by fine clay and silt. More than 70 per cent of TSS in Burdekin River flood plumes, for example, consists of clay and fine silt < 16 µm (Amos et al. 2004; Bainbridge et al. 2012). By contrast, in the three capital dredging scenarios developed for this study (Gladstone, Hay Point, Abbot Point; SKM APASA 2013c), sands > 75 µm constituted more than 60 per cent of the material, and fine material < 35 µm less than 30 per cent. Finer sediments are more mobile than coarser material, setting aside the consolidation of sediment on the bottom as was assumed in this study. Perhaps more importantly, fine sediments generally have the greatest impacts on corals and seagrasses (Erftemeijer & Lewis 2006; Falkowski et al. 1990; Piniak 2007; Weber et al. 2006). Using the approximation that 70 per cent of river sediment inputs are fine sediments, compared to about 30 per cent of capital dredging material inputs, mean annual inputs of fine sediment from relocation of capital dredging material at the six locations represent around 11-12 per cent of mean annual inputs of fine sediments from the 10 major rivers, and 8 per cent of total inputs to the Reef based only on Kroon et al.’s estimates for total river inputs. These various estimates are summarised in table 4.
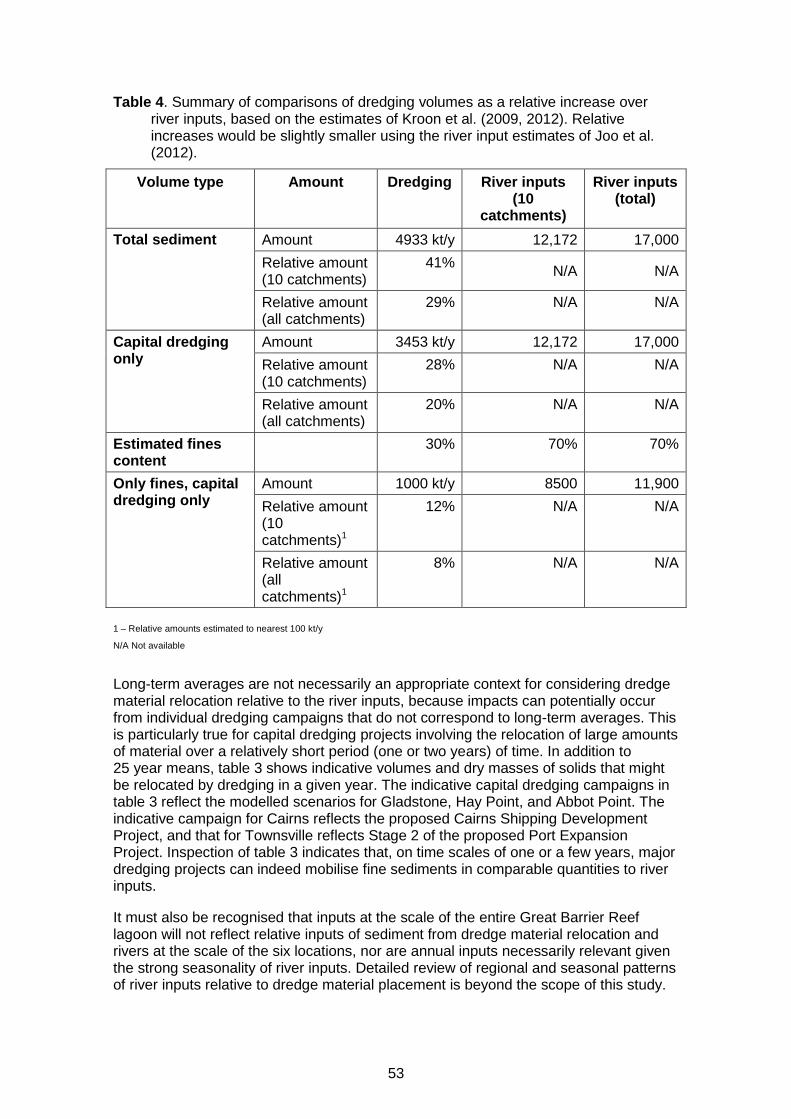
53
Table 4. Summary of comparisons of dredging volumes as a relative increase over river inputs, based on the estimates of Kroon et al. (2009, 2012). Relative increases would be slightly smaller using the river input estimates of Joo et al. (2012).
Volume type Amount Dredging River inputs (10
catchments)
River inputs (total)
Total sediment Amount 4933 kt/y 12,172 17,000
Relative amount (10 catchments)
41% N/A N/A
Relative amount (all catchments)
29% N/A N/A
Capital dredging only
Amount 3453 kt/y 12,172 17,000
Relative amount (10 catchments)
28% N/A N/A
Relative amount (all catchments)
20% N/A N/A
Estimated fines content
30% 70% 70%
Only fines, capital dredging only
Amount 1000 kt/y 8500 11,900
Relative amount (10 catchments)1
12% N/A N/A
Relative amount (all catchments)1
8% N/A N/A
1 – Relative amounts estimated to nearest 100 kt/y
N/A Not available
Long-term averages are not necessarily an appropriate context for considering dredge material relocation relative to the river inputs, because impacts can potentially occur from individual dredging campaigns that do not correspond to long-term averages. This is particularly true for capital dredging projects involving the relocation of large amounts of material over a relatively short period (one or two years) of time. In addition to 25 year means, table 3 shows indicative volumes and dry masses of solids that might be relocated by dredging in a given year. The indicative capital dredging campaigns in table 3 reflect the modelled scenarios for Gladstone, Hay Point, and Abbot Point. The indicative campaign for Cairns reflects the proposed Cairns Shipping Development Project, and that for Townsville reflects Stage 2 of the proposed Port Expansion Project. Inspection of table 3 indicates that, on time scales of one or a few years, major dredging projects can indeed mobilise fine sediments in comparable quantities to river inputs.
It must also be recognised that inputs at the scale of the entire Great Barrier Reef lagoon will not reflect relative inputs of sediment from dredge material relocation and rivers at the scale of the six locations, nor are annual inputs necessarily relevant given the strong seasonality of river inputs. Detailed review of regional and seasonal patterns of river inputs relative to dredge material placement is beyond the scope of this study.
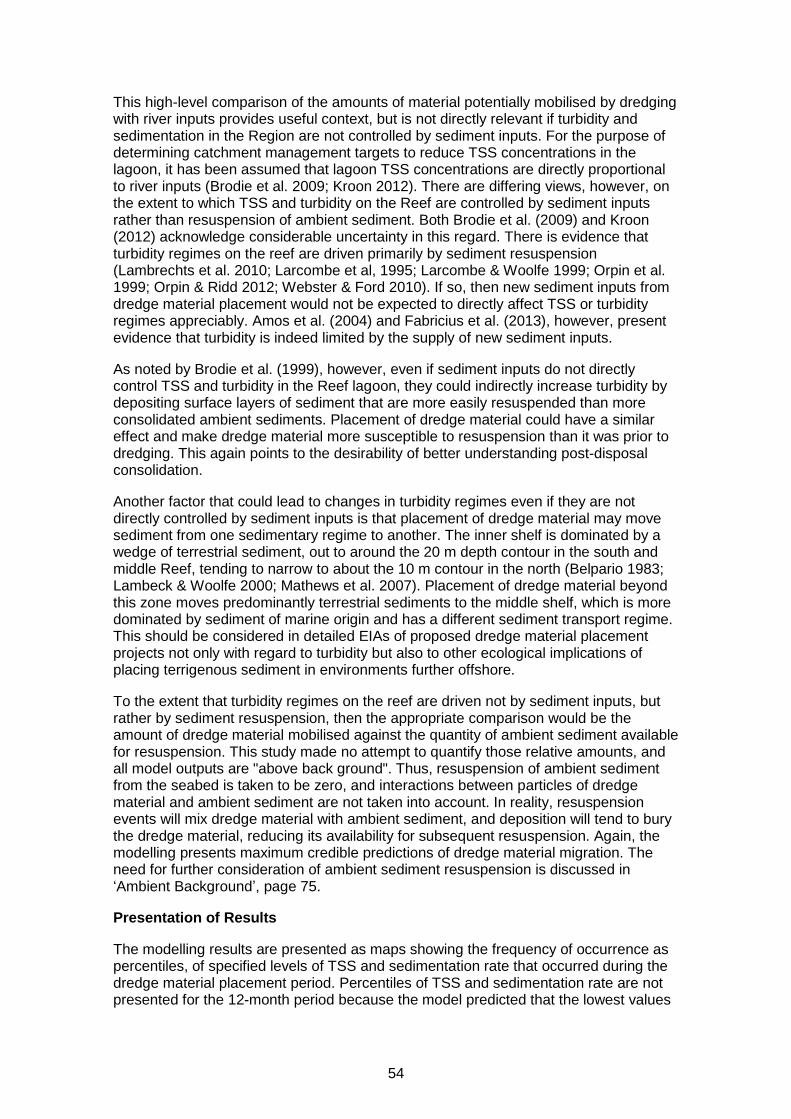
54
This high-level comparison of the amounts of material potentially mobilised by dredging with river inputs provides useful context, but is not directly relevant if turbidity and sedimentation in the Region are not controlled by sediment inputs. For the purpose of determining catchment management targets to reduce TSS concentrations in the lagoon, it has been assumed that lagoon TSS concentrations are directly proportional to river inputs (Brodie et al. 2009; Kroon 2012). There are differing views, however, on the extent to which TSS and turbidity on the Reef are controlled by sediment inputs rather than resuspension of ambient sediment. Both Brodie et al. (2009) and Kroon (2012) acknowledge considerable uncertainty in this regard. There is evidence that turbidity regimes on the reef are driven primarily by sediment resuspension (Lambrechts et al. 2010; Larcombe et al, 1995; Larcombe & Woolfe 1999; Orpin et al. 1999; Orpin & Ridd 2012; Webster & Ford 2010). If so, then new sediment inputs from dredge material placement would not be expected to directly affect TSS or turbidity regimes appreciably. Amos et al. (2004) and Fabricius et al. (2013), however, present evidence that turbidity is indeed limited by the supply of new sediment inputs.
As noted by Brodie et al. (1999), however, even if sediment inputs do not directly control TSS and turbidity in the Reef lagoon, they could indirectly increase turbidity by depositing surface layers of sediment that are more easily resuspended than more consolidated ambient sediments. Placement of dredge material could have a similar effect and make dredge material more susceptible to resuspension than it was prior to dredging. This again points to the desirability of better understanding post-disposal consolidation.
Another factor that could lead to changes in turbidity regimes even if they are not directly controlled by sediment inputs is that placement of dredge material may move sediment from one sedimentary regime to another. The inner shelf is dominated by a wedge of terrestrial sediment, out to around the 20 m depth contour in the south and middle Reef, tending to narrow to about the 10 m contour in the north (Belpario 1983; Lambeck & Woolfe 2000; Mathews et al. 2007). Placement of dredge material beyond this zone moves predominantly terrestrial sediments to the middle shelf, which is more dominated by sediment of marine origin and has a different sediment transport regime. This should be considered in detailed EIAs of proposed dredge material placement projects not only with regard to turbidity but also to other ecological implications of placing terrigenous sediment in environments further offshore.
To the extent that turbidity regimes on the reef are driven not by sediment inputs, but rather by sediment resuspension, then the appropriate comparison would be the amount of dredge material mobilised against the quantity of ambient sediment available for resuspension. This study made no attempt to quantify those relative amounts, and all model outputs are "above back ground". Thus, resuspension of ambient sediment from the seabed is taken to be zero, and interactions between particles of dredge material and ambient sediment are not taken into account. In reality, resuspension events will mix dredge material with ambient sediment, and deposition will tend to bury the dredge material, reducing its availability for subsequent resuspension. Again, the modelling presents maximum credible predictions of dredge material migration. The need for further consideration of ambient sediment resuspension is discussed in ‘Ambient Background’, page 75.
Presentation of Results
The modelling results are presented as maps showing the frequency of occurrence as percentiles, of specified levels of TSS and sedimentation rate that occurred during the dredge material placement period. Percentiles of TSS and sedimentation rate are not presented for the 12-month period because the model predicted that the lowest values
55
presented for the dredging period would not occur either 50 per cent or 5 per cent of the time over the 12 months.
Additionally, total sedimentation and bottom thickness maps are presented for single points in time, at the end of the specified dredge material placement scenario and at the end of 12 months after commencement of the modelled placement.
SKM and APASA have found during the course of the study that in some cases the presentation of results can be difficult to interpret. Perhaps the best analogy for the presentation of the percentile results is the depth contours on a nautical chart, on which contours of given depths are drawn around individual depth soundings. In the case of the model results, the model predicts how frequently, as a percentage of time, a given condition will occur in each cell of the model grid during the modelling period. Figure 5 presents an imaginary portion of the model grid, zoomed in to a close-up view. The number in each of the model cells is the per cent of the time during the model run that the condition being represented - say for example 5 mg/L TSS - occurs. Using these data, a contour line can be drawn representing the boundary at which 5 mg/L occurred 50 per cent of the time in the model output. Areas on one side of the line, down and to the right in the imaginary example in figure 5, experienced 5 mg/L TSS less than 50 per cent of the time and areas on the other side of the line experienced this condition more than 50 per cent of the time. The blue line is thus the 50th percentile contour for 5 mg/L TSS. Similarly, 95th percentile contours represent the boundary of areas that experience a given water quality condition either more or less than 5 per cent of the time, i.e. 95 per cent of the time TSS or sedimentation is less than the contoured value.
Figure 5. Imaginary zoomed-in view of a section of the model grid. The number in each cell represents the per cent of time during the model run each cell experiences a TSS concentration of 5 mg/L. The blue line shows the 50th percentile contour for 5mg/L TSS.
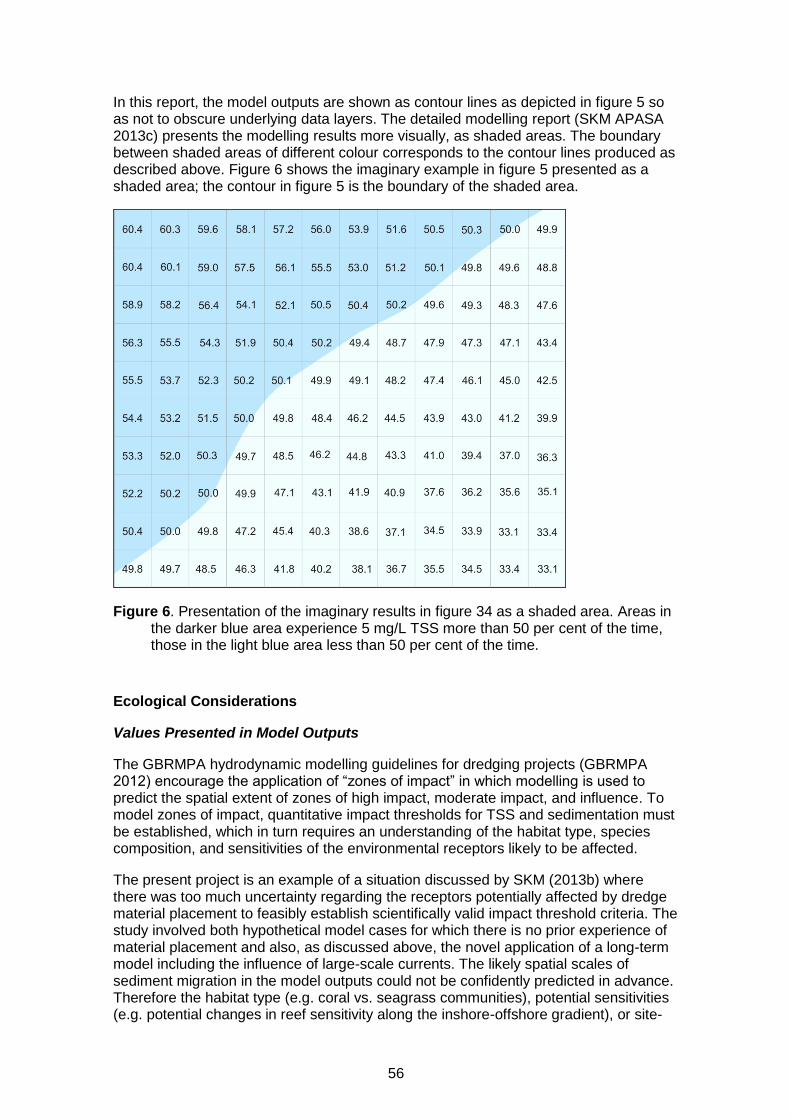
56
In this report, the model outputs are shown as contour lines as depicted in figure 5 so as not to obscure underlying data layers. The detailed modelling report (SKM APASA 2013c) presents the modelling results more visually, as shaded areas. The boundary between shaded areas of different colour corresponds to the contour lines produced as described above. Figure 6 shows the imaginary example in figure 5 presented as a shaded area; the contour in figure 5 is the boundary of the shaded area.
Figure 6. Presentation of the imaginary results in figure 34 as a shaded area. Areas in the darker blue area experience 5 mg/L TSS more than 50 per cent of the time, those in the light blue area less than 50 per cent of the time.
Ecological Considerations
Values Presented in Model Outputs
The GBRMPA hydrodynamic modelling guidelines for dredging projects (GBRMPA 2012) encourage the application of “zones of impact” in which modelling is used to predict the spatial extent of zones of high impact, moderate impact, and influence. To model zones of impact, quantitative impact thresholds for TSS and sedimentation must be established, which in turn requires an understanding of the habitat type, species composition, and sensitivities of the environmental receptors likely to be affected.
The present project is an example of a situation discussed by SKM (2013b) where there was too much uncertainty regarding the receptors potentially affected by dredge material placement to feasibly establish scientifically valid impact threshold criteria. The study involved both hypothetical model cases for which there is no prior experience of material placement and also, as discussed above, the novel application of a long-term model including the influence of large-scale currents. The likely spatial scales of sediment migration in the model outputs could not be confidently predicted in advance. Therefore the habitat type (e.g. coral vs. seagrass communities), potential sensitivities (e.g. potential changes in reef sensitivity along the inshore-offshore gradient), or site-
57
specific TSS and sedimentation regimes were not known in advance either. This made it impossible to establish quantitative criteria for zones of impact and influence. Therefore, the modelling predicted the spatial extent of a range of levels of TSS, sedimentation rate, and total sedimentation. This corresponds to the first step in the iterative approach recommended by SKM (2013b) to identify receptors of interest and then establish impact criteria.
The purpose of the study was to compare and contrast potential advantages and disadvantages of placing dredge material at potential alternative sites (including the current sites except at Gladstone). The values presented in the output maps were not necessarily selected solely on the basis of ecological relevance. Consideration was also given to using contour values that would provide useful comparisons among alternative placement locations. Preliminary results suggested that higher values than those selected sometimes were predicted to occur infrequently enough that they would not be useful for comparative purposes, that is, they tended to produce almost blank maps that did not represent comparative transport of material from alternative sites satisfactorily. In some cases this also occurred for low values, as discussed below.
That said, the model output values did take into account available information on species tolerances to sediment-related stress and their variability. Tolerance to chronic TSS concentrations in coral communities, for example, ranges from < 10 mg/L for offshore communities in clear waters to > 100 mg/L for some nearshore reefs (Erftemeijer et al. 2012). There is even greater variation in measured tolerances of individual coral species to more acute exposure to elevated TSS, from concentrations of < 30 mg/L to as high as 1000 mg/L TSS for exposures in the order of several weeks. Measured thresholds to sedimentation rate in individual coral species range from < 10 mg/cm2/d to > 400 mg/cm2/d (Erftemeijer et al. 2012). The exposure duration needed to cause impact in different coral species ranges from days to five or six weeks or more for elevated TSS and from < 24 hours to four weeks for sedimentation rate (Erftemeijer et al. 2012). Inshore coral communities generally experience more turbid conditions, and have higher tolerance to elevated turbidity, TSS, and sedimentation rate, than communities in clear offshore waters (Erftemeijer et al. 2012; Gilmour et al. 2006), and reefs with high coral cover and diversity can persist in highly turbid environments on the Reef on geological time scales (Browne et al. 2012).
Most information regarding coral sensitivity to sedimentation is in terms of the sedimentation rate. This is because most corals can clear sediment from their surfaces, and therefore the impact of settling sediment depends on the balance between how fast sediment arrives on the coral and how fast they can clear it and the energetic costs of doing so, which can reduce survival, growth, and reproduction.
Fewer studies have examined the impacts of sediment in terms of total sedimentation, which is the total amount of sediment on the bottom in mass per unit area (mg/cm2) or thickness (mm). As for TSS and sedimentation rate, there is a wide range in sensitivity to total sedimentation. Some corals can survive complete burial for two weeks or more, but small amounts of sediment on the bottom (including corals) can have impacts, especially on larval settlement and newly recruited corals. Hodgson (1990) found that a 1 mm layer of sediment covering the bottom prevented larvae of the coral Pocillopora damicornis from settling. Fabricius et al. (2003) observed 33 per cent mortality of new recruits of the coral Acropora willisae after 43 hours of application of 14 mg/cm2 of muddy coastal sediment when the sediment was enriched with organic material similar to that commonly produced by plankton, but no elevated mortality if the sediment was not organically enriched. Organic enrichment of inorganic sediment through aggregation with mucus produced by marine plankton is known to be common
58
in Reef waters and have greater impacts on corals than inorganic sediment alone (Fabricius & Wolanski 2000).
In older corals, Gilmour (2002) found that a layer of 2 mm of sediment applied every two days caused injury to small (3-5 cm) polyps within days. Larger polyps were resistant to repeated applications of 2 mm sediment layers but were damaged by the repeated application of 5 mm and 10 mm sediment layers. Riegl & Branch (1995) observed that 200 mg/cm2 of sediment severely reduced photosynthesis in four species of hard corals and five species of soft corals. Experiments by Stafford-Smith (1993) showed that most of the 22 species tested could shed a one-off application of 200 mg/cm2 of sandy sediment within two days, but three species were unable to clear the sediment and suffered tissue death within two to six days. Two other species, in the genus Porites, did not clear the sediment and did not suffer tissue death; tissue under the sediment was bleached after six days but recovered after the sediment was removed. Philipp & Fabricius (2003) found that total sedimentation in the range of 79-234 mg/cm2 had increasing impacts on photosynthetic efficiency in 9 of 12 coral species studied, but the other three species were not affected. In the species affected by these levels of total sedimentation, effects on photosynthesis were observed after 22 hours and photosynthetic efficiency was severely depressed after 36 hours. The effects increased with both the amount to total sedimentation and duration, and at higher levels of sedimentation coral tissue death occurred within 36 hours.
Modelling for dredging projects in the World Heritage Area is most often conducted with regard to impacts on corals, but other receptors can be affected by TSS and sedimentation. Seagrass communities are the receptors of most concern at Abbot Point and within Port Curtis in the Gladstone study area, for example, and are also of concern in other locations. Thresholds for light-related impacts on seagrasses are generally measured in terms of absolute light levels or a percentage of surface irradiance, which could not be related to TSS concentrations in the scope of this study. Time scales for light deprivation impacts on seagrasses are weeks to months, generally much longer than for corals. Sedimentation impacts on seagrasses relate primarily to burial, and thus total sedimentation. Seagrasses generally have higher tolerance to total sedimentation than corals, in the range of accumulation thicknesses in the order of 1.5-13 cm/y (Erftemeijer & Lewis 2006).
TSS, sedimentation rate, and total sedimentation tolerance thresholds for other benthic organisms in the Region, including macroalgae, microphytobenthos, soft corals, ascidians, sponges, anemones, giant clams and other invertebrates with photosynthetic symbionts, are poorly known.
Given the wide range of potential receptor tolerances, a range of values for TSS (5-50 mg/L), sedimentation rate (5-250 mg/cm2/d) and total sedimentation (5-250 mg/cm2, corresponding to 0.05 to 4.10 mm of accumulation, depending on study area) are presented in the modelling outputs maps.
The range for TSS is probably most relevant to corals and other organisms with relatively low TSS tolerance, but preliminary modelling showed that higher levels of TSS than those presented were not predicted to occur as often as 5 per cent of the time in the modelling runs. In some cases, even the lowest TSS concentration presented in the model outputs did not occur at any location even 5 per cent of the time. As noted in 'Dredge Plume and Material Migration Modelling', page 46, 100th percentile contours are presented, representing areas that experienced the contoured levels of TSS in any single one-hour step in the model run. It is stressed that this study is not intended to be an impact assessment, and no impacts are ascribed to particular TSS concentrations or their frequency of occurrence. The 100th percentile contours for TSS are presented to allow comparisons between different alternative sites, which is
59
the purpose of the study, when predicted TSS levels were too low to generate 95th percentile contours. This was not done for study areas where the model generated 95th percentiles because there is no point in comparisons of different study areas.
The contoured values for sedimentation rate are also most relevant to corals, and reflect a tolerance range from sensitive to relatively tolerant coral species. Tolerance thresholds to elevated sedimentation rates have not been established for other groups of organisms, including seagrasses.
The contoured values for total sedimentation are again most relevant to corals, and the maximum value contoured value of 250 mg/cm2, corresponding to a bottom thickness of 2.63-4.10 mm, depending on the study area, is well below the lowest published impact thresholds for seagrasses (15 mm; Erftemeijer & Lewis 2006). Thus, the contoured ranges can be considered precautionary, especially for receptors other than corals, but are useful in comparing the implications of placement options, which is the purpose of the study. It is recognised that the lowest values contoured, 5 and 10 mg/cm2 (corresponding to 0.05-0.08 mm and 0.10-0.16 mm, respectively) may be difficult to measure in the field. Again it is stressed that the main purpose of this study is not to assess impacts on specific receptors, but rather to compare the relative risks and benefits, if any, of material placement at different locations.
Sediment-related impacts from dredging and dredge material placement depend on the intensity, frequency, and duration of adverse changes in water quality, as discussed by SKM (2013b). The contour maps are indicative for intensity, but only partially so with regard to frequency and duration. A median occurrence of a given value, for example, indicates that the value occurred half the time, but not whether this occurred in one or a few events of long duration or repeated, short-term events. These could have different impacts, depending on the receptor.
In addition to predicting the spatial extent of water quality changes, modelling can be used to predict the time course of such changes at particular sites. Generating such time series at representative sites for all six study locations was beyond the scope of the study, but example time series are instructive. Figure 7 and figure 8 show the accumulation of sediment on the bottom and the sedimentation rate through the modelled dredging period at two sites in the Abbott Point study area that are shown in Appendix F Sensitive Receptors Risk Assessment, figure 69. The mass of sediment on the seabed at the end of the dredging at Time series 1 corresponds to a bottom thickness of approximately 7 mm, while that at Time Series 2 corresponds to a bottom thickness of approximately 27 mm. At both sites, sediment arrives at the seabed in a relatively few pulses, including pulses of very high sedimentation rates.
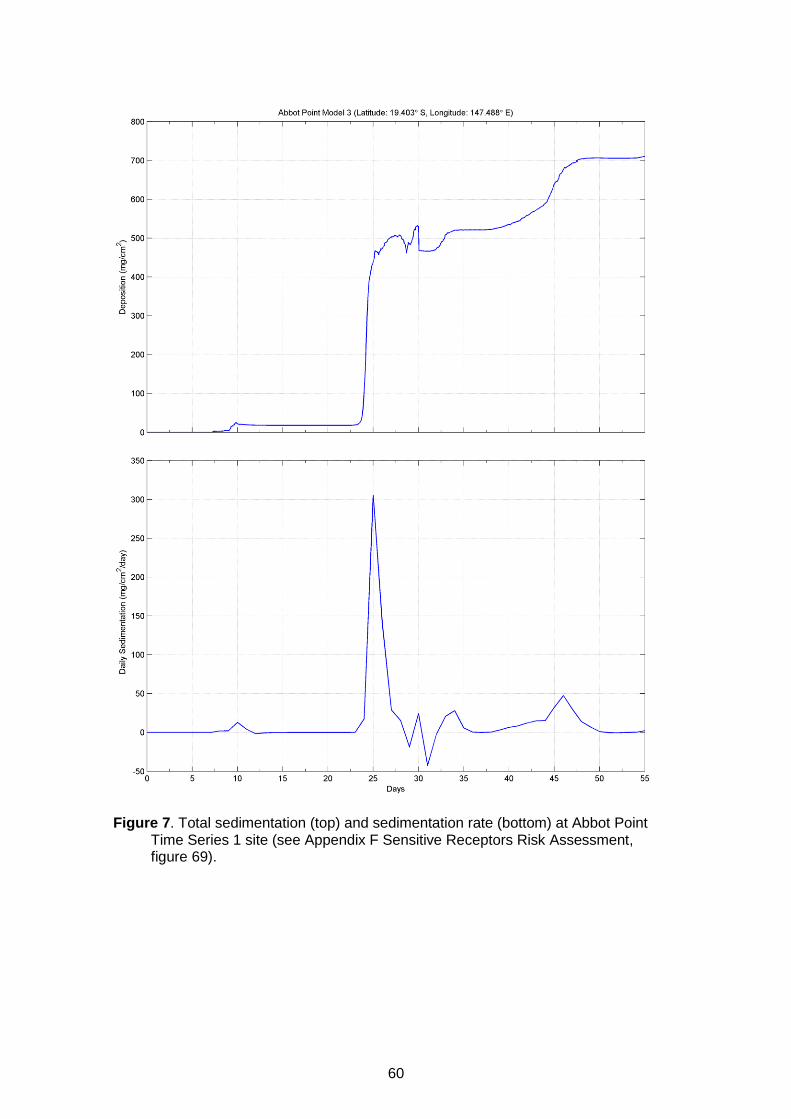
60
Figure 7. Total sedimentation (top) and sedimentation rate (bottom) at Abbot Point Time Series 1 site (see Appendix F Sensitive Receptors Risk Assessment, figure 69).
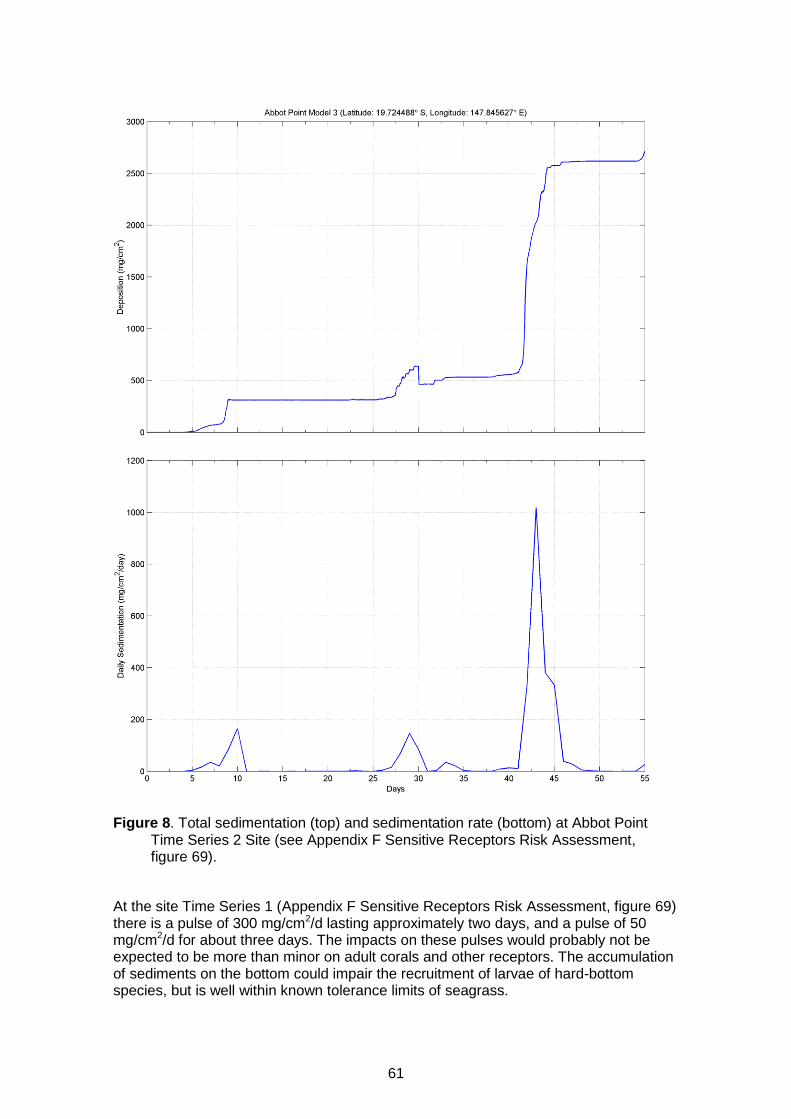
61
Figure 8. Total sedimentation (top) and sedimentation rate (bottom) at Abbot Point Time Series 2 Site (see Appendix F Sensitive Receptors Risk Assessment, figure 69).
At the site Time Series 1 (Appendix F Sensitive Receptors Risk Assessment, figure 69) there is a pulse of 300 mg/cm2/d lasting approximately two days, and a pulse of 50 mg/cm2/d for about three days. The impacts on these pulses would probably not be expected to be more than minor on adult corals and other receptors. The accumulation of sediments on the bottom could impair the recruitment of larvae of hard-bottom species, but is well within known tolerance limits of seagrass.
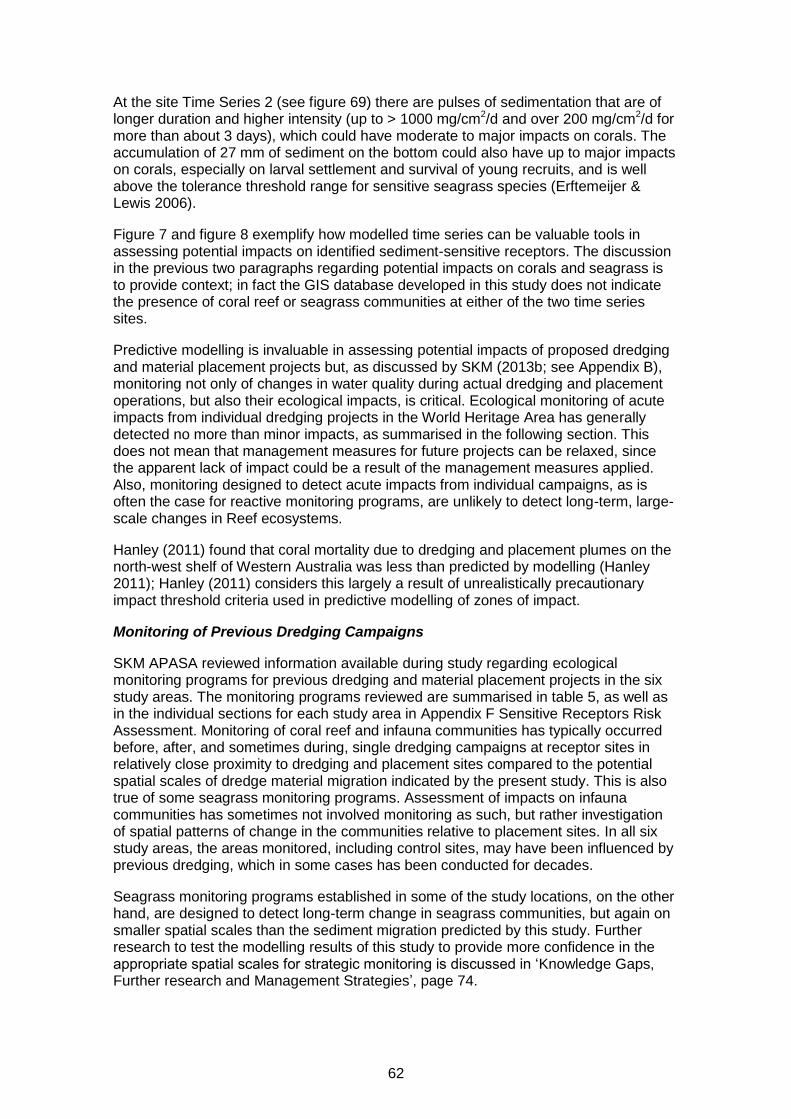
62
At the site Time Series 2 (see figure 69) there are pulses of sedimentation that are of longer duration and higher intensity (up to > 1000 mg/cm2/d and over 200 mg/cm2/d for more than about 3 days), which could have moderate to major impacts on corals. The accumulation of 27 mm of sediment on the bottom could also have up to major impacts on corals, especially on larval settlement and survival of young recruits, and is well above the tolerance threshold range for sensitive seagrass species (Erftemeijer & Lewis 2006).
Figure 7 and figure 8 exemplify how modelled time series can be valuable tools in assessing potential impacts on identified sediment-sensitive receptors. The discussion in the previous two paragraphs regarding potential impacts on corals and seagrass is to provide context; in fact the GIS database developed in this study does not indicate the presence of coral reef or seagrass communities at either of the two time series sites.
Predictive modelling is invaluable in assessing potential impacts of proposed dredging and material placement projects but, as discussed by SKM (2013b; see Appendix B), monitoring not only of changes in water quality during actual dredging and placement operations, but also their ecological impacts, is critical. Ecological monitoring of acute impacts from individual dredging projects in the World Heritage Area has generally detected no more than minor impacts, as summarised in the following section. This does not mean that management measures for future projects can be relaxed, since the apparent lack of impact could be a result of the management measures applied. Also, monitoring designed to detect acute impacts from individual campaigns, as is often the case for reactive monitoring programs, are unlikely to detect long-term, large-scale changes in Reef ecosystems.
Hanley (2011) found that coral mortality due to dredging and placement plumes on the north-west shelf of Western Australia was less than predicted by modelling (Hanley 2011); Hanley (2011) considers this largely a result of unrealistically precautionary impact threshold criteria used in predictive modelling of zones of impact.
Monitoring of Previous Dredging Campaigns
SKM APASA reviewed information available during study regarding ecological monitoring programs for previous dredging and material placement projects in the six study areas. The monitoring programs reviewed are summarised in table 5, as well as in the individual sections for each study area in Appendix F Sensitive Receptors Risk Assessment. Monitoring of coral reef and infauna communities has typically occurred before, after, and sometimes during, single dredging campaigns at receptor sites in relatively close proximity to dredging and placement sites compared to the potential spatial scales of dredge material migration indicated by the present study. This is also true of some seagrass monitoring programs. Assessment of impacts on infauna communities has sometimes not involved monitoring as such, but rather investigation of spatial patterns of change in the communities relative to placement sites. In all six study areas, the areas monitored, including control sites, may have been influenced by previous dredging, which in some cases has been conducted for decades.
Seagrass monitoring programs established in some of the study locations, on the other hand, are designed to detect long-term change in seagrass communities, but again on smaller spatial scales than the sediment migration predicted by this study. Further research to test the modelling results of this study to provide more confidence in the appropriate spatial scales for strategic monitoring is discussed in ‘Knowledge Gaps, Further research and Management Strategies’, page 74.
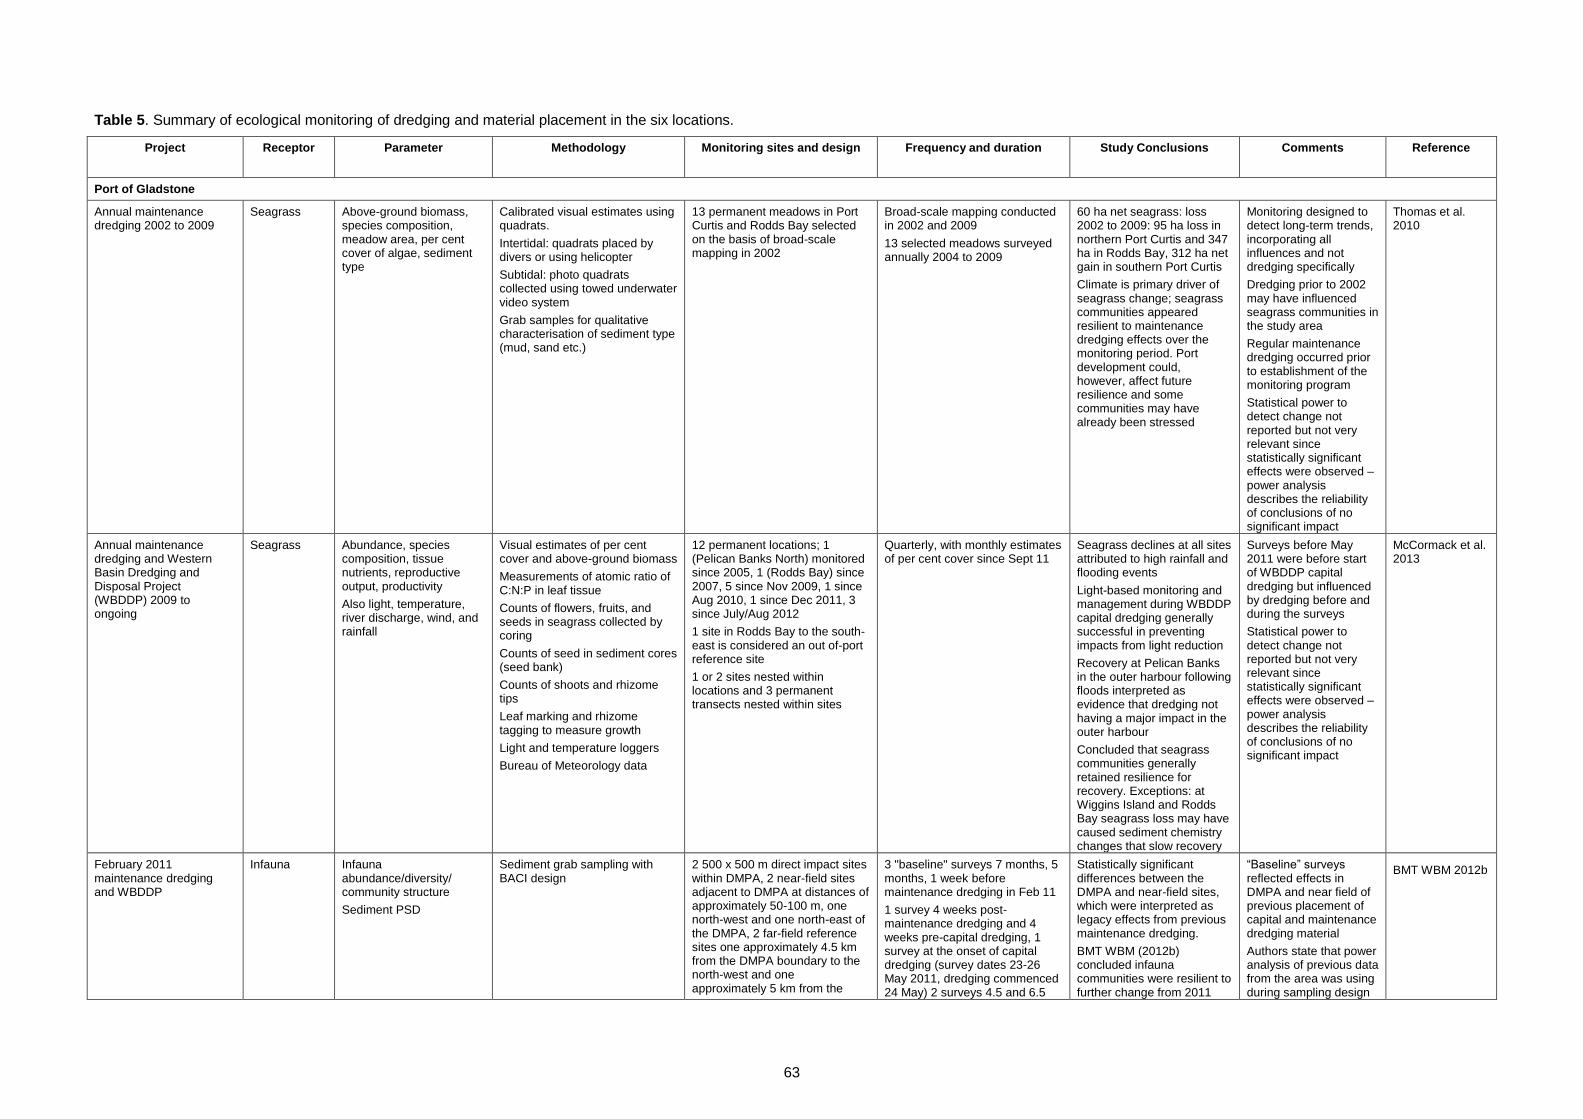
63
Table 5. Summary of ecological monitoring of dredging and material placement in the six locations.
Project Receptor Parameter Methodology Monitoring sites and design Frequency and duration Study Conclusions Comments Reference
Port of Gladstone
Annual maintenance dredging 2002 to 2009
Seagrass Above-ground biomass, species composition, meadow area, per cent cover of algae, sediment type
Calibrated visual estimates using quadrats.
Intertidal: quadrats placed by divers or using helicopter
Subtidal: photo quadrats collected using towed underwater video system
Grab samples for qualitative characterisation of sediment type (mud, sand etc.)
13 permanent meadows in Port Curtis and Rodds Bay selected on the basis of broad-scale mapping in 2002
Broad-scale mapping conducted in 2002 and 2009
13 selected meadows surveyed annually 2004 to 2009
60 ha net seagrass: loss 2002 to 2009: 95 ha loss in northern Port Curtis and 347 ha in Rodds Bay, 312 ha net gain in southern Port Curtis
Climate is primary driver of seagrass change; seagrass communities appeared resilient to maintenance dredging effects over the monitoring period. Port development could, however, affect future resilience and some communities may have already been stressed
Monitoring designed to detect long-term trends, incorporating all influences and not dredging specifically
Dredging prior to 2002 may have influenced seagrass communities in the study area
Regular maintenance dredging occurred prior to establishment of the monitoring program
Statistical power to detect change not reported but not very relevant since statistically significant effects were observed – power analysis describes the reliability of conclusions of no significant impact
Thomas et al. 2010
Annual maintenance dredging and Western Basin Dredging and Disposal Project (WBDDP) 2009 to ongoing
Seagrass Abundance, species composition, tissue nutrients, reproductive output, productivity
Also light, temperature, river discharge, wind, and rainfall
Visual estimates of per cent cover and above-ground biomass
Measurements of atomic ratio of C:N:P in leaf tissue
Counts of flowers, fruits, and seeds in seagrass collected by coring
Counts of seed in sediment cores (seed bank)
Counts of shoots and rhizome tips
Leaf marking and rhizome tagging to measure growth
Light and temperature loggers
Bureau of Meteorology data
12 permanent locations; 1 (Pelican Banks North) monitored since 2005, 1 (Rodds Bay) since 2007, 5 since Nov 2009, 1 since Aug 2010, 1 since Dec 2011, 3 since July/Aug 2012
1 site in Rodds Bay to the south-east is considered an out of-port reference site
1 or 2 sites nested within locations and 3 permanent transects nested within sites
Quarterly, with monthly estimates of per cent cover since Sept 11
Seagrass declines at all sites attributed to high rainfall and flooding events
Light-based monitoring and management during WBDDP capital dredging generally successful in preventing impacts from light reduction
Recovery at Pelican Banks in the outer harbour following floods interpreted as evidence that dredging not having a major impact in the outer harbour
Concluded that seagrass communities generally retained resilience for recovery. Exceptions: at Wiggins Island and Rodds Bay seagrass loss may have caused sediment chemistry changes that slow recovery
Surveys before May 2011 were before start of WBDDP capital dredging but influenced by dredging before and during the surveys
Statistical power to detect change not reported but not very relevant since statistically significant effects were observed – power analysis describes the reliability of conclusions of no significant impact
McCormack et al. 2013
February 2011 maintenance dredging and WBDDP
Infauna Infauna abundance/diversity/ community structure
Sediment PSD
Sediment grab sampling with BACI design
2 500 x 500 m direct impact sites within DMPA, 2 near-field sites adjacent to DMPA at distances of approximately 50-100 m, one north-west and one north-east of the DMPA, 2 far-field reference sites one approximately 4.5 km from the DMPA boundary to the north-west and one approximately 5 km from the
3 "baseline" surveys 7 months, 5 months, 1 week before maintenance dredging in Feb 11
1 survey 4 weeks post-maintenance dredging and 4 weeks pre-capital dredging, 1 survey at the onset of capital dredging (survey dates 23-26 May 2011, dredging commenced 24 May) 2 surveys 4.5 and 6.5
Statistically significant differences between the DMPA and near-field sites, which were interpreted as legacy effects from previous maintenance dredging.
BMT WBM (2012b) concluded infauna communities were resilient to further change from 2011
“Baseline” surveys reflected effects in DMPA and near field of previous placement of capital and maintenance dredging material
Authors state that power analysis of previous data from the area was using during sampling design
BMT WBM 2012b
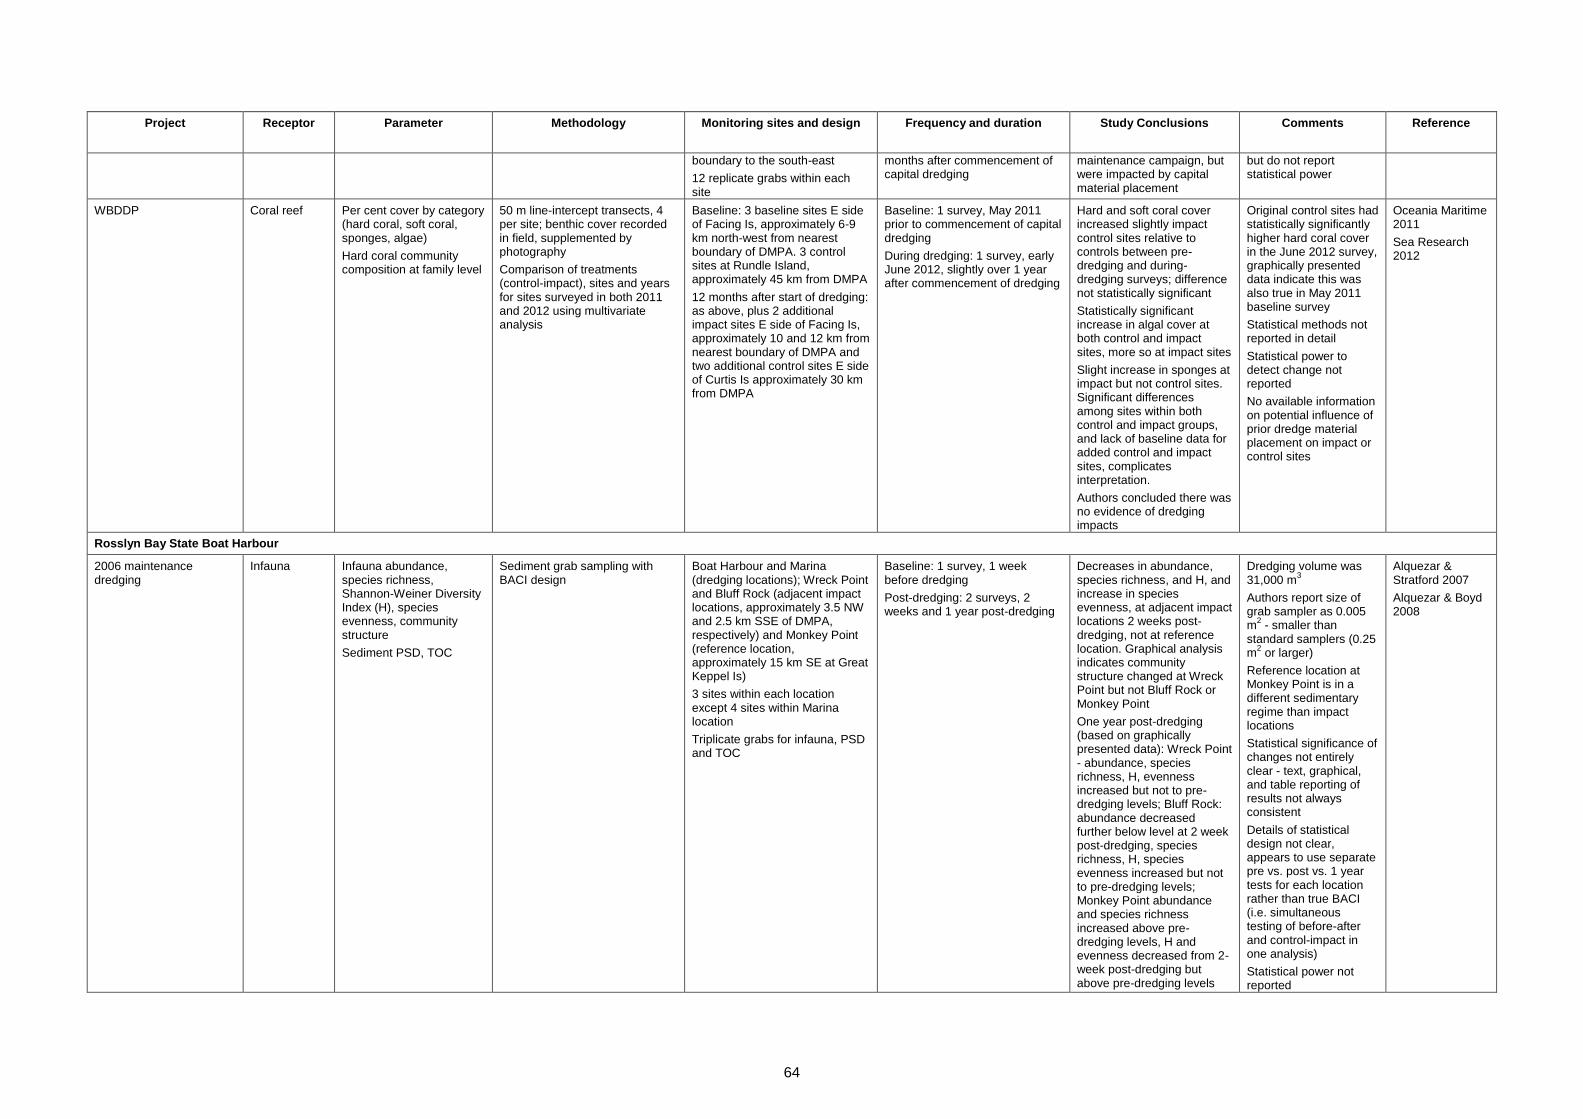
64
Project Receptor Parameter Methodology Monitoring sites and design Frequency and duration Study Conclusions Comments Reference
boundary to the south-east
12 replicate grabs within each site
months after commencement of capital dredging
maintenance campaign, but were impacted by capital material placement
but do not report statistical power
WBDDP Coral reef Per cent cover by category (hard coral, soft coral, sponges, algae)
Hard coral community composition at family level
50 m line-intercept transects, 4 per site; benthic cover recorded in field, supplemented by photography
Comparison of treatments (control-impact), sites and years for sites surveyed in both 2011 and 2012 using multivariate analysis
Baseline: 3 baseline sites E side of Facing Is, approximately 6-9 km north-west from nearest boundary of DMPA. 3 control sites at Rundle Island, approximately 45 km from DMPA
12 months after start of dredging: as above, plus 2 additional impact sites E side of Facing Is, approximately 10 and 12 km from nearest boundary of DMPA and two additional control sites E side of Curtis Is approximately 30 km from DMPA
Baseline: 1 survey, May 2011 prior to commencement of capital dredging
During dredging: 1 survey, early June 2012, slightly over 1 year after commencement of dredging
Hard and soft coral cover increased slightly impact control sites relative to controls between pre-dredging and during-dredging surveys; difference not statistically significant
Statistically significant increase in algal cover at both control and impact sites, more so at impact sites
Slight increase in sponges at impact but not control sites. Significant differences among sites within both control and impact groups, and lack of baseline data for added control and impact sites, complicates interpretation.
Authors concluded there was no evidence of dredging impacts
Original control sites had statistically significantly higher hard coral cover in the June 2012 survey, graphically presented data indicate this was also true in May 2011 baseline survey
Statistical methods not reported in detail
Statistical power to detect change not reported
No available information on potential influence of prior dredge material placement on impact or control sites
Oceania Maritime 2011
Sea Research 2012
Rosslyn Bay State Boat Harbour
2006 maintenance dredging
Infauna Infauna abundance, species richness, Shannon-Weiner Diversity Index (H), species evenness, community structure
Sediment PSD, TOC
Sediment grab sampling with BACI design
Boat Harbour and Marina (dredging locations); Wreck Point and Bluff Rock (adjacent impact locations, approximately 3.5 NW and 2.5 km SSE of DMPA, respectively) and Monkey Point (reference location, approximately 15 km SE at Great Keppel Is)
3 sites within each location except 4 sites within Marina location
Triplicate grabs for infauna, PSD and TOC
Baseline: 1 survey, 1 week before dredging
Post-dredging: 2 surveys, 2 weeks and 1 year post-dredging
Decreases in abundance, species richness, and H, and increase in species evenness, at adjacent impact locations 2 weeks post-dredging, not at reference location. Graphical analysis indicates community structure changed at Wreck Point but not Bluff Rock or Monkey Point
One year post-dredging (based on graphically presented data): Wreck Point - abundance, species richness, H, evenness increased but not to pre-dredging levels; Bluff Rock: abundance decreased further below level at 2 week post-dredging, species richness, H, species evenness increased but not to pre-dredging levels; Monkey Point abundance and species richness increased above pre-dredging levels, H and evenness decreased from 2-week post-dredging but above pre-dredging levels
Dredging volume was 31,000 m
3
Authors report size of grab sampler as 0.005 m
2 - smaller than
standard samplers (0.25 m
2 or larger)
Reference location at Monkey Point is in a different sedimentary regime than impact locations
Statistical significance of changes not entirely clear - text, graphical, and table reporting of results not always consistent
Details of statistical design not clear, appears to use separate pre vs. post vs. 1 year tests for each location rather than true BACI (i.e. simultaneous testing of before-after and control-impact in one analysis)
Statistical power not reported
Alquezar & Stratford 2007
Alquezar & Boyd 2008
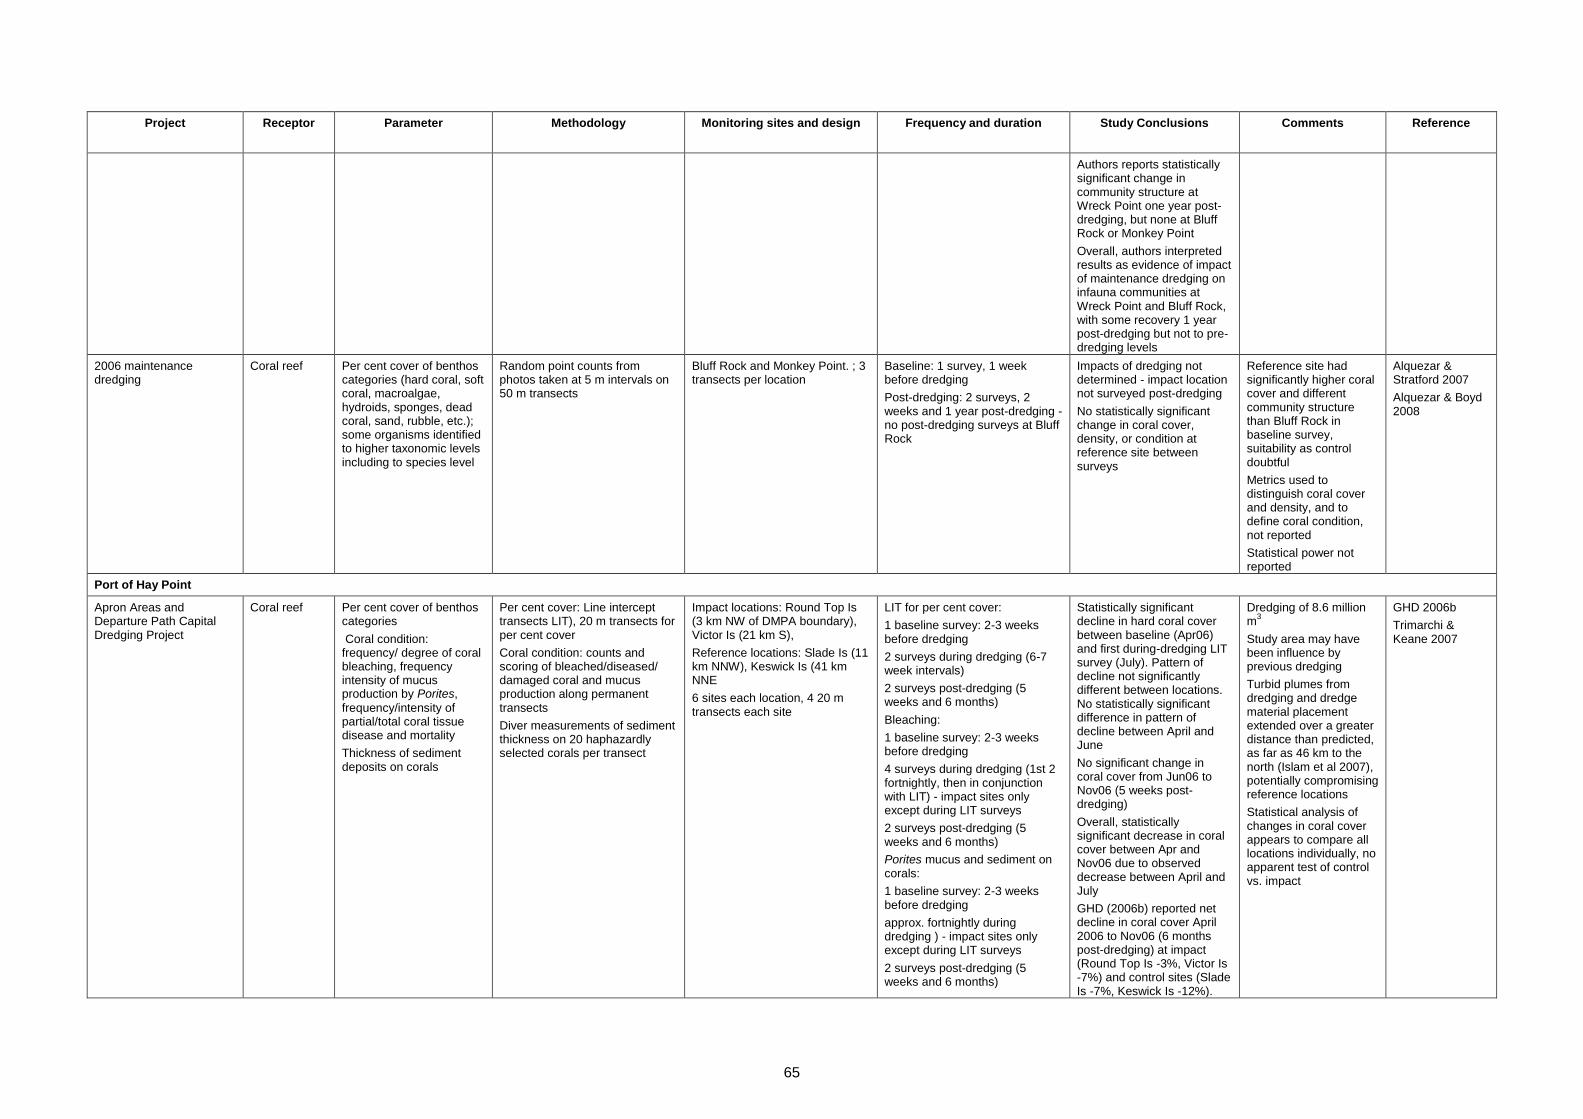
65
Project Receptor Parameter Methodology Monitoring sites and design Frequency and duration Study Conclusions Comments Reference
Authors reports statistically significant change in community structure at Wreck Point one year post-dredging, but none at Bluff Rock or Monkey Point
Overall, authors interpreted results as evidence of impact of maintenance dredging on infauna communities at Wreck Point and Bluff Rock, with some recovery 1 year post-dredging but not to pre-dredging levels
2006 maintenance dredging
Coral reef Per cent cover of benthos categories (hard coral, soft coral, macroalgae, hydroids, sponges, dead coral, sand, rubble, etc.); some organisms identified to higher taxonomic levels including to species level
Random point counts from photos taken at 5 m intervals on 50 m transects
Bluff Rock and Monkey Point. ; 3 transects per location
Baseline: 1 survey, 1 week before dredging
Post-dredging: 2 surveys, 2 weeks and 1 year post-dredging - no post-dredging surveys at Bluff Rock
Impacts of dredging not determined - impact location not surveyed post-dredging
No statistically significant change in coral cover, density, or condition at reference site between surveys
Reference site had significantly higher coral cover and different community structure than Bluff Rock in baseline survey, suitability as control doubtful
Metrics used to distinguish coral cover and density, and to define coral condition, not reported
Statistical power not reported
Alquezar & Stratford 2007
Alquezar & Boyd 2008
Port of Hay Point
Apron Areas and Departure Path Capital Dredging Project
Coral reef Per cent cover of benthos categories
Coral condition: frequency/ degree of coral bleaching, frequency intensity of mucus production by Porites,
frequency/intensity of partial/total coral tissue disease and mortality
Thickness of sediment deposits on corals
Per cent cover: Line intercept transects LIT), 20 m transects for per cent cover
Coral condition: counts and scoring of bleached/diseased/ damaged coral and mucus production along permanent transects
Diver measurements of sediment thickness on 20 haphazardly selected corals per transect
Impact locations: Round Top Is (3 km NW of DMPA boundary), Victor Is (21 km S),
Reference locations: Slade Is (11 km NNW), Keswick Is (41 km NNE
6 sites each location, 4 20 m transects each site
LIT for per cent cover:
1 baseline survey: 2-3 weeks before dredging
2 surveys during dredging (6-7 week intervals)
2 surveys post-dredging (5 weeks and 6 months)
Bleaching:
1 baseline survey: 2-3 weeks before dredging
4 surveys during dredging (1st 2 fortnightly, then in conjunction with LIT) - impact sites only except during LIT surveys
2 surveys post-dredging (5 weeks and 6 months)
Porites mucus and sediment on corals:
1 baseline survey: 2-3 weeks before dredging
approx. fortnightly during dredging ) - impact sites only except during LIT surveys
2 surveys post-dredging (5 weeks and 6 months)
Statistically significant decline in hard coral cover between baseline (Apr06) and first during-dredging LIT survey (July). Pattern of decline not significantly different between locations. No statistically significant difference in pattern of decline between April and June
No significant change in coral cover from Jun06 to Nov06 (5 weeks post-dredging)
Overall, statistically significant decrease in coral cover between Apr and Nov06 due to observed decrease between April and July
GHD (2006b) reported net decline in coral cover April 2006 to Nov06 (6 months post-dredging) at impact (Round Top Is -3%, Victor Is -7%) and control sites (Slade Is -7%, Keswick Is -12%).
Dredging of 8.6 million m
3
Study area may have been influence by previous dredging
Turbid plumes from dredging and dredge material placement extended over a greater distance than predicted, as far as 46 km to the north (Islam et al 2007), potentially compromising reference locations
Statistical analysis of changes in coral cover appears to compare all locations individually, no apparent test of control vs. impact
GHD 2006b
Trimarchi & Keane 2007
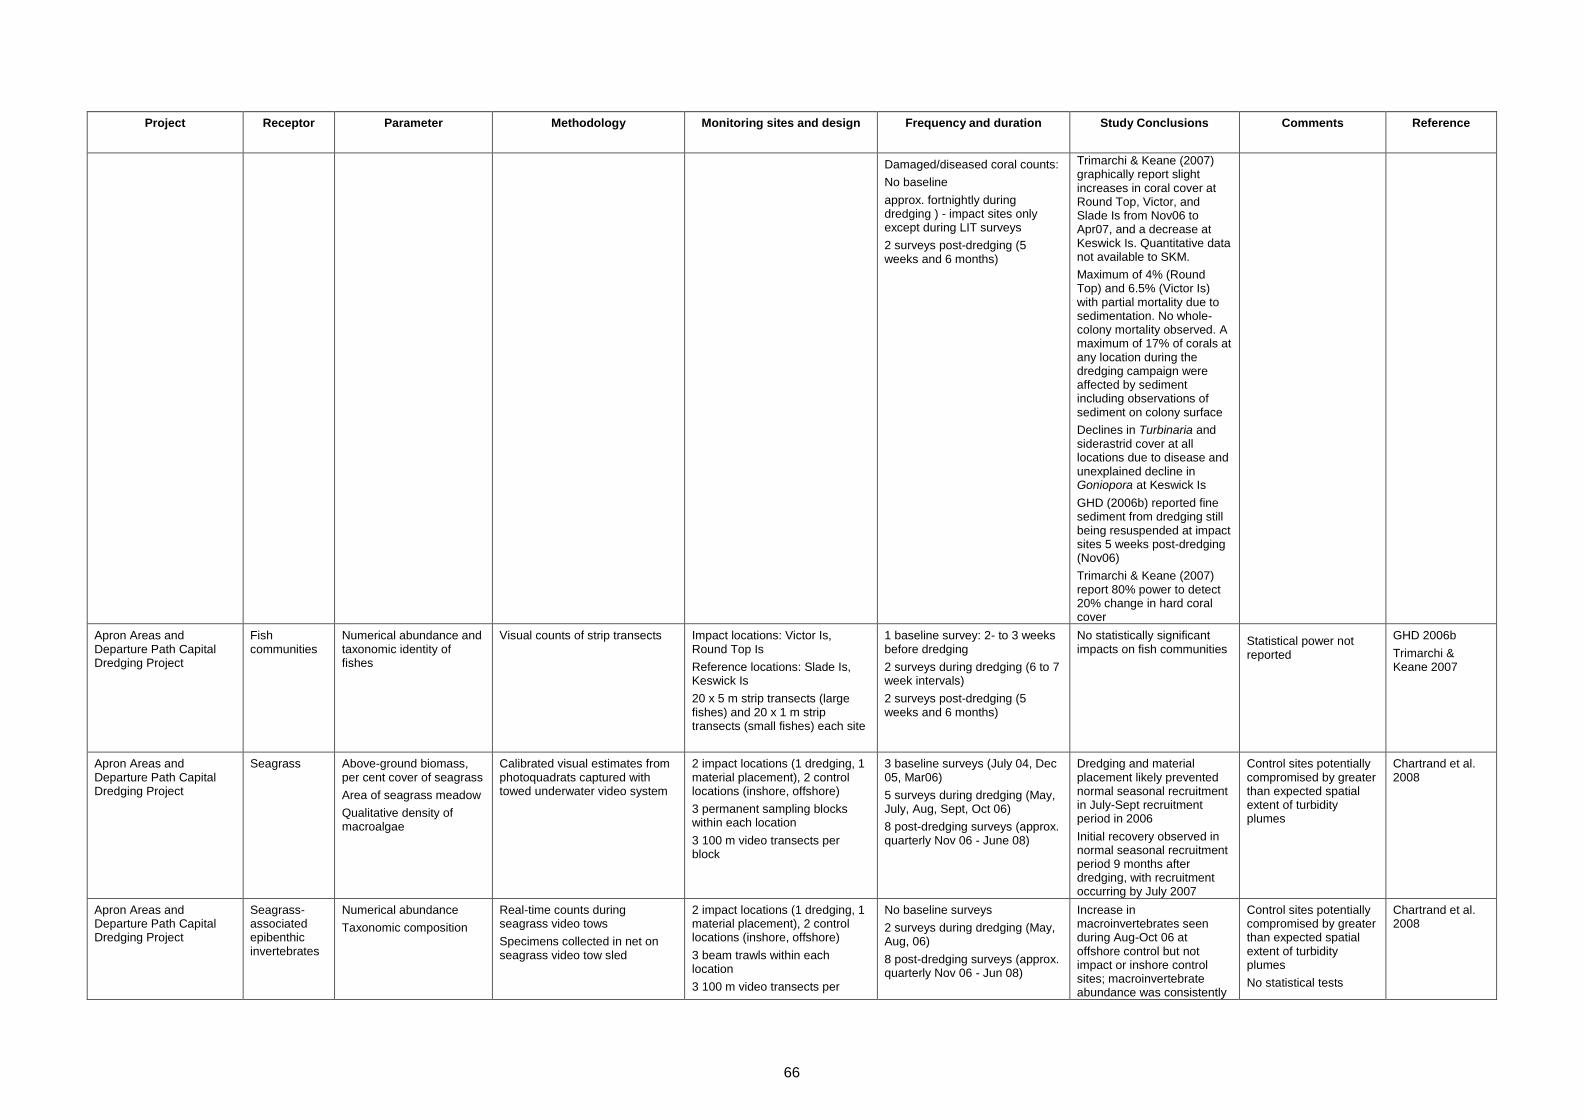
66
Project Receptor Parameter Methodology Monitoring sites and design Frequency and duration Study Conclusions Comments Reference
Damaged/diseased coral counts:
No baseline
approx. fortnightly during dredging ) - impact sites only except during LIT surveys
2 surveys post-dredging (5 weeks and 6 months)
Trimarchi & Keane (2007) graphically report slight increases in coral cover at Round Top, Victor, and Slade Is from Nov06 to Apr07, and a decrease at Keswick Is. Quantitative data not available to SKM.
Maximum of 4% (Round Top) and 6.5% (Victor Is) with partial mortality due to sedimentation. No whole-colony mortality observed. A maximum of 17% of corals at any location during the dredging campaign were affected by sediment including observations of sediment on colony surface
Declines in Turbinaria and siderastrid cover at all locations due to disease and unexplained decline in Goniopora at Keswick Is
GHD (2006b) reported fine sediment from dredging still being resuspended at impact sites 5 weeks post-dredging (Nov06)
Trimarchi & Keane (2007) report 80% power to detect 20% change in hard coral cover
Apron Areas and Departure Path Capital Dredging Project
Fish communities
Numerical abundance and taxonomic identity of fishes
Visual counts of strip transects Impact locations: Victor Is, Round Top Is
Reference locations: Slade Is, Keswick Is
20 x 5 m strip transects (large fishes) and 20 x 1 m strip transects (small fishes) each site
1 baseline survey: 2- to 3 weeks before dredging
2 surveys during dredging (6 to 7 week intervals)
2 surveys post-dredging (5 weeks and 6 months)
No statistically significant impacts on fish communities
Statistical power not reported
GHD 2006b
Trimarchi & Keane 2007
Apron Areas and Departure Path Capital Dredging Project
Seagrass Above-ground biomass, per cent cover of seagrass
Area of seagrass meadow
Qualitative density of macroalgae
Calibrated visual estimates from photoquadrats captured with towed underwater video system
2 impact locations (1 dredging, 1 material placement), 2 control locations (inshore, offshore)
3 permanent sampling blocks within each location
3 100 m video transects per block
3 baseline surveys (July 04, Dec 05, Mar06)
5 surveys during dredging (May, July, Aug, Sept, Oct 06)
8 post-dredging surveys (approx. quarterly Nov 06 - June 08)
Dredging and material placement likely prevented normal seasonal recruitment in July-Sept recruitment period in 2006
Initial recovery observed in normal seasonal recruitment period 9 months after dredging, with recruitment occurring by July 2007
Control sites potentially compromised by greater than expected spatial extent of turbidity plumes
Chartrand et al. 2008
Apron Areas and Departure Path Capital Dredging Project
Seagrass-associated epibenthic invertebrates
Numerical abundance
Taxonomic composition
Real-time counts during seagrass video tows
Specimens collected in net on seagrass video tow sled
2 impact locations (1 dredging, 1 material placement), 2 control locations (inshore, offshore)
3 beam trawls within each location
3 100 m video transects per
No baseline surveys
2 surveys during dredging (May, Aug, 06)
8 post-dredging surveys (approx. quarterly Nov 06 - Jun 08)
Increase in macroinvertebrates seen during Aug-Oct 06 at offshore control but not impact or inshore control sites; macroinvertebrate abundance was consistently
Control sites potentially compromised by greater than expected spatial extent of turbidity plumes
No statistical tests
Chartrand et al. 2008
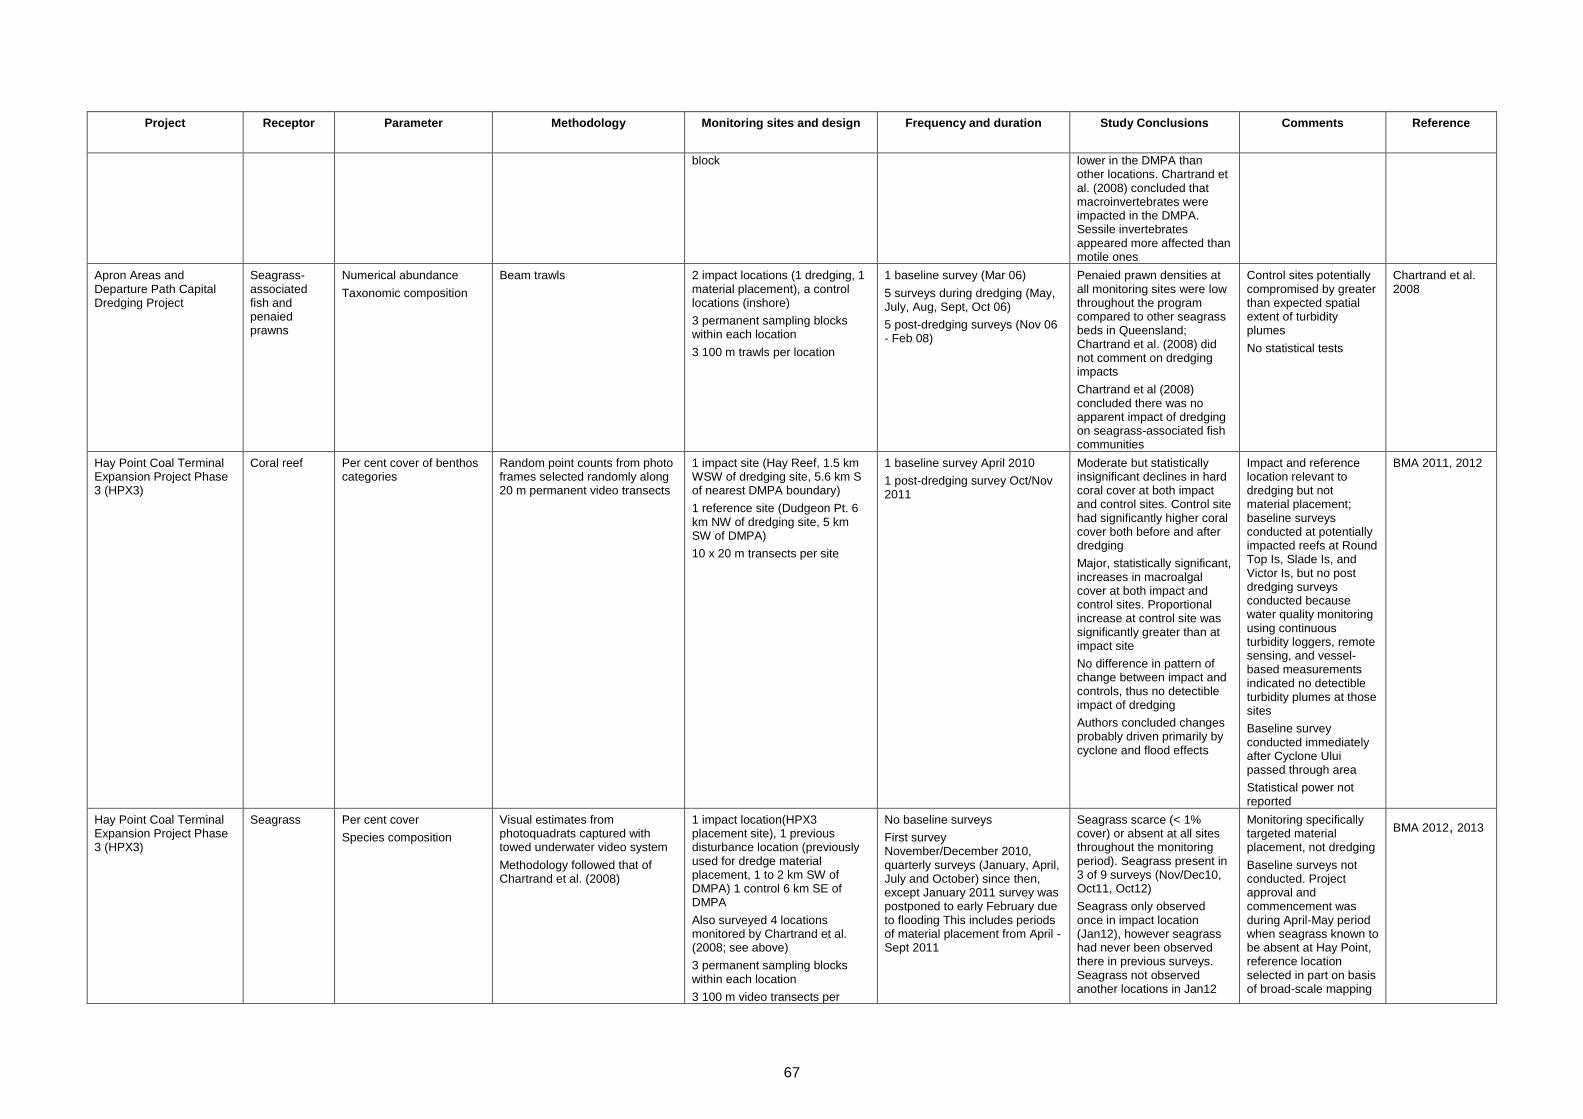
67
Project Receptor Parameter Methodology Monitoring sites and design Frequency and duration Study Conclusions Comments Reference
block lower in the DMPA than other locations. Chartrand et al. (2008) concluded that macroinvertebrates were impacted in the DMPA. Sessile invertebrates appeared more affected than motile ones
Apron Areas and Departure Path Capital Dredging Project
Seagrass-associated fish and penaied prawns
Numerical abundance
Taxonomic composition
Beam trawls 2 impact locations (1 dredging, 1 material placement), a control locations (inshore)
3 permanent sampling blocks within each location
3 100 m trawls per location
1 baseline survey (Mar 06)
5 surveys during dredging (May, July, Aug, Sept, Oct 06)
5 post-dredging surveys (Nov 06 - Feb 08)
Penaied prawn densities at all monitoring sites were low throughout the program compared to other seagrass beds in Queensland; Chartrand et al. (2008) did not comment on dredging impacts
Chartrand et al (2008) concluded there was no apparent impact of dredging on seagrass-associated fish communities
Control sites potentially compromised by greater than expected spatial extent of turbidity plumes
No statistical tests
Chartrand et al. 2008
Hay Point Coal Terminal Expansion Project Phase 3 (HPX3)
Coral reef Per cent cover of benthos categories
Random point counts from photo frames selected randomly along 20 m permanent video transects
1 impact site (Hay Reef, 1.5 km WSW of dredging site, 5.6 km S of nearest DMPA boundary)
1 reference site (Dudgeon Pt. 6 km NW of dredging site, 5 km SW of DMPA)
10 x 20 m transects per site
1 baseline survey April 2010
1 post-dredging survey Oct/Nov 2011
Moderate but statistically insignificant declines in hard coral cover at both impact and control sites. Control site had significantly higher coral cover both before and after dredging
Major, statistically significant, increases in macroalgal cover at both impact and control sites. Proportional increase at control site was significantly greater than at impact site
No difference in pattern of change between impact and controls, thus no detectible impact of dredging
Authors concluded changes probably driven primarily by cyclone and flood effects
Impact and reference location relevant to dredging but not material placement; baseline surveys conducted at potentially impacted reefs at Round Top Is, Slade Is, and Victor Is, but no post dredging surveys conducted because water quality monitoring using continuous turbidity loggers, remote sensing, and vessel-based measurements indicated no detectible turbidity plumes at those sites
Baseline survey conducted immediately after Cyclone Ului passed through area
Statistical power not reported
BMA 2011, 2012
Hay Point Coal Terminal Expansion Project Phase 3 (HPX3)
Seagrass Per cent cover
Species composition
Visual estimates from photoquadrats captured with towed underwater video system
Methodology followed that of Chartrand et al. (2008)
1 impact location(HPX3 placement site), 1 previous disturbance location (previously used for dredge material placement, 1 to 2 km SW of DMPA) 1 control 6 km SE of DMPA
Also surveyed 4 locations monitored by Chartrand et al. (2008; see above)
3 permanent sampling blocks within each location
3 100 m video transects per
No baseline surveys
First survey November/December 2010, quarterly surveys (January, April, July and October) since then, except January 2011 survey was postponed to early February due to flooding This includes periods of material placement from April - Sept 2011
Seagrass scarce (< 1% cover) or absent at all sites throughout the monitoring period). Seagrass present in 3 of 9 surveys (Nov/Dec10, Oct11, Oct12)
Seagrass only observed once in impact location (Jan12), however seagrass had never been observed there in previous surveys. Seagrass not observed another locations in Jan12
Monitoring specifically targeted material placement, not dredging
Baseline surveys not conducted. Project approval and commencement was during April-May period when seagrass known to be absent at Hay Point, reference location selected in part on basis of broad-scale mapping
BMA 2012, 2013
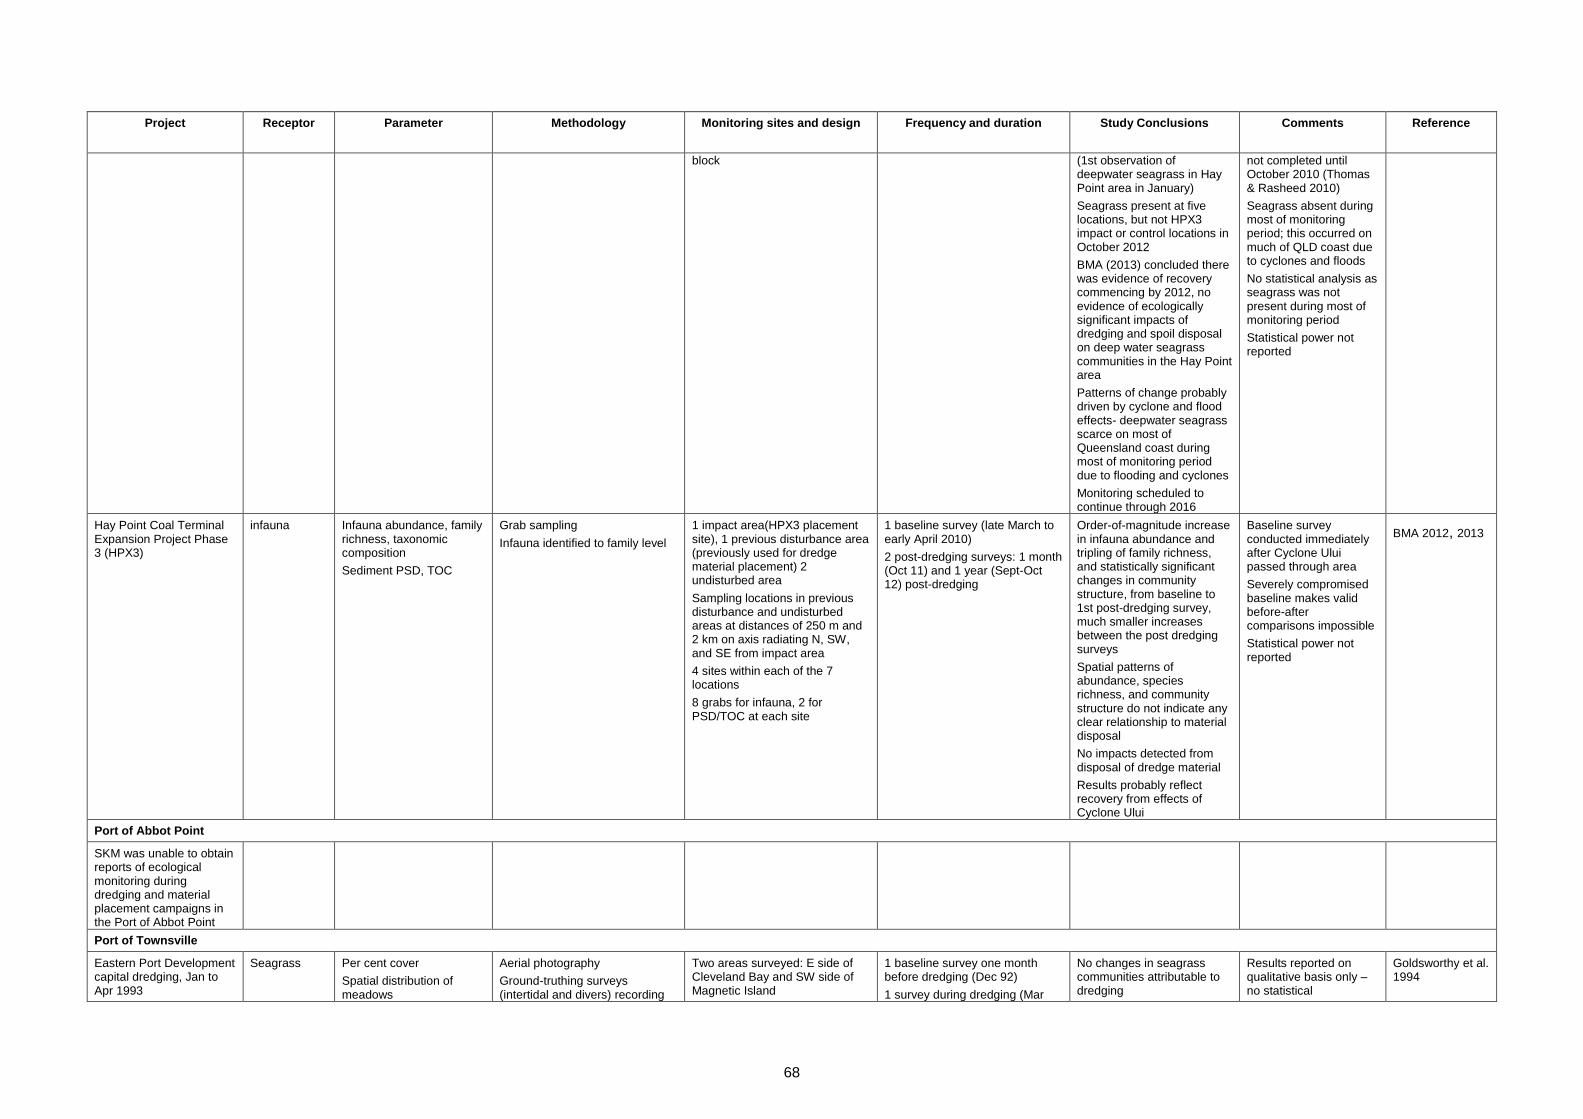
68
Project Receptor Parameter Methodology Monitoring sites and design Frequency and duration Study Conclusions Comments Reference
block (1st observation of deepwater seagrass in Hay Point area in January)
Seagrass present at five locations, but not HPX3 impact or control locations in October 2012
BMA (2013) concluded there was evidence of recovery commencing by 2012, no evidence of ecologically significant impacts of dredging and spoil disposal on deep water seagrass communities in the Hay Point area
Patterns of change probably driven by cyclone and flood effects- deepwater seagrass scarce on most of Queensland coast during most of monitoring period due to flooding and cyclones
Monitoring scheduled to continue through 2016
not completed until October 2010 (Thomas & Rasheed 2010)
Seagrass absent during most of monitoring period; this occurred on much of QLD coast due to cyclones and floods
No statistical analysis as seagrass was not present during most of monitoring period
Statistical power not reported
Hay Point Coal Terminal Expansion Project Phase 3 (HPX3)
infauna Infauna abundance, family richness, taxonomic composition
Sediment PSD, TOC
Grab sampling
Infauna identified to family level
1 impact area(HPX3 placement site), 1 previous disturbance area (previously used for dredge material placement) 2 undisturbed area
Sampling locations in previous disturbance and undisturbed areas at distances of 250 m and 2 km on axis radiating N, SW, and SE from impact area
4 sites within each of the 7 locations
8 grabs for infauna, 2 for PSD/TOC at each site
1 baseline survey (late March to early April 2010)
2 post-dredging surveys: 1 month (Oct 11) and 1 year (Sept-Oct 12) post-dredging
Order-of-magnitude increase in infauna abundance and tripling of family richness, and statistically significant changes in community structure, from baseline to 1st post-dredging survey, much smaller increases between the post dredging surveys
Spatial patterns of abundance, species richness, and community structure do not indicate any clear relationship to material disposal
No impacts detected from disposal of dredge material
Results probably reflect recovery from effects of Cyclone Ului
Baseline survey conducted immediately after Cyclone Ului passed through area
Severely compromised baseline makes valid before-after comparisons impossible
Statistical power not reported
BMA 2012, 2013
Port of Abbot Point
SKM was unable to obtain reports of ecological monitoring during dredging and material placement campaigns in the Port of Abbot Point
Port of Townsville
Eastern Port Development capital dredging, Jan to Apr 1993
Seagrass Per cent cover
Spatial distribution of meadows
Aerial photography
Ground-truthing surveys (intertidal and divers) recording
Two areas surveyed: E side of Cleveland Bay and SW side of Magnetic Island
1 baseline survey one month before dredging (Dec 92)
1 survey during dredging (Mar
No changes in seagrass communities attributable to dredging
Results reported on qualitative basis only – no statistical
Goldsworthy et al. 1994
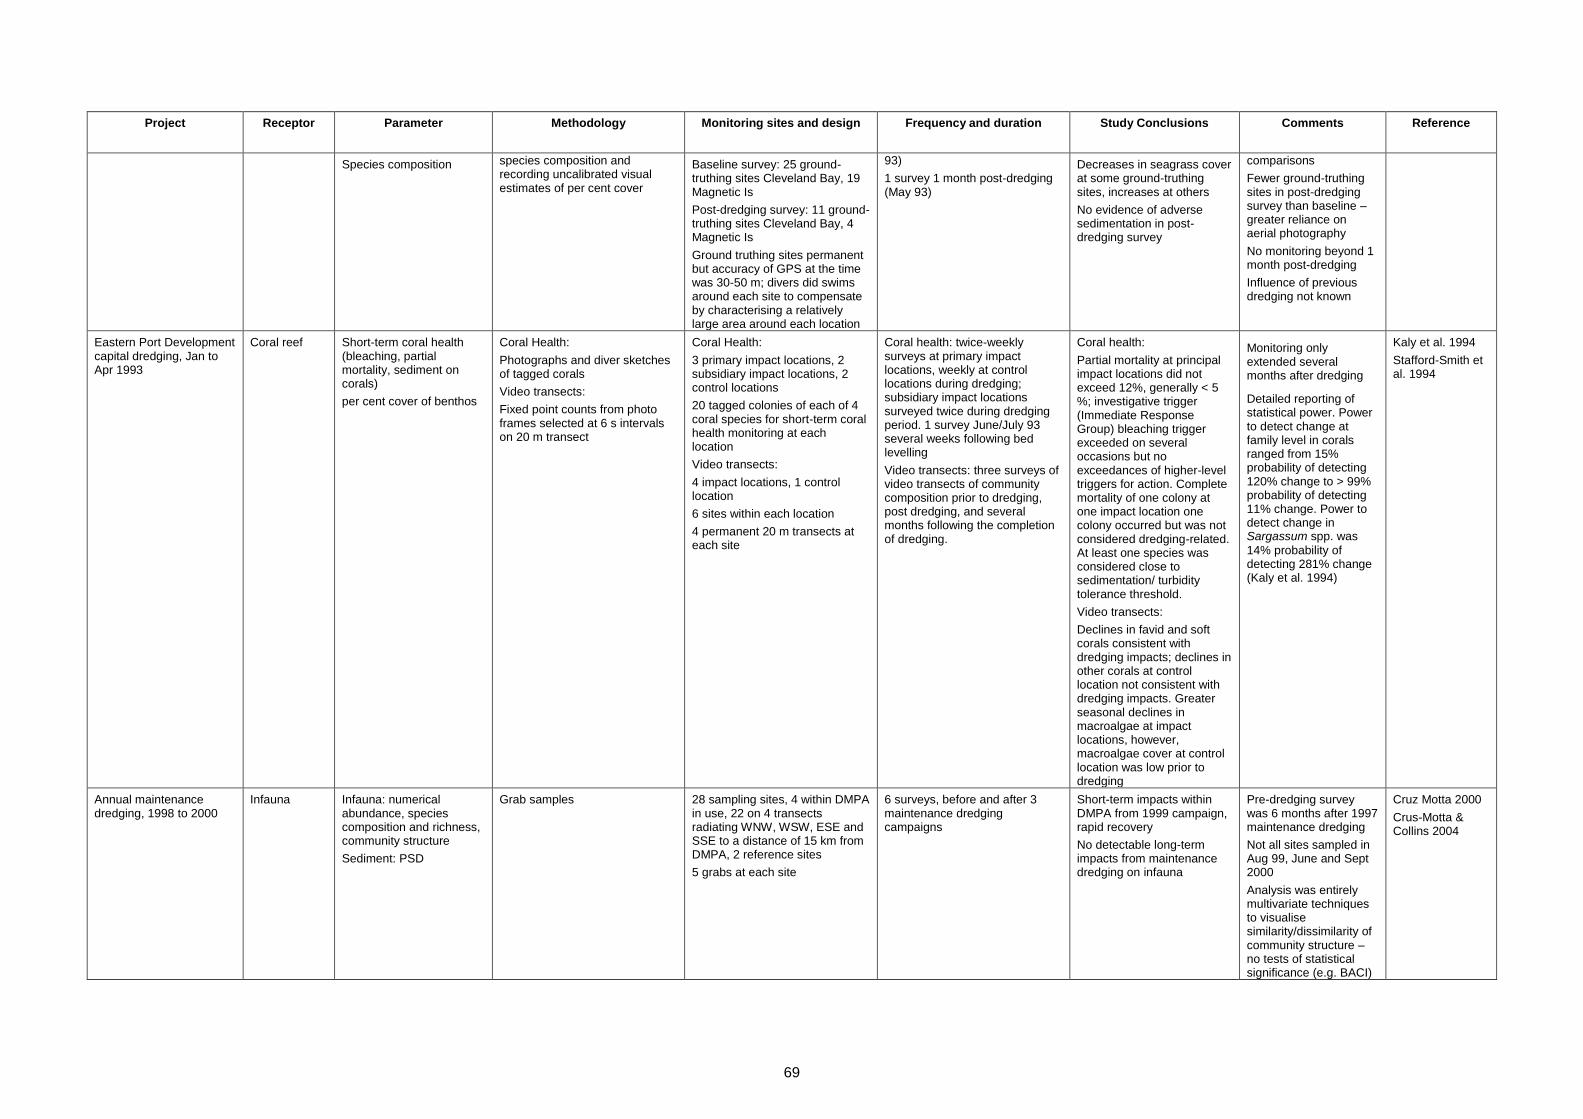
69
Project Receptor Parameter Methodology Monitoring sites and design Frequency and duration Study Conclusions Comments Reference
Species composition species composition and recording uncalibrated visual estimates of per cent cover
Baseline survey: 25 ground-truthing sites Cleveland Bay, 19 Magnetic Is
Post-dredging survey: 11 ground-truthing sites Cleveland Bay, 4 Magnetic Is
Ground truthing sites permanent but accuracy of GPS at the time was 30-50 m; divers did swims around each site to compensate by characterising a relatively large area around each location
93)
1 survey 1 month post-dredging (May 93)
Decreases in seagrass cover at some ground-truthing sites, increases at others
No evidence of adverse sedimentation in post-dredging survey
comparisons
Fewer ground-truthing sites in post-dredging survey than baseline – greater reliance on aerial photography
No monitoring beyond 1 month post-dredging
Influence of previous dredging not known
Eastern Port Development capital dredging, Jan to Apr 1993
Coral reef Short-term coral health (bleaching, partial mortality, sediment on corals)
per cent cover of benthos
Coral Health:
Photographs and diver sketches of tagged corals
Video transects:
Fixed point counts from photo frames selected at 6 s intervals on 20 m transect
Coral Health:
3 primary impact locations, 2 subsidiary impact locations, 2 control locations
20 tagged colonies of each of 4 coral species for short-term coral health monitoring at each location
Video transects:
4 impact locations, 1 control location
6 sites within each location
4 permanent 20 m transects at each site
Coral health: twice-weekly surveys at primary impact locations, weekly at control locations during dredging; subsidiary impact locations surveyed twice during dredging period. 1 survey June/July 93 several weeks following bed levelling
Video transects: three surveys of video transects of community composition prior to dredging, post dredging, and several months following the completion of dredging.
Coral health:
Partial mortality at principal impact locations did not exceed 12%, generally < 5 %; investigative trigger (Immediate Response Group) bleaching trigger exceeded on several occasions but no exceedances of higher-level triggers for action. Complete mortality of one colony at one impact location one colony occurred but was not considered dredging-related. At least one species was considered close to sedimentation/ turbidity tolerance threshold.
Video transects:
Declines in favid and soft corals consistent with dredging impacts; declines in other corals at control location not consistent with dredging impacts. Greater seasonal declines in macroalgae at impact locations, however, macroalgae cover at control location was low prior to dredging
Monitoring only extended several months after dredging
Detailed reporting of statistical power. Power to detect change at family level in corals ranged from 15% probability of detecting 120% change to > 99% probability of detecting 11% change. Power to detect change in Sargassum spp. was
14% probability of detecting 281% change (Kaly et al. 1994)
Kaly et al. 1994
Stafford-Smith et al. 1994
Annual maintenance dredging, 1998 to 2000
Infauna Infauna: numerical abundance, species composition and richness, community structure
Sediment: PSD
Grab samples 28 sampling sites, 4 within DMPA in use, 22 on 4 transects radiating WNW, WSW, ESE and SSE to a distance of 15 km from DMPA, 2 reference sites
5 grabs at each site
6 surveys, before and after 3 maintenance dredging campaigns
Short-term impacts within DMPA from 1999 campaign, rapid recovery
No detectable long-term impacts from maintenance dredging on infauna
Pre-dredging survey was 6 months after 1997 maintenance dredging
Not all sites sampled in Aug 99, June and Sept 2000
Analysis was entirely multivariate techniques to visualise similarity/dissimilarity of community structure – no tests of statistical significance (e.g. BACI)
Cruz Motta 2000
Crus-Motta & Collins 2004
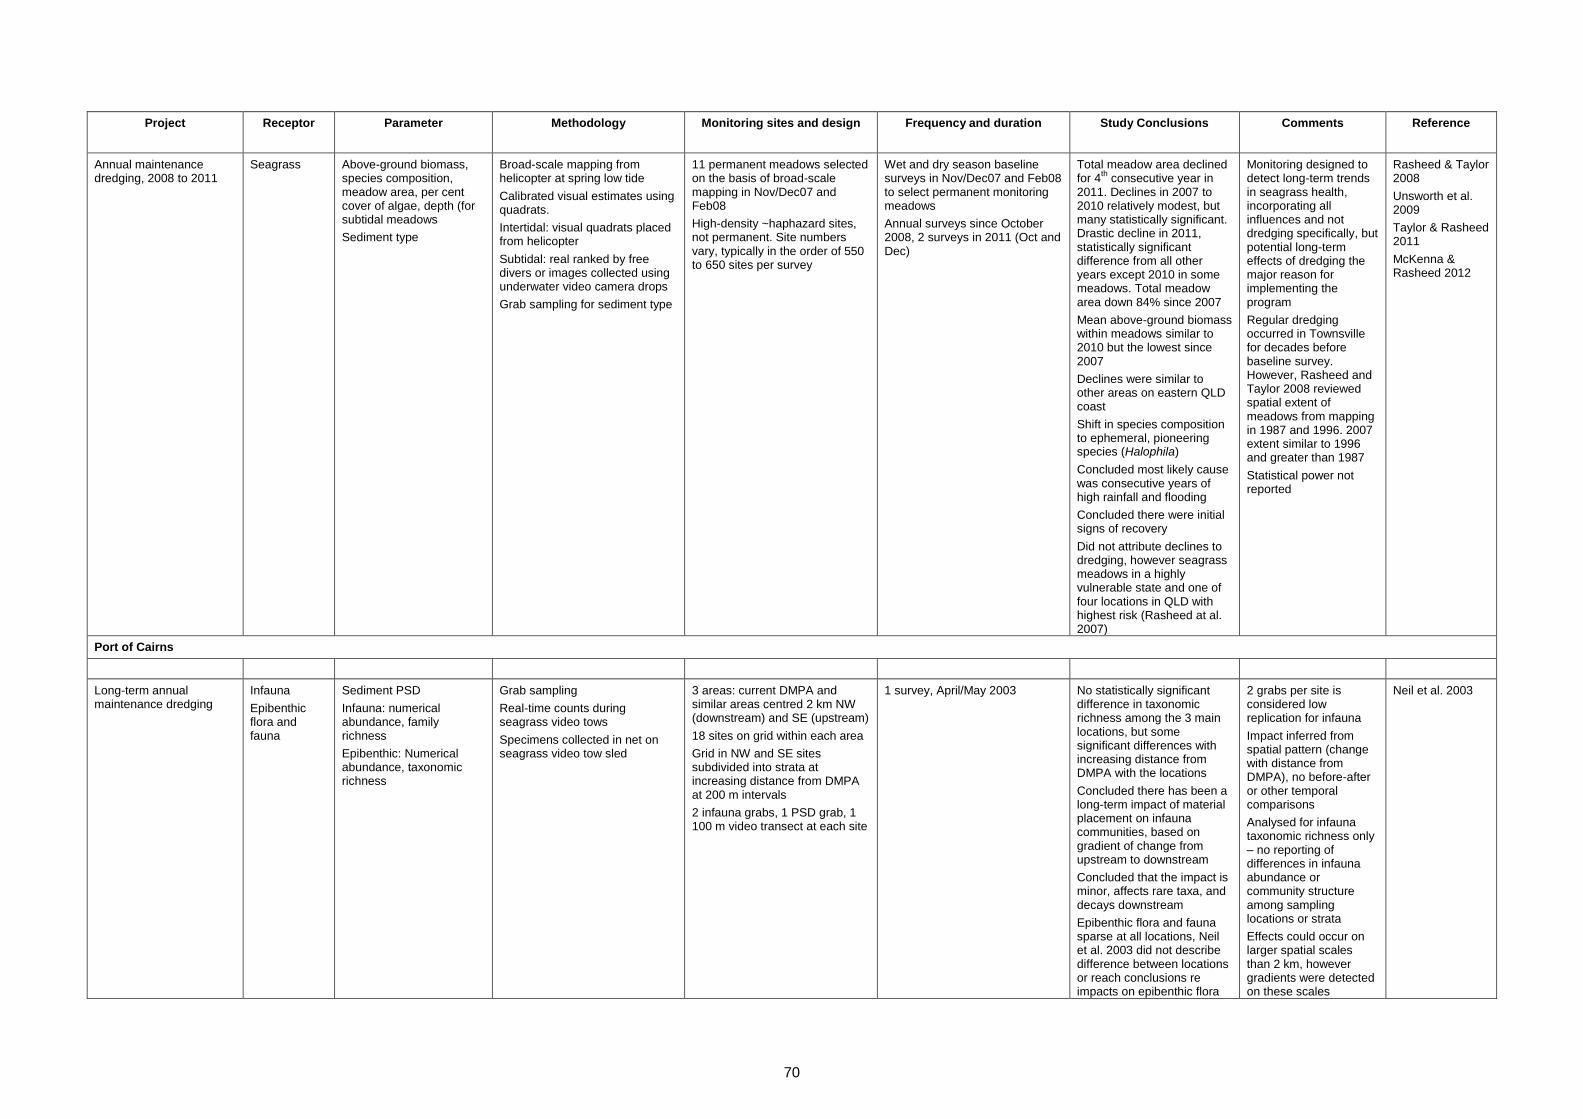
70
Project Receptor Parameter Methodology Monitoring sites and design Frequency and duration Study Conclusions Comments Reference
Annual maintenance dredging, 2008 to 2011
Seagrass Above-ground biomass, species composition, meadow area, per cent cover of algae, depth (for subtidal meadows
Sediment type
Broad-scale mapping from helicopter at spring low tide
Calibrated visual estimates using quadrats.
Intertidal: visual quadrats placed from helicopter
Subtidal: real ranked by free divers or images collected using underwater video camera drops
Grab sampling for sediment type
11 permanent meadows selected on the basis of broad-scale mapping in Nov/Dec07 and Feb08
High-density ~haphazard sites, not permanent. Site numbers vary, typically in the order of 550 to 650 sites per survey
Wet and dry season baseline surveys in Nov/Dec07 and Feb08 to select permanent monitoring meadows
Annual surveys since October 2008, 2 surveys in 2011 (Oct and Dec)
Total meadow area declined for 4
th consecutive year in
2011. Declines in 2007 to 2010 relatively modest, but many statistically significant. Drastic decline in 2011, statistically significant difference from all other years except 2010 in some meadows. Total meadow area down 84% since 2007
Mean above-ground biomass within meadows similar to 2010 but the lowest since 2007
Declines were similar to other areas on eastern QLD coast
Shift in species composition to ephemeral, pioneering species (Halophila)
Concluded most likely cause was consecutive years of high rainfall and flooding
Concluded there were initial signs of recovery
Did not attribute declines to dredging, however seagrass meadows in a highly vulnerable state and one of four locations in QLD with highest risk (Rasheed at al. 2007)
Monitoring designed to detect long-term trends in seagrass health, incorporating all influences and not dredging specifically, but potential long-term effects of dredging the major reason for implementing the program
Regular dredging occurred in Townsville for decades before baseline survey. However, Rasheed and Taylor 2008 reviewed spatial extent of meadows from mapping in 1987 and 1996. 2007 extent similar to 1996 and greater than 1987
Statistical power not reported
Rasheed & Taylor 2008
Unsworth et al. 2009
Taylor & Rasheed 2011
McKenna & Rasheed 2012
Port of Cairns
Long-term annual maintenance dredging
Infauna
Epibenthic flora and fauna
Sediment PSD
Infauna: numerical abundance, family richness
Epibenthic: Numerical abundance, taxonomic richness
Grab sampling
Real-time counts during seagrass video tows
Specimens collected in net on seagrass video tow sled
3 areas: current DMPA and similar areas centred 2 km NW (downstream) and SE (upstream)
18 sites on grid within each area
Grid in NW and SE sites subdivided into strata at increasing distance from DMPA at 200 m intervals
2 infauna grabs, 1 PSD grab, 1 100 m video transect at each site
1 survey, April/May 2003 No statistically significant difference in taxonomic richness among the 3 main locations, but some significant differences with increasing distance from DMPA with the locations
Concluded there has been a long-term impact of material placement on infauna communities, based on gradient of change from upstream to downstream
Concluded that the impact is minor, affects rare taxa, and decays downstream
Epibenthic flora and fauna sparse at all locations, Neil et al. 2003 did not describe difference between locations or reach conclusions re impacts on epibenthic flora
2 grabs per site is considered low replication for infauna
Impact inferred from spatial pattern (change with distance from DMPA), no before-after or other temporal comparisons
Analysed for infauna taxonomic richness only – no reporting of differences in infauna abundance or community structure among sampling locations or strata
Effects could occur on larger spatial scales than 2 km, however gradients were detected on these scales
Neil et al. 2003
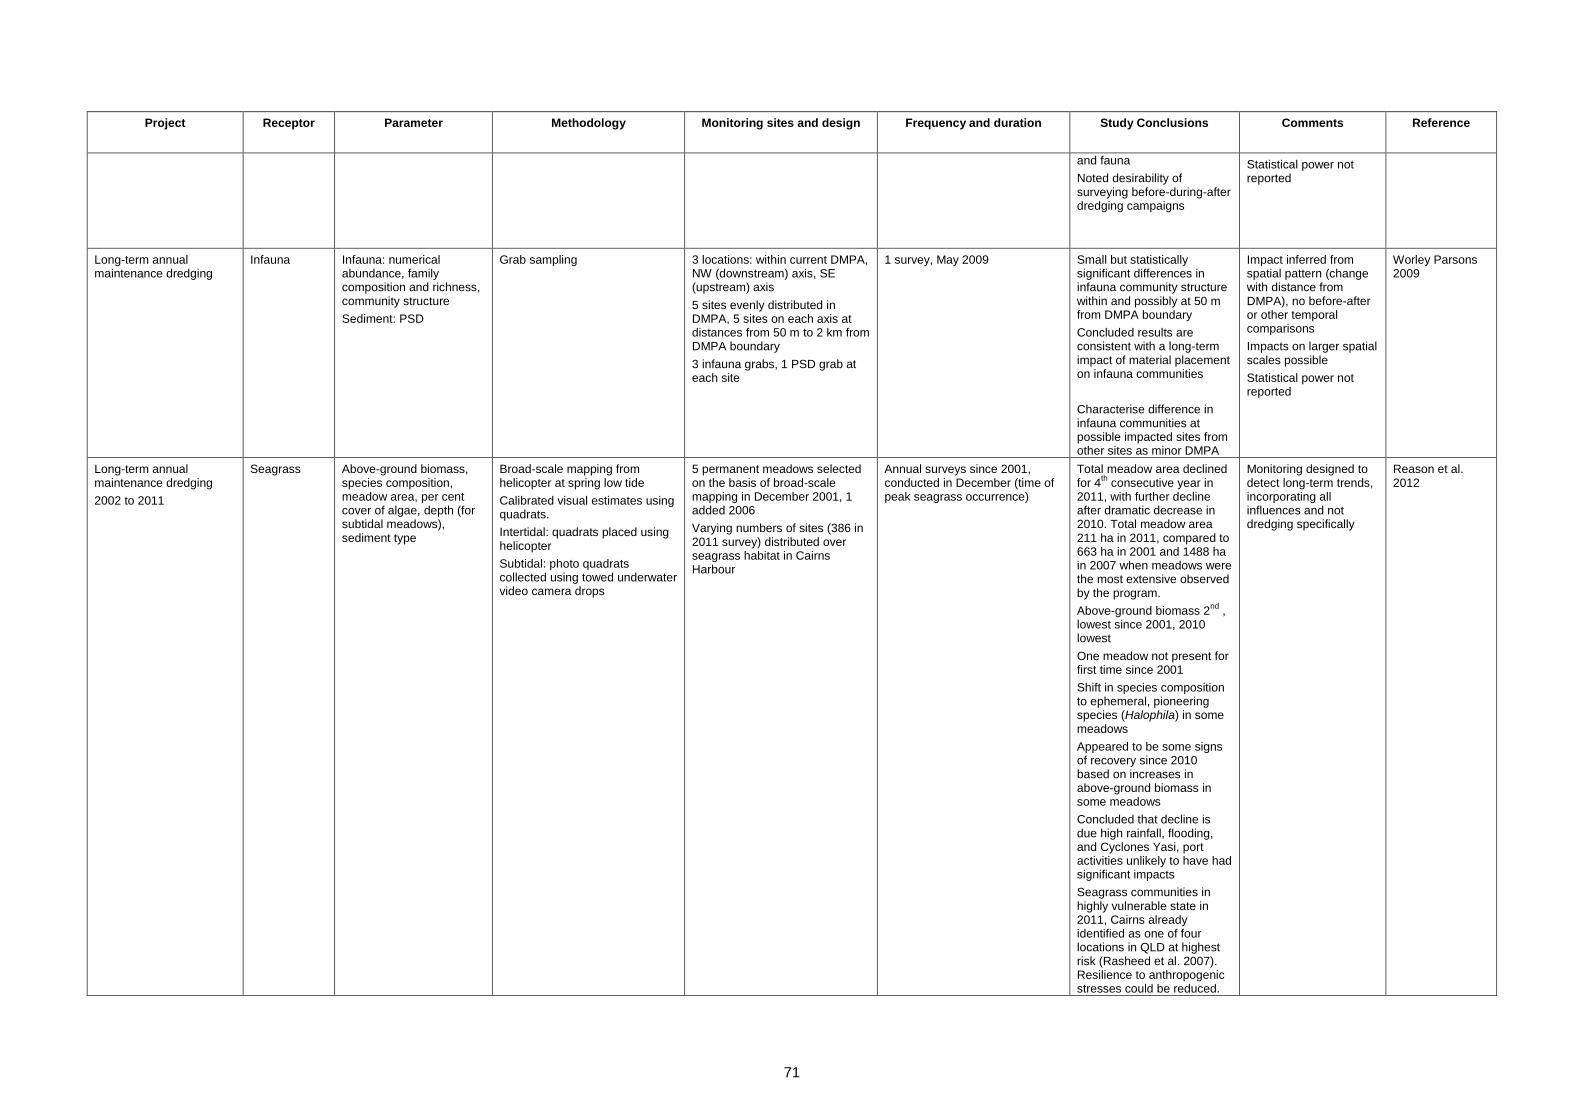
71
Project Receptor Parameter Methodology Monitoring sites and design Frequency and duration Study Conclusions Comments Reference
and fauna
Noted desirability of surveying before-during-after dredging campaigns
Statistical power not reported
Long-term annual maintenance dredging
Infauna Infauna: numerical abundance, family composition and richness, community structure
Sediment: PSD
Grab sampling 3 locations: within current DMPA, NW (downstream) axis, SE (upstream) axis
5 sites evenly distributed in DMPA, 5 sites on each axis at distances from 50 m to 2 km from DMPA boundary
3 infauna grabs, 1 PSD grab at each site
1 survey, May 2009 Small but statistically significant differences in infauna community structure within and possibly at 50 m from DMPA boundary
Concluded results are consistent with a long-term impact of material placement on infauna communities
Characterise difference in infauna communities at possible impacted sites from other sites as minor DMPA
Impact inferred from spatial pattern (change with distance from DMPA), no before-after or other temporal comparisons
Impacts on larger spatial scales possible
Statistical power not reported
Worley Parsons 2009
Long-term annual maintenance dredging
2002 to 2011
Seagrass Above-ground biomass, species composition, meadow area, per cent cover of algae, depth (for subtidal meadows), sediment type
Broad-scale mapping from helicopter at spring low tide
Calibrated visual estimates using quadrats.
Intertidal: quadrats placed using helicopter
Subtidal: photo quadrats collected using towed underwater video camera drops
5 permanent meadows selected on the basis of broad-scale mapping in December 2001, 1 added 2006
Varying numbers of sites (386 in 2011 survey) distributed over seagrass habitat in Cairns Harbour
Annual surveys since 2001, conducted in December (time of peak seagrass occurrence)
Total meadow area declined for 4
th consecutive year in
2011, with further decline after dramatic decrease in 2010. Total meadow area 211 ha in 2011, compared to 663 ha in 2001 and 1488 ha in 2007 when meadows were the most extensive observed by the program.
Above-ground biomass 2nd
, lowest since 2001, 2010 lowest
One meadow not present for first time since 2001
Shift in species composition to ephemeral, pioneering species (Halophila) in some meadows
Appeared to be some signs of recovery since 2010 based on increases in above-ground biomass in some meadows
Concluded that decline is due high rainfall, flooding, and Cyclones Yasi, port activities unlikely to have had significant impacts
Seagrass communities in highly vulnerable state in 2011, Cairns already identified as one of four locations in QLD at highest risk (Rasheed et al. 2007). Resilience to anthropogenic stresses could be reduced.
Monitoring designed to detect long-term trends, incorporating all influences and not dredging specifically
Reason et al. 2012
72
BENEFITS OF THE STUDY
A major benefit of this study is that it provides insight into differences in sediment migration patterns, both during dredging operations and over 12 months, that result from placing dredged material at hypothetical alternative and currently used material placement sites. The study gives decision makers further understanding of the maximum credible excursions that sediment may travel when placed at potential alternative sites.
Including the effects of large-scale currents in hydrodynamic modelling of bed shear-stress and long-term sediment migration has major implications for the management of dredge material in the Region. Contrary to expectations, the modelling of the Region indicates that placement of material in deeper water further offshore in the Reef lagoon than the currently used placement sites would not necessarily result in reduced migration of dredge material. In fact, the modelling incorporating large-scale currents generally predicts that material placed offshore may if anything be more mobile than if placed in the current sites closer to shore.
As a result, placement of dredge material further offshore does not necessarily result in obvious environmental benefit in terms of the mobility of material after placement. Overall, the modelling predicts that placement of material at model case sites offshore of the currently used sites would reduce coastal TSS and sedimentation immediately adjacent to the study areas, but result in sediment transport further to the north-west and further offshore. The use of alternative placement sites should be assessed on a case-by case-basis depending on the sensitive receptors that may be affected. The case-by-case assessment should take into account potential differences in sensitivity and resilience of the receptors.
SKM stresses that the study has not attempted to provide an impact assessment of dredge material placement at specific sites, and that the value of the study lies in the comparative evaluation of the implications of placement in the alternative areas considered, including currently used sites. The study indicates that, compared to currently used material placement sites, placement of dredge material further offshore may result in effects that also extend further offshore, as well as in higher sediment mobility. Thus, a strategy favouring placement of dredge material further offshore would need to evaluate how the sensitivity of receptors varies along the inshore-to-offshore gradient, the cumulative impacts of dredge material placement in relation to other sediment sources, and the relative uses and environmental values of different reef settings. In this regard it should be recognised that placement further offshore has potential environmental costs, such as increased duration of dredging campaigns due to longer cycling times, prolonging the environmental disturbance, increased greenhouse gas emissions due to longer distances travelled by dredging vessels, and greater uncertainty of environmental outcomes associated with placement in new, generally less well-known areas.
Maintenance dredging activities under the NAGD require that ports establish a TACC as a consultative mechanism to provide continuity in environmental protection, aid stakeholder communication, assist (where appropriate) in longer-term permitting arrangements, review ongoing management of dredging and material placement, and, as necessary or appropriate, make recommendations to the proponent and the Determining Authority. Membership of a TACC is drawn from government agencies at Commonwealth, State, and Local Government levels, non-governmental organisations, and community groups. As a consultative mechanism, a TACC is not able to make decisions regarding the design and implementation of monitoring programs, including setting management trigger levels for water quality or ecological monitoring.
73
Nonetheless, the NAGD recommend that monitoring programs are developed in consultation with stakeholders, usually through the TACC and the Determining Authority. SKM recommends that TACCs are involved in all stages of developing monitoring programs (see ‘Water Quality Framework’ page 15).
For capital dredging, though not required by the NAGD, it is common practice to establish a Management Reference Group (MRG). MRGs are somewhat similar to TACCs in that they provide a mechanism for consultation and review of monitoring and may make recommendations on management of dredging and material placement operations. Often, membership of MRGs does not include community groups or non-governmental organisations, but it may include independent scientists. MRGs sometimes have a role in interpreting the results of monitoring and in making decisions on management actions to be taken based on the results of monitoring. SKM recommends that the roles and responsibilities of MRGs be clearly defined on a case-by-case basis for capital dredging and material placement projects, and that the MRG is involved as early as possible in all phases of the project (see Water Quality Framework’ page 15).
74
KNOWLEDGE GAPS, FURTHER RESEARCH AND MANAGEMENT STRATEGIES
This pilot study is the first to incorporate the effects of large-scale currents in the Region in modelling the migration of dredge material over the long term (12 months). SKM APASA (2013c, 2013d; see Appendix E and F) describe in detail the assumptions and limitations of the modelling, which represents "maximum credible" predictions of the long-term fate of dredge material after placement at sea. Long-term migration may in fact be less than the model predicts, but the study clearly indicates that dredge material placed at sea has the potential to migrate on much greater spatial and temporal scales than has previously been appreciated. This is largely because the influence of large-scale currents has not previously been included in modelling of dredge material transport. In addition, only one previous study (BMT WBM 2012) has modelled the movement of dredge material over a period of 12 months after commencement of placement operations. BMT WBM (2012) also predicted long-range movement of material, in the case of their study beyond the modelling domain. The current study's predictions of dredge material migration on large spatial and temporal scales point to a number of key knowledge gaps and research areas in relation to developing improved management strategies for dredge material in the Region.
Modelling Sensitivity Analysis
The study has been particularly ambitious not only in including large-scale currents in modelling dredge material migration over 12 months, but in doing so at the scale of the entire Region, with bed shear-stress modelling for 12 Queensland ports and more detailed dredge material modelling for the six main study areas. Completing these tasks within the time and financial constraints of the study necessarily required a number of simplifying assumptions, which are described in detail by SKM APASA (2013c, 2013d; see Appendix E and F).
In principle it would be possible to further develop and refine the model at the Regional scale. At some point it would be advisable to consider whether the best environmental management outcomes are likely to result from further investment in ever more sophisticated modelling. Modelling could be supported by a number of other initiatives such as strategic water quality and ecological impact monitoring, research on receptor sensitivities, improved methods for water quality monitoring and rapid detection of ecological stress, research on the effectiveness of potential mitigation measures, and studies of cumulative impact and ecosystem resilience.
At this stage, SKM's view is that further research on modelling of dredge material transport, in particular the sensitivity of model predictions to the key parameters identified in this study, is a priority for further developing management strategies. This could be done by varying the key assumptions for one or a few elected model cases to determine the extent to which model predictions are affected by a realistic range of each parameter. This sensitivity analysis would be invaluable is developing improved models so as to provide the best possible predictive assessment of dredge material movement in the World Heritage Area within the context of the overall sediment dynamics regime. Model sensitivity analysis would also help set priorities for field and laboratory research, by identifying which parameters are most critical to quantify. Perhaps most importantly, the results are needed to help clarify the range of variability and uncertainty in model predictions of dredge material migration. An understanding of this range is needed to guide the development of a strategic approach to water quality and ecological monitoring at the Regional scale. For example, in selecting sites for long-term strategic monitoring, it is important to understand how much the spatial pattern of sediment movement might vary from year to year.
75
Inter-annual Variability
The modelling in this study used wind, wave, tide and current data from 2011. In developing the model, data from the years 2004 to 2011 were examined. The year 2011 was selected because it had the most energetic conditions that is, the highest current speeds, of the eight years examined (figure 9). This provides an upper bound for sediment transport, in other words ‘maximum credible’ predictions of dredge material migration. The year 2011 was also a strong La Niña year. It would be useful to understand how representative the results of the study are with respect to less-energetic conditions, and to fluctuations in the El Niño-Southern Oscillation cycle, that is, whether the predicted distance and direction of dredge material migration also hold true in El Niño or neutral years. This could be assessed by using data from other years to drive the model while holding other parameters constant.
Sediment Resuspension and Consolidation
Determination of site-specific estimates of critical shear-stresses for resuspension of particles of different sizes was beyond the scope of the study, and resuspension was modelled using uniform estimates based on accepted published values. The estimates for resuspension (i.e. erosion) were based on available literature. Additional model runs varying the assumed 'resuspensibility' of sediments once settled on the bottom (technically termed the erosion constant) would elucidate the sensitivity of the model predictions to this parameter.
Similarly, the model did not take into account the consolidation of dredge material on the bottom after release (SKM APASA 2013c, 2013d; see Appendix E and F). This assumption gives an upper bound for subsequent resuspension and migration. Again the importance of this assumption, and thus the priority of studies to quantify the consolidation rate and its effect on sediment resuspension, could be tested through model runs that assume varying rates of consolidation while holding other parameters constant.
Ambient Background
The study modelling has predicted "above background" TSS and sedimentation, meaning that dredge material is considered in isolation from ambient conditions. This inherently assumes that the effects of dredge material placement are simply additive to whatever ambient levels exist at any point in time. This is a standard approach often used in modelling of dredge material placement and a necessary assumption given the time and financial constraints of the study.
Understanding of ambient background has important implications. If background TSS or sedimentation are already at or near levels that cause ecosystem stress, it is possible that relatively small increases above background could increase stress and therefore cumulative impacts, potentially tipping a system beyond a tolerance threshold. Conversely, if the above-background contribution from dredge material is small relative to ambient background, then it could be difficult to measure any incremental increase attributable to dredging. In terms of a better understanding of the model predictions, an important aspect of the "above background" assumption may be with regard to dredge material resuspension, which is the primary driver of the long-range migration predicted by the model. As described by SKM APASA (2103c; 2013d; see Appendix E and F), the modelling incorporates the effects of armouring, which refers to the winnowing away of fine material from the sediment surface, leaving a surface layer of relatively coarse material that tends to protect underlying fines from being resuspended.
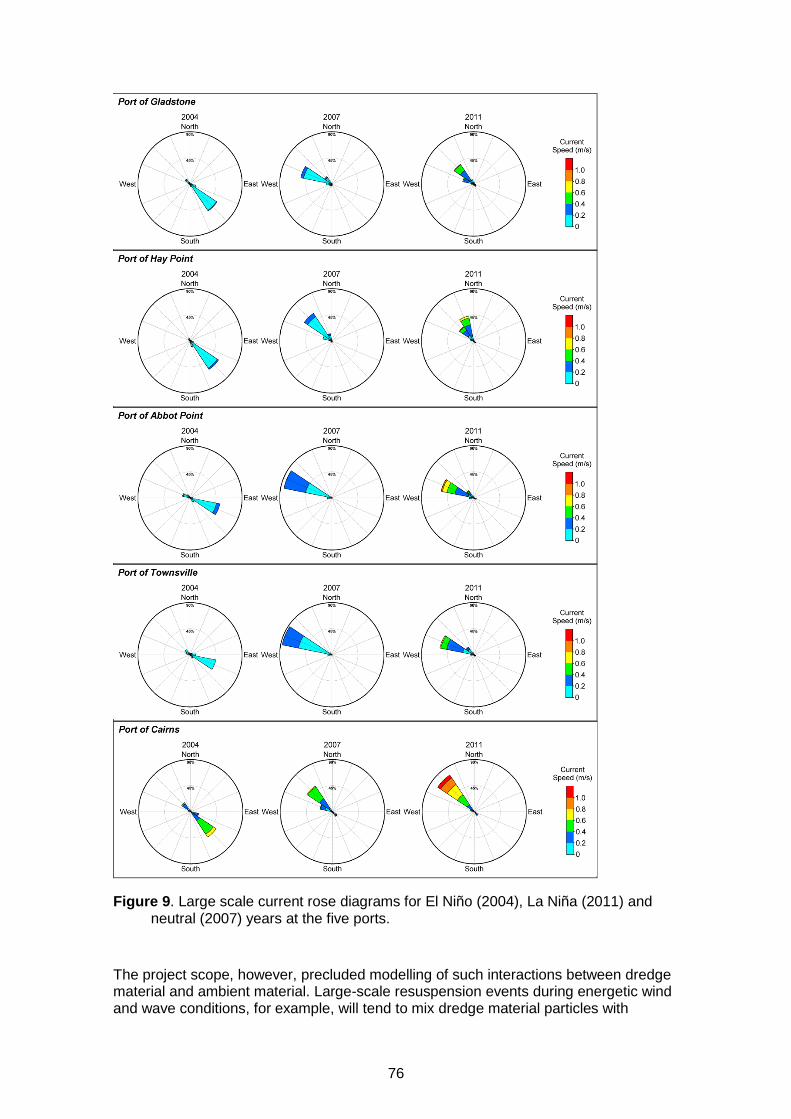
76
Figure 9. Large scale current rose diagrams for El Niño (2004), La Niña (2011) and neutral (2007) years at the five ports.
The project scope, however, precluded modelling of such interactions between dredge material and ambient material. Large-scale resuspension events during energetic wind and wave conditions, for example, will tend to mix dredge material particles with
77
ambient sediment resuspended from surrounding areas. When the suspended sediments settle, this could tend to bury material under ambient sediments, reducing subsequent resuspension of the dredge material and therefore its mobility.
Additional modelling that incorporates ambient resuspension would provide valuable insight into the relative contributions of dredge material and other sources of sediment in the Region, and their subsequent migration. This would be a direct contribution to improved capabilities for cumulative impact assessment.
Incorporation of Large-Scale Currents
The modelling in this study incorporated the influence of large-scale currents on sediment transport through a process of vector addition (SKM APASA 2013c; see Appendix E). To better understand the significance of this approach, future work could apply the HYCOM (large-scale current model) predictions as boundary conditions to the tidal and local winds model, so that the models are at the same spatial (700 m) and temporal (hourly) resolution. This approach would also verify the influence of large-scale currents in water depths less than 10 m and whether the approach adopted in this research may be an over-estimate of the dredge plume footprints.
Shallow Water Processes
The scope of the project did not permit the inclusion of shallow water processes on sedimentation, specifically shallow waves (e.g. surge from shoaling waves, surf), or tidal pumping of sediment into mangroves and estuaries (SKM 2013a, 2013b; see Appendix E and F). If the study is used for the intended purpose, comparison of the relative outcomes of placing material in different locations, and not to predict impacts on specific receptors, this is not a critical assumption. Detailed environmental impact assessment, on the other hand, would need to consider these important shallow water processes. For example, predictions of relatively high sediment deposition on the exposed windward sides of islands and reefs that do not take these processes into account are unlikely to be realistic.
SKM’s view is that the technical requirements to link models of detailed shallow water processes to large-scale processes are not currently justified in the context of strategic consideration of improved management arrangements for dredge material and that other research areas have higher priority.
Presentation and Interpretation of Modelling Results
In the course of the project it became apparent that model results presented as maps of percentiles of occurrence of various TSS concentrations and sedimentation rates are sometimes difficult to understand and interpret. SKM and APASA believe it would be beneficial to initiate a process to address questions such as: a) What is the best way to represent model output? b) What should be industry standards or what is considered best practice when reporting modelling results? c) How should the technical/regulatory community interpret modelling results?
Direct Sediment Resuspension and Consolidation Studies
The model predictions of relatively high bed shear-stress and resultant significant sediment resuspension in deeper waters offshore of the currently used sites are an unexpected result of the study. Studies of sediment resuspension in the Reef lagoon not directly related to dredge material tend to indicate that sediment resuspension is relatively uncommon below a depth of about 20 m (e.g. Larcombe & Woolfe, 1999; Orpin et al. 1999, 2004; Wolanski et al. 2005). Wolanski et al. (2005), for example,
78
found that sediment resuspension during storms did not extend below a depth of 12 m on the windward side of an inner-shelf island, or below 5.5 m on the leeward side.
Previous direct studies of natural sediment resuspension in the Region, however, have tended to focus on sediment resuspension in inshore areas, rather the mid-shelf lagoon, where the present study predicts a strong influence of large-scale currents on bed shear-stress and resultant sediment resuspension. Model sensitivity analysis would provide insight into whether the resuspension parameter assumptions have a critical effect on predicted sediment migration. If so, field measurements of bed shear-stress and/or sediment resuspension would significantly improve understanding of the implications of offshore dredge material placement in relation to the present study’s results. Useful information may already be available Acoustic Doppler Current Profile (ADCP) current data collected for hydrodynamic modelling in EISs for proposed dredging and material placement projects. ADCP data derive current speeds from the movement of particles in the water column, and can be processed to estimate sediment resuspension.
Measurements of resuspension of ambient sediment from the seabed, however, may not be representative of resuspension of dredge material after placement, for example because of differences in particle size distribution or because ambient sediments are more consolidated (compacted) than dredge material, especially when newly placed. Consolidation increases the bed shear-stress required to resuspend sediments. As noted by SKM APASA (2013c, 2013d; see Appendix E and F) in relation to maintenance dredging, placement of dredge material has the potential to increase suspended sediment concentrations and sediment mobility, even if not representing a new sediment input to the lagoon, by making the sediment more susceptible to resuspension. Additional studies such as that by Wolanski et al. (1992), assessing consolidation and resuspension through field studies of suspended solids concentrations in relation to winds and currents coupled with laboratory experiments, would be useful in refining the model predictions of the present study. It is also possible to directly monitor consolidation, and changes in particle size distribution due to winnowing of fine surface material, with advanced techniques such as SPI. Measurements of sediment consolidation and its effects on resuspension are also needed to inform modelling of the relative resuspension of dredge material and ambient seabed sediments.
Improved Understanding of Operational Mitigation Measures
The model in this study assumed material was released randomly over the sites during the dredging campaign scenarios. Operational measures during dredge material placement have the potential to reduce loss of dredge material from a placement site, and thus potential effects of material migration from the site. For example, placing material from a given dredging campaign over a small part of a long-term placement site forms a thick layer of material, as opposed to spreading a thin layer over an entire disposal site, would be expected to reduce migration from the site. Placement of material in the up-current portion of a placement site as a function of current conditions, so that the current does not carry material outside the placement site, might also reduce sediment migration. Further modelling and/or direct studies of sediment consolidation and resuspension in relation to placement methodology would provide improved understanding of the potential effectiveness of such measures.
Navigational considerations, hydrodynamic and habitat effects of altered bathymetry, and other factors also need to be considered in designing the placement methodology. Port- and project-specific EISs would be required to identify and assess specific operational mitigation measures.

79
A Strategic Approach to Monitoring
Arguably the most important finding of this study has been that dredge material has the potential to migrate on larger spatial and temporal scales than previously appreciated. As described above, further research is needed to clarify uncertainties and variability in dredge material migration, but the results clearly point to a need for a more strategic approach to water quality and ecological monitoring in the Region with regard to sediment-related impacts. Key aspects of such an approach include:
The monitoring should operate at multiple spatial scales, up to the scale of the Region as a whole
The monitoring should be a long-term (i.e. permanent) program
The program should be designed to maximise the ability to differentiate sources of sediments (e.g. dredge material vs. river inputs, new inputs vs. resuspension of ambient sediments) in relation to water quality conditions
The program should be designed to support assessment of cumulative impacts and ecosystem resilience.
The detailed scientific design of such a strategic monitoring program will require considerably improved understanding of the large-scale, long-term behaviour of dredge material, as well as sediment from other sources. The process for developing the program, however, should commence as soon as possible and not wait for the outcomes of future research.
Methods to Assess Cumulative Impacts and Resilience
The results of this study clearly identify the need for better understanding of the cumulative impacts of coastal development activities, including dredging and dredge material placement, on water quality and thereby the ecosystems of the Region. It must also be recognised that there are multiple stresses on the Reef ecosystem in addition to coastal development, and sediment-related effects in general. Some of these stresses, most importantly climate change and ocean acidification, cannot be managed at the Regional level. Management of dredge material must therefore occur in the context of maintaining ecosystem resilience to broader-scale stresses. Robust, objective, and science-based methodologies are needed, in the first instance to design a strategic monitoring program, but much more broadly to define, assess, and manage cumulative impacts and ecosystem resilience in the Region, and to assess the effectiveness of management interventions.
Beneficial Reuse of Dredge Material
In addition to areas for further research related to migration of dredge material placed at sea, future coastal development has the potential to create new opportunities for beneficial reuse of dredge material. As part of a broader Regional strategy it might be possible to identify development options that expand the options and demand for beneficial reuse of dredge material. The scope of the project did not permit exploration of this concept. Such research should involve local councils and relevant Queensland agencies in identifying potential uses and placement sites for dredge material in the context of local and regional planning, which could help improve the integration of coastal management with port operation and development.
80
REFERENCES
AIMS 1996-2013 'Reef monitoring surveys' http://www.aims.gov.au/docs/data-centre/reef-monitoring-surveys.html, last viewed 14 June 2013.
BMT WBM 2012, ‘Rosslyn Bay Boat Harbour Modelling Investigation Draft Report’, Report prepared for Department of Transport and Main Roads, 49pp.
Brando, V. E Schroeder, T., Blondeau-Patissier, D., Clementson, L., Dekker, A.G., 2011, Reef Rescue Marine Monitoring Program: using Remote Sensing for GBR wide water quality. Final Report for 2010/11 Activities, CSIRO Land and Water, Canberra.
Erftemeijer, P. L. A., Riegl, B., Hoeksema, B. W., Todd, P.A. 2012, ‘Environmental impacts of dredging and other sediment disturbances on corals: a review’, Marine Pollution Bulletin 64: 1737-1765.
Erftemeijer, P. L. A., Robin-Lewis, R. R. 2006, ‘Environmental impacts of dredging on seagrass: A review’, Marine Pollution Bulletin, 52, 1553-1572.
GBRMPA 2012, The use of hydrodynamic numerical modelling for dredging projects in the Great Barrier Reef Marine Park, Great Barrier Reef Marine Park Authority, Townsville. GBRMPA External Guideline.
Gilmour, J. P., Cooper, T. F., Fabricius, K. E. and Smith, L. D. 2006, ‘Early warning indicators of change in the condition of corals and coral communities in response to key anthropogenic stressors in the Pilbara, Western Australia’. Environmental Protection Authority. Western Australia.
Larcombe, P. and Woolfe, K.J. 1999, ‘Increased sediment supply to the Great Barrier Reef will not increase sediment accumulation at most coral reefs’, Coral Reefs, 18, 163-169.
Orpin, A.R., Ridd, P.V. and Stewart, L.K. 1999, ‘Assessment of the relative importance of major sediment-transport mechanisms in the central Great Barrier Reef lagoon’, Australian Journal of Earth Sciences, 46, 883–896.
PIANC 2010. ‘Dredging and Port Construction Around Coral Reefs’, PIANC Report No. 108, World Association for Waterborne Transport Infrastructure.
Schaffelke B., Carleton J., Doyle J., Furnas M., Gunn K., Skuza M., Wright M., and Zagorskis, I., 2011, Reef Rescue Marine Monitoring Program. Final Report of AIMS Activities 2010/11– Inshore Water Quality Monitoring. Report to the Great Barrier Reef Marine Park Authority, Australian Institute of Marine Science, Townsville.
SKM 2013a, ‘Improved dredge material management for the Great Barrier Reef Region. Literature review and cost analysis of land-based dredge material reuse and disposal options: report to Great Barrier Reef Marine Park Authority’, Unpublished report.
SKM 2013b, ‘Improved dredge material management for the Great Barrier Reef Region. Water quality review and monitoring framework: report to Great Barrier Reef Marine Park Authority’, Unpublished report.
SKM APASA 2013a, ‘Improved dredge material management for the Great Barrier Reef Region. Modelling of bed shear-stress in the vicinity of Queensland trading ports in the Great Barrier Reef Region: report to Great Barrier Reef Marine Park Authority’, Unpublished report.
81
SKM APASA 2013b, ‘Improved dredge material management for the Great Barrier Reef Region. Identification of alternative sites for the placement of dredge material at sea: report to Great Barrier Reef Marine Park Authority’, Unpublished Report.
SKM APASA 2013c, ‘Improved dredge material management for the Great Barrier Reef Region. Modelling Sediment Migration from Current and Hypothetical Alternative Placement Sites: report to Great Barrier Reef Marine Park Authority’, Unpublished report.
SKM APASA 2013d, ‘Improved dredge material management for the Great Barrier Reef Region. ‘Sensitive receptor risk assessment of alternative and current dredge material placement sites: report to Great Barrier Reef Marine Park Authority’, Unpublished report.
Thompson A., Costello P., Davidson J., Logan M., Schaffelke B., Uthicke S, and Takahashi M. (2011b) Reef Rescue Marine Monitoring Program. Report of AIMS Activities 2011. Inshore Coral Reef Monitoring, Report to the Great Barrier Reef Marine Park Authority, Australian Institute of Marine Science, Townsville.
Thompson, A., Davidson, J., Uthicke S., Schaffelke, B., Patel, F. and Sweatman, H. (2011a). Reef Rescue Marine Monitoring Program, Final Report of AIMS Activities 2010 Project 3.7.1b Inshore Coral Reef Monitoring. Report to the Great Barrier Reef Marine Park Authority, Australian Institute of Marine Science, Townsville.
WAEPA 2011, Environmental Assessment Guideline for Marine Dredging Proposals, Environmental Assessment Guidelines EAG 7, Western Australia Environmental Protection Authority, Perth.
Wolanski, E., Fabricius, K., Spagnol, S., Brinkman, R. 2005, ‘Fine sediment budget on an inner-shelf coral-fringed island, Great Barrier Reef of Australia’, Estuarine, Coastal and Shelf Science, 65, 153–158.
Wolanski, E., Gibbs, R., Ridd, P., and Mehta, A. 1992, ‘Settling of ocean-dumped dredged material, Townsville, Australia’, Estuarine, Coastal and Shelf Science, 35, 473-489.

82
APPENDIX A LITERATURE REVIEW AND COST ANALYSIS

83
APPENDIX B WATER QUALITY FRAMEWORK

84
APPENDIX C BED SHEAR-STRESS MODELLING
85
APPENDIX D IDENTIFICATION OF ALTERNATIVE SITES FOR DREDGE MATERIAL PLACEMENT AT SEA

86
APPENDIX E SEDIMENT PLUME AND MIGRATION MODELLING

87
APPENDIX F SENSITIVE RECEPTORS RISK ASSESSMENT