Integrated Utilization of Sewage Sludge and Coal Gangue for ...

GAIGHER, J.L. and VAN NIEKERK, G.J. Improved control of phosphate flotation by means of a simple mineralogical regression model. APCOM 87. Proceedings of the Twentieth International Symposium on the Application of Computers and MatheJ;llatics in the Mineral Industries. Volume 2: Metallurgy. Johannesburg,
SAIMM, 1987. pp. 89-104.
Improved Control of Phosphate Flotation by means of a Simple Mineralogical Regression Model
J.L. GAIGHER and G.J. VAN NIEKERK
Phosphate Development Corporation Ltd, Phalaborwa, South Africa.
A simple mineralogical regression model is described, which was devised in order to help the flotation plant cope with rapidly changing headgrades and feed mineralogy.
Minerals in the feed were determined by means of quantitative X-ray diffraction and compared with plant performance parameters and flotation reagent consumption rates, using regression analysis.
A mineralogical regression model for predicting recovery served to motivate flotation plant personnel and also set standards whereby flotation performance could be measured. The reagent consumption model indicated in which direction any or all of five flotation consumption rates should be altered.
All practically measurable parameters, even those showing poor or no correlation, were included in the model, provision being made for the continuous update of a batch of data of 30 lines.
Compared with the method of multiple linear regressions, the r is poorer at 0,41 (versus 0,50), but the mean standard error of estimate for both methods is identical at ± 6,6 units.
The regression model is simpler than the method of multiple linear regressions, and although the accuracy of prediction is not high (410/0), the mineralogical regression model proved to be successful in practice.
Flotation efficiency, as measured by the mean ratio of head to tails grade, for the 9 month period after the mineralogical regression model was implemented on an hourly basis, improved from 2,8 to 3,2, which is equivalent
to an improvement in average flotation recovery of 5 % relative.
Introduction
Foskor produces a
trate, (fluor-apatite),
phosphate
by means
concen
of a
froth flotation proces~, using various
flotation reagents. These reagents are
expensi ve and contributed more than 2S%
to production costs in 1985.
Nearly half of the phosphate flotation
capacity is utilized in the processing of
tailings, origtnating from another com
pany. In other words, no prior planning
or ore blending in order to ensure a
constant or known headgrade to the fl ota
tion plant has been possible.
Although the yearly average headgrade
is reasonably constant, average daily
headgrades are found to vary between wi de
limits, and the hourly feed mineralogy is
even more variable. A 30% increase or
decrease in headgrade over a peri od of
only 24 hours is not uncommon.
IMPROVED CONTROL OF PHOSPHATE FLOTATION
Statement of problem
The flotation of apatite in the pre
sence of calcite is a difficult process,
requiring a combination of four or five
chemical reagents, whose reaction with
89

\D
0 s:::
tn ~ t""
" t: :;d o ~ "T
I t""
" o ~ >-l o Z s::: o tJ
tn
t"""
t""" Z
o
w
0 « 0::
(!)
10
W
I-
0
~rt:
I- z
~
w
0 u z 0 u ~
o >- 0::
W >
o u W
0::
W
0 1
0
« 0
0::
(\j
(!)
0...
o ~
« 0
w
::r:
37
~
/'--
..
--~--
/'
"-
-----
',-------
---,
"-"-
------
--3
6
_--
----
---
__
__
__
__
-/
"~
35
~
--------
----- ''
'-. ~~
"''-
---~/
80
70
60
9 8 7 6 5
-"'-
-..
/ .....
........
/,
...... _
----
./
/ / ..-
/ /
/
/ /
/
r-_
/
---
"\
I \
I \
I \
I \
I \
I
\ /
\ I
\ I
\ I
\ I
----,-
--,
x_x~
\ I
~ --
~ I
' '.
\
/
I
/ /
I,
I
//
/ ,,--
,-,~
\ /
' '~',
\
I /'
/ "
\ ,~,
' •
\ ~
I ,.
/
\.,
" I
_,--,
' \
"'--
" -r'
J .
~, -x
-_
._
,
\ _
_,
'"
. '-
.-,
, 1
_
I
2 3
4 5
6 7
8 9
10
11 12
13
14
15
DA
YS
FIG
UR
E 1
. T
ypic
al f
lota
tion
pla
nt p
erfo
rman
ce o
ver
a tw
o-w
eek
peri
od
=
AC
TU
AL
PR
ED
ICT
ED

one another and with the other gangue
minerals is not yet fully understood(1,2.
Conse-quE,'ntly, even during periods-{)f rela
ti vely constant feed mi neral ogy, many
minor adjustments have to be made to the
reagent addition rate in order to opti
mize flotation efficiency, a process
requiring a period of days, rather than
hours, to effect.
The problem is compounded by the fact
that chemical analyses of headgrade,
combined tails and concentrate grades,
are available only two hours after the
pulp has been sampled, owing to the wet
chemical method being used and logistic
problems. Plant control is thus mainly
in the hands of process controllers, who
rely on the physical appearance and
carrying power of the froth.
Figure 1 indicates daily headgrade,
recovery and concentrate grade for a
2-week peri od plotted together with the
recovery predi cted from the feed mi nera
logy (treated in next section), norma
lized for the concentrate grade even
tually produced. On days 1 to 3, the headgrade remained
relatively constant, and actual recove
ries were better than the predicted reco
very, but only on day 3 was the concen
trate produced of
i . e. it
flotation
an acceptable grade,
days to optimize
On day 4 the
requi red 3
efficiency.
headgrade suddenly improved by about 25%,
reagent adj us tme nts were not carried out
quickly enough, 5% was lost on recovery
and an unnecessari ly high concentrate
grade was produced. On days 5 to 7, the
headgrade remained uniformly high, and
the fl ota ti on pl ant managed to close the
gap between predicted and actual recovery
01') day 7, also after 3 days of trial and
error. Thereafter, headgrade deterio
rated rather badly to day 12, but then
IMPROVED CONTROL OF PHOSPHATE FLOTATION
slowly started to recover. The poor
recovery on day l3 was a di rect conse
quence of the pl ant superi ntendent' s
i nstructi on to reduce reagent consumpti on
rates, which were already unrealistically
high on days 11 and 12, although the
predicted and actual recoveries were then
qui te simil ar.
The problem is thus to narrow the gap
between unpredictable changes in feed
mi neralogy and reaction by flotation
plant, in adjusting reagent consumption
rates. Clearly, flotation efficiency
di rectly i nfl uences the Company's
profitability.
Setting the standard - The mineralogical regression model for predicting flotation recovery
Obvi ousl y, fl otati on p 1 a nt performance
as depicted in Figure 1, without the line
indicating potential or predicted
recovery, is almost meaningless. Plant
performance must be compared with a
realistic standard.
Sl urry feed to the flotation pl ant was
sampl ed on an hourly basi s, 24 hours per
day and seven days per week. The mine
rals in the feed were determined by
quantitative X-ray diffraction(3, using
the matrix flushing method of Chung(4,
where all the minerals are determined, so
that no internal standard is necessary.
Average daily feed mineralogy was
accumulated and linear regression ana
lysis(5 was carried out, correlating the
mineralogy with flotation recovery on the
plant. Recoveries were normalized to a
fixed concentrate grade by multiplying
the actual recovery wi th the grade pro
duced divided by 36,5. Some results in
the form of a correlation matrix are
given in Table 1.
As expected, recovery correlates best
with the amount of apatite in the feed (r
91

'l2\J3LE 1. Correlation coefficient r for feed mineralogy and flotation
recovery
Phlogopite Lizardite Diopside Calcite Dolomite Forsterite Recovery
Apatite -0,26
Phlogopite
Lizardite
Diopside
Calcite
Dolomite
Forsterite
0,74
-0,03
0,27
0,51
0,31
= 0,90 on a scale of + 1 to 0, where ° means no correlation). Also, certain
relationships between the feed minerals
are evident. Apatite, 1 izardite and
forsterite correlate strongly with one
another (r = 0,7), probably due to their
natural association with one another in
the Palabora Igneous Complex. Phlogopite
and diopside are associated with each
other, but do not have a significant
effEct on recovery. Calcite correlates
negatively with apatite and all of the
gangue minerals, except the other
carbonate in the ore, namely dolomite.
:: r 75 r
+
-0,70 -0,15 0,71 0,90
-0,36 -0,44 -0,34 -0,22
-0,63 -0,19 0,25 0,63
-0,53 -0,44 -0,06 0,24
0,09 -0,51 -0,68
0,12 -0,11
0,76
Significantly, calcite has the strongest
negati ve i nfl uence on phosphate fl otati on
recovery.
Figure 2 shows the results of plotting
recovery against mineralogy, expressed
as: log [Apati te - Total Carbonates/Total
silicates] for a three-month period. The
regression relationship is poor, with an
r2 of only 0,48 and standard error of
estimate of + 5,0 units. Regression
constants a = 16,5 and b = 42,0 where y = a + bx. However, for the purpose of moti
vating the· flotation plant to 'do
better', it served its purpose.
* +t+ ++ + +;:r ....
+ + +
+
+ -0- +
+
Da i ly
"" 713
+ + + ++ + ~++ + + + + +
>-er: w :> Cl u w er:
92
65
613
55
513
IS) en
Ln en
+ +
+
+
+
+ +
+
Ln IS) (\J
+
+ +
+
Ln (\J
+
+
LOG (APATITE - CARBONATES /S1 LI CATES)
+
Ln (YJ
+
+
+ ++ +
FIGURE 2. Relationship between flotation recovery and feed mineralogy
METALLURGY: FLOTATION MODELLING

flotation recoveries were compared with
the recovery predicted from the
regression of the previous 3 months,
which was later extended to 9 months, and
'gains' or 'losses' in concentrate tons
were calculated. A cumulative tally of
these 'tons' was kept.
Predicting flotation reagent consumption rates
Relationships between the feed parameters
Si nce a mi neral ogical regressi on model
for reagent consumption can only be as
effective as the data from which it is
derived, some criteria were defined
whereby optimal flotation efficiency
could be recognized, and the daily
average data were sifted accordingly.
In the first instance, all daily data
where feed to the flotation ci rcuits had
been interrupted for whatever reason,
i.e. the circulating and recirculating
middlings fractions had been lost, were
excl uded. Any testi ng of non-standard
flotation chemical reagents was excluded
as well as the instances where the resul-
tant concentrate grade fell outside
certain limits. Finally, the average
daily P20S content in the tail i ngs was
inspected and data excl uded where these
were outside acceptable limits. In this
TABLE 2. Correlation coefficient r for
+425 micron +300 micron
Ap3.tite - 0,37 - 0,35
Phlogopite 0,53 0,44
Lizardite - 0,25 - 0,24
Diopside - 0,06 - 0,12
Calcite 0,00 0,05
Dolanite 0,00 - 0,00
Forsterite - 0,22 - 0,15
+ 425 micron 0,93
+ 300 micron
- 212 micron
Volume
IMPROVED CONTROL OF PHOSPHATE FLOTATION
way, optimal flotation data and feed
mi neral ogy for 30 days were accumul ated,
a process requi ri ng a peri od of about 6 months. Linear regression analysis was
then carried out.
Results of this programme are given in
Tables 2 and 3. The mineralogy, grind
(grain size), volume and pulp density of
the i ncomi ng feed to the flotation pl ant
are correl ated with one another and with
reagent consumption rates and recovery.
Referring to Table 2, certain trends
are apparent:
(a) The positive correlation of the
proportion of apatite (headgrade),
wi th the volume of sl urry recei ved
was rather surprising, since greater
volumes passing through the flota
tion circuits usually reduce flota
tion retention times which should
adversely affect flotation recovery.
At the same time improved head
grades lead to improved recovery.
(b) An increase in the amount of phlogo
pite in the feed is indicative of a
coarser grind.
In Table 3, where the feed parameters
are correlated with flotation reagent
consumption rates and recovery, the
positive correl ation between the vol ume.
flotation feed parameters
-212 micron Volume PD
0,38 0,62 0,05
- 0,26 0,02 - 0,13
0,27 0,44 0,05
0,22 0,18 - 0,13
- 0,17 - 0,48 0,05
- 0,06 - 0,22 0,07
0,11 0,44 0,12
- 0,81 - 0,13 0,35
- 0,85 - 0,12 0,36
0,19 - 0,48
0,37
93

TABLE 3. Correlation coefficient r for feed parameters, flotation reagent
consumption rates (cc/rrdn) and recovery
Waterglass caustic soda
Apatite 0,57 - 0,18
Phlogopite - 0,40 - 0,29
Lizardite 0,33 - 0,14
Diopside - 0,01 - 0,05
Calcite - 0,37 0,22
Dolanite 0,26 0,23
Forsterite 0,62 - 0,04
+ 425 micron - 0,38 - 0,16
+ 300 micron - 0,36 - 0,25
- 212 rrdcron 0,20 0,05
Vollllre 0,27 0,12
Pu12 density 0,18 0,38
of sl urry received and flotation recovery
must be due to the association of higher
headgrades· wi th 1 arger vol umes noted from
Table 2.
The pi~oportions of the various minerals
in the feed also correlate to a greater
or lesser degree with reagent consumption
rates. For example, an increase in the
proportion of apatite in the feed in
creases with the watergl ass, gum and
fatty acid consumption rates, whereas the
consumption of polyglycol ether is signi
ficantly (r = -0,8) reduced, for optimal
flotation efficiency. For the mineral
calcite, the converse occurs with consump
tion of polyglycol ether tendi ng to
increase (r = 0,6) as the proportion of
calcite increases in the feed.
The effect of grain size (grind) is not
so marked, the minerals themselves proba
bly masking its influence. However,
coarser feed requires generally less
flotation reagent due to reduced surface
area, but recovery tends to decline.
The pulp density of the feed is mea
sured at the receivi ng station and is a
rough indication of tonnes of ore through-
94
Polyglycol
Gum Fatty acid ether Recovery
0,40 0,53 - 0,76 0,90
- 0,05 - 0,33 0,26 - 0,22
0,35 0,30 - 0,64 0,63
0,06 - 0,14 - 0,08 0,24
- 0,39 - 0,31 0,61 - 0,68
0,02 0,18 - 0,15 - 0,11
0,48 0,61 - 0,64 0,76
- 0,13 - 0,15 0,15 - 0,34
- 0,10 - 0,08 0,12 - 0,27
- 0,02 0, Ol - 0,08 0,22
0,33 0,15 - 0,45 0,56
0,35 0,26 - 0,27 0,16
put. Reagent consumption rates tend to
increase, except for polyglycol ether.
For the purpose of predicti ng flotation
reagent cansumption rates, it was decided
to limit the feed parameters to minera
logy and pulp density, since only these
data were available on an hourly basis.
The mineralogical reagent consumption regression model
In any mineral processing plant, par
ticularly flotation, processes and
procedures do not remain static for a
long period of time, for example new
flotation reagents may be used, the gri nd
may change, ore throughput may change, or
a desliming procedure may be introJuced.
It was thus thought essential to develop
a regression model with an in-built
continuous update. The model must also
incorporate as many practically measura
ble parameters as possible, al though some
do not correlate particularly well in the
present batch of data.
It is also vital to preserve credibi
lity with the process controller, and a
forecast of a recovery of 102%, or a nega
tive reagent consumption rate, is not
METALLURGY: FLOTATION MODELLING

TABLE 4. Linear regression constant b (in y ::f a + bx) for reagent
consumption rates multi21ied by 2ul2 density versus minerals
Pd x ViG Pd x CS Pd x Gum Pd x FA Pd x PGE
Apatite 1,54 - 0,159 2,49 0,343 - 0,148
Phlogopite - 0,823 - 0,199 - 0,289 - 0,165 0,035
Lizardite 1,78 - 0,242 4,30 0,384 - 0,247
Diopside - 0,084 - 0,073 0,362 - 0,132 - 0,026
Calcite - 0,437 0,092 - 1,04 - 0,089 0,054
Dolomite 0,777 0,220 0,157 0,131 - 0,030
Forsterite 2,41 - 0,049 4,34 0,565 - 0,173
Min. 16,3 - 1,53 27,5 3,33 - 1,37
easily forgiven or forgotten. The regres
sion model tends towards conservative and
average predictions rather than obviously
incorrect forecasts.
3. Slopes, i.e. b values in y = a + bx,
were divided by the value for apatite.
The regression model was calculated as
foll ows:
1. The determination of the daily average
reagent consumpti on rates adj usted for
variation in ore throughput was done
by multiplyi ng the daily average rea
gent consumpti on rate (i n cc/mi n) by
the pulp density. This figure of
reagent consumption, adjusted for pulp
density, is used in the rest of the
calculation.
2. Linear regression constants were
determined for each of the minerals
versus each reagent consumption rate,
separately.
The mineral regressions were combined
for each reagent consumption rate.
5. A new regression with
mi nera 1 s versus reagent
rate was determi ned,
the combined
consumption
from which
reagent consumption rates are then
predicted.
Table 4 gives the linear regression
constant b (in y = a + bx), for each of
the minerals separately, and for the
minerals combined as indicated above.
In Table 5 correlation coefficients are
given for the regression relationships of
Table 4. Comparing Tables 5 and 3, it
can be seen that the incl usion of pulp
density as a measure of incoming feed
~..BLE 5. Correlation coefficient r for pulp density multiplied by reagent
consumption rate versus minerals
Pd x ViG Pd x CS Pd x Gum Pd x FA Pd x PGE
Apatite 0,56 - 0,17 0,38 0,52 - 0,78
Phlogopite - 0,40 - 0,29 - 0,06 - 0,33 0,24
Lisardite 0,33 - 0,13 0,33 0,29 - 0,65
Diopside - 0,02 - 0,06 0,04 - 0,15 - 0,10
Calcite - 0,36 0,23 - 0,36 - 0,30 0,63
Dolomite 0,26 0,22 0,02 0,18 - 0,14
Forsterite 0,62 - 0,04 0,47 0,60 - 0,64
Min. 0,74 - 0,35 0,56 0,61 - 0,83
IMPROVED CONTROL OF PHOSPHATE FLOTATION 95

Q 0....
X
a: Q 0 U1
U H I-U1 :J a: U
96
70
60
Q 0....
x 50 U1 U1 a: --.J 19 r:::t:: W
40
I-a: 3:
30
20 ~ __ -L ____ ~ __ ~ ____ ~ __ ~ ____ L-__ ~ ____ ~ __ ~ ____ ~ __ ~ ____ ~ __ ~ ____ -L __
If)
25.0
20.0
15.0
10.0
en C\J
DAYS: A=ACTUAL P=PREDICTED FIGURE 3. Actual vs predicted consumption of waterglass
If)
C\J en C\J
5.0 ~ __ -L __ ~~ __ ~ __ ~ ____ ~ __ ~ ____ ~ __ ~ ____ ~ __ -L __ ~~ __ ~ __ ~ ____ ~_
If) en .... C\J
DAYS: A=ACTUAL P=PREDICTED
FIGURE 4. Actual vs predicted consumption of caustic soda
If)
C\J en C\J
METALLURGY: FLOTATION MODELLING

with the reagent consumption rate has not reduced the correlation coefficients ap
preciably, and in some cases has even improved them slightly. See, for example, the rel ationship between polyglycol ether
and the amount of calcite in the feed: r = 0,61 without pulp density, and r = 0,63 with pulp density.
From Table 5, the inclusion of all the minerals in the model, even those showing no correlation, for example, diopside,
where r varies between - 0,02 and - 0,15, has not weakened the overall regressi on relationship. The correlation between Min and reagent consumption rate multipl ied by pulp density is in every case
higher than for a single mineral on its
own. For example, the polyglycol ether multiplied by pulp density consumption rate versus apatite in the feed has an r
of - 0,78, but when all the minerals are combined, r is improved to - 0,83.
The equations for predicting reagent consumption rates reduce to the following form:
WG = [34,3 + 16,3 A - 0,870 P + 18,9 L -
0,88 Oi - 4,63 C + 8,22 00 + 25,4 F] PO-1
CS [11;5 - 1,53 A - 1,91 P - 2,33 L 0,702 Oi + 0,885 C + 2,11 00 -
0,471 FJ PO-1
G [141,8 + 27,5 A - 3,19 P + 47,6 L +
3,99 Oi - 11,5 C + 1,73 00 + 47,8 FJ PO-1
FA = [5,28 + 3,33 A - 1,60 P + 3,73 L -1,28 Oi - 0,866 C + 1,27 00 + 5,49 F] PO-1
PGE [7,14 - 1,37 A + 0,323 P - 2,29 L 0,241 Oi + 0,500 C - 0,278 00 -
1,60 FJPO-1
CS = Caustic soda x 10-3 cc/min G = Gum x 10-3 cc/min
FA Fatty acid x 10-3 cc/min
PGE = Polyglycol ether x 10-3 cc/min
A = Fluor-apatite % in feed P Phlogopite % in feed
L Lizardite % in feed
Oi Oiopside % in feed C = Calcite % in feed
00 = Oolomite % in feed F = Forsterite % in feed
and PO is pulp density measured in g/ml.
In Fi gures 3 to 7, predicted and actual consumption rates for the five flotation
reagents are shown for 30 observations.
Mineralogical regression model versus the method of multiple linear regressions
It is interesting to compare results
between the mineralogical regression
model with those obtai ned from the method of multiple linear regressions(5 on the
same series of data. Using multiple
1 inear regressions reagent consumption
rates reduce to the following equations:
WG = [-908,7 + 9,97 A + 9,19 P + 9,31 L +
10,05 Oi + 9,44 C + 9,80 00 + 11,1 FJ PO-1
CS [-41,2 - 0,20 A + 0,23 P + 1,16 L +
" 1,21 Oi + 0,65 C + 0,65 00 + 1,12 F] PO-1
G [-2 078 + 20,0 A + 23,0 P + 26,7 L +
22,9 Oi + 22,4 C + 21,7 00 + 28,8 F] PO-l
FA = [-106,5 + 1,30 A + 1,12 P + 1,10 L +
0,96 Oi + 1,10 C + 1,15 00 + 1,44 F] PO-1
PGE = [5,16 - 0,040 A + 0,026 P - 0,091 L + 0,053 Oi + 0,042 C - 0,017 00 ~
0,026 FJ PO-1
where WG = Waterglass (sodium silicate) x where abbreviations have the same meaning 10-3 cc/min as previously.
IMPROVED CONTROL OF PHOSPHATE FLOTATION 97

23121
21121
o 19121 CL
x
:L
~ 17121
15121
15.5
13.5
0 CL 1 1 . 5 X
0 H
U 9.5 a::
>-r-r- 7.5 a:: u..
5.5
C\J
DRYS: R=RCTURL P=PREDICTED FIGURE 5. Actual vs predicted consumption of gum
If)
C\J
3.5 ~--~--~~--~--~----~--~----~--~----~--~--~----~--~----~-If)
98
C\J
DRYS: R=RCTURL P=PREDICTED
FIGURE 6. Actual vs predicted consumption of fatty acid
If)
C\J en C\J
METALLURGY: FLOTATION MODELLING

'TIlliLE 6. Correlation coefficient r2 for the
two methods
Min. regression Multiple linear
:mcxiel regressions
Pd x W3 0,54 0,62
PD x CS 0,12 0,27
Pd x Gum 0,32 0,43
Pd x FA 0,37 0,46
Pd x PGE 0,69 0,72
Mean 0,41 0,50
In Table 6 the fit of the correlation
coefficient r2 for the mineralogical
regression model and the method of
multiple 1 i near regressions are compared.
On average, the multinle linear regres
sion method will give a prediction
fall i ng withi n one standard devi ation of
the actual reagent consumption rate, 50%
of the time, compared with only 41% for
the mineralogical regression model.
However, reagent consumption rates
7.50
r::l 6.75 0....
X
~ 6.00 W ::r: r-w --.J
5.25 0 U >---.J CJ 4.50
>---.J 0 0.... 3.75
TABLE 7. Standard error of estimate for
predicted reagent consumption rates
Min. regression Multiple linear
:mcxiel regressions
Pd x W3 6,97 7,14
Pd x CS 3,22 3,30
Pd x Gum 20,2 20,0
Pd x FA 1,97 2,07
Pd x PGE 0,40 0,42
Mean 6,55 6,59
predicted by the mineralogical regression
model are nearly identical to and margi n
ally more accurate than the method of
multiple linear regressions. Refer to
Table 7, where the standard error of
estimate for the two methods is givl n.
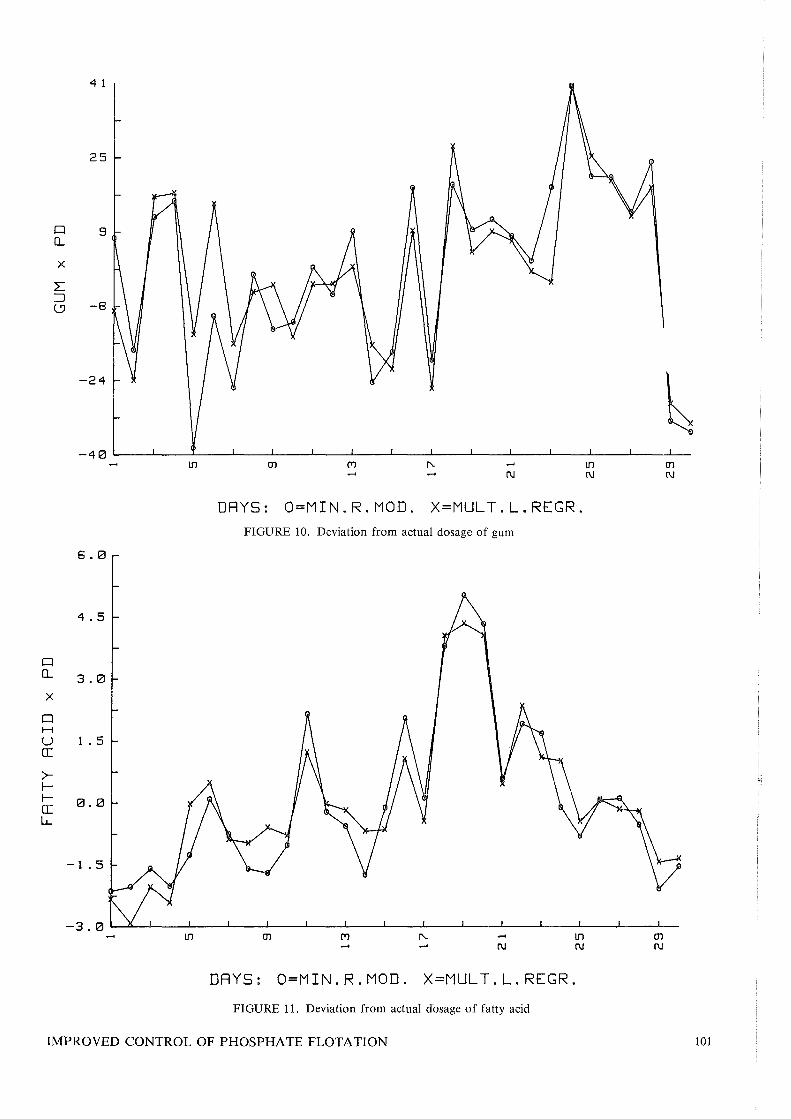
In Figures 8 to 12, the deviation
between actual reagent consumption rates
and the consumption rates predicted by
the two methods are plotted. In most
cases, the models deviate in the same
3.00 L-__ ~ __ -L __ ~ ____ L-__ J-__ -L __ ~ ____ L-__ -L __ ~ __ ~~ __ ~ __ ~ __ ~ __
1Il en 1Il en C\I C\I C\I
DRYS: R=RCTURL P=PREDICTED
FIGURE 7. Actual vs predicted consumption of polyglycol ether
IMPROVED CONTROL OF PHOSPHATE FLOTATION 99
~

15
9
Cl [L
X 3
(J) (J) ([
--1 l? ~ W
-4
I-([ ,3:
-10
-16
C\J
DRYS: O=MIN.R.MOD. X=MULT.L.REGR. FIGURE 8 Deviation from actual dosage of waterglass
8
Cl [L
x ([ 5 Cl 0 (J)
U H
ici I-(J)
:J ([ U
-2
C\J
DRYS: O=MIN.R'.MOD. X=MULT.L.REGR.
FIGURE 9. Deviation from actual dosage of caustic soda
100 METALLURGY: FLOTATION MODELLING
Q ll.
X
Q H U ([
>-I-I-([ l..J..
41
25
Q 9 ll.
x
L
CS -8
-24
-40 ~ __ ~ __ ~ ____ ~ __ ~ ____ ~ __ ~ __ ~ ____ ~ __ ~ __ ~~ __ ~ __ ~ ____ ~ __ -L __
tn
6.l2J
4.5
3.0
1 .5
0.l2J
-1.5
m CIJ
DRYS: O=MIN.R.MOD. X=MULT.L.REGR. FIGURE 10. Deviation from actual dosage of gum
CIJ
DRYS: O=MIN.R.MOD. X=MULT.L.REGR.
FIGURE 11. Deviation from actual dosage of fatty acid
tn CIJ
m CIJ
IMPROVED CONTROL OF PHOSPHATE FLOTATION 101

Q 0...
x
Et: W I r w ...J a u r ...J l?
r ...J' a 0...
r u Z W :=J 0 W Et: LL
W > H
r IT: ...J W ~
r z w U Et: W 0...
102
. 8
. 4
-0.0
-.4
-.8
-1.2 LI --~--~--~--~--~--~--~--~--~--~--~--~--~--~
30
24
18
12
6
01 C\J
DRYS: O=MIN.R.MOD. X=MULT.L.REGR. FIGURE 12, Deviation from actual dosage of polyglycol ether
1I1 C\J
01 C\J
o LL __ ~-L __ -L-L __ ~~~L-~-l __ ~~~~L-~~ __ ~=I~~ ('TJ IS) CD
FEED/TRILS
FIGURE 13. Before: Production increases P.R.F.
METALLURGY: FLOTATION MODELLING

direction for the same observation, which
indicates that factors other than feed
mineralogy, as such,' probably played a
rore.
Time has not been available to apply
the recently published method of
Hollaway(6 using residual regression
analysis. It is also not clear how the
automatic conti nuous update of the model
should be carried out.
Results using the regression model
Although the mineralogical regression
model as a whol e was accurate only 41% of
the time, this was still very much better
than nothing at all, as is shown by
results in the plant.
Figures 13 and 14 show the distribution
of the ratios of head to tails grade for
the period January to August 1985, i.e.
before the mineralogical regression model
was fully implemented, and for the
9-month period thereafter. Actual data
>-u Z
24 W =:J Cl W a: lI-
18 W > H I-a:: ~
12 W a: I-Z W U 6 a: W EL
f\J
for the pl ant were used and there is no
doubt that flotation control has improved
measurably. The mean head to tails grade
ratio has improved from 2,83 with a
va r i a ne e 0 f 0,47 to 3, 18 wit h a va r i a nc e
of 0,28.
Assumi ng an average head grade of 9%
P205, the improvement in relative reco
very may be calculated.
Recovery % = (v - u)k x 100
(k u)v
where v = head grade
u tailings grade
k concentrate grade
At head to tailings grade ratio of 2,83 -
Recovery = 70,8%. At head to tailings
grade ratio of 3,18 - Recovery = 74,3%
The difference is 3,5 or 5,0% relative.
FIGURE 14. After: Production increase P.R.F.
IMPROVED CONTROL OF PHOSPHATE FLOTATION 103

Summary and conclusions
Foskor utilizes a difficult froth
flotation process for the production of
rock phosphate. Five expensive chemical
reagents are used in the process.
By correlating the feed mineralogy with
recovery, it coul d be shown that the
flotation plant tends to lag behind in
adjusting reagent consumption rates
during periods of rapidly changing feed.
A simple mineralogical regression model
was devised in which the proportion of
each of the minerals in the feed was
correlated with flotation reagent con-
sumption rate.
combi ned and a
calculated for
The minerals were then
new linear regression
the prediction of
flotation reagent consumption rates.
Provi si on was made for the conti nuous
update of the model by using the most
recent acceptable 30 data lines.
Compared with the method of multiple
1 i near regressi ons, which retjul iAe more
computing facilities, r2 was poorer (0,41
versus 0,50), but the' mean standard error
of estimate for predicting flotation
reagent consumption rates was identical
at ~ 6,6 units.
Over a 9-month period, the appl ication
of the mineralogical regression model
lead to an improvement in flotation
recovery of 3,5% absolute or 5% relative,
compared with the previous 8 months.
Acknowledgements
The management of Foskor are thanked
for all owi n9 thi s paper to be submitted
for publication. Dr G.J. vd Linde's
help in critically reading the manuscript
104
is appreciated. Finally, if it was not
for the dedication of the samplers and
x-ray analysts to their task, or the
enthusiasm of the flotation metall urgist
mr P. Kotze in implementing reagent
addition forecasts, no results would have
been possible.
References
1. VAN DER LINDE, G.J. 'n Studie van die
Wisselwerking Tussen Reagense en Mine
rale by die Flottasie van Apatiet.
R.A.U. Johannesburg, Ph.D. Thesis,
1980.
2. BAR NES , D. E . Die Adsorpsie van
Natriumlinoleaat op Verdunni ngsmi ne
rale in Foskoriet en Pirokseniet.
R.A.U. Johannesburg, M.Sc. Thesis,
1983.
3 . KL UG , H. P . and ALEXANDER, L.E.
X-ray Diffraction procedures. Second
Edition. New York, John Wiley and
Sons, 1974. pp. 531 - 553.
4. CHUNG, F. H. A new X-ray diffraction
method for quantitative multi-compo-
nent analysis. In Advances in X-ray
Analysis, vol 17. Grant, C.L. ,
Barrett, C.S., Newkirk, J.B. and
Ruud, C.O. New York, Plenum Press,
1974. pp. 106 - 115.
5. SPIEGEL, M.R. Theory ana Problems of
6.
Statistics. New York, McGraw-Hill,
1972. pp. 217 - 282.
HOLLAWA Y , J. Optimi zi ng mi neral
processing operations.
vol. 155, 1986. pp.
Mining Mag.
382 - 387.
METALLURGY: FLOTATION MODELLING


![EffectofCapillaryWaterAbsorptiononElectricalResistivityof ... · 2021. 5. 3. · according to ASTM C1585 [31]; the effect of the coal gangue ceramsite on sorptivity of the matrix](https://static.fdocuments.us/doc/165x107/6135efbb0ad5d2067647b1fc/effectofcapillarywaterabsorptiononelectricalresistivityof-2021-5-3-according.jpg)